Embed Size (px)
Citation preview
Sana Brennan Region 4 ESC www.esc4.net [email protected] 713.744.4401
Permission to copy classroom-ready materials granted to attendees of this session.
© 2015 Region 4 Education Service Center All rights reserved.
Dot Plots, Grades 3-5
QR Code
For Handouts:
http://bit.ly/1aNWJGP
Want the latest buzz from Region 4 Mathematics?
Visit us online! http://bit.ly/1uklEvM
©20
13 T
exas
Edu
catio
n Ag
ency
. All
Rig
hts
Res
erve
d 20
13
Intr
oduc
tion
to th
e Re
vise
d M
athe
mat
ics T
EKS:
Ver
tical
Alig
nmen
t Cha
rt K
inde
rgar
ten
– Gr
ade
6 36
Kind
erga
rten
G
rade
1
Gra
de 2
G
rade
3
Gra
de 4
G
rade
5
Gra
de 6
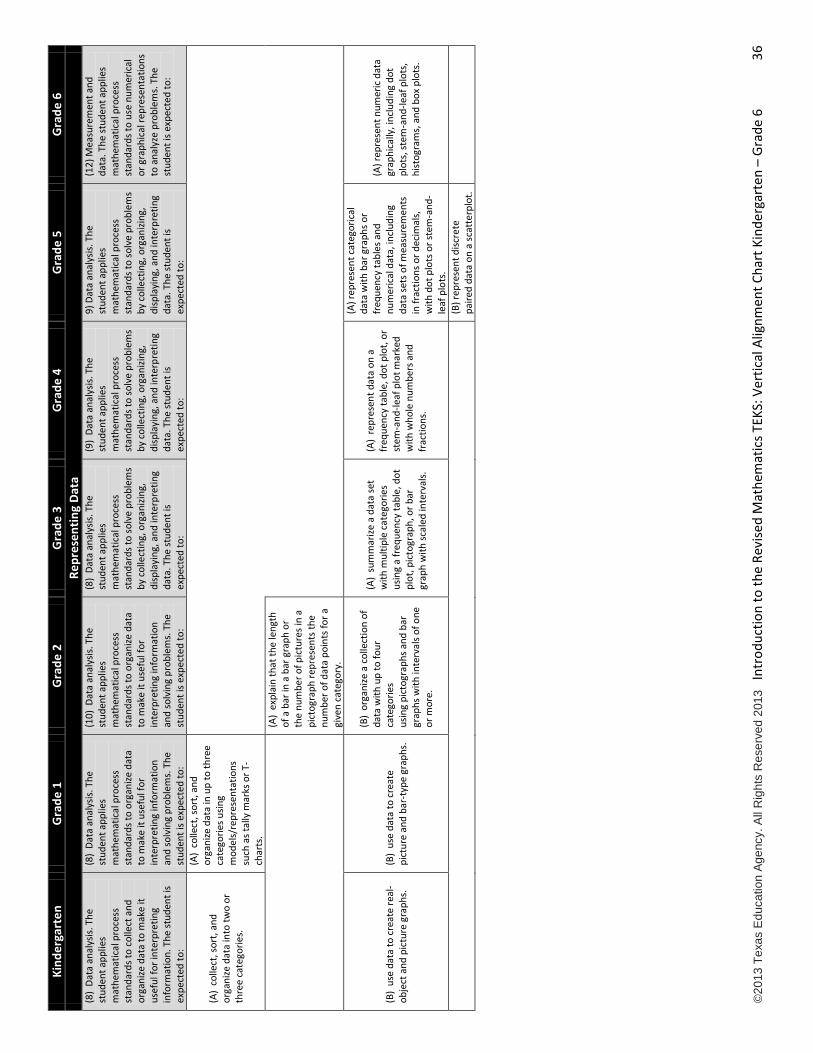
Re
pres
entin
g Da
ta
(8)
Data
ana
lysis
. The
st
uden
t app
lies
mat
hem
atic
al p
roce
ss
stan
dard
s to
colle
ct a
nd
orga
nize
dat
a to
mak
e it
usef
ul fo
r int
erpr
etin
g in
form
atio
n. T
he st
uden
t is
expe
cted
to:
(8)
Data
ana
lysis
. The
st
uden
t app
lies
mat
hem
atic
al p
roce
ss
stan
dard
s to
orga
nize
dat
a to
mak
e it
usef
ul fo
r in
terp
retin
g in
form
atio
n an
d so
lvin
g pr
oble
ms.
The
st
uden
t is e
xpec
ted
to:
(10)
Dat
a an
alys
is. T
he
stud
ent a
pplie
s m
athe
mat
ical
pro
cess
st
anda
rds t
o or
gani
ze d
ata
to m
ake
it us
eful
for
inte
rpre
ting
info
rmat
ion
and
solv
ing
prob
lem
s. T
he
stud
ent i
s exp
ecte
d to
:
(8)
Data
ana
lysis
. The
st
uden
t app
lies
mat
hem
atic
al p
roce
ss
stan
dard
s to
solv
e pr
oble
ms
by c
olle
ctin
g, o
rgan
izing
, di
spla
ying
, and
inte
rpre
ting
data
. The
stud
ent i
s ex
pect
ed to
:
(9)
Data
ana
lysis
. The
st
uden
t app
lies
mat
hem
atic
al p
roce
ss
stan
dard
s to
solv
e pr
oble
ms
by c
olle
ctin
g, o
rgan
izing
, di
spla
ying
, and
inte
rpre
ting
data
. The
stud
ent i
s ex
pect
ed to
:
9) D
ata
anal
ysis.
The
st
uden
t app
lies
mat
hem
atic
al p
roce
ss
stan
dard
s to
solv
e pr
oble
ms
by c
olle
ctin
g, o
rgan
izing
, di
spla
ying
, and
inte
rpre
ting
data
. The
stud
ent i
s ex
pect
ed to
:
(12)
Mea
sure
men
t and
da
ta. T
he st
uden
t app
lies
mat
hem
atic
al p
roce
ss
stan
dard
s to
use
num
eric
al
or g
raph
ical
repr
esen
tatio
ns
to a
naly
ze p
robl
ems.
The
st
uden
t is e
xpec
ted
to:
(A)
colle
ct, s
ort,
and
orga
nize
dat
a in
to tw
o or
th
ree
cate
gorie
s.
(A)
colle
ct, s
ort,
and
orga
nize
dat
a in
up
to th
ree
cate
gorie
s usin
g m
odel
s/re
pres
enta
tions
su
ch a
s tal
ly m
arks
or T
-ch
arts
.
(A)
expl
ain
that
the
leng
th
of a
bar
in a
bar
gra
ph o
r th
e nu
mbe
r of p
ictu
res i
n a
pict
ogra
ph re
pres
ents
the
num
ber o
f dat
a po
ints
for a
gi
ven
cate
gory
.
(B)
use
data
to c
reat
e re
al-
obje
ct a
nd p
ictu
re g
raph
s.
(B)
use
data
to c
reat
e pi
ctur
e an
d ba
r-ty
pe g
raph
s.
(B)
orga
nize
a c
olle
ctio
n of
da
ta w
ith u
p to
four
ca
tego
ries
usin
g pi
ctog
raph
s and
bar
gr
aphs
with
inte
rval
s of o
ne
or m
ore.
(A)
sum
mar
ize a
dat
a se
t w
ith m
ultip
le c
ateg
orie
s us
ing
a fr
eque
ncy
tabl
e, d
ot
plot
, pic
togr
aph,
or b
ar
grap
h w
ith sc
aled
inte
rval
s.
(A)
repr
esen
t dat
a on
a
freq
uenc
y ta
ble,
dot
plo
t, or
st
em-a
nd-le
af p
lot m
arke
d w
ith w
hole
num
bers
and
fr
actio
ns.
(A) r
epre
sent
cat
egor
ical
da
ta w
ith b
ar g
raph
s or
freq
uenc
y ta
bles
and
nu
mer
ical
dat
a, in
clud
ing
data
sets
of m
easu
rem
ents
in
frac
tions
or d
ecim
als,
w
ith d
ot p
lots
or s
tem
-and
-le
af p
lots
.
(A) r
epre
sent
num
eric
dat
a gr
aphi
cally
, inc
ludi
ng d
ot
plot
s, st
em-a
nd-le
af p
lots
, hi
stog
ram
s, a
nd b
ox p
lots
.
(B
) rep
rese
nt d
iscre
te
paire
d da
ta o
n a
scat
terp
lot.
©20
13 T
exas
Edu
catio
n Ag
ency
. All
Rig
hts
Res
erve
d 20
13
Intr
oduc
tion
to th
e Re
vise
d M
athe
mat
ics T
EKS:
Ver
tical
Alig
nmen
t Cha
rt K
inde
rgar
ten
– Gr
ade
6 37
Kind
erga
rten
G
rade
1
Gra
de 2
G
rade
3
Gra
de 4
G
rade
5
Gra
de 6
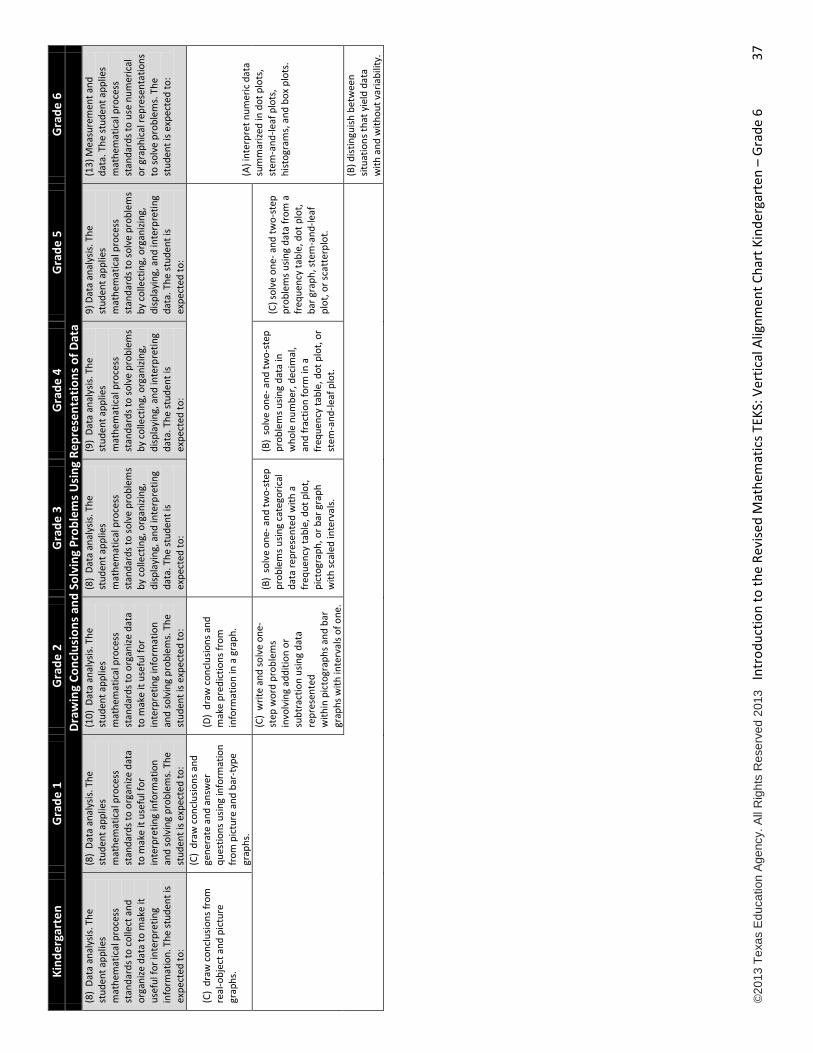
Dr
awin
g Co
nclu
sion
s and
Sol
ving
Pro
blem
s Usi
ng R
epre
sent
atio
ns o
f Dat
a (8
) Da
ta a
naly
sis. T
he
stud
ent a
pplie
s m
athe
mat
ical
pro
cess
st
anda
rds t
o co
llect
and
or
gani
ze d
ata
to m
ake
it us
eful
for i
nter
pret
ing
info
rmat
ion.
The
stud
ent i
s ex
pect
ed to
:
(8)
Data
ana
lysis
. The
st
uden
t app
lies
mat
hem
atic
al p
roce
ss
stan
dard
s to
orga
nize
dat
a to
mak
e it
usef
ul fo
r in
terp
retin
g in
form
atio
n an
d so
lvin
g pr
oble
ms.
The
st
uden
t is e
xpec
ted
to:
(10)
Dat
a an
alys
is. T
he
stud
ent a
pplie
s m
athe
mat
ical
pro
cess
st
anda
rds t
o or
gani
ze d
ata
to m
ake
it us
eful
for
inte
rpre
ting
info
rmat
ion
and
solv
ing
prob
lem
s. T
he
stud
ent i
s exp
ecte
d to
:
(8)
Data
ana
lysis
. The
st
uden
t app
lies
mat
hem
atic
al p
roce
ss
stan
dard
s to
solv
e pr
oble
ms
by c
olle
ctin
g, o
rgan
izing
, di
spla
ying
, and
inte
rpre
ting
data
. The
stud
ent i
s ex
pect
ed to
:
(9)
Data
ana
lysis
. The
st
uden
t app
lies
mat
hem
atic
al p
roce
ss
stan
dard
s to
solv
e pr
oble
ms
by c
olle
ctin
g, o
rgan
izing
, di
spla
ying
, and
inte
rpre
ting
data
. The
stud
ent i
s ex
pect
ed to
:
9) D
ata
anal
ysis.
The
st
uden
t app
lies
mat
hem
atic
al p
roce
ss
stan
dard
s to
solv
e pr
oble
ms
by c
olle
ctin
g, o
rgan
izing
, di
spla
ying
, and
inte
rpre
ting
data
. The
stud
ent i
s ex
pect
ed to
:
(13)
Mea
sure
men
t and
da
ta. T
he st
uden
t app
lies
mat
hem
atic
al p
roce
ss
stan
dard
s to
use
num
eric
al
or g
raph
ical
repr
esen
tatio
ns
to so
lve
prob
lem
s. T
he
stud
ent i
s exp
ecte
d to
:
(C)
draw
con
clus
ions
from
re
al-o
bjec
t and
pic
ture
gr
aphs
.
(C)
draw
con
clus
ions
and
ge
nera
te a
nd a
nsw
er
ques
tions
usin
g in
form
atio
n fr
om p
ictu
re a
nd b
ar-t
ype
grap
hs.
(D)
draw
con
clus
ions
and
m
ake
pred
ictio
ns fr
om
info
rmat
ion
in a
gra
ph.
(A) i
nter
pret
num
eric
dat
a su
mm
arize
d in
dot
plo
ts,
stem
-and
-leaf
plo
ts,
hist
ogra
ms,
and
box
plo
ts.
(C)
writ
e an
d so
lve
one-
step
wor
d pr
oble
ms
invo
lvin
g ad
ditio
n or
su
btra
ctio
n us
ing
data
re
pres
ente
d w
ithin
pic
togr
aphs
and
bar
gr
aphs
with
inte
rval
s of o
ne.
(B)
solv
e on
e- a
nd tw
o-st
ep
prob
lem
s usin
g ca
tego
rical
da
ta re
pres
ente
d w
ith a
fr
eque
ncy
tabl
e, d
ot p
lot,
pict
ogra
ph, o
r bar
gra
ph
with
scal
ed in
terv
als.
(B)
solv
e on
e- a
nd tw
o-st
ep
prob
lem
s usin
g da
ta in
w
hole
num
ber,
deci
mal
, an
d fr
actio
n fo
rm in
a
freq
uenc
y ta
ble,
dot
plo
t, or
st
em-a
nd-le
af p
lot.
(C) s
olve
one
- and
two-
step
pr
oble
ms u
sing
data
from
a
freq
uenc
y ta
ble,
dot
plo
t, ba
r gra
ph, s
tem
-and
-leaf
pl
ot, o
r sca
tter
plot
.
(B) d
istin
guish
bet
wee
n sit
uatio
ns th
at y
ield
dat
a w
ith a
nd w
ithou
t var
iabi
lity.
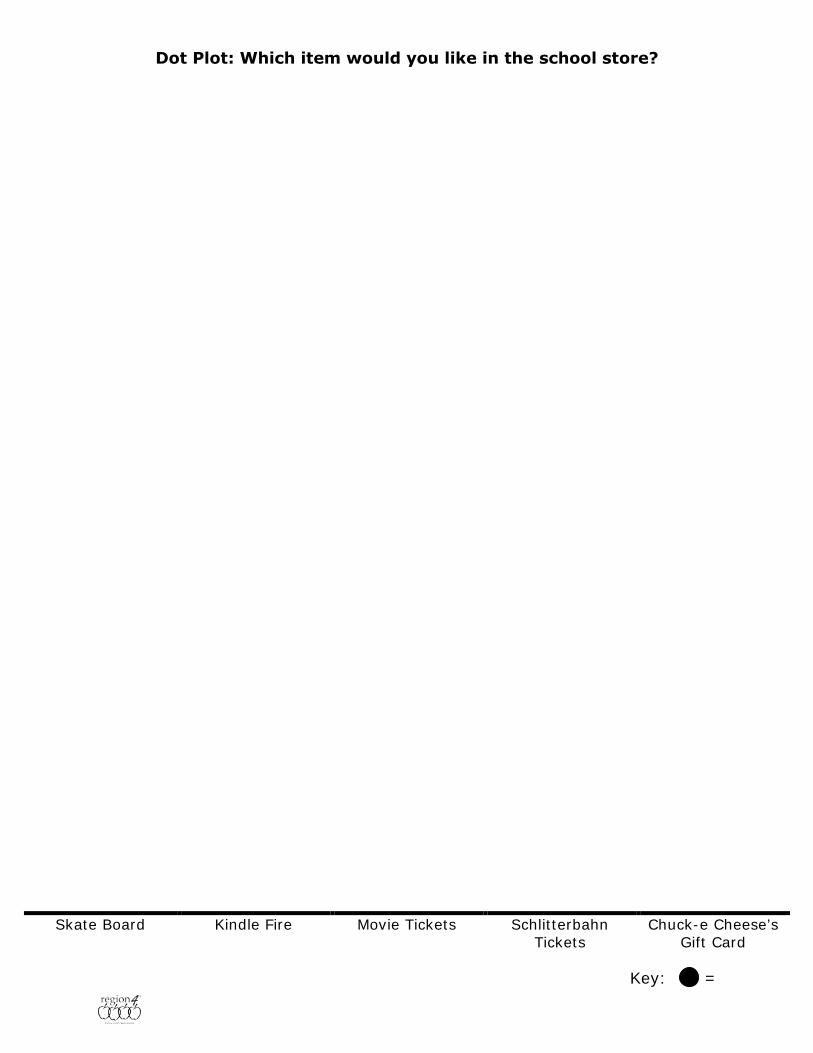
Dot Plot: Which item would you like in the school store?
Skate Board Kindle Fire Movie Tickets Schlitterbahn
Tickets Chuck-e Cheese’s
Gift Card
Key: =
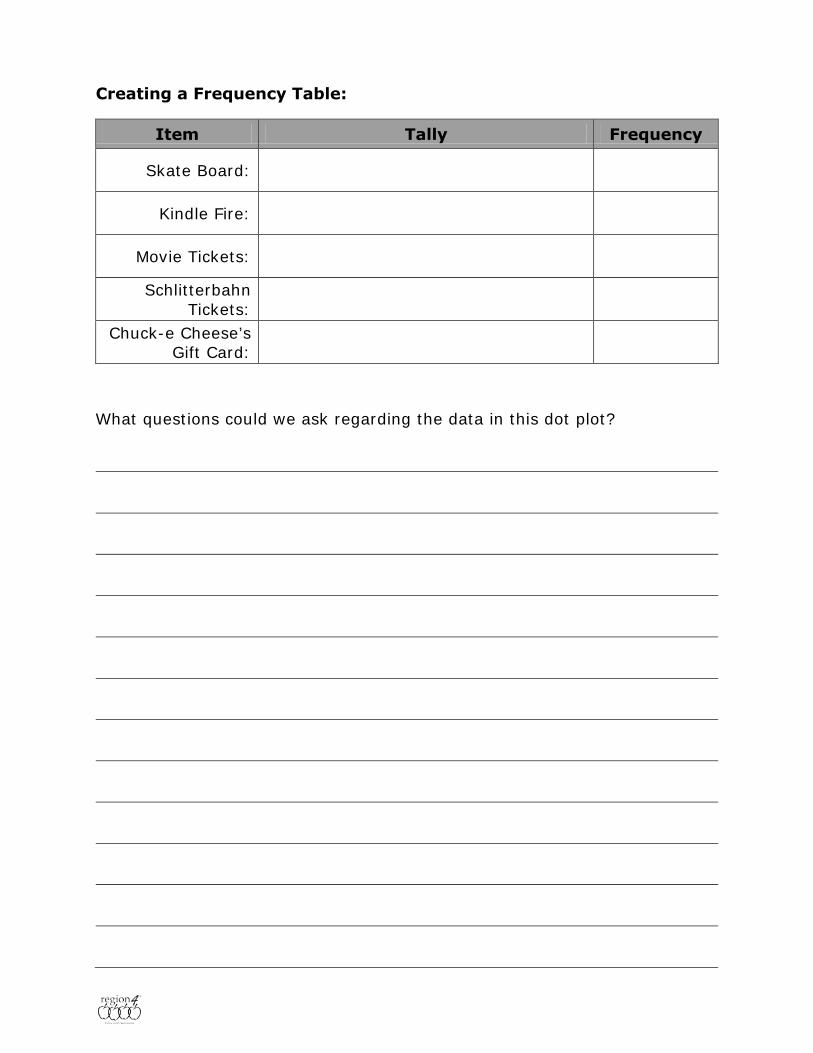
Creating a Frequency Table:
Item Tally Frequency
Skate Board:
Kindle Fire:
Movie Tickets:
Schlitterbahn Tickets:
Chuck-e Cheese’s Gift Card:
What questions could we ask regarding the data in this dot plot?
Skate Board
Kindle Fire
Movie Tickets
Schlitterbahn Tickets

Chuck-E-Cheese’s
Gift Card
Student Name: _____________________________ Date: ________________
© Region 4 Education Service Center Engaging Mathematics, Volume II: Grade 3 All rights reserved. Preproduction Copy
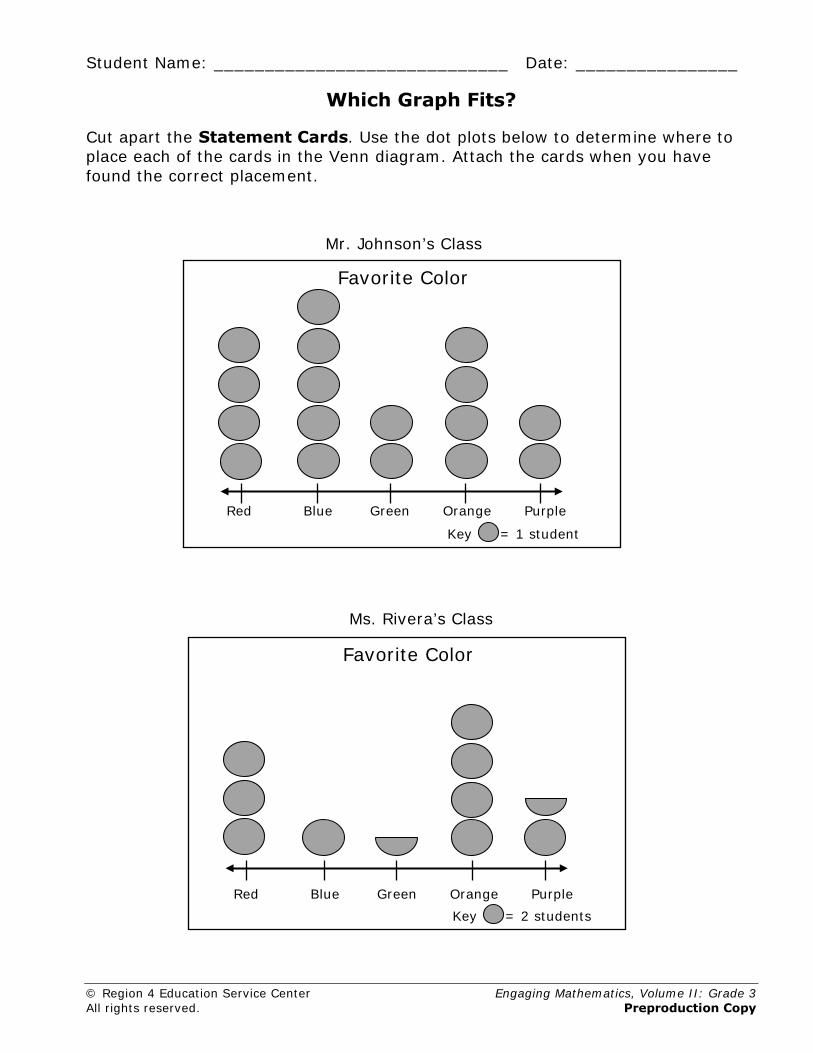
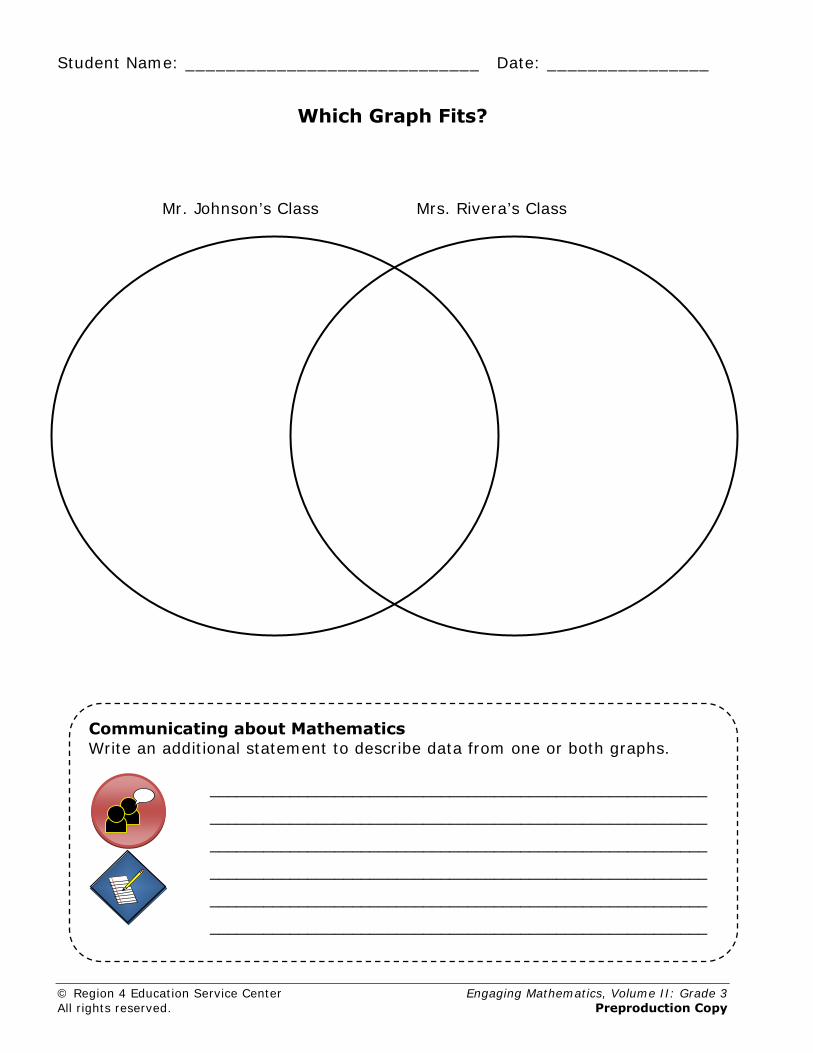
Which Graph Fits? Cut apart the Statement Cards. Use the dot plots below to determine where to place each of the cards in the Venn diagram. Attach the cards when you have found the correct placement. Mr. Johnson’s Class
Ms. Rivera’s Class
Key = 1 student
Favorite Color
Red Blue Green Orange Purple
Key = 2 students
Favorite Color
Red Blue Green Orange Purple
Student Name: _____________________________ Date: ________________
© Region 4 Education Service Center Engaging Mathematics, Volume II: Grade 3 All rights reserved. Preproduction Copy
Which Graph Fits?
Communicating about Mathematics Write an additional statement to describe data from one or both graphs.
________________________________________________________
________________________________________________________
________________________________________________________
________________________________________________________
________________________________________________________
________________________________________________________
Mr. Johnson’s Class Mrs. Rivera’s Class
© Region 4 Education Service Center Engaging Mathematics, Volume II: Grade 3 All rights reserved. Preproduction Copy
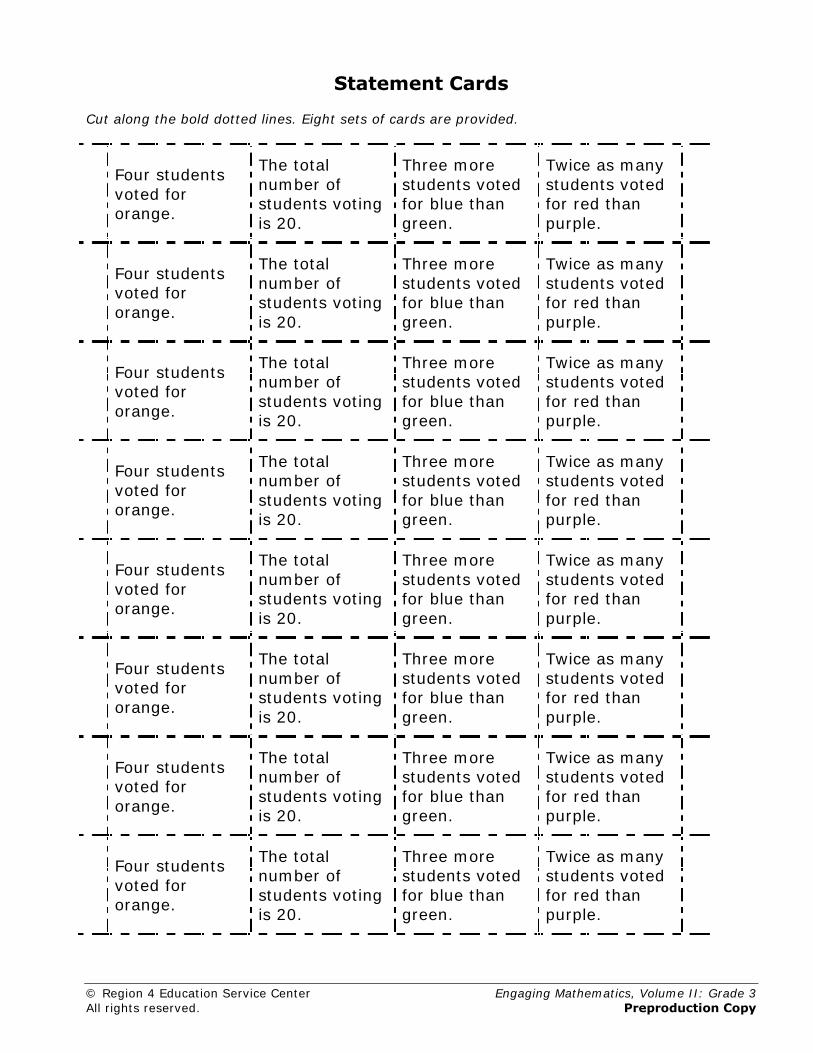
Statement Cards Cut along the bold dotted lines. Eight sets of cards are provided.
Four students voted for orange.
The total number of students voting is 20.
Three more students voted for blue than green.
Twice as many students voted for red than purple.
Four students voted for orange.
The total number of students voting is 20.
Three more students voted for blue than green.
Twice as many students voted for red than purple.
Four students voted for orange.
The total number of students voting is 20.
Three more students voted for blue than green.
Twice as many students voted for red than purple.
Four students voted for orange.
The total number of students voting is 20.
Three more students voted for blue than green.
Twice as many students voted for red than purple.
Four students voted for orange.
The total number of students voting is 20.
Three more students voted for blue than green.
Twice as many students voted for red than purple.
Four students voted for orange.
The total number of students voting is 20.
Three more students voted for blue than green.
Twice as many students voted for red than purple.
Four students voted for orange.
The total number of students voting is 20.
Three more students voted for blue than green.
Twice as many students voted for red than purple.
Four students voted for orange.
The total number of students voting is 20.
Three more students voted for blue than green.
Twice as many students voted for red than purple.
Student Name: _____________________________ Date: ________________
© Region 4 Education Service Center Engaging Mathematics, Volume II: Grade 3 All rights reserved. Preproduction Copy
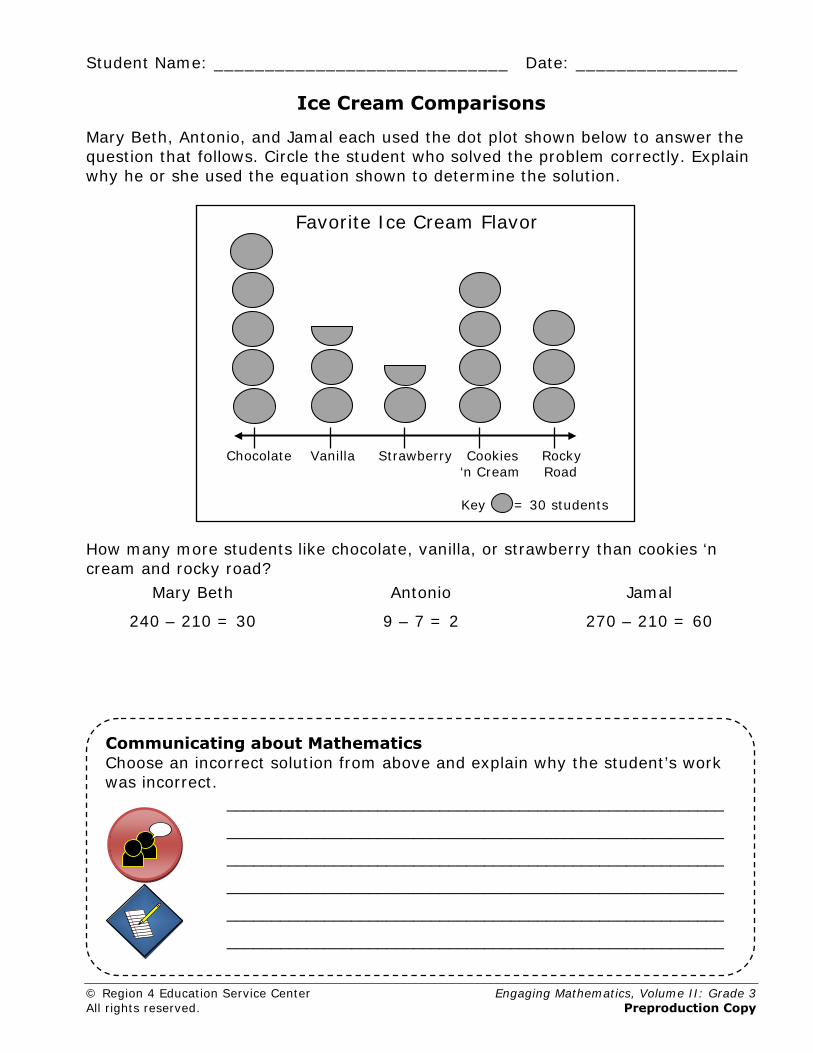
Ice Cream Comparisons Mary Beth, Antonio, and Jamal each used the dot plot shown below to answer the question that follows. Circle the student who solved the problem correctly. Explain why he or she used the equation shown to determine the solution.
How many more students like chocolate, vanilla, or strawberry than cookies ‘n cream and rocky road?
Mary Beth Antonio Jamal
240 – 210 = 30 9 – 7 = 2 270 – 210 = 60
Key = 30 students
Favorite Ice Cream Flavor
Chocolate Vanilla Strawberry Cookies Rocky ‘n Cream Road
Communicating about Mathematics Choose an incorrect solution from above and explain why the student’s work was incorrect.
________________________________________________________
________________________________________________________
________________________________________________________
________________________________________________________
________________________________________________________
________________________________________________________
Student Name: _____________________________ Date: ________________
© Region 4 Education Service Center Grade 4 All rights reserved.
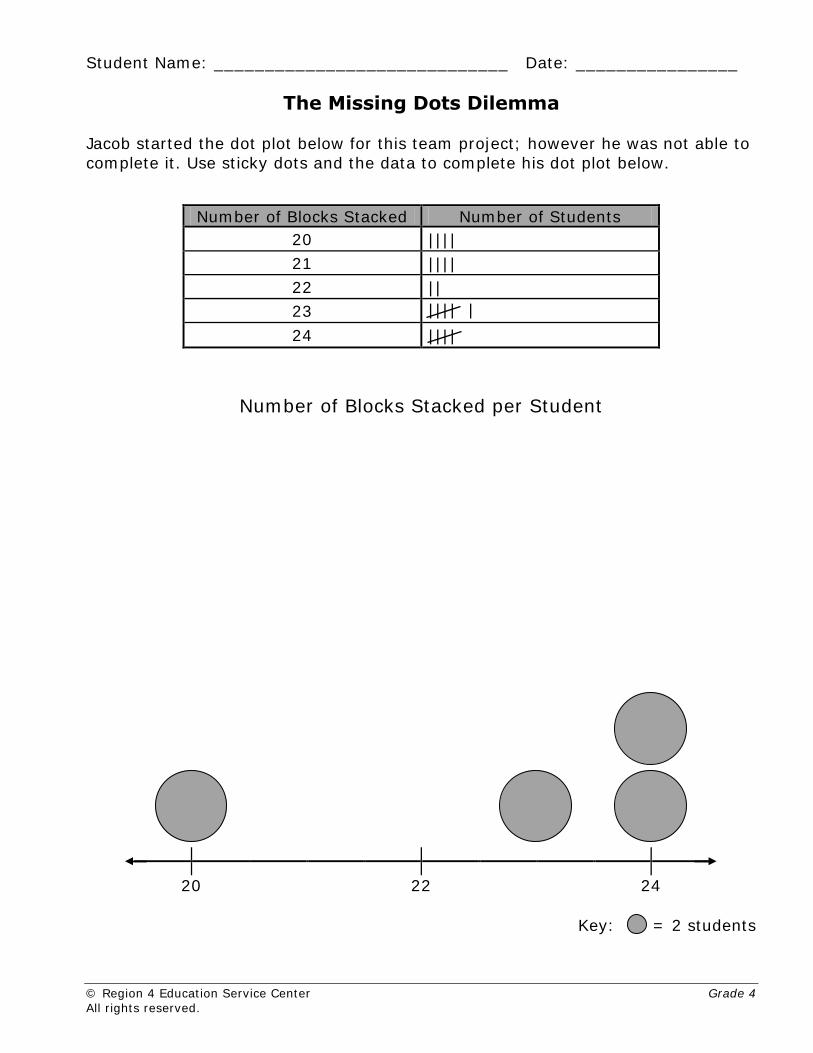
The Missing Dots Dilemma Jacob started the dot plot below for this team project; however he was not able to complete it. Use sticky dots and the data to complete his dot plot below.
Number of Blocks Stacked Number of Students 20 |||| 21 |||| 22 || 23 |||| | 24 ||||
Number of Blocks Stacked per Student
20 22 24
Key: = 2 students
Student Name: _____________________________ Date: ________________
© Region 4 Education Service Center Grade 4 All rights reserved.
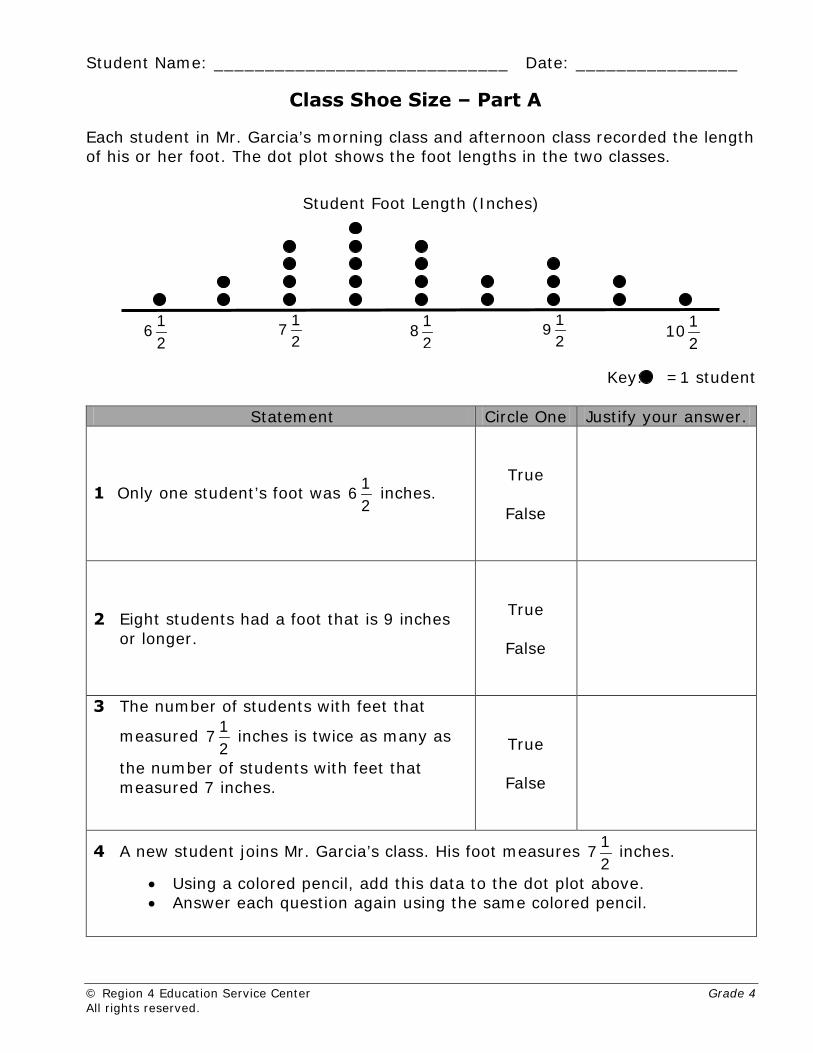
Class Shoe Size – Part A Each student in Mr. Garcia’s morning class and afternoon class recorded the length of his or her foot. The dot plot shows the foot lengths in the two classes.
Student Foot Length (Inches)
Key: =1 student
Statement Circle One Justify your answer.
1 Only one student’s foot was 162
inches. True
False
2 Eight students had a foot that is 9 inches or longer.
True
False
3 The number of students with feet that
measured 172
inches is twice as many as
the number of students with feet that measured 7 inches.
True
False
4 A new student joins Mr. Garcia’s class. His foot measures 172
inches.
• Using a colored pencil, add this data to the dot plot above. • Answer each question again using the same colored pencil.
162
1102
172
192
182
Student Name: _____________________________ Date: ________________
© Region 4 Education Service Center Grade 4 All rights reserved.
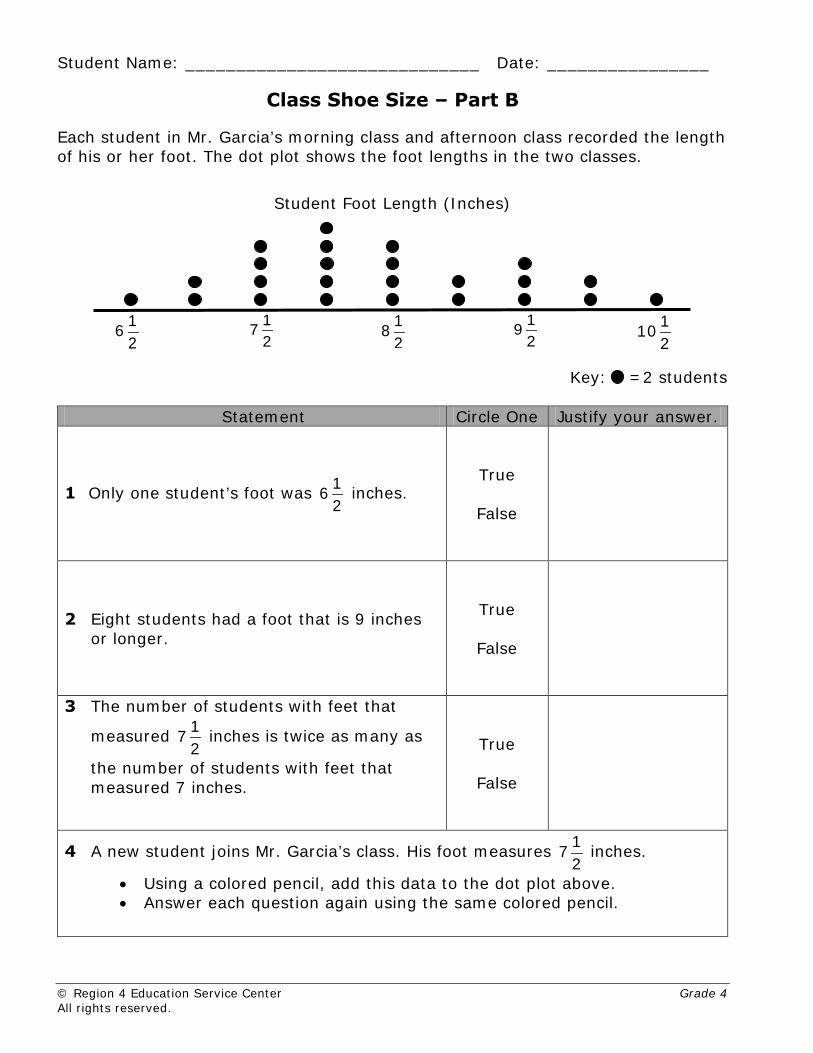
Class Shoe Size – Part B Each student in Mr. Garcia’s morning class and afternoon class recorded the length of his or her foot. The dot plot shows the foot lengths in the two classes.
Student Foot Length (Inches)
Key: =2 students
Statement Circle One Justify your answer.
1 Only one student’s foot was 162
inches. True
False
2 Eight students had a foot that is 9 inches or longer.
True
False
3 The number of students with feet that
measured 172
inches is twice as many as
the number of students with feet that measured 7 inches.
True
False
4 A new student joins Mr. Garcia’s class. His foot measures 172
inches.
• Using a colored pencil, add this data to the dot plot above. • Answer each question again using the same colored pencil.
162
1102
172
192
182
Student Name: _____________________________ Date: ________________
© Region 4 Education Service Center Grade 5 All rights reserved.
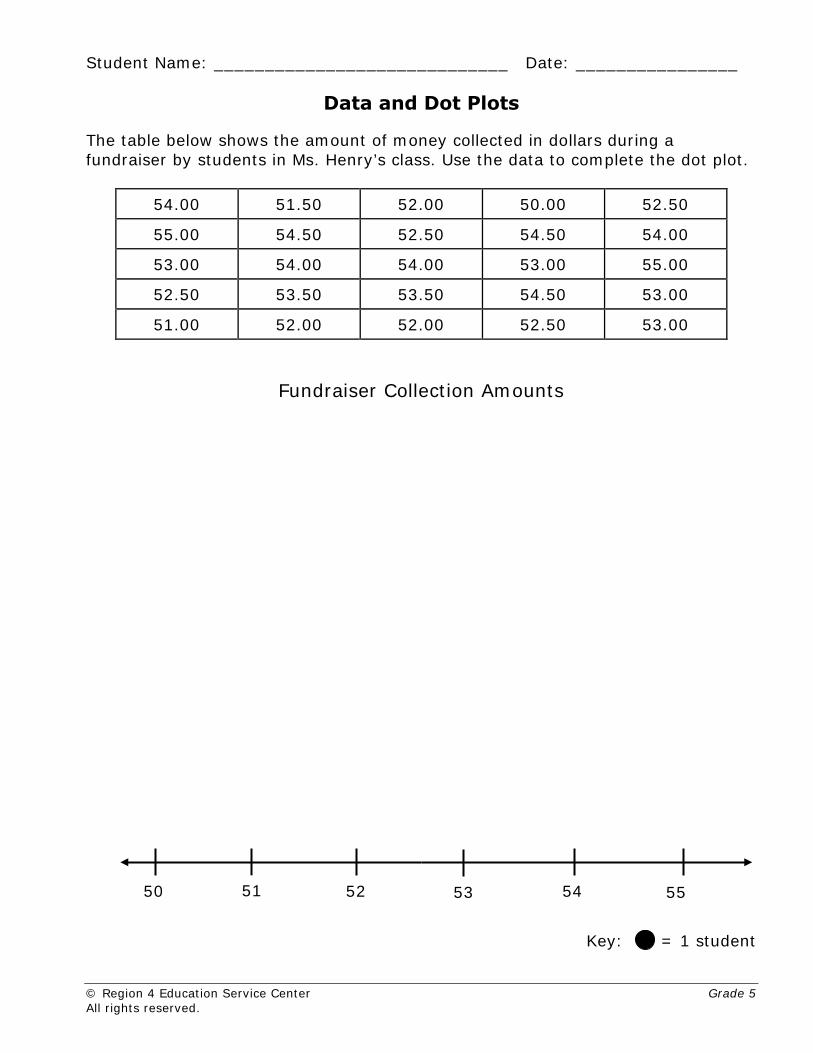
Data and Dot Plots The table below shows the amount of money collected in dollars during a fundraiser by students in Ms. Henry’s class. Use the data to complete the dot plot.
54.00 51.50 52.00 50.00 52.50
55.00 54.50 52.50 54.50 54.00
53.00 54.00 54.00 53.00 55.00
52.50 53.50 53.50 54.50 53.00
51.00 52.00 52.00 52.50 53.00
Fundraiser Collection Amounts
Key: = 1 student
50 51 52 53 54 55
Student Name: _____________________________ Date: ________________
© Region 4 Education Service Center Grade 5 All rights reserved.
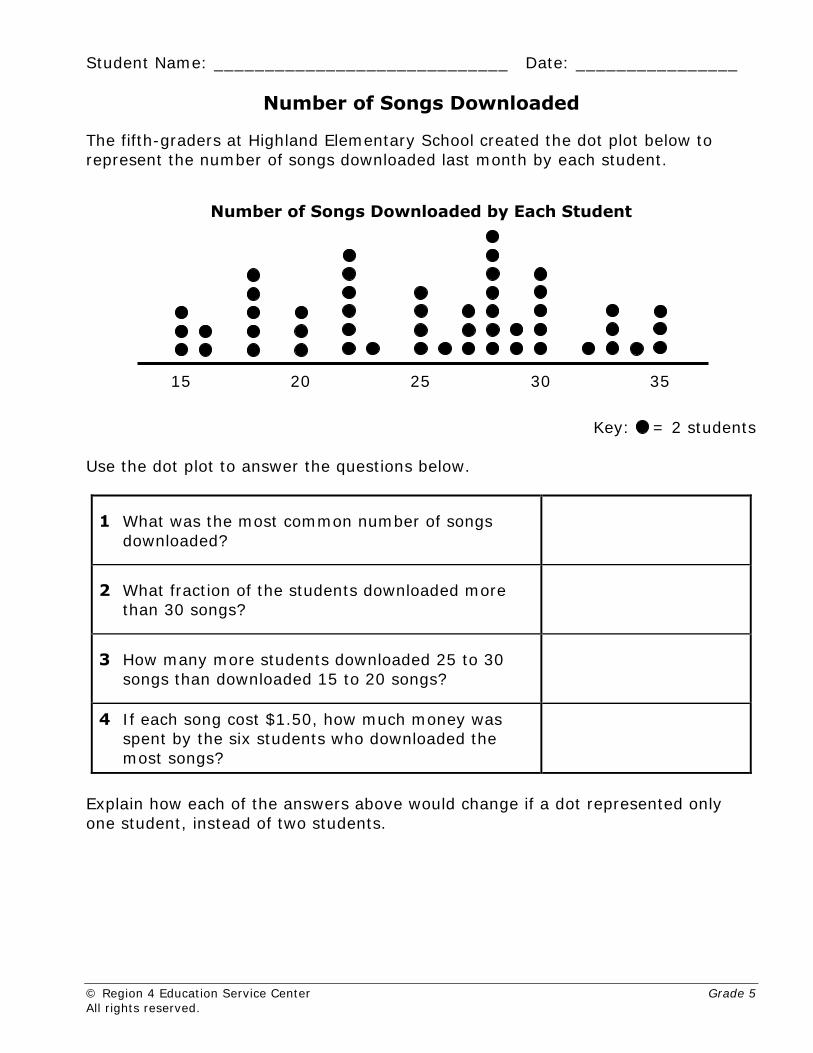
Number of Songs Downloaded The fifth-graders at Highland Elementary School created the dot plot below to represent the number of songs downloaded last month by each student.
Number of Songs Downloaded by Each Student
Key: = 2 students Use the dot plot to answer the questions below.
1 What was the most common number of songs downloaded?
2 What fraction of the students downloaded more than 30 songs?
3 How many more students downloaded 25 to 30 songs than downloaded 15 to 20 songs?
4 If each song cost $1.50, how much money was spent by the six students who downloaded the most songs?
Explain how each of the answers above would change if a dot represented only one student, instead of two students.
15
20
25
30
35