Embed Size (px)
Citation preview
DOSSIER
Web site: http://statepi.jhsph.edu/macs/macs.htmlPrepared by CAMACS
Fax: 410-955-7587
May 2011
The MACS is funded by the National Institute of Allergy and Infectious Diseases, with additional supplemental funding from the National Cancer Institute and the National Heart, Lung and Blood Institute. UO1-AI-35042, UL1-RR025005, UO1-AI-35043, UO1-AI-35039, UO1-AI-35040, UO1-AI-35041.
MACS FoundingPrincipal Investigators
Sites:
Baltimore, MD - Frank Polk
Chicago, IL - John Phair
Los Angeles, CA - Roger Detels
Pittsburgh, PA - Charles Rinaldo
Data Coordinating Center
Data Center – Alvaro Muñoz
November 2004
MACS Sites andPrincipal Investigators
Sites:• Baltimore, MD (J. Margolick)• Chicago, IL (J. Phair, S. Wolinsky)• Los Angeles, CA (R. Detels, O. Martinez-
Maza)• Pittsburgh (C. Rinaldo, L. Kingsley)
Data Coordinating Center (CAMACS):• Baltimore, MD (L. Jacobson, A. Muñoz)
November 2004
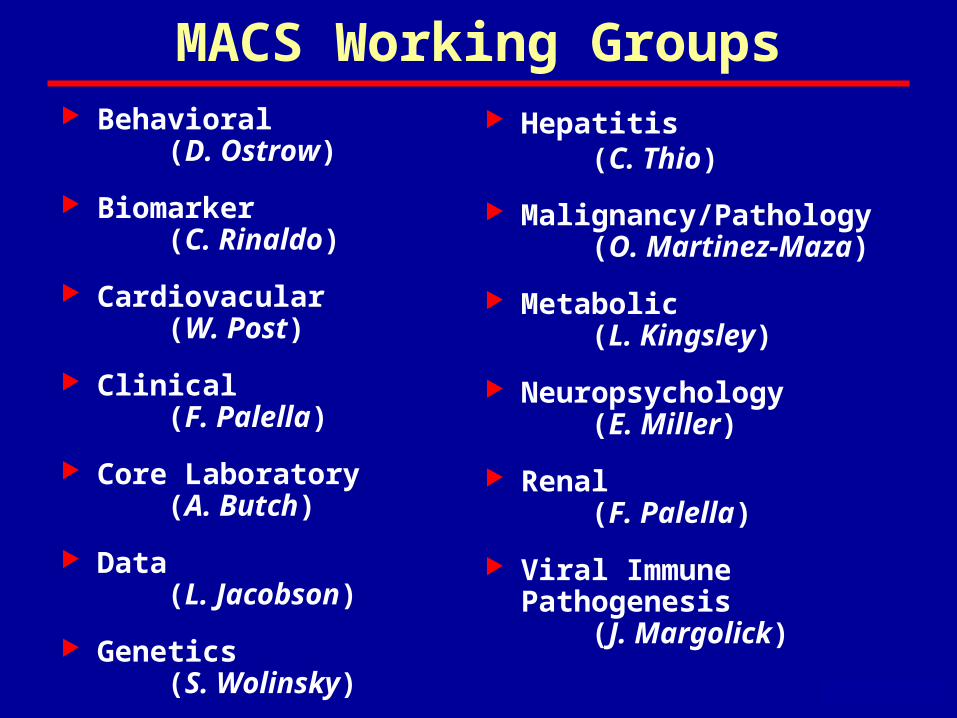
MACS Working Groups Behavioral
(D. Ostrow)
Biomarker (C. Rinaldo)
Cardiovacular (W. Post)
Clinical (F. Palella)
Core Laboratory (A. Butch)
Data (L. Jacobson)
Genetics (S. Wolinsky) August 2010
Hepatitis (C. Thio)
Malignancy/Pathology (O. Martinez-Maza)
Metabolic (L. Kingsley)
Neuropsychology (E. Miller)
Renal (F. Palella)
Viral Immune Pathogenesis (J. Margolick)
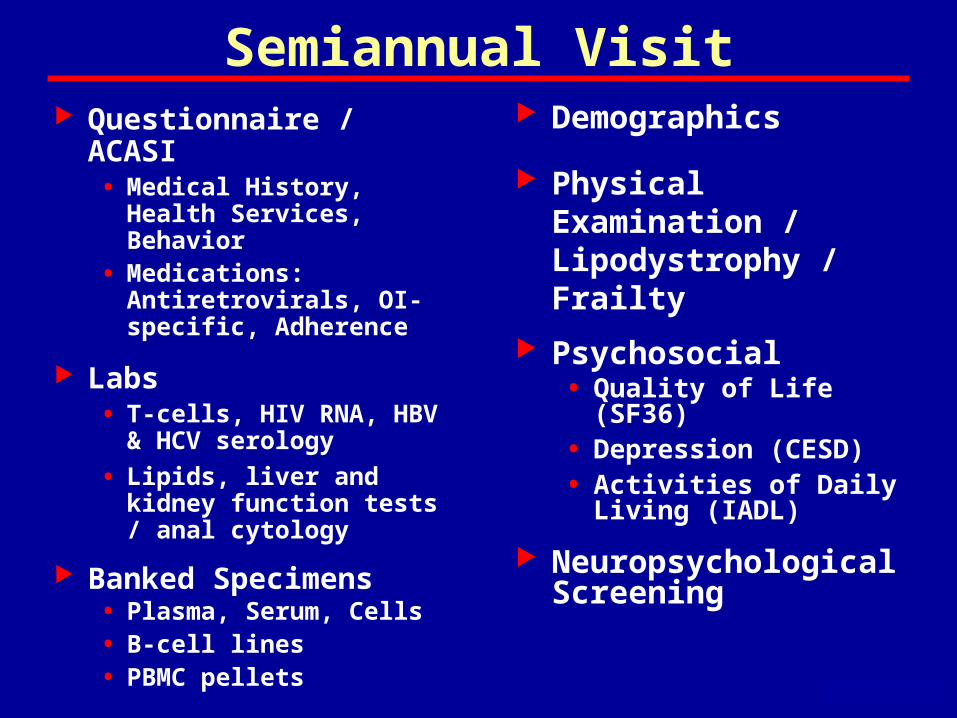
Semiannual Visit Questionnaire / ACASI
• Medical History, Health Services, Behavior
• Medications: Antiretrovirals, OI-specific, Adherence
Labs• T-cells, HIV RNA, HBV &
HCV serology
• Lipids, liver and kidney function tests / anal cytology
Banked Specimens• Plasma, Serum, Cells• B-cell lines• PBMC pellets
May 2009
Demographics
Physical Examination / Lipodystrophy / Frailty
Psychosocial • Quality of Life (SF36)• Depression (CESD)• Activities of Daily Living
(IADL)
Neuropsychological Screening
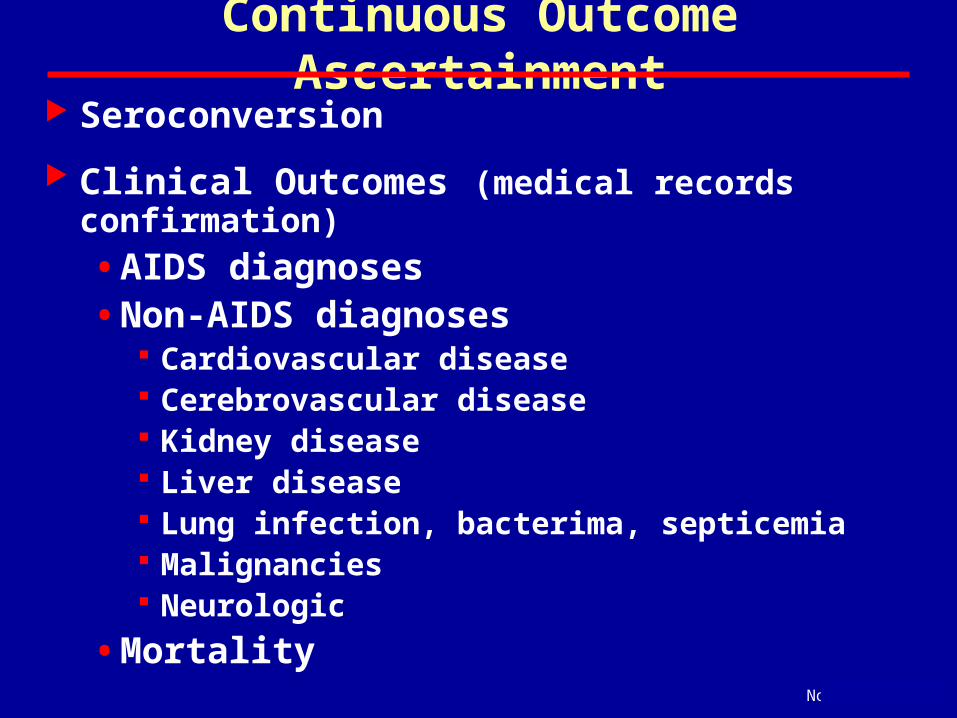
Continuous Outcome Ascertainment Seroconversion
Clinical Outcomes (medical records confirmation)
• AIDS diagnoses• Non-AIDS diagnoses
Cardiovascular disease Cerebrovascular disease Kidney disease Liver disease Lung infection, bacterima, septicemia Malignancies Neurologic
• Mortality
November 2004
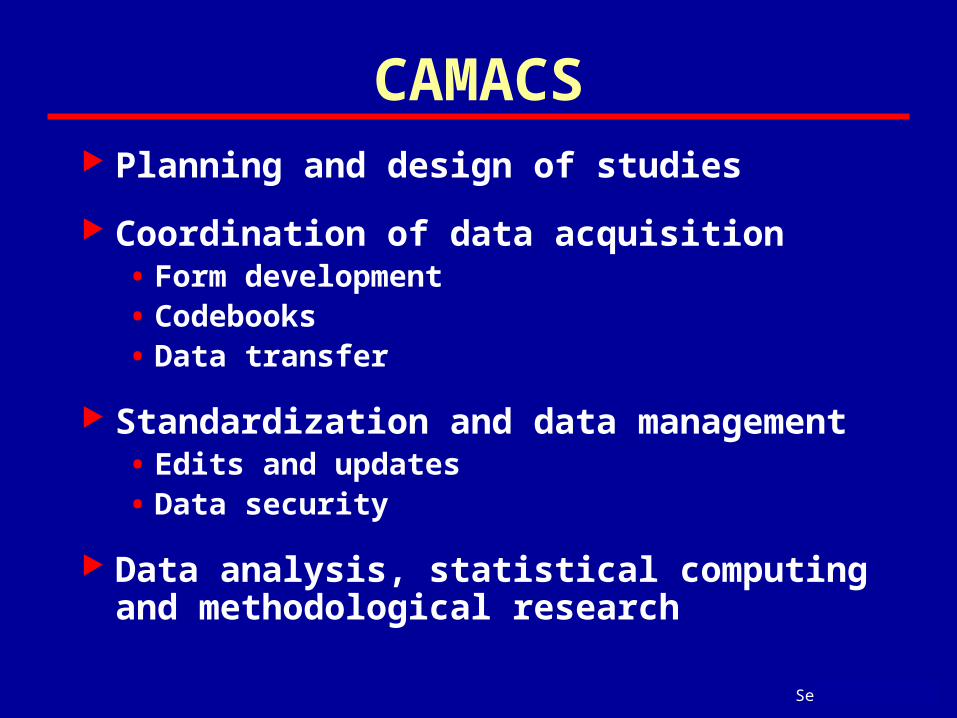
CAMACS Planning and design of studies
Coordination of data acquisition• Form development• Codebooks• Data transfer
Standardization and data management• Edits and updates• Data security
Data analysis, statistical computing and methodological research
September 1995
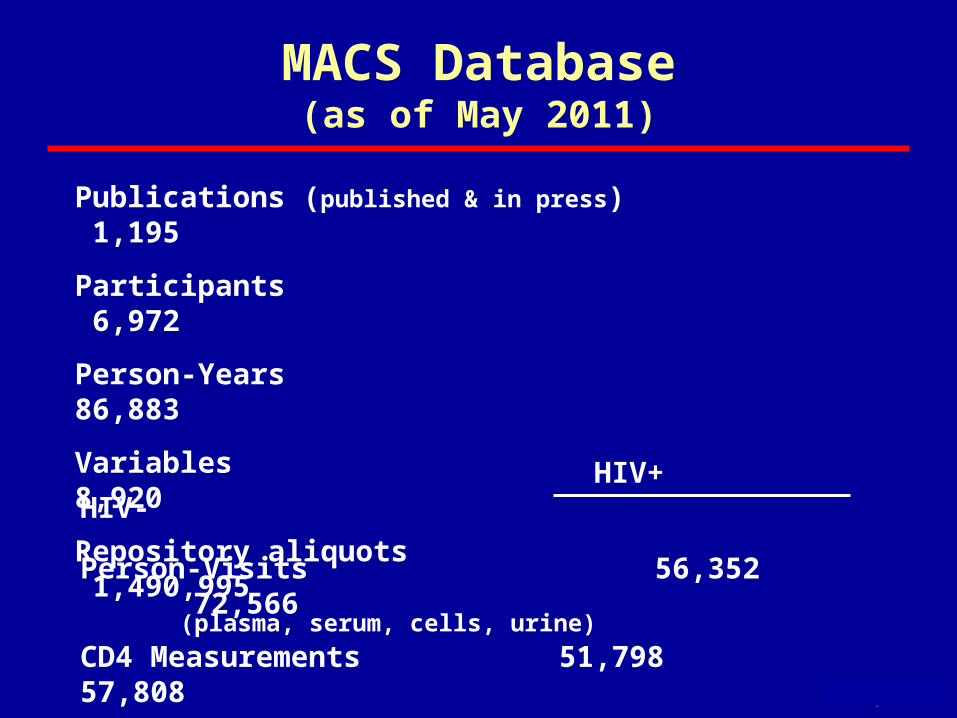
MACS Database(as of May 2011)
May 2011
Publications (published & in press) 1,195
Participants 6,972
Person-Years 86,883
Variables 8,920
Repository aliquots 1,490,995 (plasma, serum, cells, urine)
HIV+ HIV-
Person-Visits 56,352 72,566
CD4 Measurements 51,798 57,808
HIV RNA Measurements 34,149 1,206
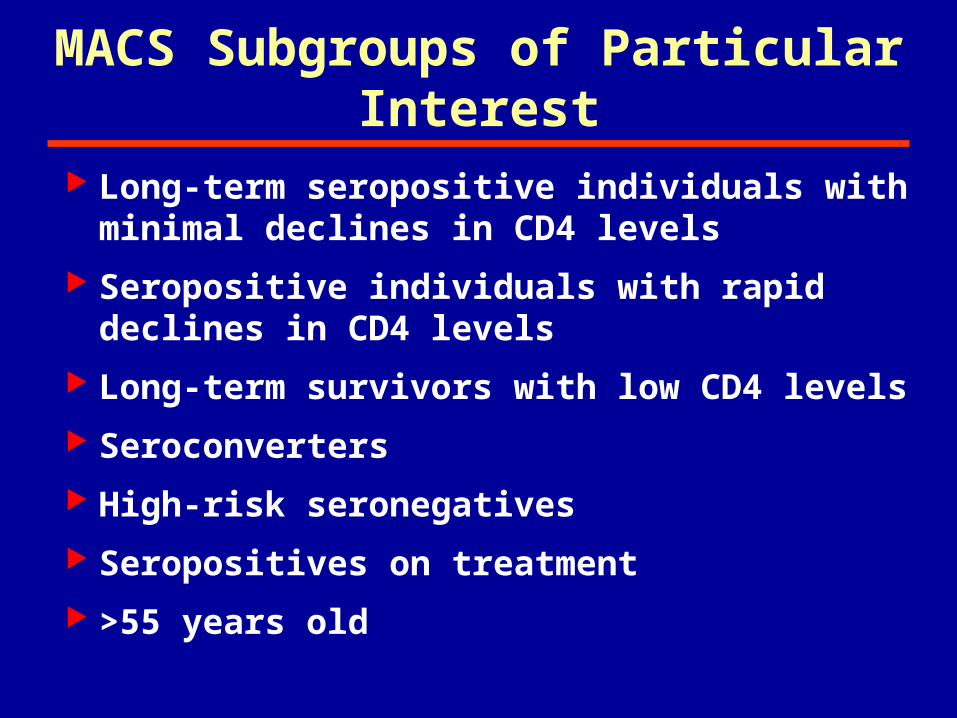
MACS Subgroups of Particular Interest
Long-term seropositive individuals with minimal declines in CD4 levels
Seropositive individuals with rapid declines in CD4 levels
Long-term survivors with low CD4 levels
Seroconverters
High-risk seronegatives
Seropositives on treatment
>55 years old
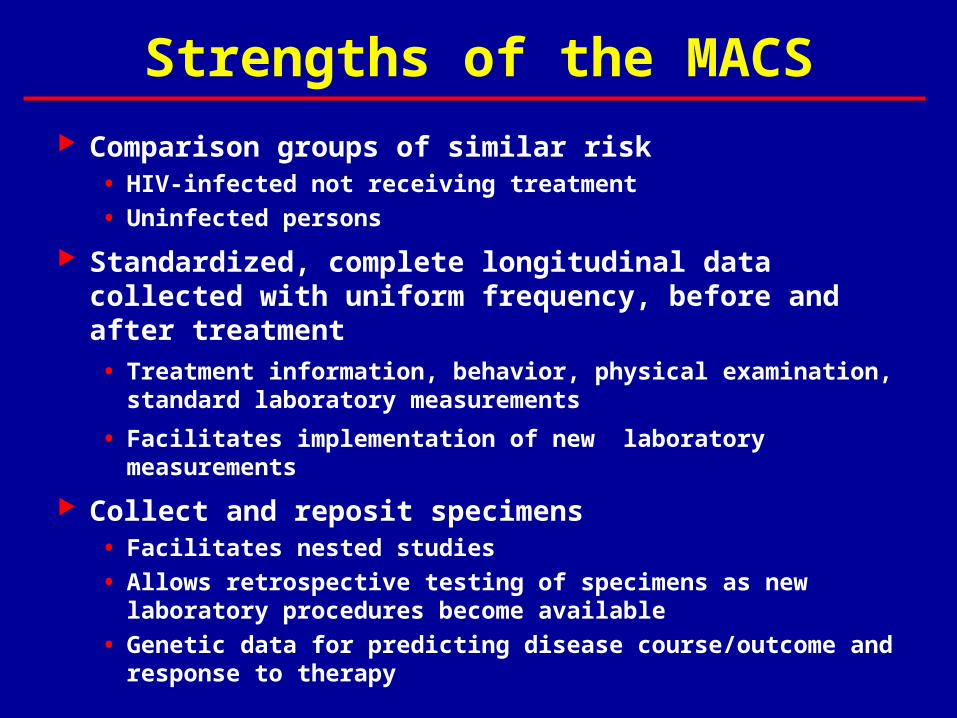
Strengths of the MACS
Comparison groups of similar risk• HIV-infected not receiving treatment
• Uninfected persons
Standardized, complete longitudinal data collected with uniform frequency, before and after treatment
• Treatment information, behavior, physical examination, standard laboratory measurements
• Facilitates implementation of new laboratory measurements
Collect and reposit specimens• Facilitates nested studies
• Allows retrospective testing of specimens as new laboratory procedures become available
• Genetic data for predicting disease course/outcome and response to therapy
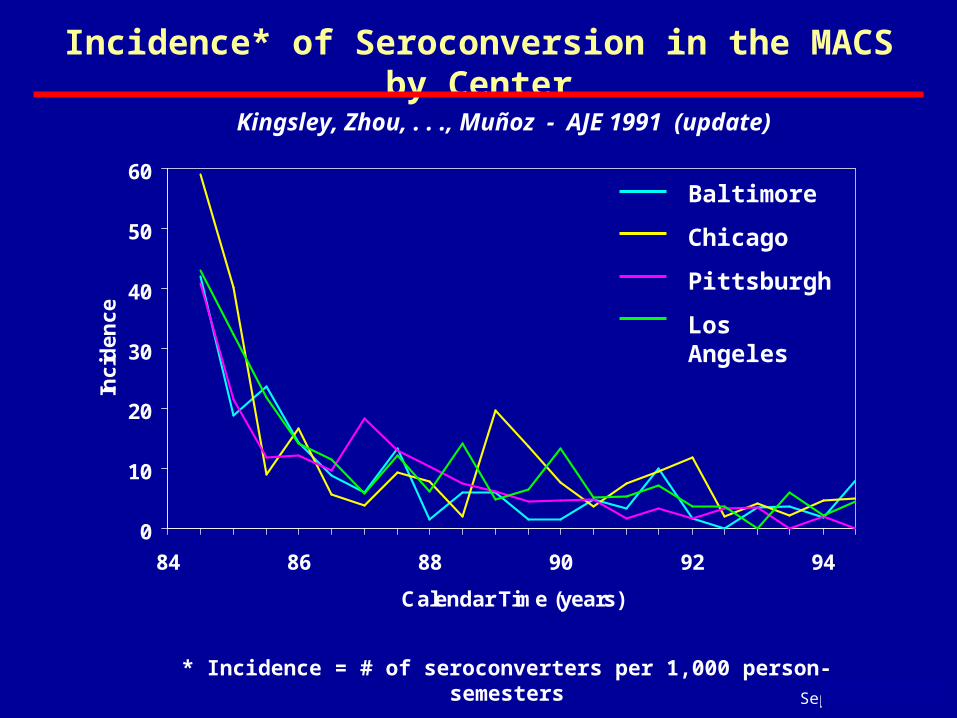
Incidence* of Seroconversion in the MACS by Center
0
10
20
30
40
50
60
84 86 88 90 92 94
Calendar Time (years)
Inc
ide
nc
e
September 1995
Baltimore
Chicago
Pittsburgh
Los Angeles
Kingsley, Zhou, . . ., Muñoz - AJE 1991 (update)
* Incidence = # of seroconverters per 1,000 person-semesters
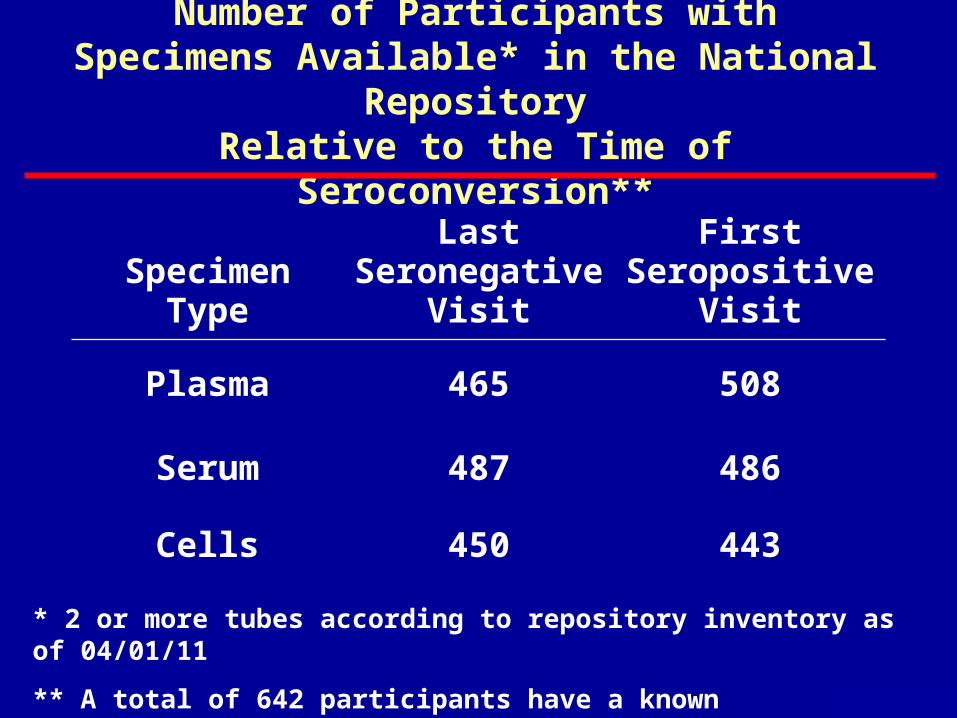
Number of Participants withSpecimens Available* in the National Repository
Relative to the Time of Seroconversion**
May 2011
* 2 or more tubes according to repository inventory as of 04/01/11
** A total of 642 participants have a known seroconversion date
SpecimenType
LastSeronegative
Visit
FirstSeropositive
Visit
Plasma 465 508
Serum 487 486
Cells 450 443
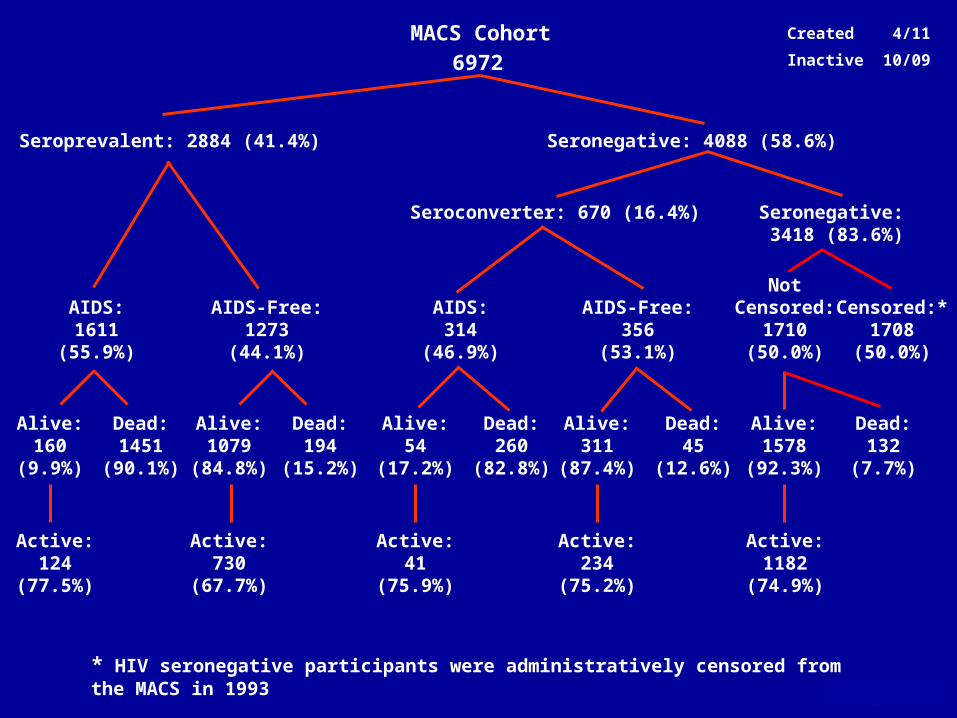
MACS Cohort
6972
Seroconverter: 670 (16.4%) Seronegative: 3418 (83.6%)
Seroprevalent: 2884 (41.4%) Seronegative: 4088 (58.6%)
* HIV seronegative participants were administratively censored from the MACS in 1993
Active:730
(67.7%)
Active:124
(77.5%)
Active:234
(75.2%)
Active:41
(75.9%)
Active:1182
(74.9%)
Dead:1451
(90.1%)
Dead:194
(15.2%)
Dead:260
(82.8%)
Dead:45
(12.6%)
Dead:132
(7.7%)
Alive:160
(9.9%)
Alive:1079
(84.8%)
Alive:54
(17.2%)
Alive:311
(87.4%)
Alive:1578
(92.3%)
Created 4/11
Inactive 10/09
May 2011
AIDS:1611
(55.9%)
AIDS-Free:1273
(44.1%)
AIDS:314
(46.9%)
AIDS-Free:356
(53.1%)
Not Censored:
1710(50.0%)
Censored:*1708
(50.0%)
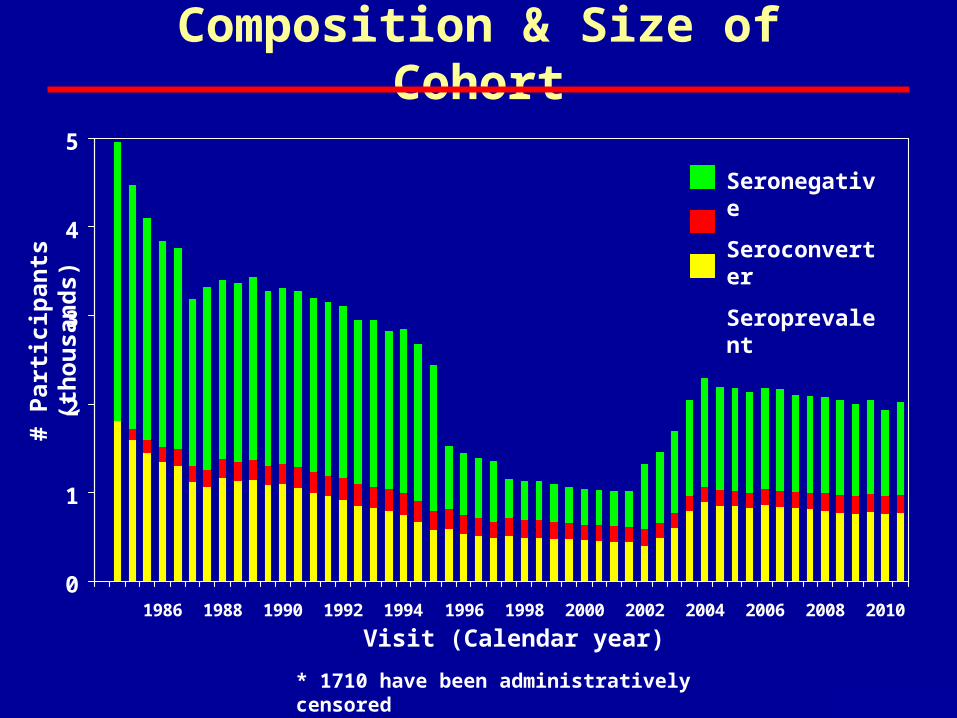
Composition & Size of Cohort
0
1
2
3
4
5
1986 1988 1990 1992 1994 1996 1998 2000 2002 2004 2006 2008 2010
May 2011
Visit (Calendar year)
# P
arti
cip
ants
(th
ou
san
ds)
Seronegative
Seroconverter
Seroprevalent
* 1710 have been administratively censored

Examples of Research Studies
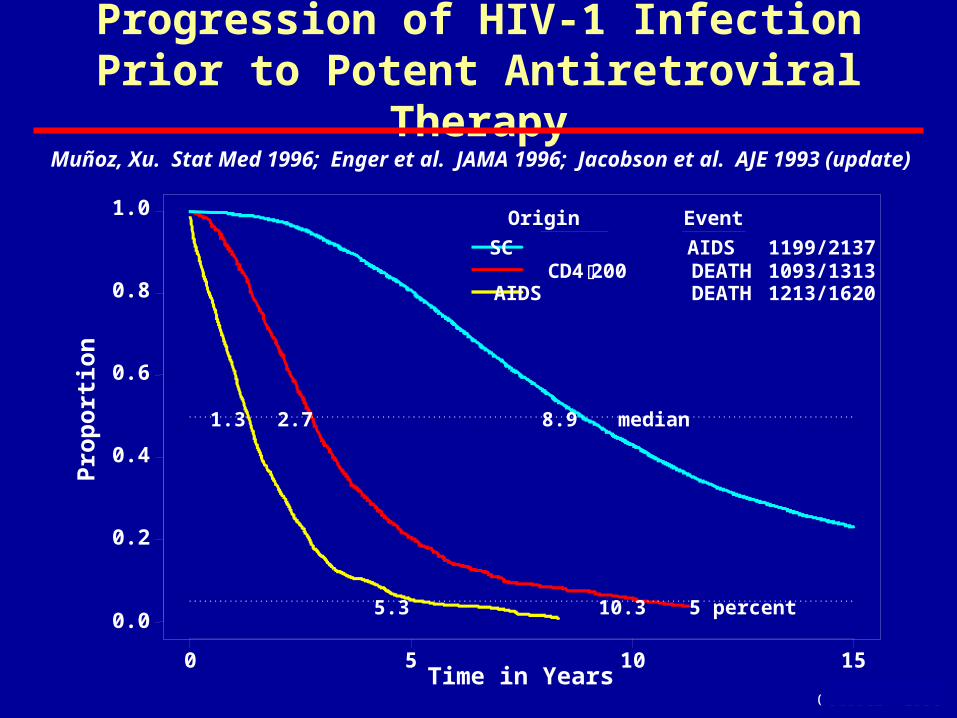
Progression of HIV-1 InfectionPrior to Potent Antiretroviral Therapy
October 1998
2.7
10.3
8.9 median1.3
5.3 5 percent
SC AIDSCD4 200 DEATHAIDS DEATH
1199/21371093/13131213/1620
Origin Event1.0
0.8
0.6
0.4
0.2
0.0
50 10 15Time in Years
Muñoz, Xu. Stat Med 1996; Enger et al. JAMA 1996; Jacobson et al. AJE 1993 (update)
Pro
po
rtio
n
17
98
89
78
67
67
73
73
55
55
37
37
37
37
14
17
17
1710
2
CD4+ T-Lymphocyte(cells/mm3)200
201-350
351-500
501-750
>750
HIV-RNA(copies/ml)
RT-PCR>55K
>20K-50K
>7K-50K
1500-7K
1500
100
93
94
76
76
86
86
76
76
62
60
60
60
40
35
35
3522
4
CD4+ T-Lymphocyte(cells/mm3)200
201-350
351-500
501-750
>750
HIV-RNA(copies/ml)
RT-PCR>55K
>20K-50K
>7K-50K
1500-7K
1500
86
64
48
33
33
40
40
16
16
10
8
8
8
3
2
2
24
0
CD4+ T-Lymphocyte(cells/mm3)
200
201-350
351-500
501-750
>750
HIV-RNA(copies/ml)
RT-PCR>55K
>20K-50K
>7K-50K
1500-7K
1500
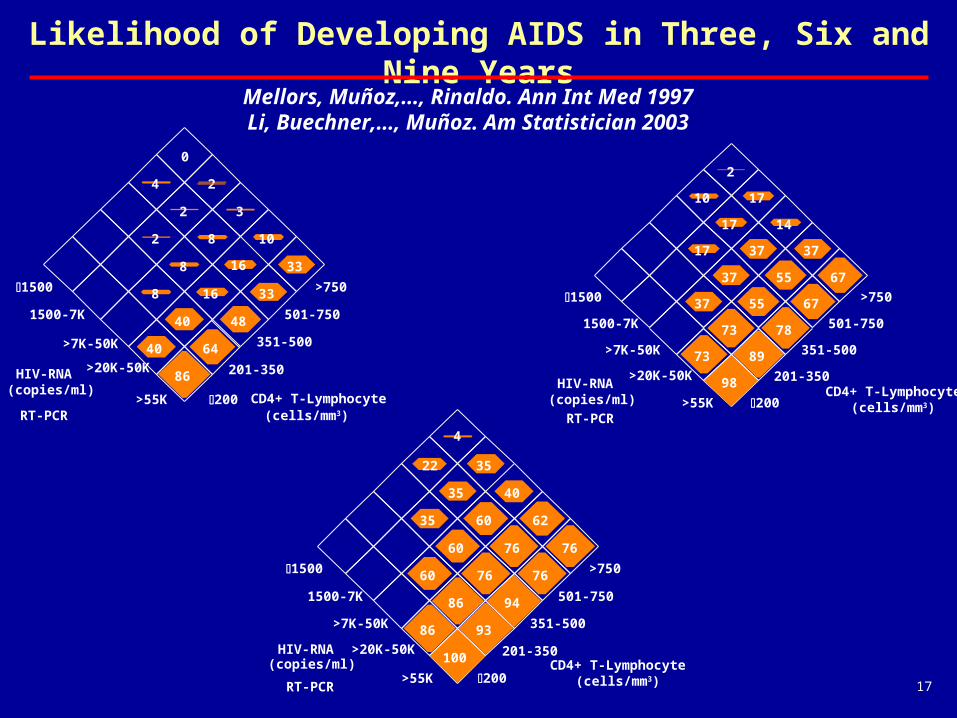
Mellors, Muñoz,…, Rinaldo. Ann Int Med 1997Li, Buechner,…, Muñoz. Am Statistician 2003
Likelihood of Developing AIDS in Three, Six and Nine Years
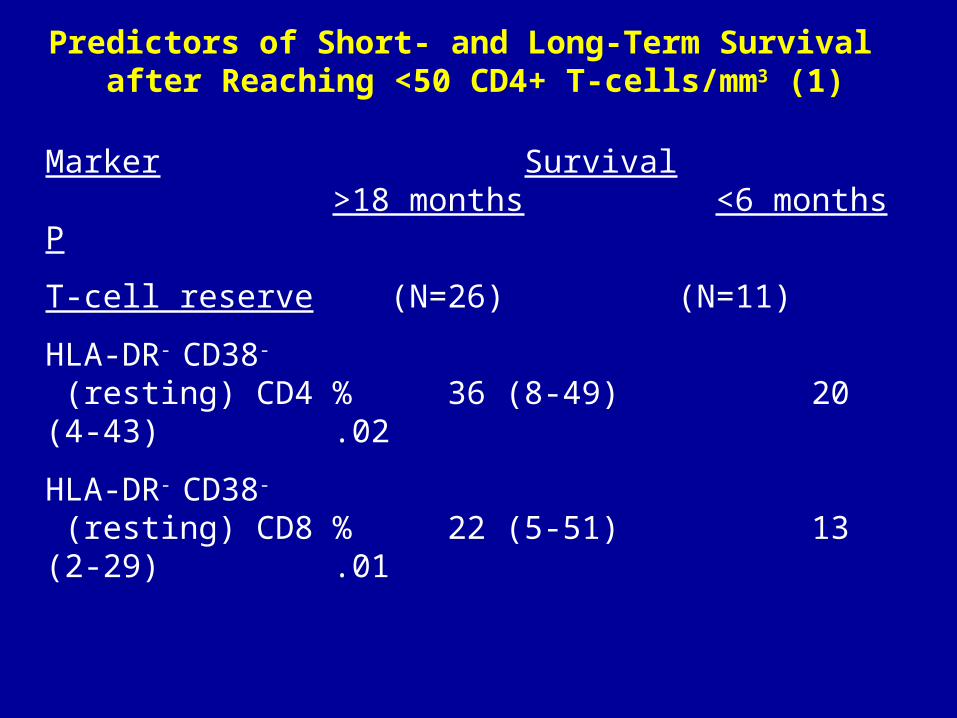
Predictors of Short- and Long-Term Survival after Reaching <50 CD4+ T-cells/mm3 (1)
Marker Survival>18 months <6 months P
T-cell reserve (N=26) (N=11)
HLA-DR- CD38-
(resting) CD4 % 36 (8-49) 20 (4-43) .02
HLA-DR- CD38-
(resting) CD8 % 22 (5-51) 13 (2-29) .01
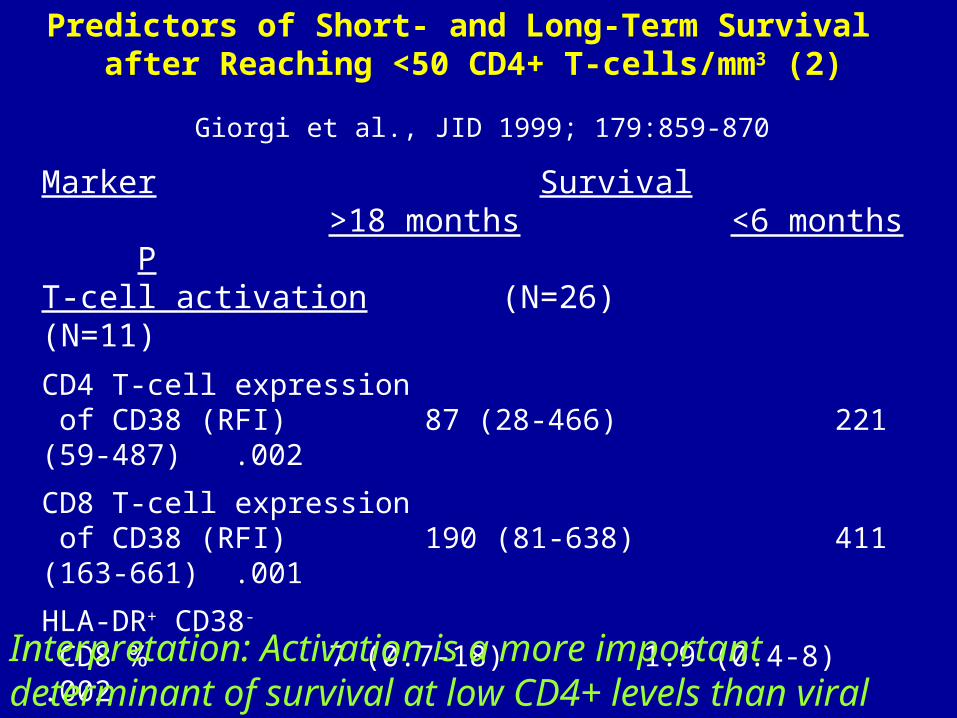
Predictors of Short- and Long-Term Survival after Reaching <50 CD4+ T-cells/mm3 (2)
Marker Survival>18 months <6 months P
T-cell activation (N=26) (N=11)
CD4 T-cell expression of CD38 (RFI) 87 (28-466) 221 (59-487) .002
CD8 T-cell expression of CD38 (RFI) 190 (81-638) 411 (163-661) .001
HLA-DR+ CD38-
CD8 % 7 (0.7-18) 1.9 (0.4-8) .002
Plasma HIV-1 copies/mL 105.2 (104.5-106.3) 105.6 (104.9-106.1) .02
Interpretation: Activation is a more important determinant of survival at low CD4+ levels than viral load
Giorgi et al., JID 1999; 179:859-870
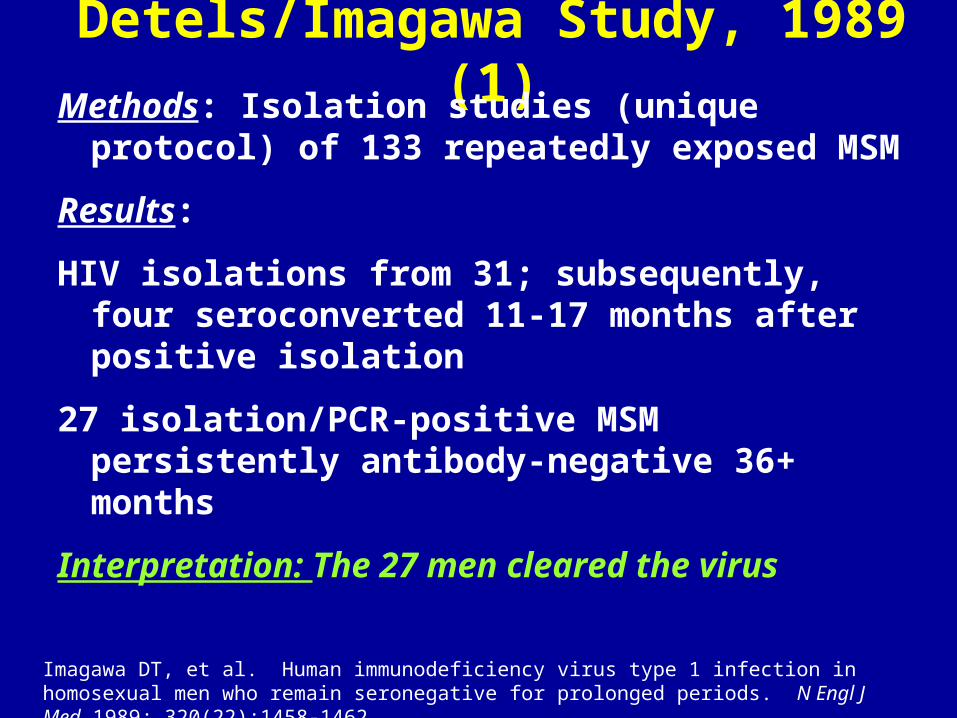
Detels/Imagawa Study, 1989 (1)Methods: Isolation studies (unique protocol) of
133 repeatedly exposed MSM
Results:
HIV isolations from 31; subsequently, four seroconverted 11-17 months after positive isolation
27 isolation/PCR-positive MSM persistently antibody-negative 36+ months
Interpretation: The 27 men cleared the virus
Imagawa DT, et al. Human immunodeficiency virus type 1 infection in homosexual men who remain seronegative for prolonged periods. N Engl J Med 1989; 320(22):1458-1462.
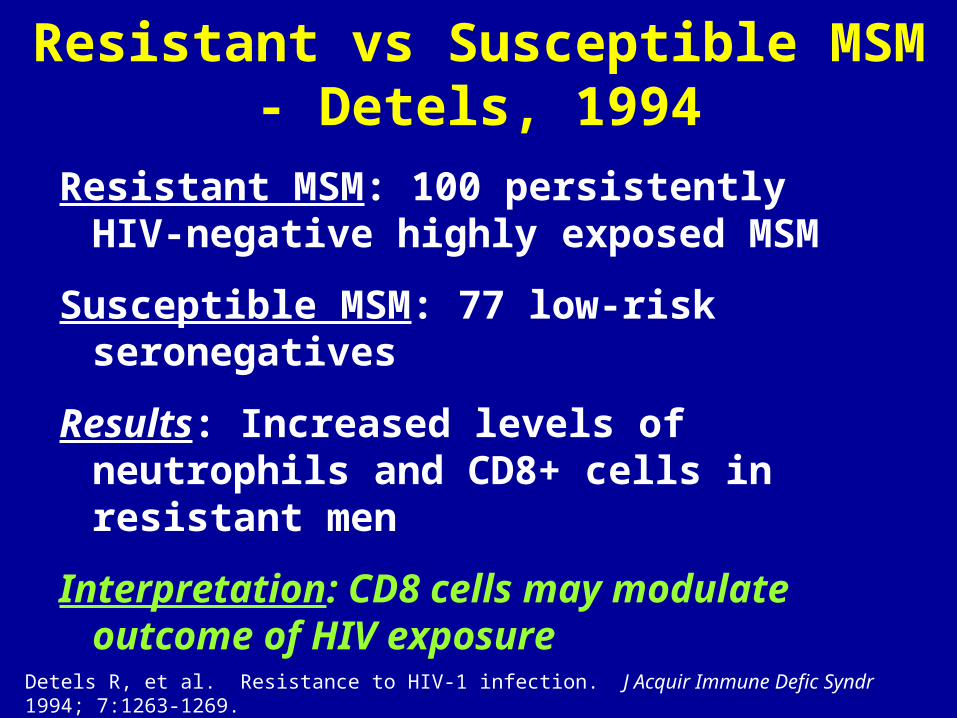
Resistant vs Susceptible MSM - Detels, 1994
Resistant MSM: 100 persistently HIV-negative highly exposed MSM
Susceptible MSM: 77 low-risk seronegatives
Results: Increased levels of neutrophils and CD8+ cells in resistant men
Interpretation: CD8 cells may modulate outcome of HIV exposure
Detels R, et al. Resistance to HIV-1 infection. J Acquir Immune Defic Syndr 1994; 7:1263-1269.
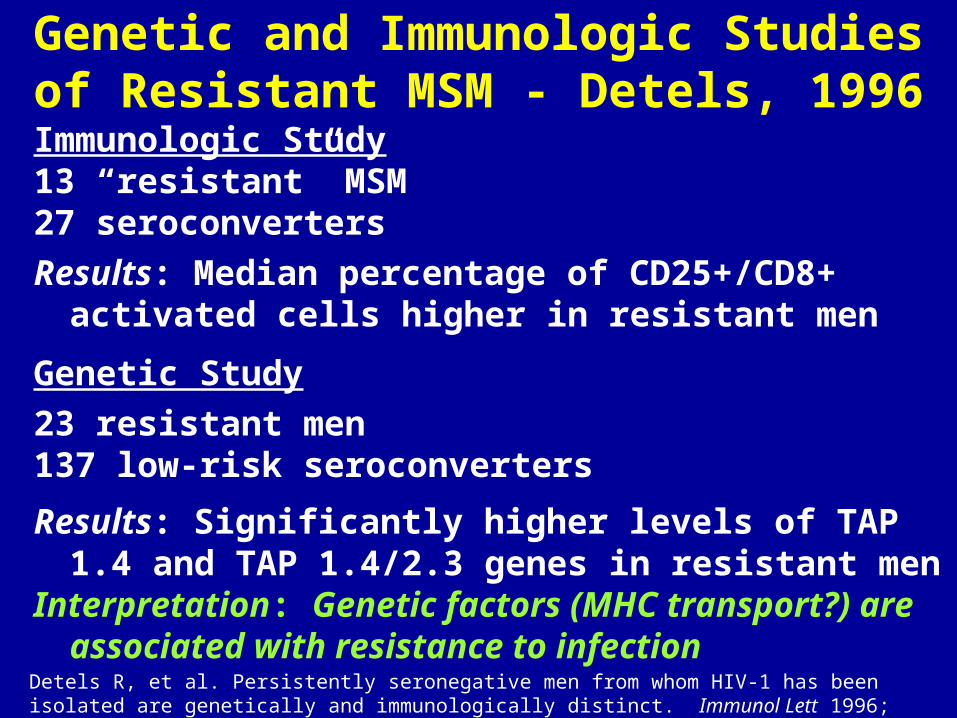
Genetic and Immunologic Studies of Resistant MSM - Detels, 1996
Immunologic Study13 “resistant” MSM27 seroconverters
Results: Median percentage of CD25+/CD8+ activated cells higher in resistant men
Genetic Study
23 resistant men137 low-risk seroconverters
Results: Significantly higher levels of TAP 1.4 and TAP 1.4/2.3 genes in resistant men
Interpretation: Genetic factors (MHC transport?) are associated with resistance to infection
Detels R, et al. Persistently seronegative men from whom HIV-1 has been isolated are genetically and immunologically distinct. Immunol Lett 1996; 51:29-33.
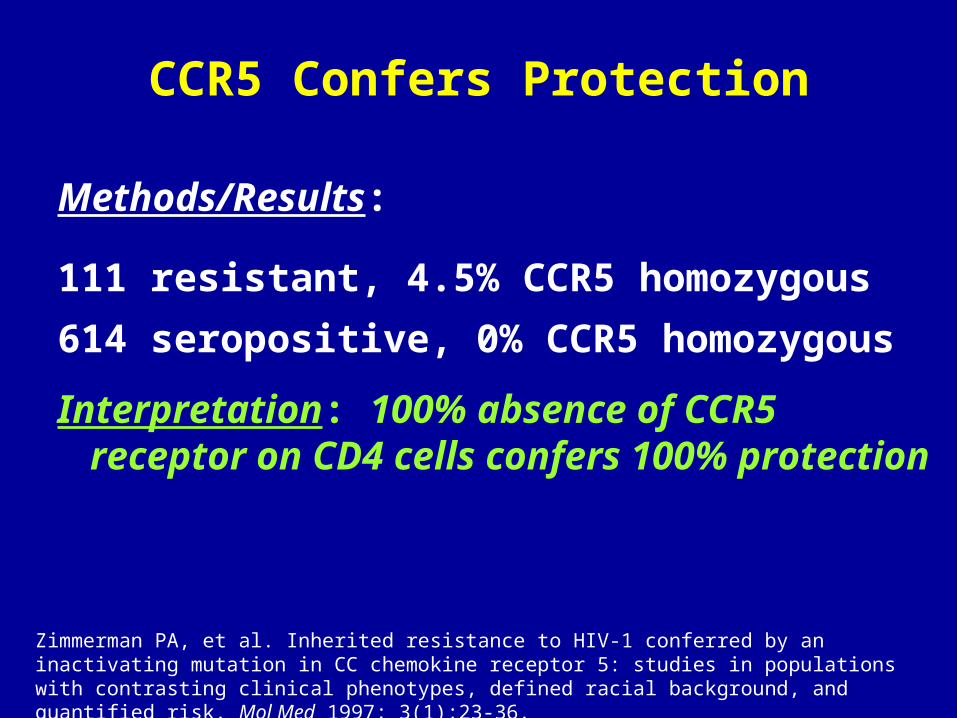
CCR5 Confers Protection
Methods/Results:
111 resistant, 4.5% CCR5 homozygous
614 seropositive, 0% CCR5 homozygous
Interpretation: 100% absence of CCR5 receptor on CD4 cells confers 100% protection
Zimmerman PA, et al. Inherited resistance to HIV-1 conferred by an inactivating mutation in CC chemokine receptor 5: studies in populations with contrasting clinical phenotypes, defined racial background, and quantified risk. Mol Med 1997; 3(1):23-36.
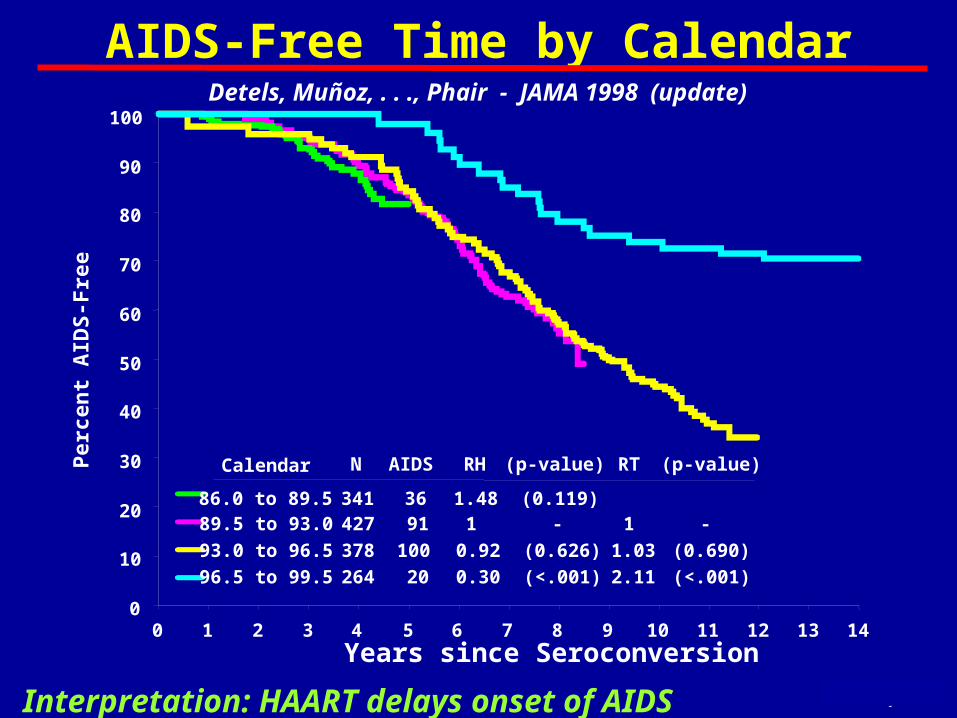
AIDS-Free Time by Calendar
May 2000
Detels, Muñoz, . . ., Phair - JAMA 1998 (update)
Years since Seroconversion0 1 2 3 4 5 6 7 8 9 10 11 12 13 14
0
10
20
30
40
50
60
70
80
90
100
Calendar
86.0 to 89.5 341 36 1.48 (0.119)89.5 to 93.0 427 91 1 - 1 -
93.0 to 96.5 378 100 0.92 (0.626) 1.03 (0.690)
96.5 to 99.5 264 20 0.30 (<.001) 2.11 (<.001)
N AIDS RH (p-value) RT (p-value)
Per
cen
t A
IDS
-Fre
e
Interpretation: HAART delays onset of AIDS
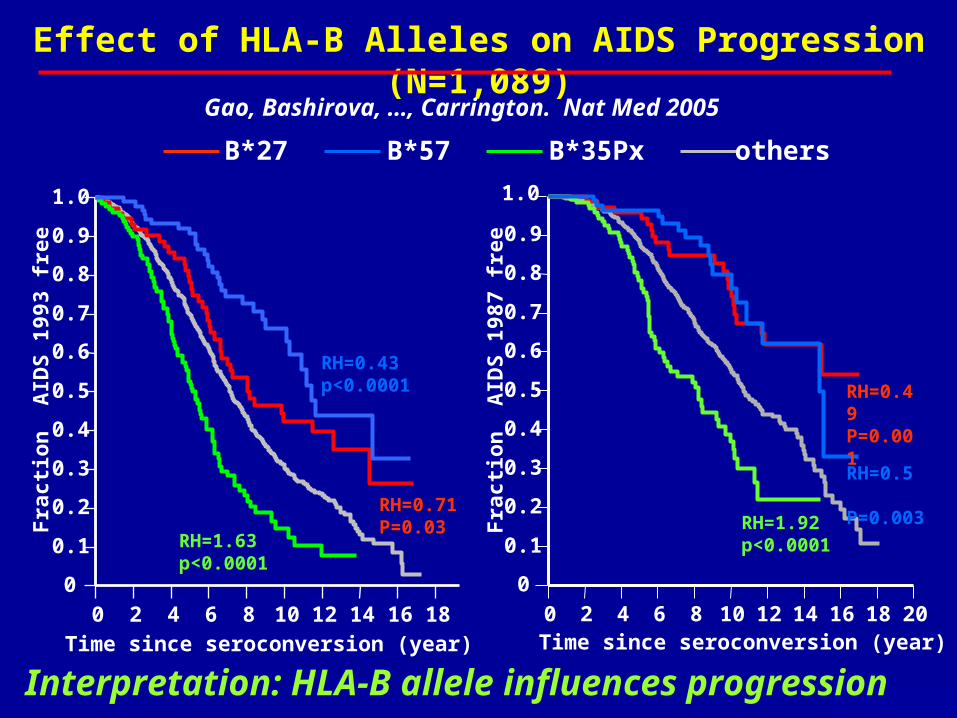
Effect of HLA-B Alleles on AIDS Progression (N=1,089)
B*27 B*57 B*35Px others
0
0.1
0.2
0.3
0.4
0.5
0.6
0.7
0.8
0.9
0 2 4 6 8 10 12 14 16 18 20Time since seroconversion (year)
Fra
ctio
n A
IDS
198
7 fr
ee
RH=0.49 P=0.001
RH=0.5 P=0.003
RH=1.92 p<0.0001
1.0
0
0.1
0.2
0.3
0.4
0.5
0.6
0.7
0.8
0.9
1.0
0 2 4 6 8 10 12 14 16 18Time since seroconversion (year)
Fra
ctio
n A
IDS
199
3 fr
ee
RH=1.63 p<0.0001
RH=0.43 p<0.0001
RH=0.71 P=0.03
May 2006
Gao, Bashirova, …, Carrington. Nat Med 2005
Interpretation: HLA-B allele influences progression
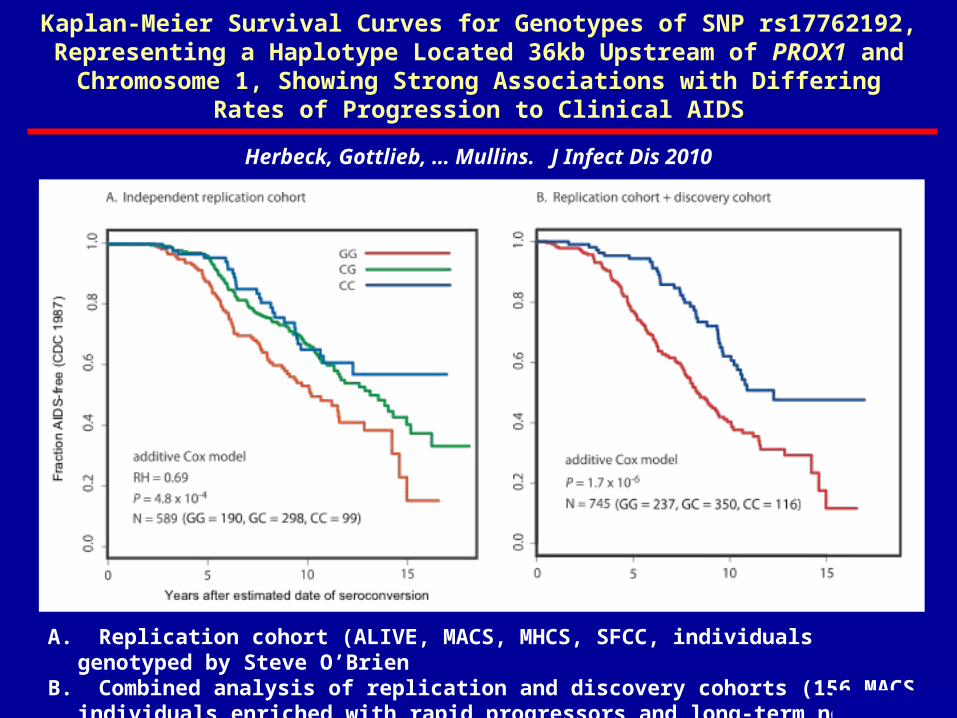
A. Replication cohort (ALIVE, MACS, MHCS, SFCC, individuals genotyped by Steve O’BrienB. Combined analysis of replication and discovery cohorts (156 MACS individuals enriched with
rapid progressors and long-term non-progressors
Herbeck, Gottlieb, … Mullins. J Infect Dis 2010
May 2010
Kaplan-Meier Survival Curves for Genotypes of SNP rs17762192, Representing a Haplotype Located 36kb Upstream of PROX1 and
Chromosome 1, Showing Strong Associations with Differing Rates of Progression to Clinical AIDS
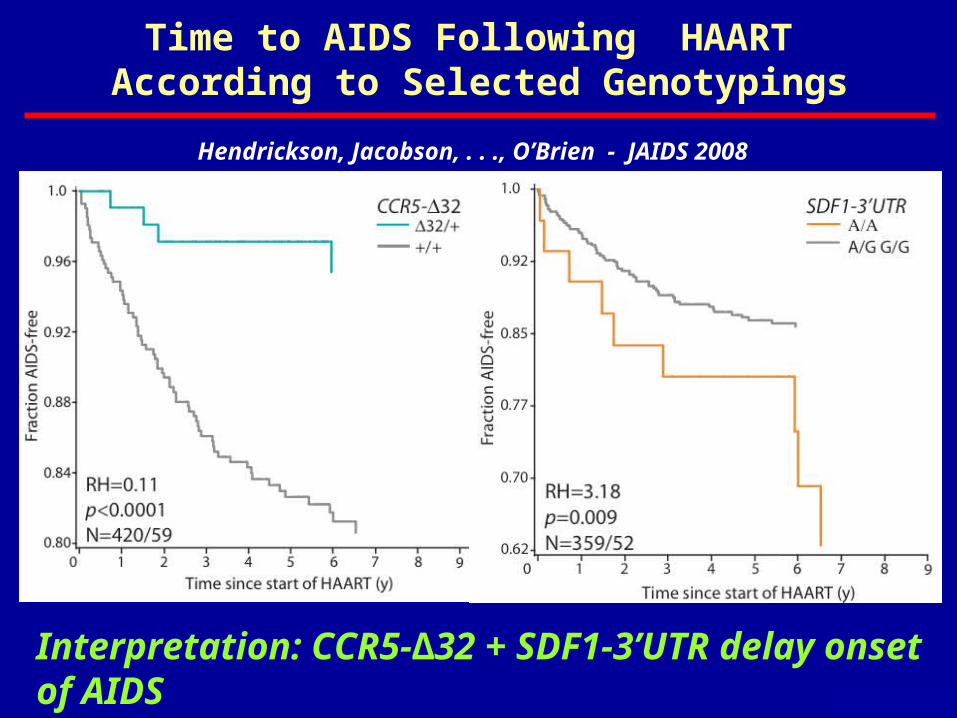
Time to AIDS Following HAART According to Selected Genotypings
May 2009
Hendrickson, Jacobson, . . ., O’Brien - JAIDS 2008
Interpretation: CCR5-∆32 + SDF1-3’UTR delay onset of AIDS
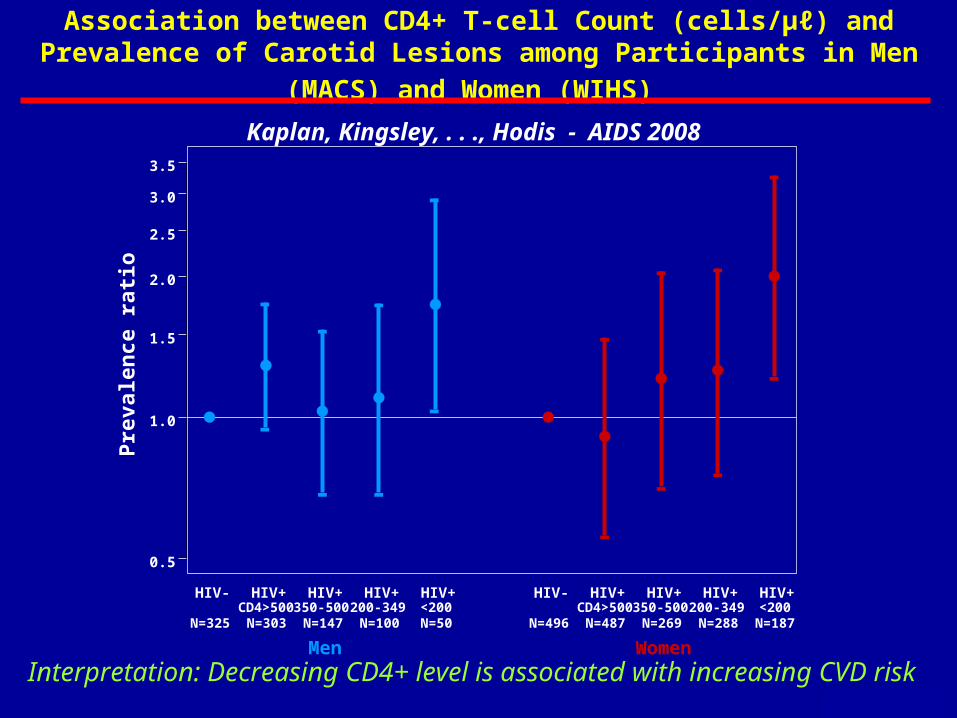
Association between CD4+ T-cell Count (cells/µℓ) and Prevalence of
Carotid Lesions among Participants in Men (MACS) and Women (WIHS)
May 2009
Kaplan, Kingsley, . . ., Hodis - AIDS 2008P
reva
len
ce r
atio
0.5
1.0
1.5
2.0
2.5
3.0
3.5
-
- -
-
--
-
-
-
- -
--
- -
-
HIV- HIV+ HIV+ HIV+ HIV+ HIV- HIV+ HIV+ HIV+ HIV+CD4>500 350-500 200-349 <200 CD4>500 350-500 200-349 <200
N=325 N=303 N=147 N=100 N=50 N=496 N=487 N=269 N=288 N=187
Men Women
Interpretation: Decreasing CD4+ level is associated with increasing CVD risk
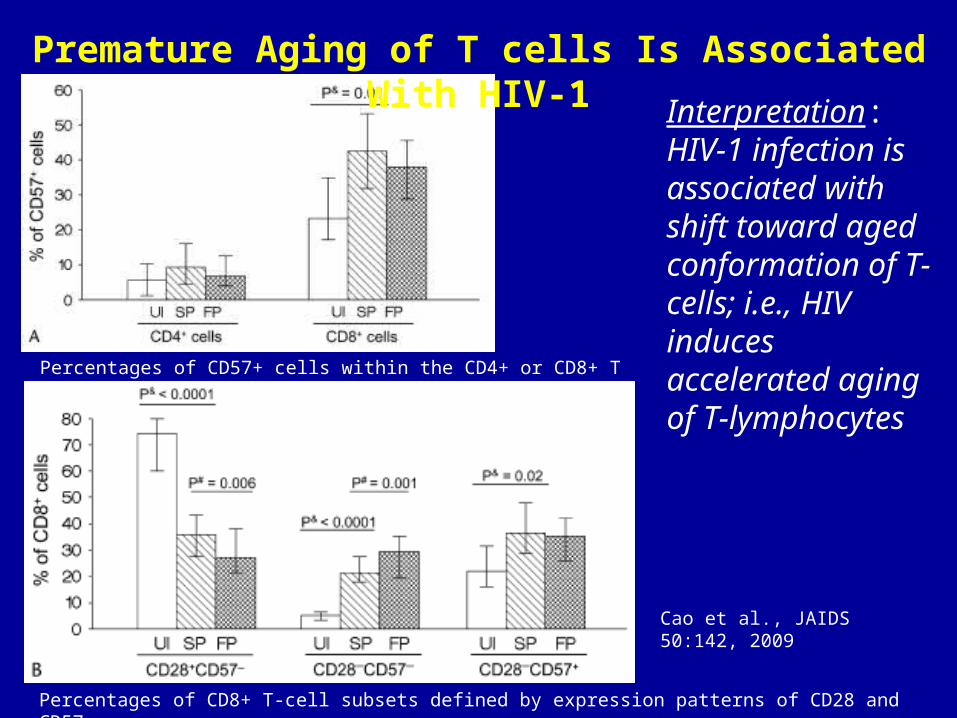
Premature Aging of T cells Is Associated With HIV-1
Percentages of CD8+ T-cell subsets defined by expression patterns of CD28 and CD57
Interpretation: HIV-1 infection is associated with shift toward aged conformation of T-cells; i.e., HIV induces accelerated aging of T-lymphocytes
Percentages of CD57+ cells within the CD4+ or CD8+ T cells
Cao et al., JAIDS 50:142, 2009
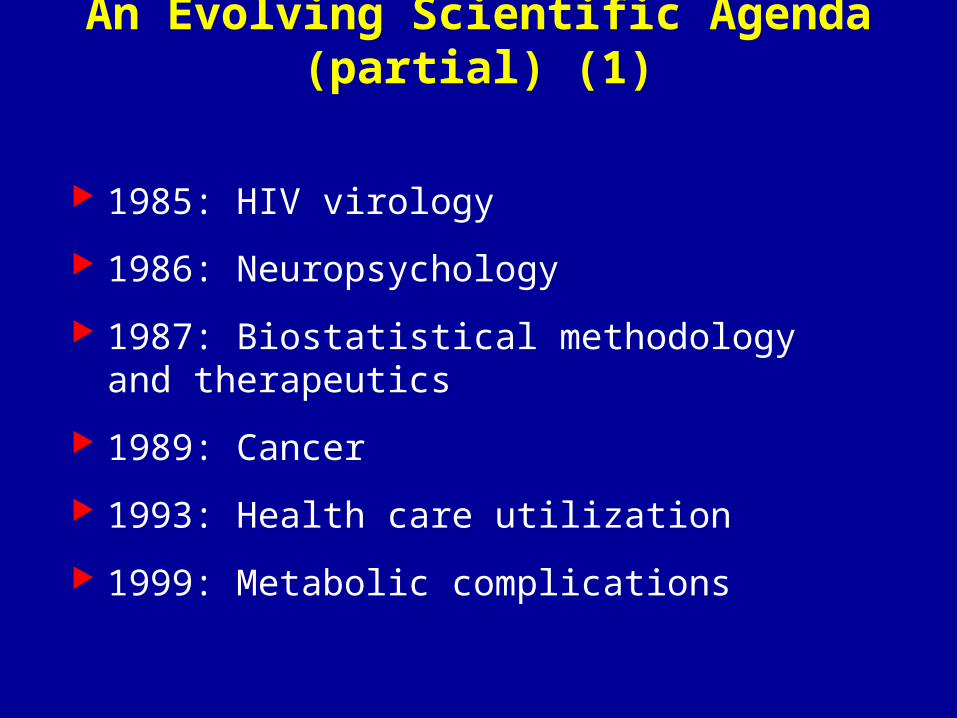
An Evolving Scientific Agenda (partial) (1)
1985: HIV virology
1986: Neuropsychology
1987: Biostatistical methodology and therapeutics
1989: Cancer
1993: Health care utilization
1999: Metabolic complications
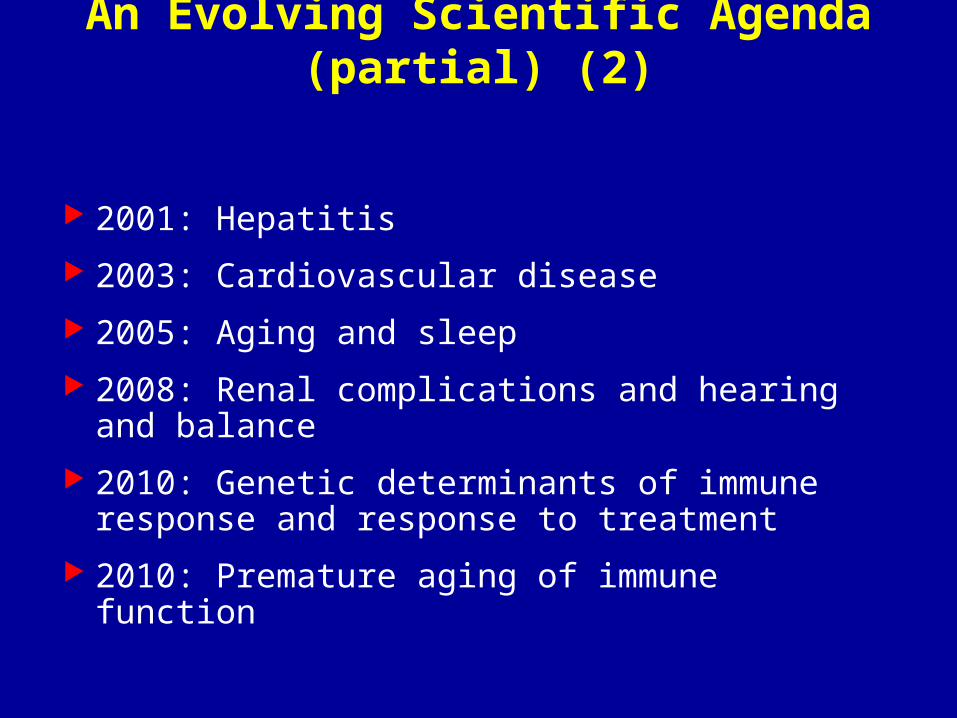
An Evolving Scientific Agenda (partial) (2)
2001: Hepatitis
2003: Cardiovascular disease
2005: Aging and sleep
2008: Renal complications and hearing and balance
2010: Genetic determinants of immune response and response to treatment
2010: Premature aging of immune function
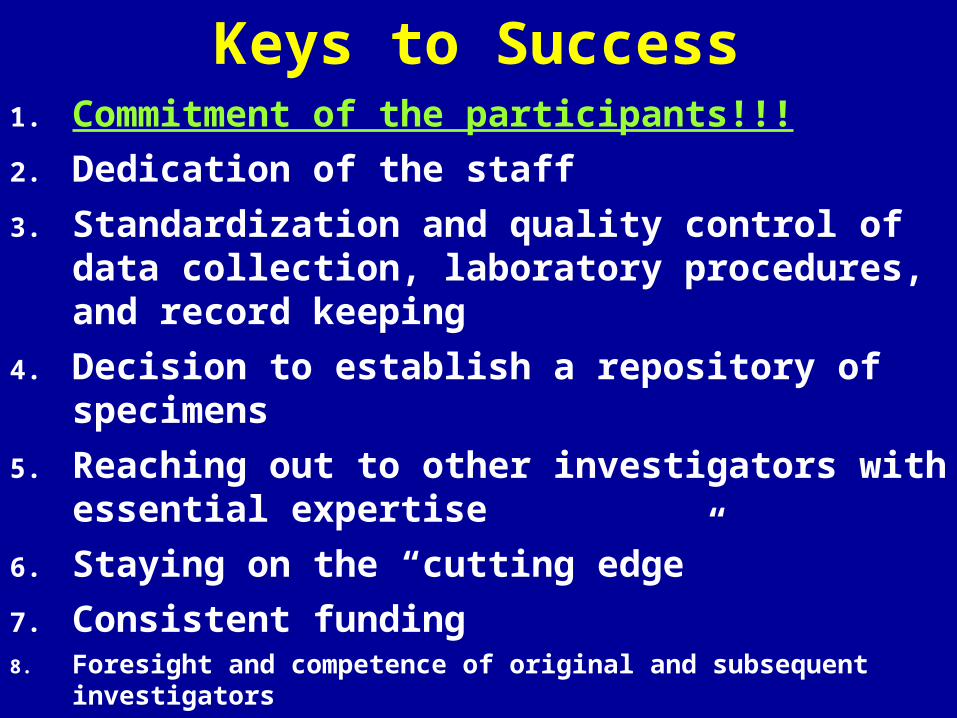
Keys to Success1. Commitment of the participants!!!
2. Dedication of the staff
3. Standardization and quality control of data collection, laboratory procedures, and record keeping
4. Decision to establish a repository of specimens
5. Reaching out to other investigators with essential expertise
6. Staying on the “cutting edge”
7. Consistent funding8. Foresight and competence of original and subsequent investigators


![Environmental Problems in Michoacan [7587]](https://img.pdfslide.us/doc/110x75/563db944550346aa9a9ba8b9/environmental-problems-in-michoacan-7587.jpg)