Embed Size (px)
Citation preview
WRMISS Chiba, September 2005
DOSIMETRY AND MICRODOSIMETRY ONBOARD ISS AND RELATED TOPICS
2004-2005
František SPURNÝ, Iva JADRNÍČKOVÁ, Karel TUREK
Department of Radiation Dosimetry, Nuclear Physics Institute,
Czech Academy of Sciences, Prague
WRMISS Chiba, September 2005
• On-Earth’s calibrations ICCHIBAN 6 (C, Ar, Kr; 24 - 600 keV/µm) ICCHIBAN-NSRL (H, O, Fe; 0.2 – 150 keV/µm) Dubna Nuclotron (C, Mg, Fe; 8 – 200 keV/µm)
• Onboard ISS exposures January to October 2004; russian module
• Other analysis Influence of sensitive volume dimensions on the
microdosimetry distributions
Experiments and analysis 2004-2005
WRMISS Chiba, September 2005
Thermoluminescent detectors (TLD’s)Al2O3:C - H*(10) ³ 1 mSv- rapid decrease of light conversion factor (relative
response RR) with LET above ~ 1 keV/mmCzech alumophosphate (AlP) TL glass- H*(10) ³ 10 mSv- slower decrease of relative response RR with LET above
~ 1 keV/mmLiF’s from IFJ Krakow- MTS-6; MTS-7; MTT-7; MCP-N; MCP-7- different decrease of relative response RR with LET
above ~ 1 keV/mm
WRMISS Chiba, September 2005
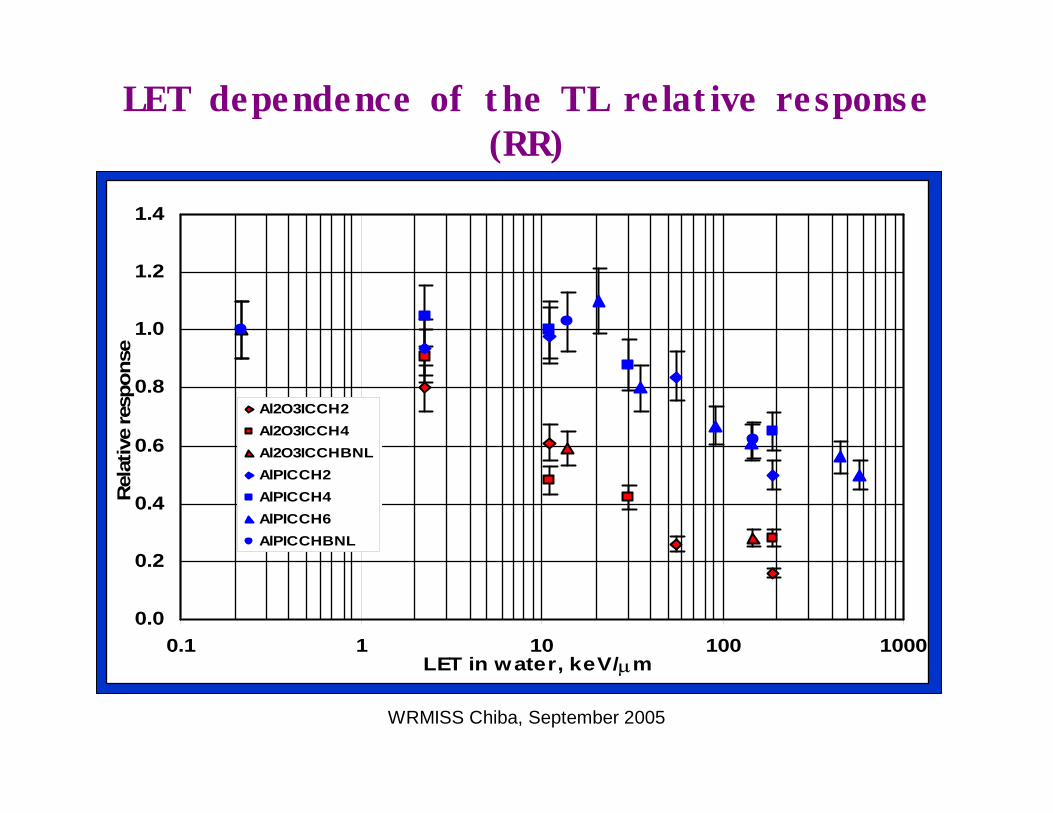
LET dependence of the TL relative response (RR)
0.0
0.2
0.4
0.6
0.8
1.0
1.2
1.4
0.1 1 10 100 1000LET in water, keV/mm
Rel
ativ
e re
spon
se
Al2O3ICCH2Al2O3ICCH4Al2O3ICCHBNLAlPICCH2AlPICCH4AlPICCH6AlPICCHBNL
WRMISS Chiba, September 2005
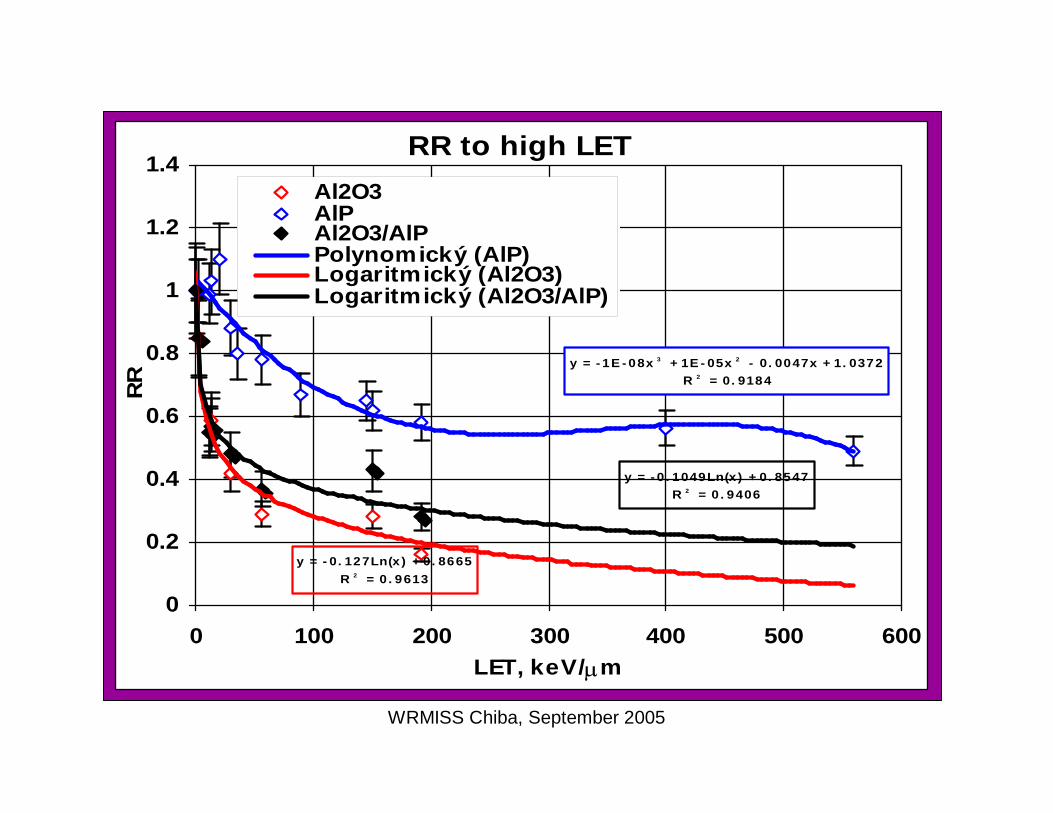
RR to high LET
y = - 1E - 08x 3 + 1E - 05x 2 - 0. 0047x + 1. 0372R 2 = 0. 9184
y = - 0. 127Ln(x) + 0. 8665R 2 = 0 . 9613
y = - 0 . 1049Ln(x) + 0. 8547R 2 = 0 . 9406
0
0.2
0.4
0.6
0.8
1
1.2
1.4
0 100 200 300 400 500 600LET, keV/mm
RR
Al2O3AlPAl2O3/AlPPolynomický (AlP)Logaritmický (Al2O3)Logaritmický (Al2O3/AlP)
WRMISS Chiba, September 2005
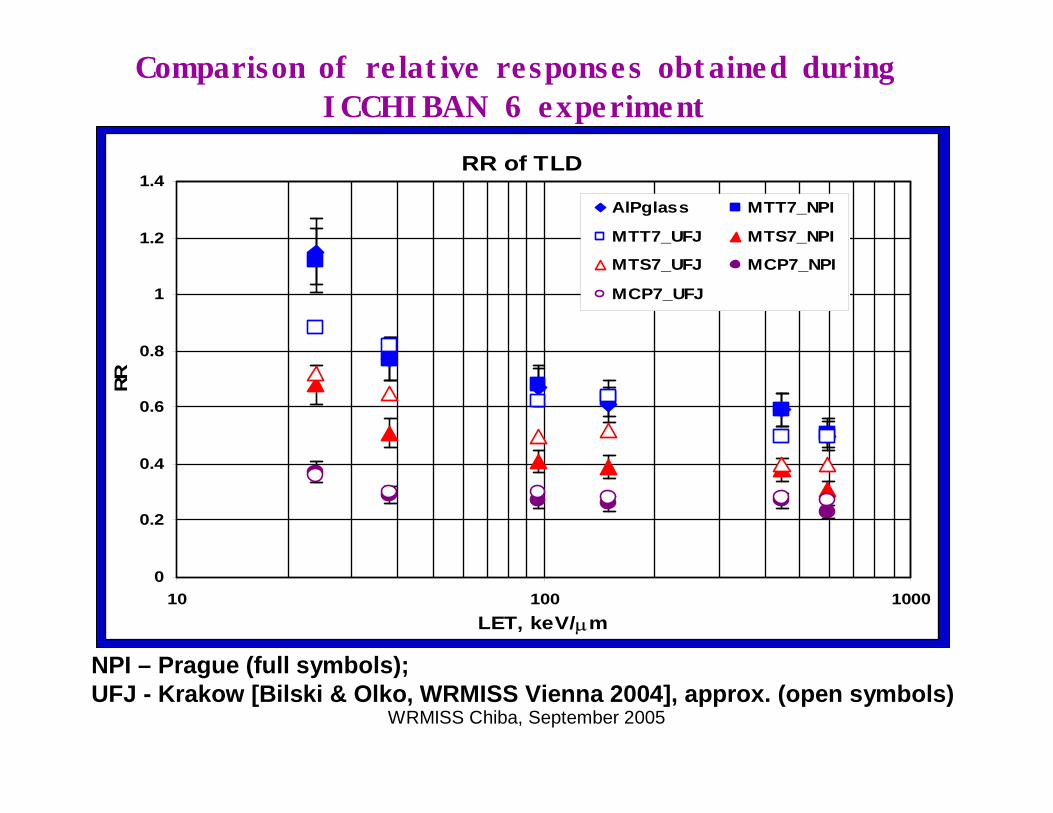
Comparison of relative responses obtained duringICCHIBAN 6 experiment
NPI – Prague (full symbols); UFJ - Krakow [Bilski & Olko, WRMISS Vienna 2004], approx. (open symbols)
RR of TLD
0
0.2
0.4
0.6
0.8
1
1.2
1.4
10 100 1000LET, keV/mm
RR
AlPglass MTT7_NPI
MTT7_UFJ MTS7_NPI
MTS7_UFJ MCP7_NPI
MCP7_UFJ
WRMISS Chiba, September 2005
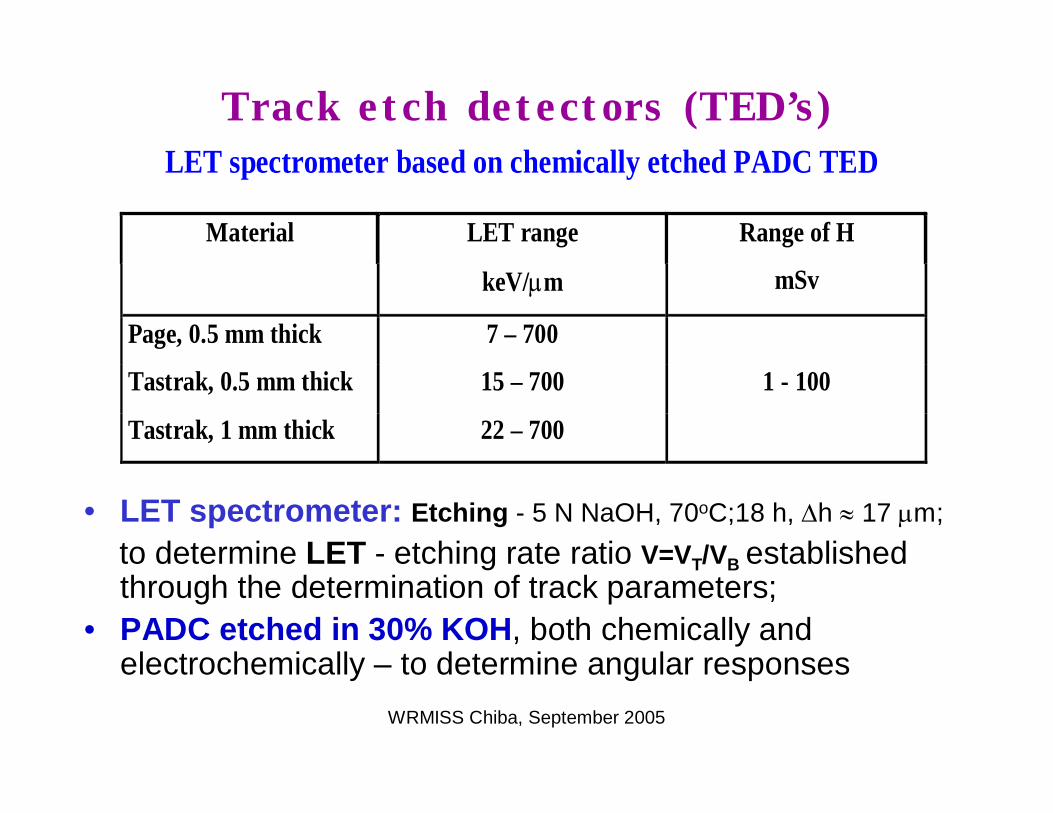
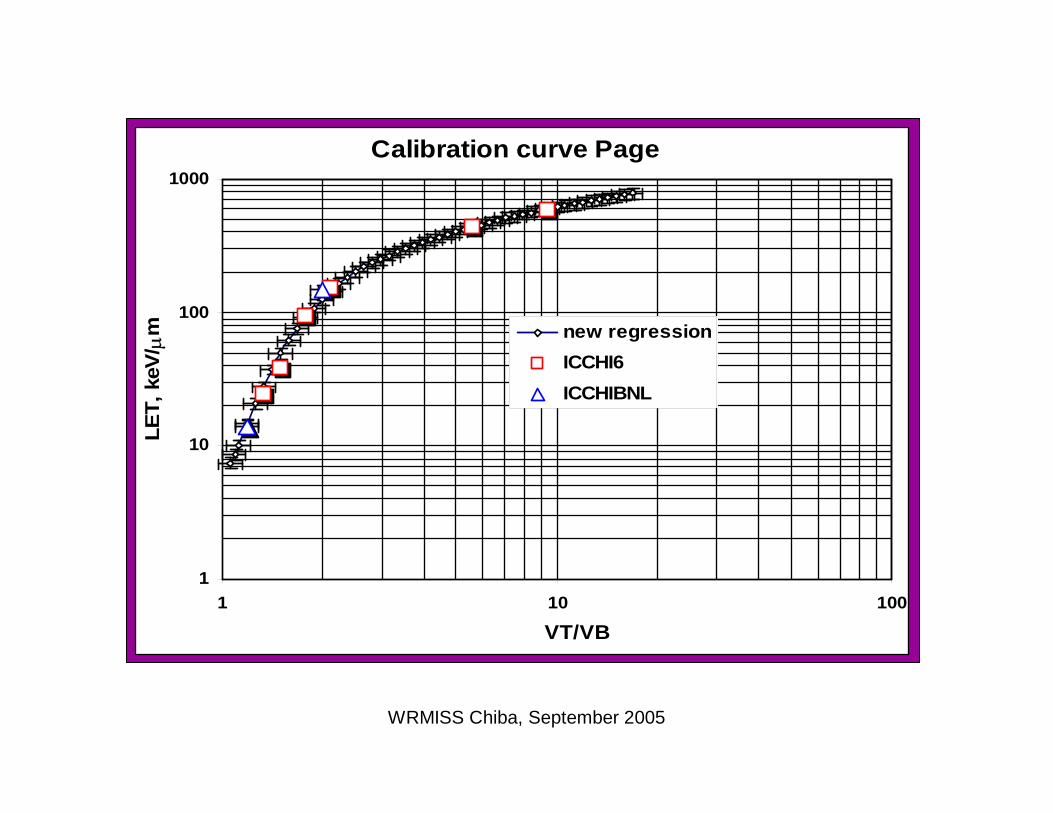
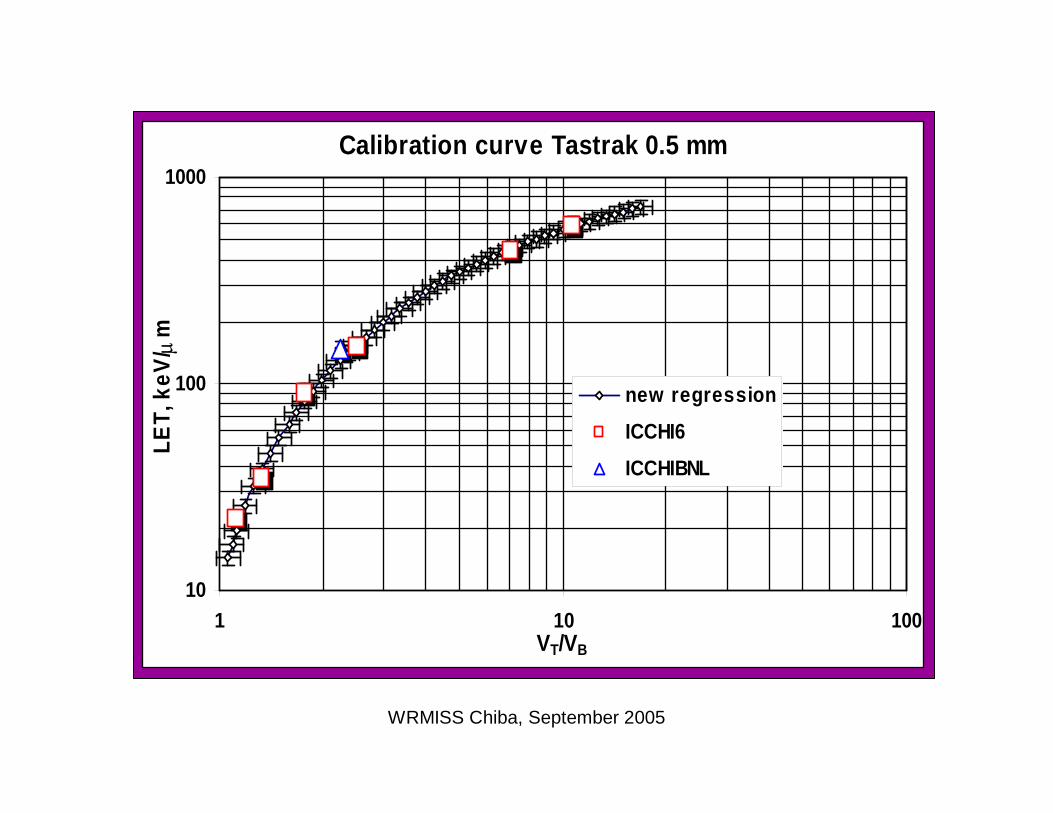
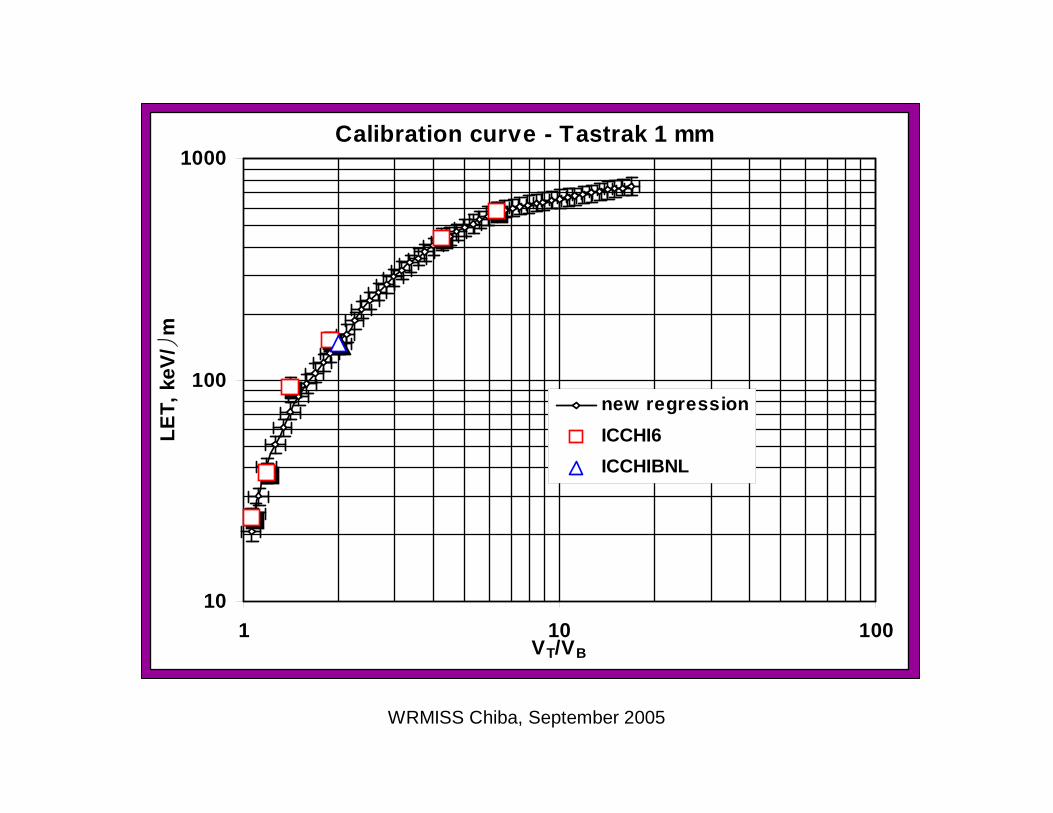
Track etch detectors (TED’s)LET spectrometer based on chemically etched PADC TED
Material LET range Range of H
keV/mm mSv
Page, 0.5 mm thick 7 – 700
Tastrak, 0.5 mm thick 15 – 700 1 - 100
Tastrak, 1 mm thick 22 – 700
• LET spectrometer: Etching - 5 N NaOH, 70oC;18 h, Dh » 17 mm;
to determine LET - etching rate ratio V=VT/VB established through the determination of track parameters;
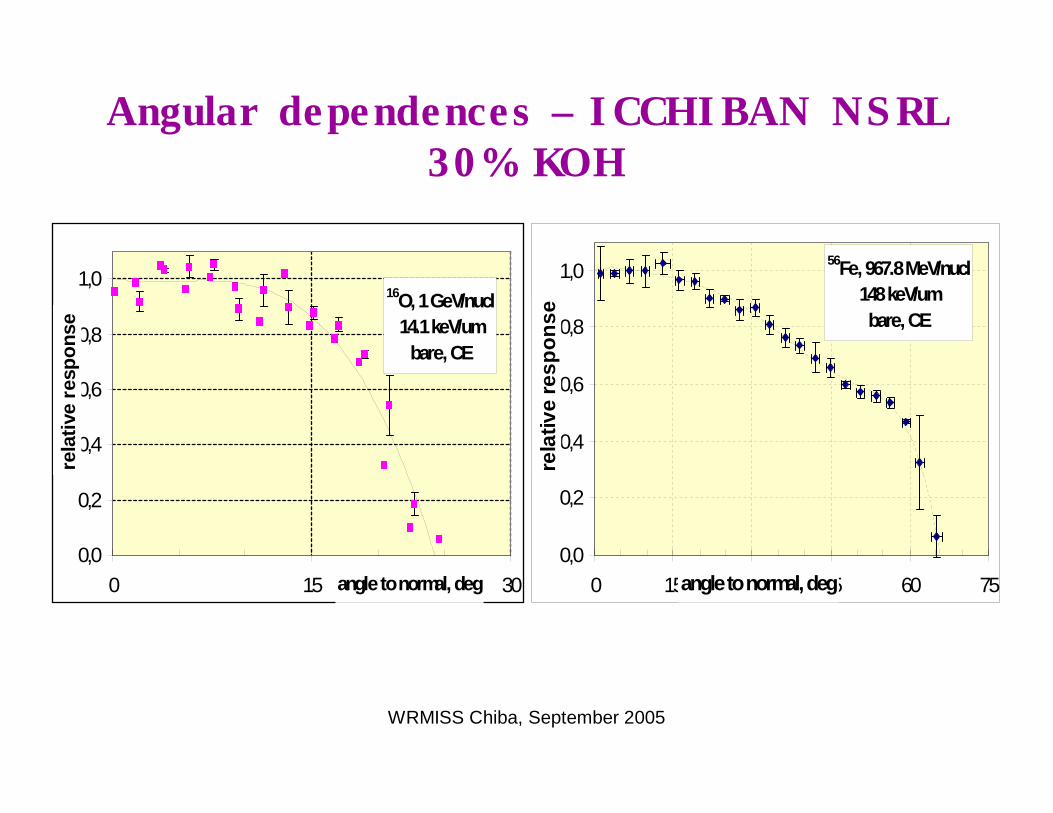
• PADC etched in 30% KOH, both chemically and electrochemically – to determine angular responses
WRMISS Chiba, September 2005
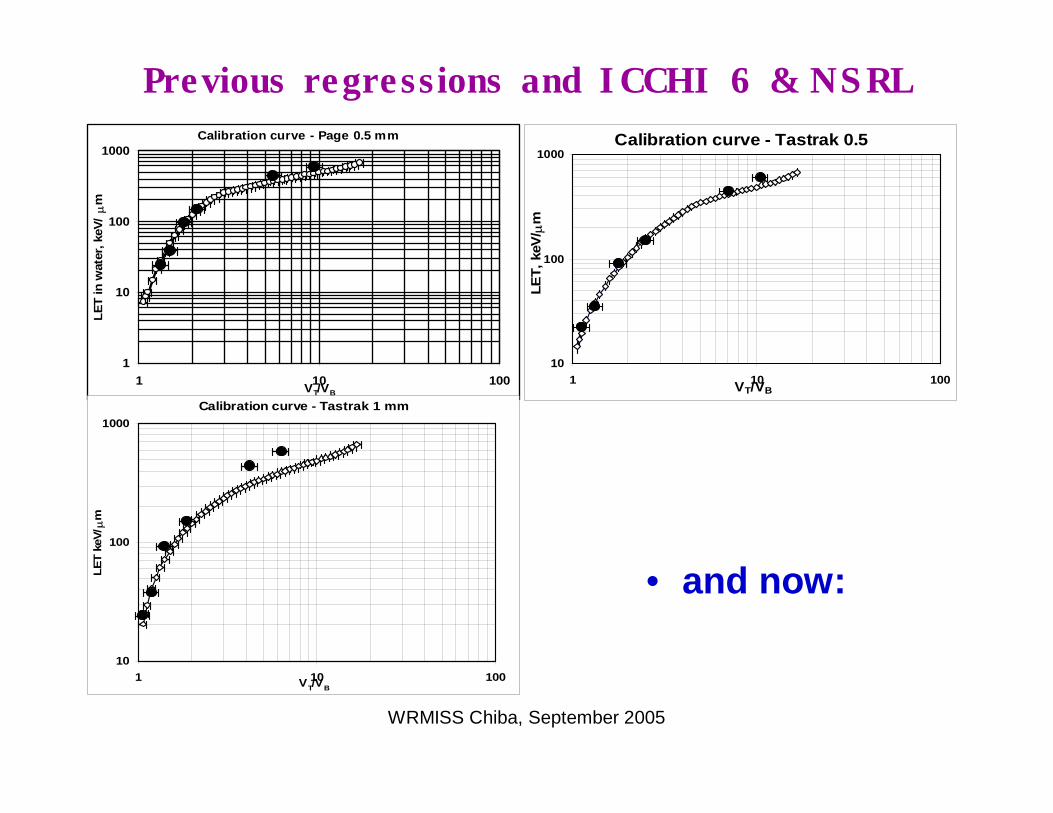
• and now:
Calibration curve - Page 0.5 mm
1
10
100
1000
1 10 100VT/VB
LET
in w
ater
, keV
/m
m
Calibration curve - Tastrak 0.5
10
100
1000
1 10 100VT/VB
LET,
keV
/ mm
Calibration curve - Tastrak 1 mm
10
100
1000
1 10 100VT/VB
LET
keV/m
mPrevious regressions and ICCHI 6 & NSRL
WRMISS Chiba, September 2005
Calibration curve Page
1
10
100
1000
1 10 100
VT/VB
LET,
keV
/ mm new regression
ICCHI6ICCHIBNL
WRMISS Chiba, September 2005
Calibration curve Tastrak 0.5 mm
10
100
1000
1 10 100VT/VB
LET,
keV
/ mm
new regressionICCHI6ICCHIBNL
WRMISS Chiba, September 2005
Calibration curve - Tastrak 1 mm
10
100
1000
1 10 100VT/VB
LET,
keV
/ øm
new regressionICCHI6ICCHIBNL
WRMISS Chiba, September 2005
Angular dependences – ICCHIBAN NSRL30% KOH
16O, 1 GeV/nucl14.1 keV/umbare, CE
0,0
0,2
0,4
0,6
0,8
1,0
0 15 30angle to normal, deg
rela
tive
resp
onse
56Fe, 967.8 MeV/nucl148 keV/umbare, CE
0,0
0,2
0,4
0,6
0,8
1,0
0 15 30 45 60 75angle to normal, degre
lativ
e re
spon
se
WRMISS Chiba, September 2005
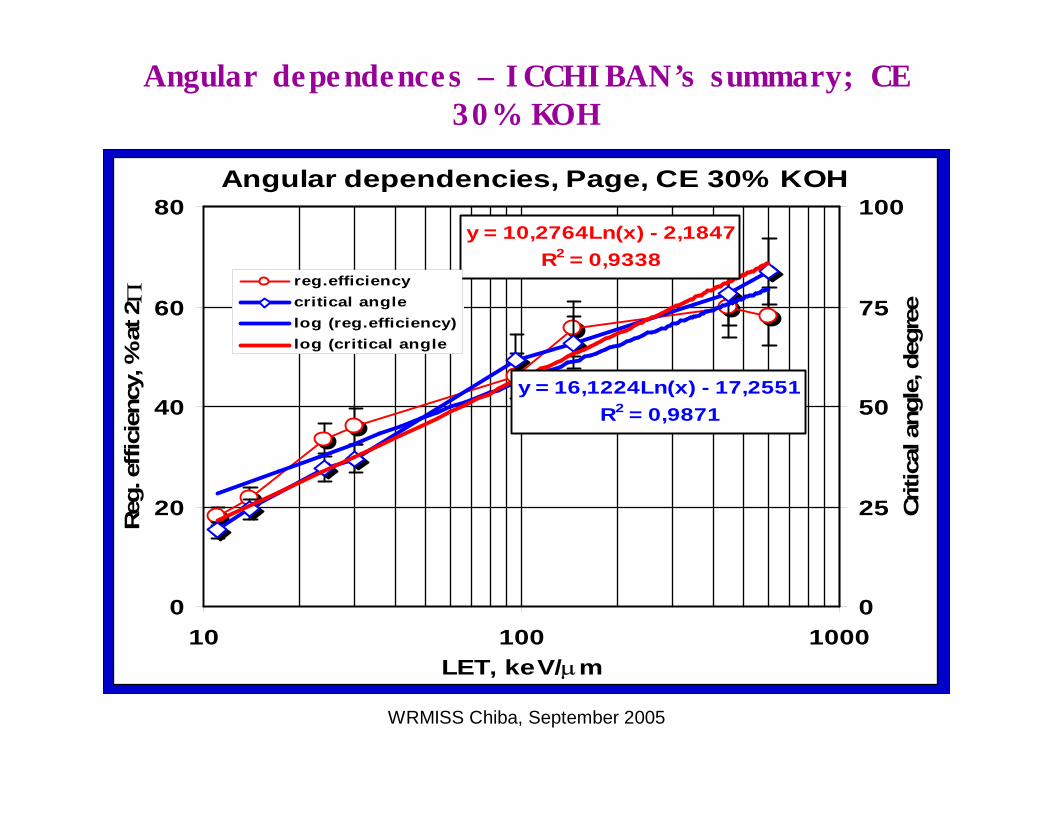
Angular dependences – ICCHIBAN’s summary; CE 30% KOH
Angular dependencies, Page, CE 30% KOH
y = 10,2764Ln(x) - 2,1847R2 = 0,9338
y = 16,1224Ln(x) - 17,2551R2 = 0,9871
0
20
40
60
80
10 100 1000LET, keV/mm
Reg
. eff
icie
ncy,
% a
t 2P
0
25
50
75
100
Crit
ical
ang
le, d
egre
e
reg.efficiencycritical anglelog (reg.efficiency)log (critical angle
WRMISS Chiba, September 2005
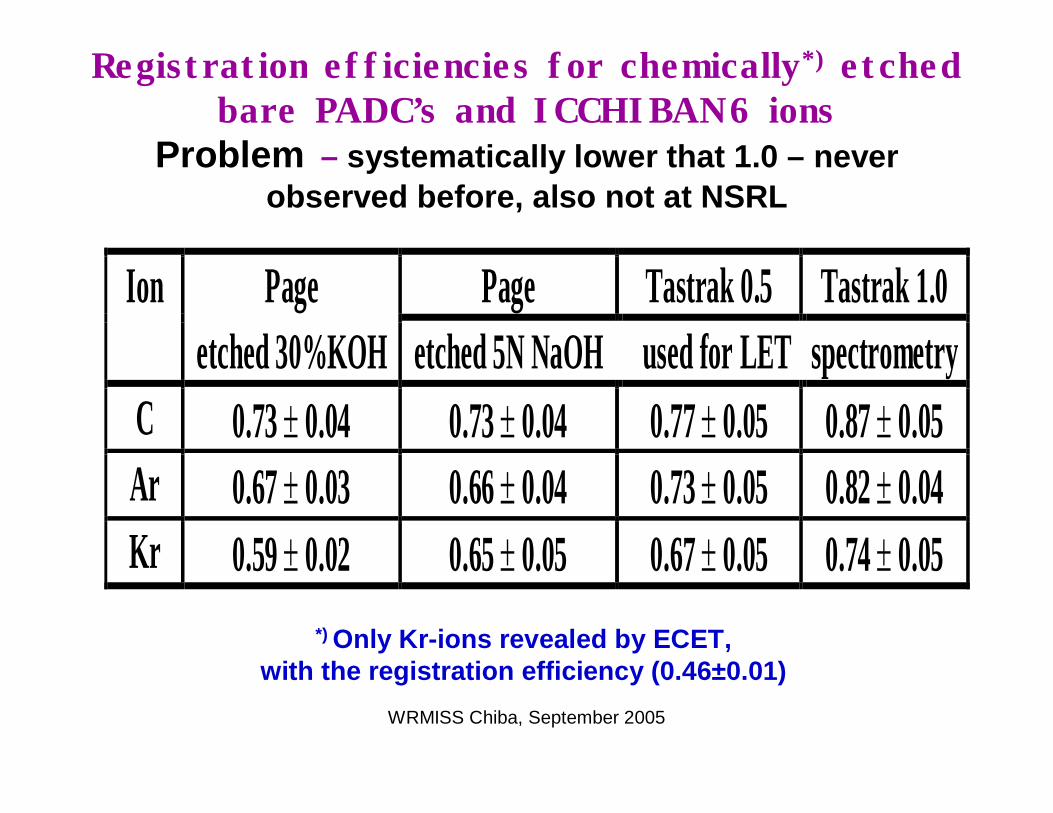
Registration efficiencies for chemically*) etchedbare PADC’s and ICCHIBAN6 ions
Problem – systematically lower that 1.0 – never observed before, also not at NSRL
Ion Page Page Tastrak 0.5 Tastrak 1.0 etched 30%KOH etched 5N NaOH used for LET spectrometry
C 0.73 ± 0.04 0.73 ± 0.04 0.77 ± 0.05 0.87 ± 0.05 Ar 0.67 ± 0.03 0.66 ± 0.04 0.73 ± 0.05 0.82 ± 0.04 Kr 0.59 ± 0.02 0.65 ± 0.05 0.67 ± 0.05 0.74 ± 0.05
*) Only Kr-ions revealed by ECET,
with the registration efficiency (0.46±0.01)
WRMISS Chiba, September 2005
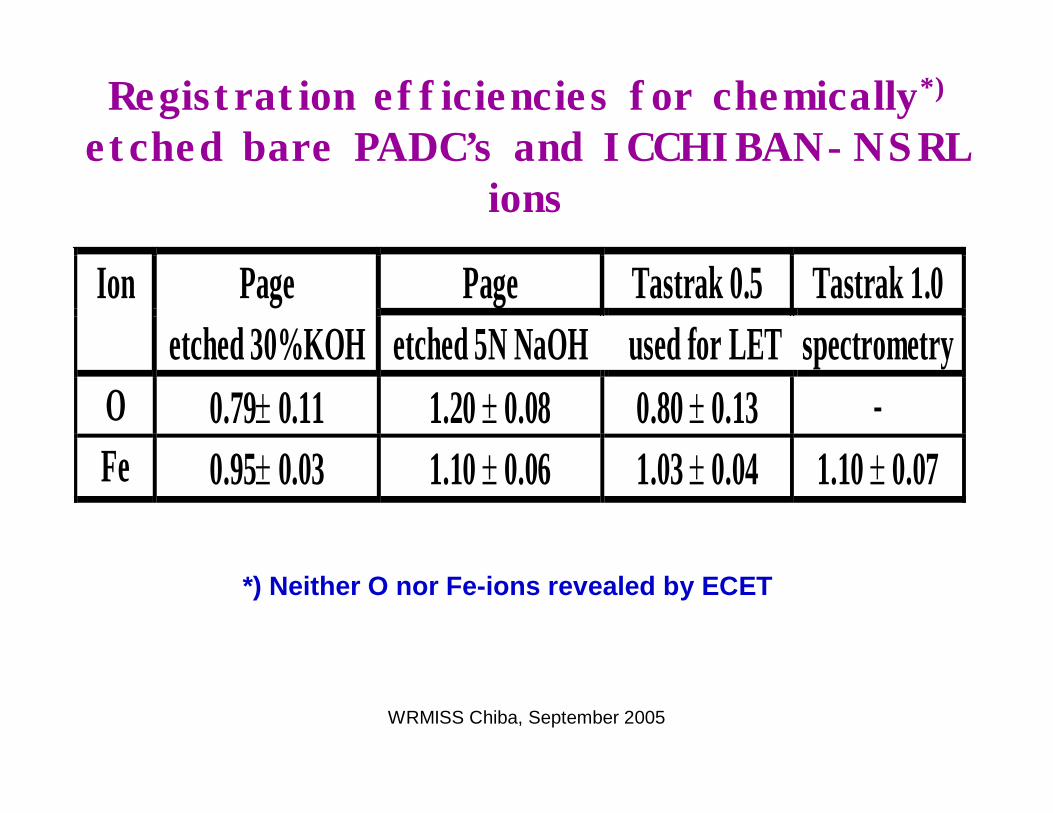
Registration efficiencies for chemically*)
etched bare PADC’s and ICCHIBAN-NSRL ions
Ion Page Page Tastrak 0.5 Tastrak 1.0 etched 30%KOH etched 5N NaOH used for LET spectrometry
O 0.79± 0.11 1.20 ± 0.08 0.80 ± 0.13 - Fe 0.95± 0.03 1.10 ± 0.06 1.03 ± 0.04 1.10 ± 0.07
*) Neither O nor Fe-ions revealed by ECET
WRMISS Chiba, September 2005
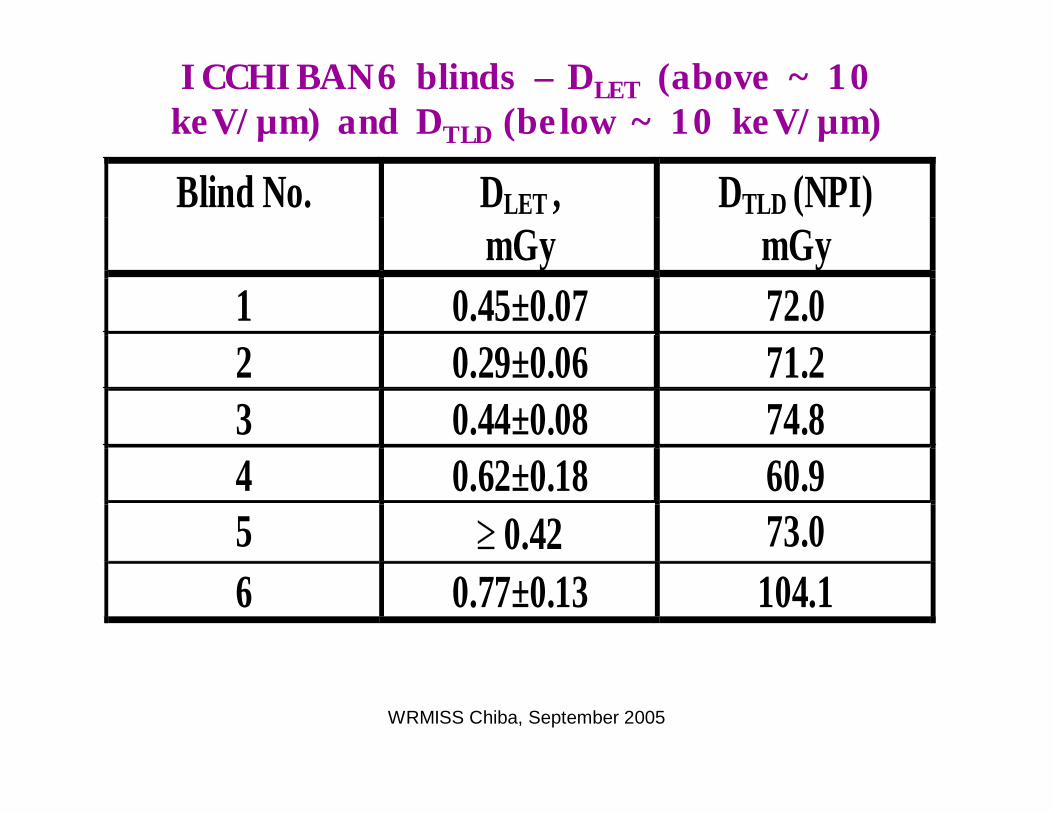
ICCHIBAN6 blinds – DLET (above ~ 10 keV/µm) and DTLD (below ~ 10 keV/µm)
Blind No. DLET , DTLD (NPI) mGy mGy
1 0.45±0.07 72.0 2 0.29±0.06 71.2 3 0.44±0.08 74.8 4 0.62±0.18 60.9 5 ³ 0.42 73.0 6 0.77±0.13 104.1
WRMISS Chiba, September 2005
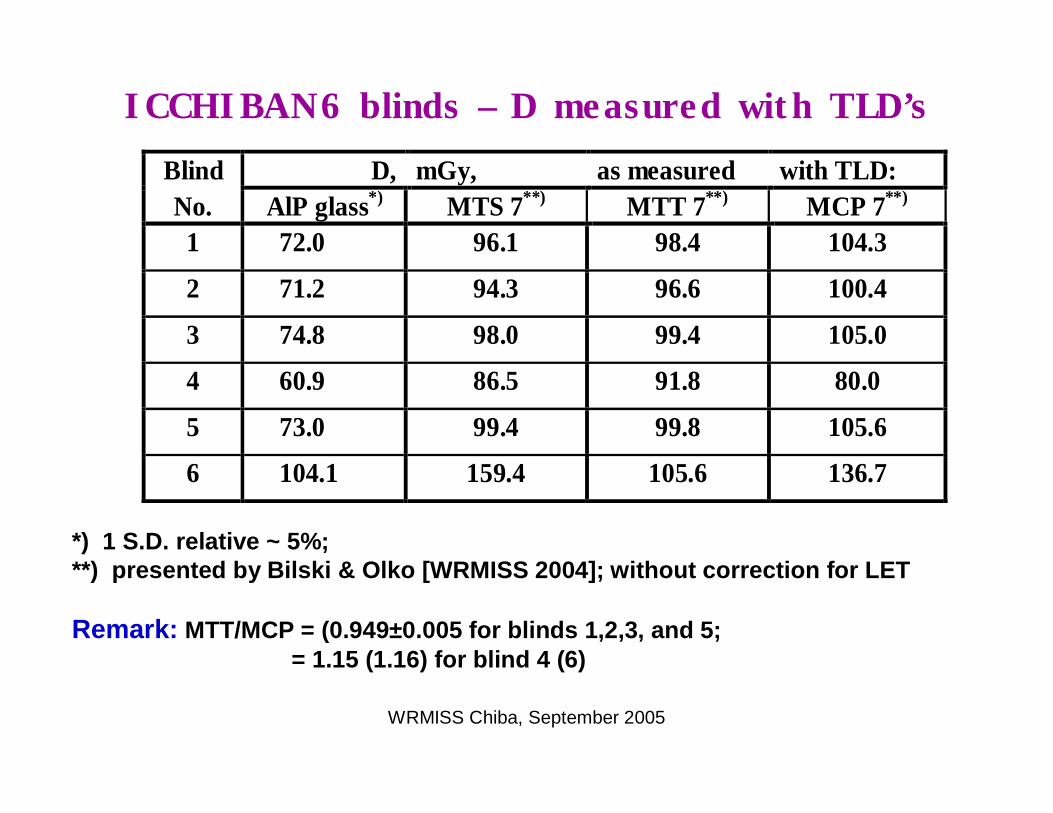
ICCHIBAN6 blinds – D measured with TLD’sBlind D, mGy, as measured with TLD: No. AlP glass*) MTS 7**) MTT 7**) MCP 7**) 1 72.0 96.1 98.4 104.3
2 71.2 94.3 96.6 100.4
3 74.8 98.0 99.4 105.0
4 60.9 86.5 91.8 80.0
5 73.0 99.4 99.8 105.6
6 104.1 159.4 105.6 136.7
*) 1 S.D. relative ~ 5%; **) presented by Bilski & Olko [WRMISS 2004]; without correction for LET
Remark: MTT/MCP = (0.949±0.005 for blinds 1,2,3, and 5;= 1.15 (1.16) for blind 4 (6)
WRMISS Chiba, September 2005
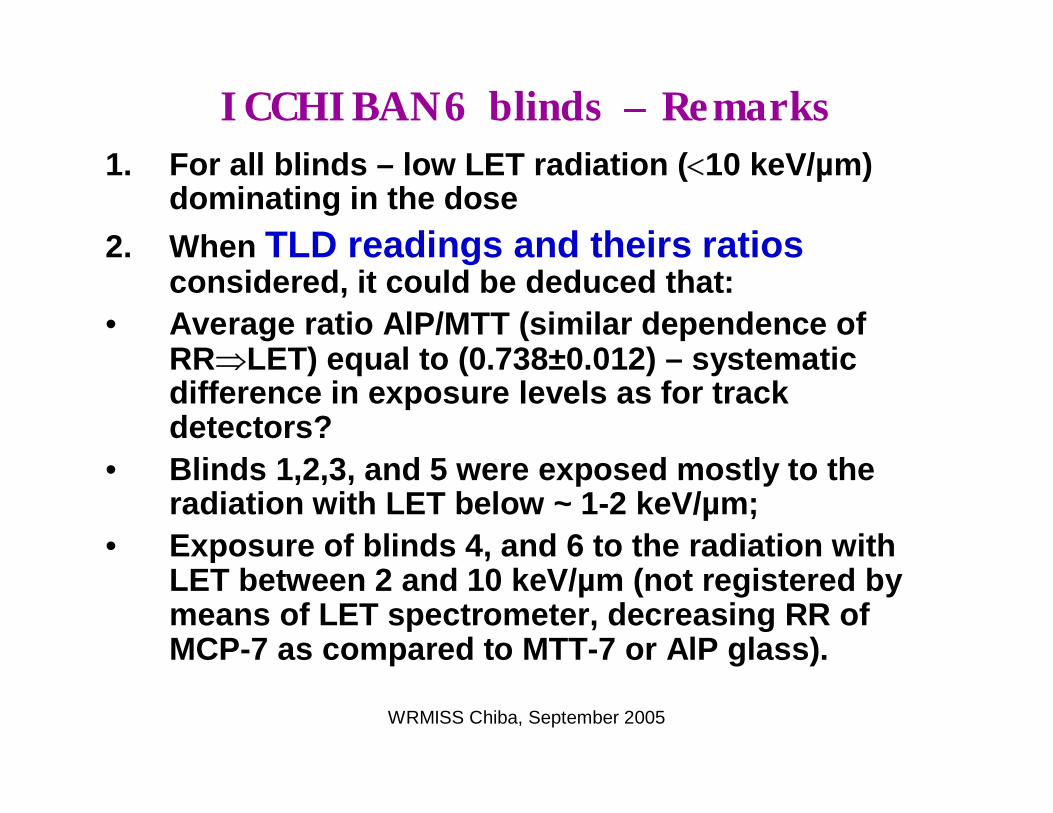
ICCHIBAN6 blinds – Remarks1. For all blinds – low LET radiation (<10 keV/µm)
dominating in the dose2. When TLD readings and theirs ratios
considered, it could be deduced that:• Average ratio AlP/MTT (similar dependence of
RRÞLET) equal to (0.738±0.012) – systematic difference in exposure levels as for track detectors?
• Blinds 1,2,3, and 5 were exposed mostly to the radiation with LET below ~ 1-2 keV/µm;
• Exposure of blinds 4, and 6 to the radiation with LET between 2 and 10 keV/µm (not registered by means of LET spectrometer, decreasing RR of MCP-7 as compared to MTT-7 or AlP glass).
WRMISS Chiba, September 2005
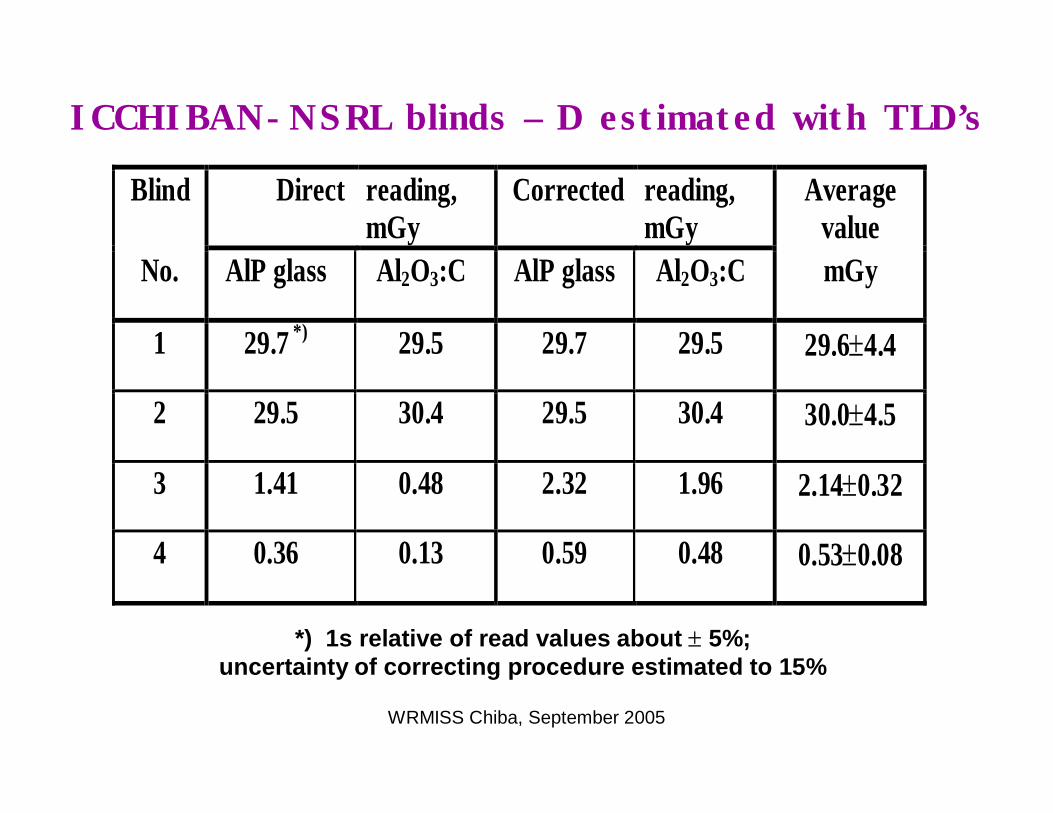
ICCHIBAN-NSRL blinds – D estimated with TLD’s
Blind Direct reading, mGy
Corrected reading, mGy
Average value
No. AlP glass Al2O3:C AlP glass Al2O3:C mGy
1 29.7 *) 29.5 29.7 29.5 29.6±4.4
2 29.5 30.4 29.5 30.4 30.0±4.5
3 1.41 0.48 2.32 1.96 2.14±0.32
4 0.36 0.13 0.59 0.48 0.53±0.08
*) 1s relative of read values about ± 5%;
uncertainty of correcting procedure estimated to 15%
WRMISS Chiba, September 2005
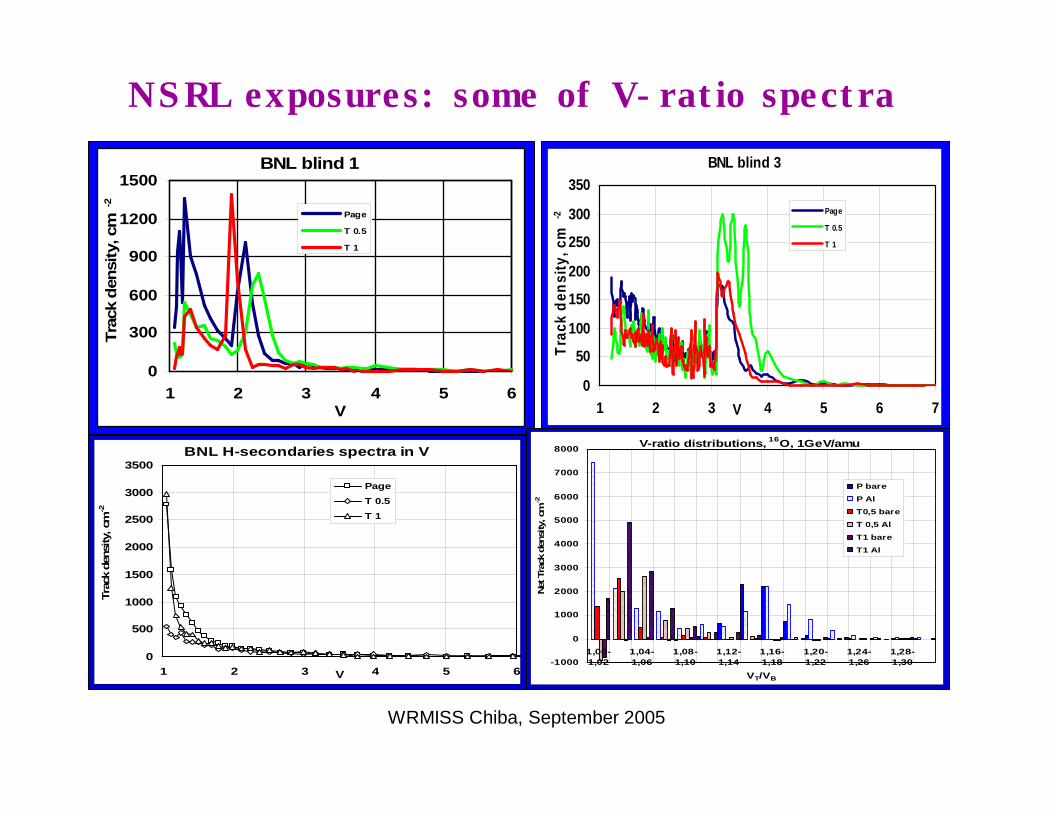
NSRL exposures: some of V-ratio spectraBNL blind 1
0
300
600
900
1200
1500
1 2 3 4 5 6V
Trac
k de
nsity
, cm
-2
Page
T 0.5
T 1
BNL blind 3
0
50
100
150
200
250
300
350
1 2 3 4 5 6 7V
Trac
k de
nsity
, cm
-2 Page
T 0.5
T 1
BNL H-secondaries spectra in V
0
500
1000
1500
2000
2500
3000
3500
1 2 3 4 5 6V
Trac
k de
nsity
, cm
-2
PageT 0.5T 1
V-ratio distributions, 16O, 1GeV/amu
-1000
0
1000
2000
3000
4000
5000
6000
7000
8000
1,00-1,02
1,04-1,06
1,08-1,10
1,12-1,14
1,16-1,18
1,20-1,22
1,24-1,26
1,28-1,30
VT/VB
Net
Tra
ck d
ensi
ty, c
m-2
P bareP AlT0,5 bareT 0,5 AlT1 bareT1 Al
WRMISS Chiba, September 2005
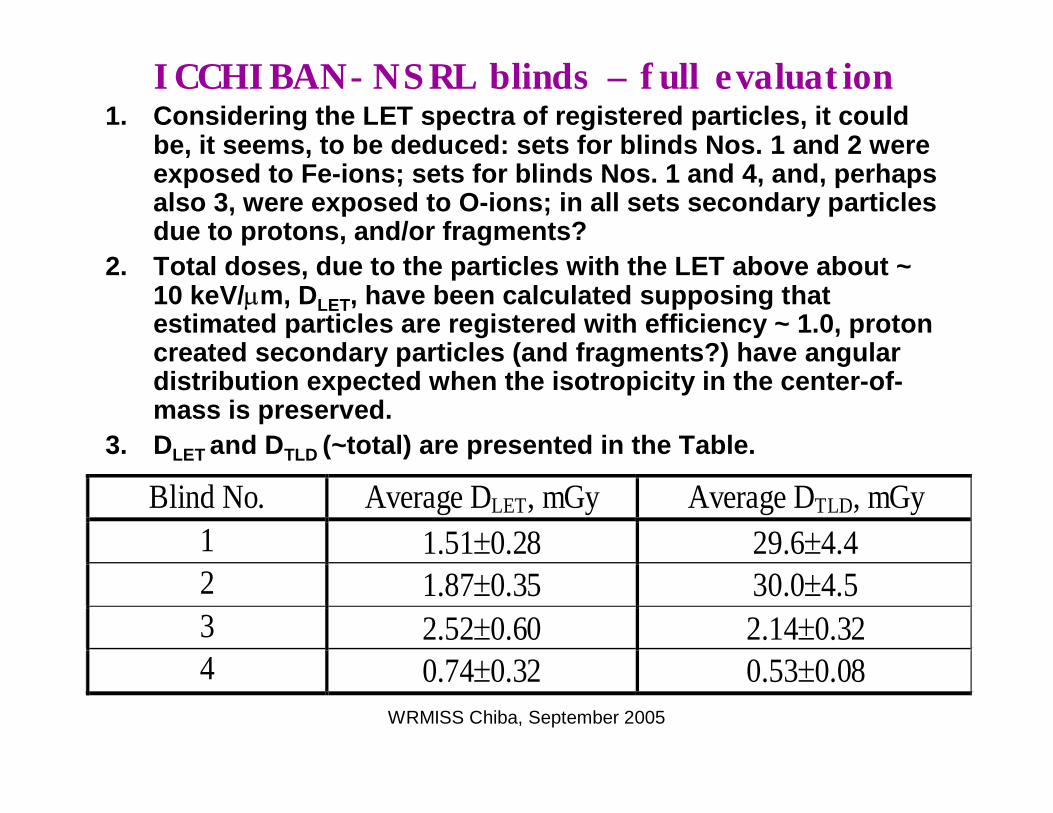
ICCHIBAN-NSRL blinds – full evaluation1. Considering the LET spectra of registered particles, it could
be, it seems, to be deduced: sets for blinds Nos. 1 and 2 were exposed to Fe-ions; sets for blinds Nos. 1 and 4, and, perhaps also 3, were exposed to O-ions; in all sets secondary particles due to protons, and/or fragments?
2. Total doses, due to the particles with the LET above about ~ 10 keV/mm, DLET, have been calculated supposing that estimated particles are registered with efficiency ~ 1.0, protoncreated secondary particles (and fragments?) have angular distribution expected when the isotropicity in the center-of-mass is preserved.
3. DLET and DTLD (~total) are presented in the Table.
Blind No. Average DLET, mGy Average DTLD, mGy 1 1.51±0.28 29.6±4.4 2 1.87±0.35 30.0±4.5 3 2.52±0.60 2.14±0.32 4 0.74±0.32 0.53±0.08
WRMISS Chiba, September 2005
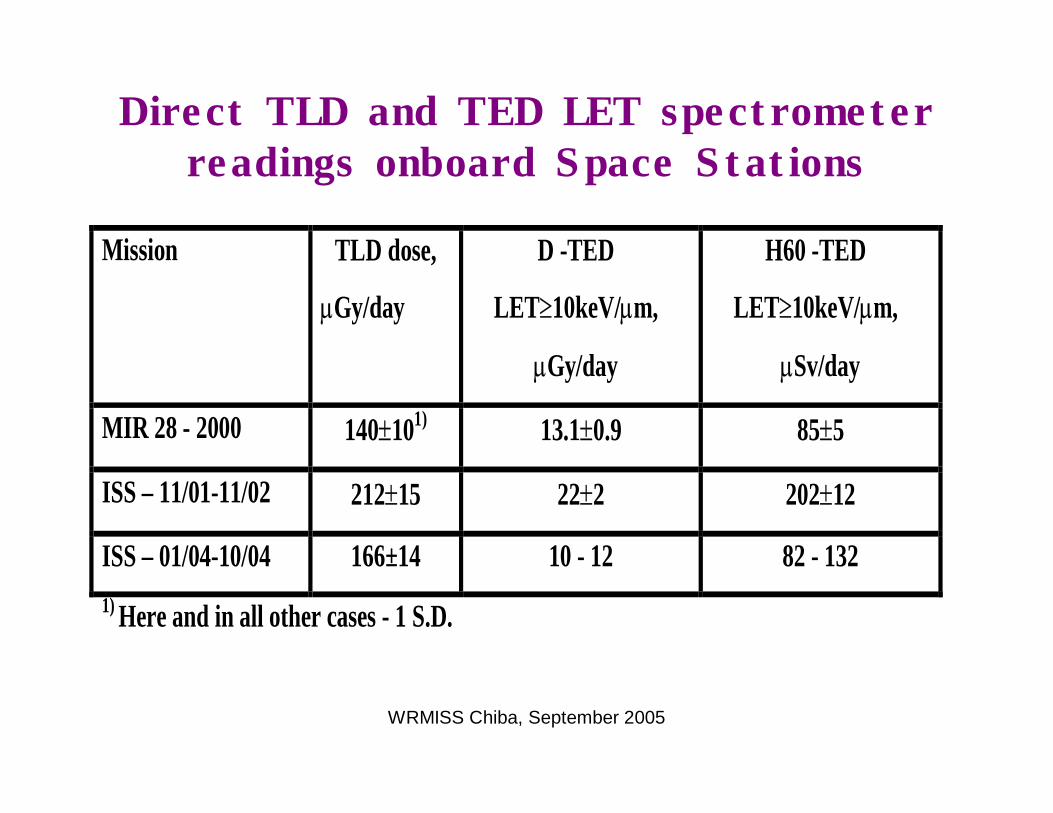
Direct TLD and TED LET spectrometer readings onboard Space Stations
Mission TLD dose,
mGy/day
D -TED
LET³10keV/mm,
mGy/day
H60 -TED
LET³10keV/mm,
mSv/day
MIR 28 - 2000 140±101) 13.1±0.9 85±5
ISS – 11/01-11/02 212±15 22±2 202±12
ISS – 01/04-10/04 166±14 10 - 12 82 - 132 1) Here and in all other cases - 1 S.D.
WRMISS Chiba, September 2005
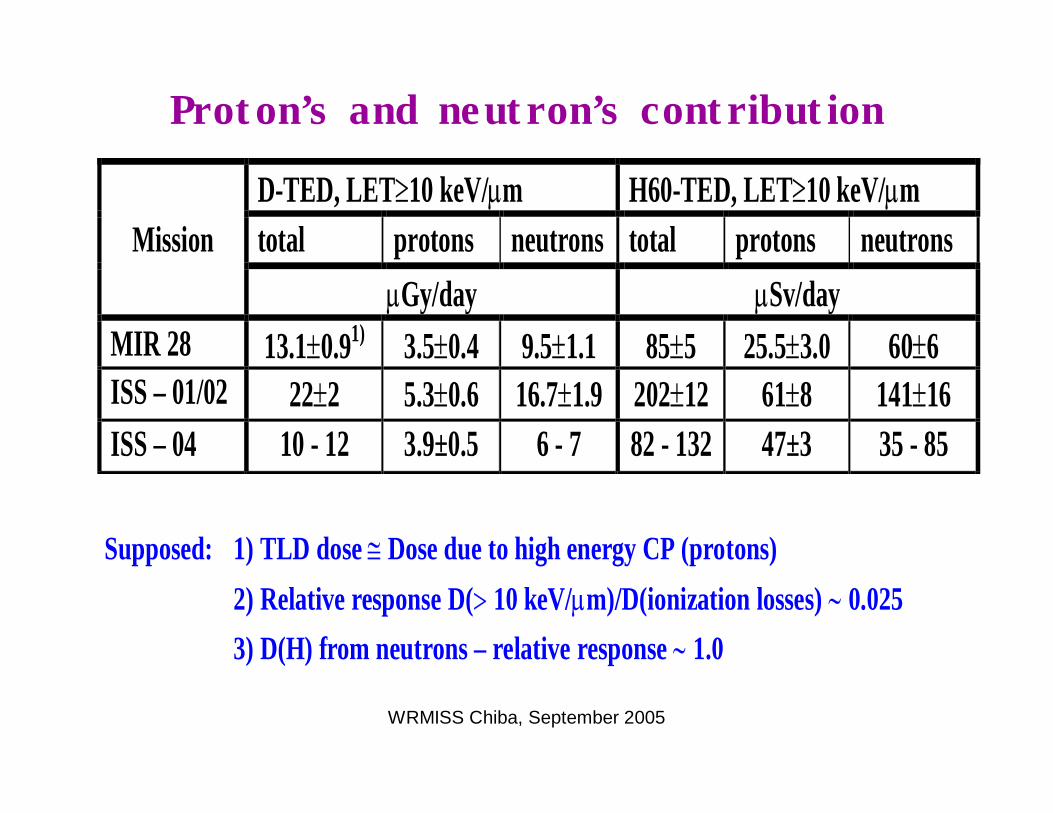
Proton’s and neutron’s contribution
Supposed: 1) TLD dose @ Dose due to high energy CP (protons) 2) Relative response D(> 10 keV/mm)/D(ionization losses) ~ 0.025 3) D(H) from neutrons – relative response ~ 1.0
D-TED, LET³10 keV/mm H60-TED, LET³10 keV/mm Mission total protons neutrons total protons neutrons
mGy/day mSv/day MIR 28 13.1±0.91) 3.5±0.4 9.5±1.1 85±5 25.5±3.0 60±6 ISS – 01/02 22±2 5.3±0.6 16.7±1.9 202±12 61±8 141±16 ISS – 04 10 - 12 3.9±0.5 6 - 7 82 - 132 47±3 35 - 85
WRMISS Chiba, September 2005
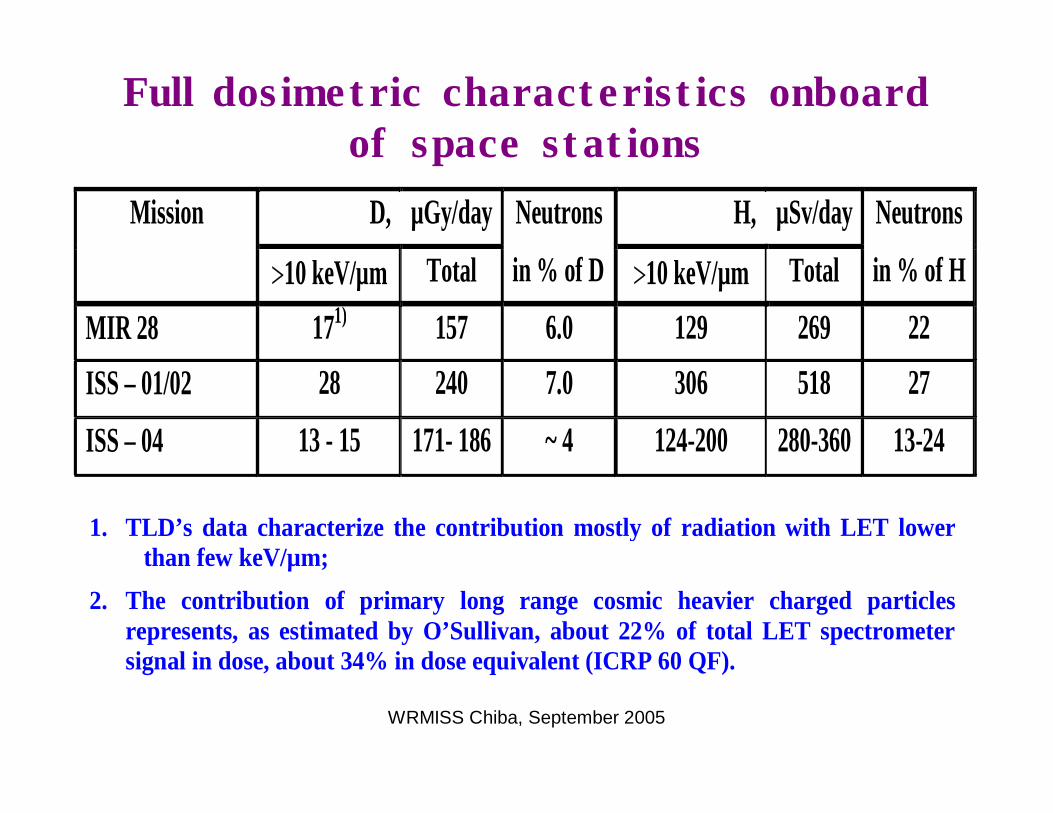
Full dosimetric characteristics onboard of space stations
1. TLD’s data characterize the contribution mostly of radiation with LET lower than few keV/µm;
2. The contribution of primary long range cosmic heavier charged particles represents, as estimated by O’Sullivan, about 22% of total LET spectrometer signal in dose, about 34% in dose equivalent (ICRP 60 QF).
Mission D, µGy/day Neutrons H, µSv/day Neutrons >10 keV/µm Total in % of D >10 keV/µm Total in % of H MIR 28 171) 157 6.0 129 269 22 ISS – 01/02 28 240 7.0 306 518 27 ISS – 04 13 - 15 171- 186 ~ 4 124-200 280-360 13-24
WRMISS Chiba, September 2005
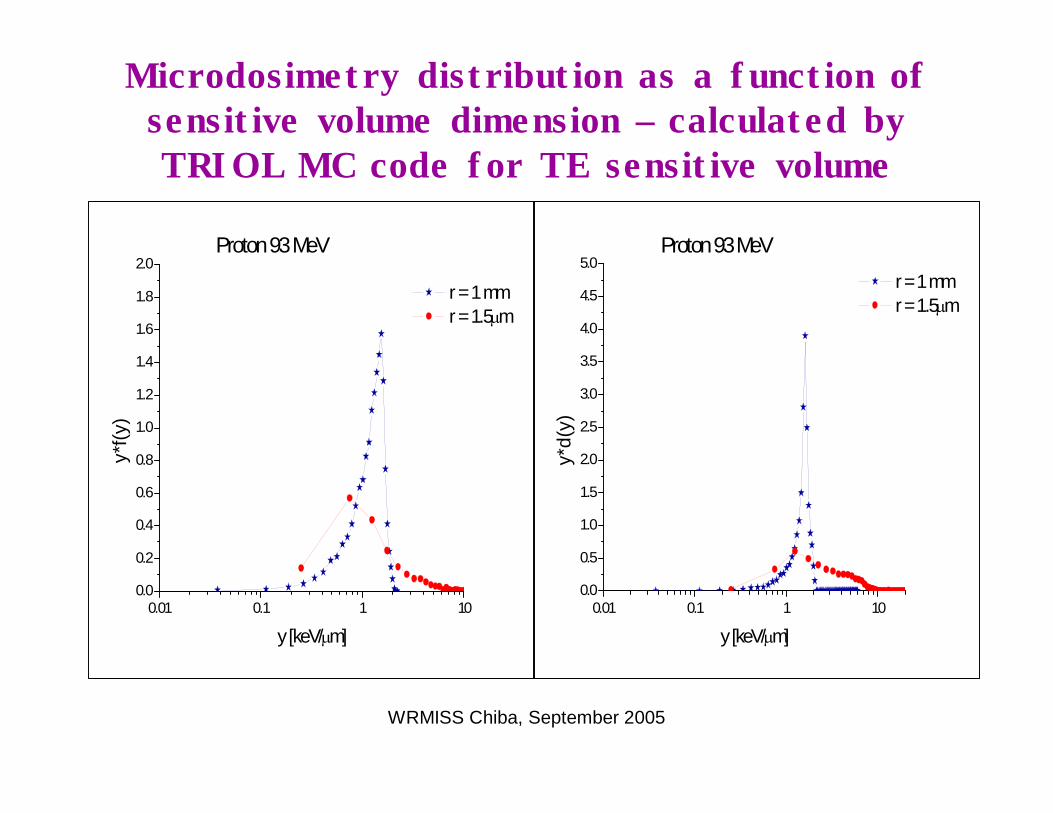
Microdosimetry distribution as a function of sensitive volume dimension – calculated by TRIOL MC code for TE sensitive volume
0.01 0.1 1 100.0
0.2
0.4
0.6
0.8
1.0
1.2
1.4
1.6
1.8
2.0
r = 1 mm r = 1.5mm
y*f(y
)
y [keV/mm]
Proton 93 MeV
0.01 0.1 1 100.0
0.5
1.0
1.5
2.0
2.5
3.0
3.5
4.0
4.5
5.0 r = 1 mm r = 1.5mm
y*d(
y)
y [keV/mm]
Proton 93 MeV
WRMISS Chiba, September 2005
• Many of results presented in this contribution were obtained as part of the ICCHIBAN research project using heavy Ions at HIMAC-NIRS, NSRL–BNL, nuclotron JINR Dubna, and protons at Loma Linda UMC. We are much obliged to the staff of all laboratories and, particularly, to organizers of the run, Y. Uchihori, J. Miller, E.R. Benton, A.G. Molokanov, and V.P. Bamblevski for their help. We are also much obliged to our colleagues from the IMBP of the Russian Academy of Sciences, V.A. Shurshakov, and Y.A. AkatovMoscow for their help in the studies performed onboard of ISS. Also we thank to P.Bilski and P. Olko (UFJ Krakow) for TLD cooperation
• Studies were also partially supported through the grant No. 202/04/0795 of the GA CR and the IRP AV0Z10480505.
Acknowledgements
WRMISS Chiba, September 2005
Thank you for your attention !
![THE DOSIMETRY OF IONIZING RADIATIONLiving Cells" [5] is still a classic; the premature death of Lea (1947) interrupted a promising development. Microdosimetry in its present sense](https://img.pdfslide.us/doc/110x75/60cb94c04af4b8190366c439/the-dosimetry-of-ionizing-radiation-living-cells-5-is-still-a-classic-the.jpg)