Embed Size (px)
Citation preview

Doppler Ultrasound: Principles


Doppler Effect
• Shift in perceived frequency when either source or listener are moving relative to one another
• Familiar occurrence in audible sounds• Also occurs in medical ultrasound

Waves from stationary and moving sources
Stationary Moving

Please note: the ‘squishing’ of the wave-fronts in the middle diagram and the stretching in the lower diagram are exaggerated. Realistically the Doppler shifts are so small in ultrasound you would hardly see any difference in the wave-fronts compared to the unshifted one on top. These are artists’ diagrams.

Doppler shift
• Doppler shift is the difference between the transmitted and received frequencies.
• Transmitted and received frequencies are in the MHz range
• Doppler shift frequencies often in audible range

Scattering from blood
• Source of signals for flow imaging:– Red blood cells– Much smaller than l– Rayleigh scatterers
• Scattering increases with frequency
• Scattering increases with number of targets– Double the number of
scatterers, scattered intensity doubles!

Scattering from blood increases with frequency
• Blood behaves as Rayleigh scatterers– Intensity varies with f4
– Double the frequency, intensity increases by 2 x 2 x 2 x 2 = 16!
• High frequency enhances blood signals if the path is short
• Attenuation prohibits use of super high frequencies in most areas
40 MHz IVUS image of a coronary artery

Doppler equation
• Relationship between Doppler shift (or just Doppler) frequency, FD and reflector velocity, v:
• fo is the ultrasound frequency, or the transmitted beam frequency.
• v is the reflector velocity (m/s; cm/s)• q is the Doppler angle• c is the speed of sound
c
cosθv2fF o
D

c
cosθv2fF o
D

c
cosθv2fF o
D

If the beam direction is perpendicular to the direction of flow, the Doppler frequency is ZERO!
c
cosθv2fF o
D
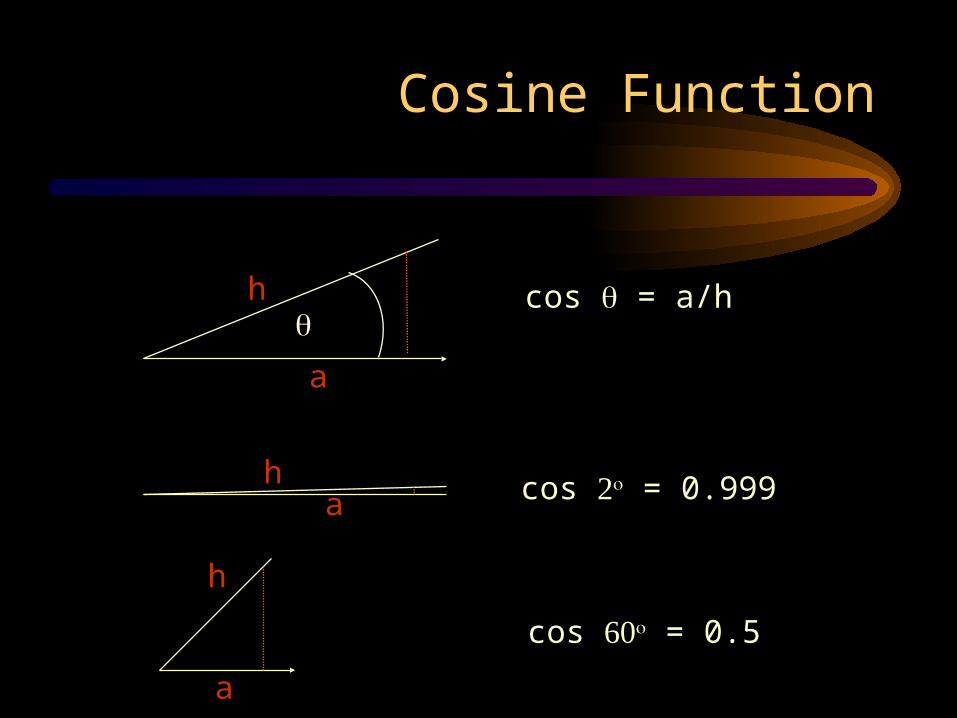
Cosine Function
q
a
h cos q = a/h
cos 2o = 0.999ah
a
cos 60o = 0.5
h

The frequency of the Doppler shift is proportional to the cosine of the Doppler angle
• Angle formed by the ultrasound beam and the direction of flow
• Doppler frequency varies with the cosine of the angle.– Cosine = 1 for 0o
– Cosine = ½ for 60o
– Cosine = 0 for 90o
– For angles between 0 and 10o, cosine is close to 1.
• The larger the angle (up to 90o), the smaller the cosine
c
cosθv2fF o
D

Angle Correct Cursor
• Angle correct is needed to convert the Doppler frequency to a reflector velocity
• Operator adjusts the cursor parallel to the flow direction
• Machine then computes the Doppler angle

Angle Correct Cursor
• Angle correct is needed to convert the Doppler frequency to a reflector velocity
• Operator adjusts the cursor parallel to the flow direction
• Machine then computes the Doppler angle
• Most displays indicate the reflector velocity rather than Doppler frequency

Angle Correct Error
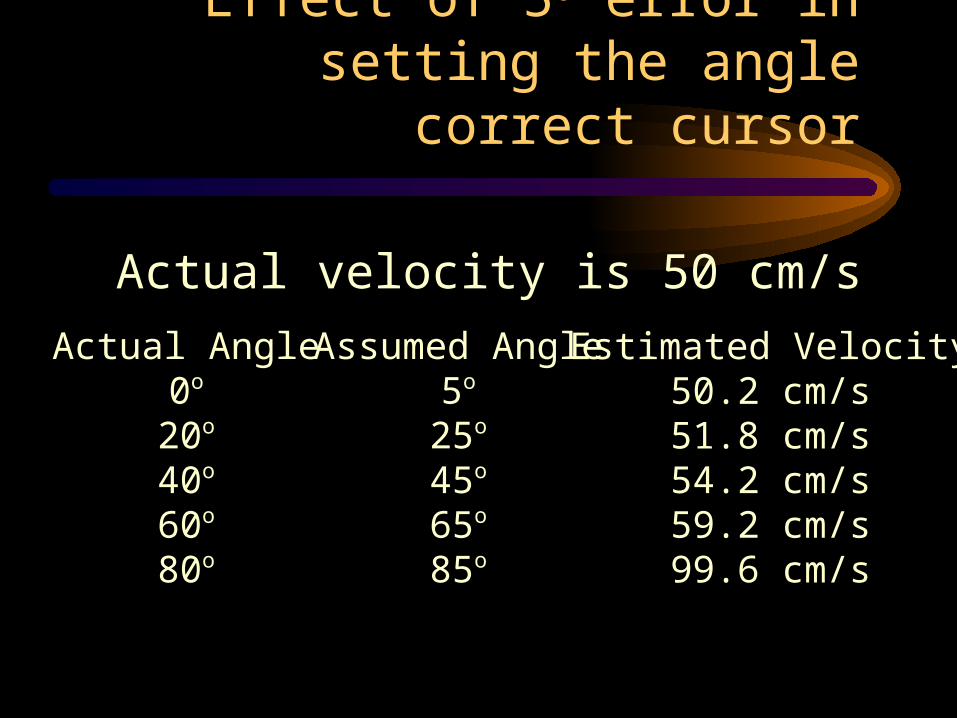
Effect of 5o error in setting the angle correct cursor
Actual Angle0o
20o
40o
60o
80o
Assumed Angle5o
25o
45o
65o
85o
Estimated Velocity50.2 cm/s51.8 cm/s54.2 cm/s59.2 cm/s99.6 cm/s
Actual velocity is 50 cm/s

Flow Patterns
• Laminar flow– Highest in center– Zero at wall
• Turbulent flow– Larger distribution
of velocities

Ways to “analyze” complex Doppler signals
• Listen to signals on the loudspeaker– Ear is sensitive to variations in loudness, pitch– Interpretation is subjective
• Display analog signal derived from velocity or flow rate– Example: zero crossing detector
• Display Doppler signal spectrum– Usually displayed as a velocity spectral waveform

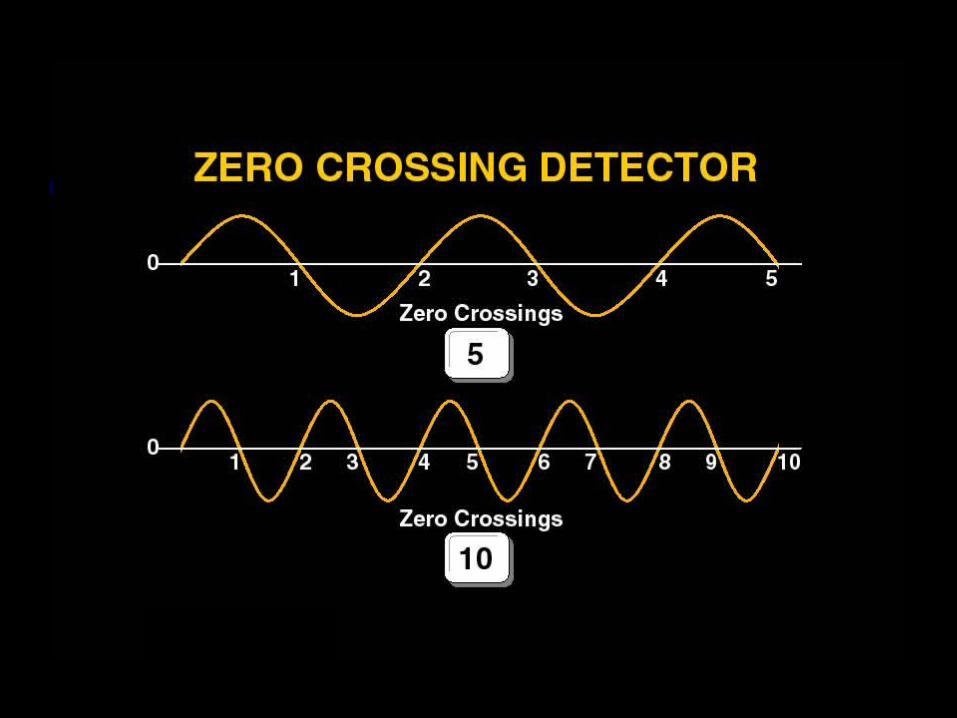

Doppler Instrument with built-in Zero-Crossing Detector
• Provides an estimate of Doppler signal frequency vs. time.
• Output may be to a chart recorder.
• Output may also be superimposed on a spectral display (rare).

Spectral analysis done using a FFT deviceFFT = Fast Fourier Transform

Fre
quen
cy (
kHz)

Spectral Display (Frequency)

Calculate Velocity from Doppler Frequency
2fD
c
cosθv2fF o
D
cosθ2f
F cv
o
Dnote

Spectral Display (velocity)


Mirror Image Artifact (Spectral Doppler)
Origin of artifact:- ~ perpendicular to flow;- over gaining

“Simplified” Doppler equation(When the Doppler angle is zero)
V F)kHz3.1(F
or
kHz V F3.110 x 1.54
V F /s10 x 2
m/s 10 x 1.54
m/s V x /s10 x F 2
c
v2fF
D
3
6
3
6o
D
• Let f0 be expressed as “F (MHz)”, such as 3, 5, etc; let v be V m/s; also, let c=1540m/s

74. With Doppler ultrasound, if the echo frequency is lower than the transmitted frequency, we can conclude that the reflector is moving _______ the transducer.
A. toward
B. away from
C. perpendicular to
D. at a 60o angle to

75. If blood is flowing directly toward a 5 MHz transducer at 2 m/s, the Doppler frequency would be:A. 1.3 Hz B. 13 kHzC. 4.087 MHzD. 13 MHz
s/x1098.12m/s1.54x10
2m/s/s)(5x102
c
v2f
c
cosθv2fF 3
3
6oo
D

75. If blood is flowing directly toward a 5 MHz transducer at 2 m/s, the Doppler frequency would be:A. 1.3 Hz B. 13 kHzC. 4.087 MHzD. 13 MHz
V F)kHz3.1(FD

76. The pressure amplitude of scattered echoes from red blood cells that produce Doppler signals is LEAST affected by:
A. speed of sound
B. attenuation by soft tissue
C. transducer frequency
D. hematocrit

77. A peak Doppler shift of 4 kHz is detected in a large artery. If the peak velocity in the vessel were to double, the detected peak Doppler shift would be:
A. 2 kHzB. 4 kHzC. 8 kHzD. 16 kHz
78. A 5 MHz transducer detects a peak Doppler shift of 12 kHz in an artery. With a 2.5 MHz transducer, the same vessel would be expected to produce a peak Doppler shift of:A. 6 kHzB. 12 kHzC. 24 kHzD. 10 MHz

79. An artery is interrogated with a 2 MHz beam with a Doppler angle of 45o. A peak Doppler shift of 1.8 kHz is detected. If the Doppler angle is increased to 60o, you would expect the peak Doppler shift to be:
A. 1.3 kHz
B. 1.8 kHz
C. 2.1 kHz
D. 2.3 kHz

80. A small error in the estimation of the Doppler angle will result in the largest velocity miscalculations when the Doppler angle is:
A. 0o
B. 10o
C. 45o
D. 80o

81. A Doppler device without a spectral analyzer can NOT display:
A. peak velocity
B. mean velocity
C. velocity changes over time
D. instantaneous distribution of velocities

82. On most instruments, the wall filter eliminates: ________ signals.:
A. low amplitudeB. high amplitudeC. low frequencyD. high frequency

Basic Hemodynamics
• Vascular system– Arrangements of pumps, conduits,
valves– Aorta-arteries-arterioles-
capillaries-venules-veins-vena cava
• Travels from high to low pressure– Pressure gradient exists over any
region– Total area of vasculature system
varies with distance from the heart
Pulse Pressure = systolic pressure - ??
= measure of amplitude of blood pressure wave

Laminar Flow
• Ideal model• Highest velocity in center, lowest near
walls• Tortuousity, bends, branching all
change the velocity profile
r

Laminar Flow
• Energy associated with moving fluid– Potential
• Elastic expansion of vessels, like stretching a spring
– Kinetic • Energy due to motion and related to the
velocity
• Viscous losses tend to dissipate the energy with increasing distance
L
P2 P1
r

Poiseuille (pwazourz)Schooled in physics and mathematics Poiseuille developed an improved method for measuring blood pressure. Poiseuille’s interest in the forces that affected the blood flow in small blood vessels caused him to perform meticulous tests on the resistance of flow of liquids through capillary tubes. In 1846, he published a paper on his experimental research. Using compressed air, Poiseuille forced water (instead of blood due to the lack of anti-coagulants) through capillary tubes. Because he controlled the applied pressure and the diameter of the tubes, Poiseuille’s measurement of the amount of fluid flowing showed there was a relationship. He discovered that the rate of flow through a tube increases proportionately to the pressure applied and to the fourth power of the tube diameter. Failing to find the constant of proportionality, that work was left to two other scientists, who later found it to be p/8. In honor of his early work the equation for flow of liquids through a tube is called Poiseuille's Law.

Laminar Flow
• V = velocity (cm/s, m/s)• Q = volume flow rate (cm3/s,
l/s)• Pressure Volume relationship• P2 and P1 are pressures, r is
the radius, L is the length, and h is the coefficient of viscosity.
• Viscosity: measure of a fluid’s resistance to flow; describes the internal frictionof a moving fluid– Syrup has a high viscosity– Water has a low viscosity
L
rPPQ
8
)( 421
L
P1 P2
rPoiseuille equation

Bernoulli Equation(Expresses conservation of energy)
Constant2
1 2 gzVP
Constant2
1 2 gzVP
Constant
2
1 2 gzVP
Constant2
1 2 gzVP
The simplified version of the Bernoulli Equation is
where P, r, V, and z are pressure, density, velocity and height, respectively, and g is the acceleration due to gravity. The fact that the terms on the left sum up to a constant means that if V increases, P must decrease to keep the quantity a constant.
The Bernoulli principle helps to explain how an airplane wing works. The greater velocities just above the wing result in a lower pressure on the top-front of the wing than on the undersurface, hence an upward force. (Lift also can be associated with a downward component of the air to the rear; Newton’s third law says there must be an upward lift.)

Applying the Bernoulli Equation(Expresses conservation of energy)
2
225
222
4
or
988.31001.1
530760530
2
1
VP
VVx
xVVP
Constant2
1 2 gzVP
Constant2
1 2 gzVP
Constant
2
1 2 gzVP
The modified Bernoulli Equation is
where DP now is in mm Hg and V is in m/s. The density, r, of blood is taken to be 1060 kg/m3, and the term 760/1.01 x 105 converts pressure from n/m2 to mm Hg.
P1 P2
2221
21
222
211
2
2
1PP
usually but 2
1P
2
1P
Constant2
1
V
VV
VV
gzVP

Applying the Bernoulli Equation(Expresses conservation of energy)
Constant2
1 2 gzVP
Constant2
1 2 gzVP
Constant
2
1 2 gzVP
2
225
222
4
or
988.31001.1
530760530
2
1
VP
VVx
xVVP
The modified Bernoulli Equation is
where DP now is in mm Hg and V is in m/s. The density, r, of blood is taken to be 1060 kg/m3, and the term 760/1.01 x 105 converts pressure from n/m2 to mm Hg. The pressure drop on the left is about 4 x (5.8)2 = 135 mm Hg.

Velocity Profiles

Continuous Wave (CW) Doppler
• Ultrasound transmitted continuously rather than in pulses
• Some units have two-element transducers, 1 transmitting, the other receiving
• Arrays are sometimes used with CW; different groups transmit than recieve

~MHz
~MHz
Difference(audible)

Common user controls:- Volume- Gain (sometimes)- Wall filter (sometimes)

Directional Doppler
• Usually want to know whether flow is towards or away from the transducer
• Quadrature detection is used
• Tracing shows velocities above and below the baseline
• Speakers present velocities on left or right speaker, depending on direction

Range (depth) selection done by a procedure called “gating”Gating +beam dimensions, define “sample volume”


Pulsed Doppler Important User Controls
• Output• Frequency (may be different than B-mode frequency)• Gain• Wall filter• Gate position• Gate size (SV length)• Beam angle• Angle Correct• Velocity scale (prf)• Spectral Display Sweep speed• Gray scale maps• ….

Sample Volume (gate)


Nyquist Sampling Limit
• Require PRF = 2 x Doppler Frequency
• Example, 3 kHz Doppler signal– Need 6 kHz PRF to sample
• Example, 6 kHz Doppler signal– Need 12 kHz PRF to sample

Nyquist Sampling Limit
• The Maximum Doppler frequency that can be sampled is ½ the PRF
• Example, if PRF = 8 kHz– Max Doppler frequency is 4 kHz
• Example, if PRF = 4 kHz– Max Doppler frequency is 2 kHz

If the Doppler frequency exceeds ½ the PRF, aliasing occurs
Aliasing produces false frequencies, reversal, etc.

Manifestation of Aliasing

After increasing the Velocity Scale(automatically increases the PRF)
PRF
• Maximum PRF depends on depth of sample volume– When sample volume is shallow, PRF can
be higher– When it is deep, PRF must be lower
• Thus, for a given ultrasound frequency, a higher velocity can be detected at shallower depths than at deeper depths.

To get rid of aliasing:
• Change the velocity scale
• Change the baseline
• Use a lower ultrasound frequency
• Get closer!

Advantages of Pulsed Doppler
• Precise depth at which flow is detected can be specified
• Flow information from a small portion of a vessel can be isolated and analyzed without interference from flow in adjacent areas

Advantages of CW Doppler
• Instruments can be made extremely simple, inexpensive
• Useful when you do not have good information (such as a B-mode image) to help pinpoint vessel of interest
• DOES NOT ALIAS

Maximum Detectable Velocity
• Minimum PRF to avoid aliasing = 2 times the Doppler frequency.
• Maximum PRF set by gate depth (must wait between successive transmit pulses).
• Establishes a maximum detectable velocity, that depends on gate depth AND ultrasound frequency.

Maximum Velocity Detectable:
d
c
d
c
o
2
omax 8f4f
c
2v

d
c
d
c
d
cPRFPRF
d
c
TPRF
c
dT
PRF
o
2
omax
max
maxmaxo
Dmin
max
oDmin
oD
8f4f
c
2v
get weVfor Solving2c
v4fF2
be willPRF h thisdetect witcan we velocity maximum The2
1
is havecan wePRF maximum theThus,
2
is T pulses,between wait timeminimum thed, depth, a toimagingBut when c
v4fF2
is aliasing avoid toneed wePRF minimum theso,c
v2fF

Introduces range ambiguity.Allows higher velocities to be detected.

Duplex Mode (Duplex Doppler)
B-mode imaging + Doppler


Frame Rate High
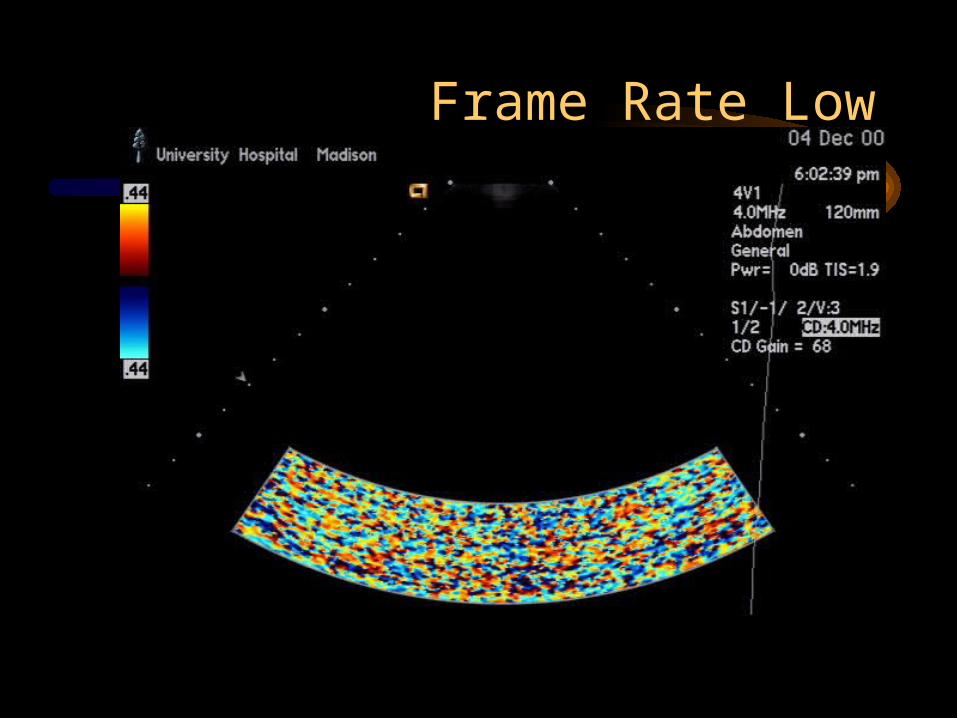
Frame Rate Low

Frame Rate vs Color Box Width
• Wider color box requires more individual color beam lines.
• Each color beam line requires several pulse-echo sequences (pulse-packet size).
• More time is needed to acquire echo data for the wide color box than the narrow color box.
• Lower frame rate for the wide color box.


Flow velocity is usually indicated by color brightness.

In Spectral Doppler, the entire range of velocities within a gated region is displayed. In color, only the mean velocity is displayed from each region.


Variance Display


Most manufacturers allow the operator to select from a variety of color maps.


Color Threshold (emphasis on B-mode)
Only echoes exceeding the gray level indicated by the line through gray bar will be displayed in place of color.

Color Threshold (emphasis on color)
Only echoes exceeding the gray level indicated by the line through gray bar will be displayed in place of color.


Color Aliasing

Energy Mode (Power mode; color power angiography mode)
• Does not display Doppler shift frequency
• Displays amplitude, intensity or energy in the Doppler signal

Direction, Energy vs. Velocity
θ
Energy mode does not display direction.(Energy also not as direction dependent.)Aliasing not displayed in energy mode.

Aliasing, Velocity vs. Energy
Energy mode does not display aliasing.

DigitalDecoder
DigitalEncoder
For each line in the B-Flow image:
1) Transmit coded sound waves
2) Decoder enhances flow signal
3) Flow and tissue displayed as in B-mode
Probe
Body
How B-Flow Images are Formed How B-Flow Images are Formed
LOGIQ 9Bmode Process Display
Monitor
(Slides are based on a set given to Zagzebski by GE Medical. They are presented to attempt to understand B-flow, a complimentary technology to color flow imaging.)

B-flow processing(Previous)How B-Flow images are formed?Digital encoded ultrasound is used as an enabling technology. Coded sound waves are transmitted into the body and vasculature and the returning signals are then decoded and displayed as in B-mode.
(Next)Enhancement of the returned signal from blood reflections is necessary due to the relative weakness of blood reflectors compared to tissue. (Tissue is typically 20 - 30 db > reflective than blood.) Enhancement however increases the tissue signal as well so the tissue must be equalized to show enhancement of the blood reflectors only.
(Slides are based on a set given to Zagzebski by GE Medical. They are presented to attempt to understand B-flow, a complimentary technology to color flow imaging.)

Solution: Use coded excitation to
1) Increase sensitivity to
blood reflectors (codes can
be made sensitive to motion)
2) Equalize tissue signal (not sure how this is done)
Problem:Blood echoes are very weak
Detecting Blood Reflectors
Blood
Tissue
Noise
(Slides are based on a set given to Zagzebski by GE Medical. They are presented to attempt to understand B-flow, a complimentary technology to color flow imaging.)

Decoder
1 0 0 1 1
Tissue EchoTissue Echo
+
Blood EchoBlood Echo• Increase sensitivity to flow• Equalize tissue signal
Blood Reflectors Seen in B-Mode
EncoderBodyBody
1 1 0 0 1
B-Flow ProcessingB-Flow Processing
(Slides are based on a set given to Zagzebski by GE Medical. They are presented to attempt to understand B-flow, a complimentary technology to color flow imaging.)

Conventional Color Doppler Imaging
• Overlay color on B overwrite lumen
Overlay
• Separate B-mode and color firings frame rate hit• Flash artifact obscures anatomy
(Slides are based on a set given to Zagzebski by GE Medical. They are presented to attempt to understand B-flow, a complimentary technology to color flow imaging.)

(Previous)This is where the strength of digital encoded ultrasound lies in that the coded signal may be decoded into separate tissue and blood signals. It is now relatively simple to enhance the blood signal while preserving diagnostic gray scale.
Detecting blood flow with Doppler methods provides valuable diagnostic information. However, Doppler technology constraints limit our ability to detect flow. Limitations such as: • Aliasing • Signal dropout at orthogonal detection angles • Wall filter limitations
(Next)• All affect our ability to detect all types of blood flow. As a B-mode imaging
technology, B-Flow provides direct visualization of blood reflectors with: • High spatial resolution • High frame rates • Blood and tissue displayed together - no overlay • Intuitive display • No complex parameters to optimize
(Slides are based on a set given to Zagzebski by GE Medical. They are presented to attempt to understand B-flow, a complimentary technology to color flow imaging.)

B-Flow Image
B-Flow Image
• Simultaneous tissue and flow without overlay• Intuitive B-mode-like display with full field of view• No separate firings for flow higher frame rate
B-FlowProcess
B-mode Image
B-Flow provides visualization of blood reflectors with: High spatial resolution
High frame rates (Slides are based on a set given to Zagzebski by GE Medical. They are presented to attempt to understand B-flow, a complimentary technology to color flow imaging.)
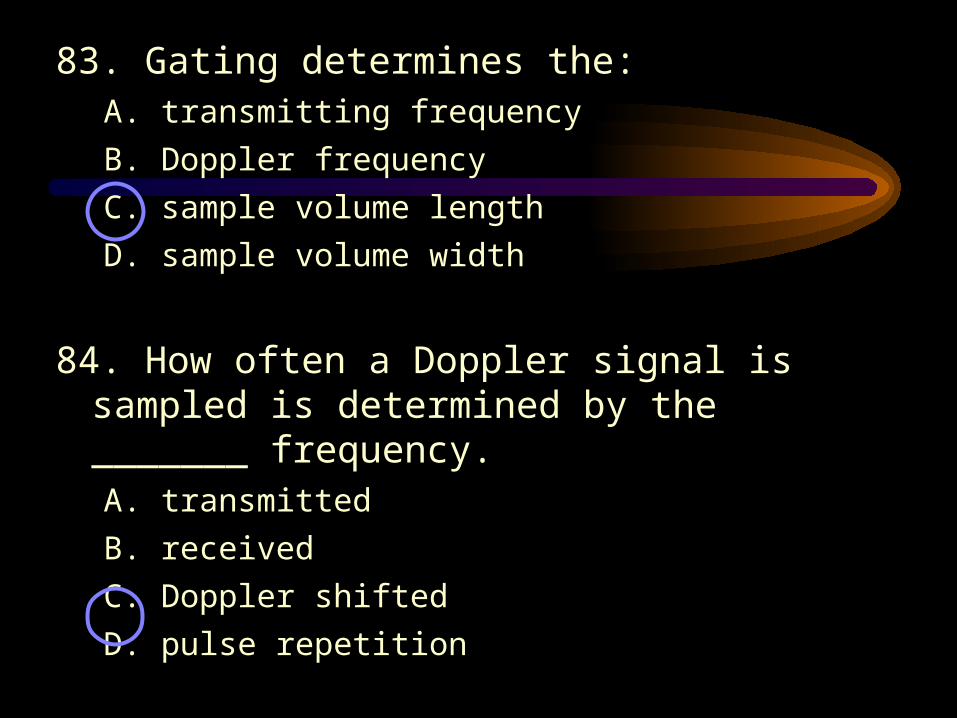
83. Gating determines the:A. transmitting frequency
B. Doppler frequency
C. sample volume length
D. sample volume width
84. How often a Doppler signal is sampled is determined by the _______ frequency.A. transmitted
B. received
C. Doppler shifted
D. pulse repetition

85. If a pulsed Doppler device is operating at a PRF of 6000/s, what is the maximum Doppler frequency that can be accurately detected?A. 3 kHz C. 12 kHz
B. 6 kHz D. 18 kHz
86. Aliasing occurs at lower frequencies when the sample volume is:A. moved toward the transducerB. moved away from the transducerC. increased in widthD. operated in continuous wave mode

87. Methods of compensating for aliasing do NOT include:A. transmitting at a higher frequencyB. adjusting the spectral baselineC. increasing the velocity scale rangeD. switching to continuous wave
88. Range discrimination is POOREST with:A. M-ModeB. continuous wave DopplerC. pulsed DopplerD. color Doppler

89. The highest velocities can be accurately evaluated by:A. real-time B-modeB. pulsed DopplerC. continuous wave DopplerD. color Doppler
90. Increasing the packet size results in:A. better velocity estimates, higher frame ratesB. better velocity estimates, lower frame ratesC. worse velocity estimates, higher frame ratesD. worse velocity estimates, lower frame rates

91. The term “variance” refers to:A. peak velocity
B. mean velocity
C. velocity range
D. velocity threshold
92. The most accurate display of the distribution of velocities at a particular depth occurs with:A. continuous wave Doppler
B. pulsed Doppler
C. color Doppler
D. B-mode imaging