Embed Size (px)
Citation preview

Sensors 2014, 14, 16799-16807; doi:10.3390/s140916799
sensors ISSN 1424-8220
www.mdpi.com/journal/sensors
Article
Doppler-Based Flow Rate Sensing in Microfluidic Channels
Liron Stern, Avraham Bakal, Mor Tzur, Maya Veinguer, Noa Mazurski, Nadav Cohen and
Uriel Levy *
Department of Applied Physics, The Benin School of Engineering and Computer Science, The Center
for Nanoscience and Nanotechnology, The Hebrew University of Jerusalem, Jerusalem 91904, Israel;
E-Mails: [email protected] (L.S.); [email protected] (A.B.); [email protected] (M.T.);
[email protected] (M.V.); [email protected] (N.M.); [email protected] (N.C.)
* Author to whom correspondence should be addressed; E-Mail: [email protected];
Tel.: +972-2-658-4256; Fax: +972-2-566-3878.
Received: 19 June 2014; in revised form: 9 August 2014 / Accepted: 28 August 2014 /
Published: 10 September 2014
Abstract: We design, fabricate and experimentally demonstrate a novel generic method to
detect flow rates and precise changes of flow velocity in microfluidic devices. Using our
method we can measure flow rates of ~2 mm/s with a resolution of 0.08 mm/s.
The operation principle is based on the Doppler shifting of light diffracted from a
self-generated periodic array of bubbles within the channel and using self-heterodyne
detection to analyze the diffracted light. As such, the device is appealing for variety of
“lab on chip” bio-applications where a simple and accurate speed measurement is needed,
e.g., for flow-cytometry and cell sorting.
Keywords: micro fluidics devices; sensors; velocimetry
1. Introduction
Microfluidics has emerged as a key platform for the miniaturization and automation of “lab on a
chip” systems. Nowadays, microfluidic devices are being used in myriad applications, such as
chemical analysis and synthesis, sample preparation, mixing, particle sorting, droplet generation, and
more [1]. Many of the high throughput applications, such as flow cytometry, particle counting, and
particle sorting, require accurate measurement and control of flow rate within the microfluidic
channels [2,3]. Thus, a flow sensor is an important component in such systems. Clearly, different types
OPEN ACCESS

Sensors 2014, 14 16800
of applications may require specific operation conditions of flow rate sensors. For example,
applications, such as high throughput particle counting, require much higher flow rates compared with
other applications, such as sample preparation and chemical synthesis. Several types of flow rate
sensors were demonstrated over the years, primarily based on thermal, mechanical, electrical, and
optical concepts of operation [4–8]. Two prominent approaches for optical velocity measurements are
imaging velocimetry and the Laser Doppler veclociemter (LDV). Imaging methods use fast cameras to
record the flow and implement different image processing algorithms, such as particle counting, and
cross correlations, to analyze the data and obtain an image of the flow rate [9–14].
LDV is based on the well-known fact that light scattered by a moving particle undergoes a Doppler
shift. Detection of this shift with extremely high resolution was made possible by heterodyning [15–17]
or self-mixing [18–22] the Doppler shifted signal from solid particles introduced or self-occurring
(for instance, blood cells [23,24]) in the flow. Due to the sporadic nature of the scattering, such
measurements are often limited in their sensitivity, and signal to noise ratios.
To date, there is still a crucial need for miniaturized devices, which can provide high accuracy, high
dynamic range and integration flexibility, and at a low cost and ease of operation.
In recent years we are witnessing a rapid development in optofluidics, which essentially represents
the effort of bringing together microfluidics and photonics, with the goal of constructing miniaturized
fluid based photonic devices and systems. This activity has led to the development of various novel
devices, such as optofluidic lasers and tunable optical devices and sensors to name a few. Several
review papers describe the activity in this field [25–34].
In this letter we demonstrate a miniaturized optofluidic on-chip flow rate sensor. Our device operates
on the basis of measuring the Doppler shift of a periodic array of bubbles generated within a microfluidic
channel. In order to measure the Doppler shift, we implement the LDV technique, in the self-heterodyne
arrangement. We claim that due to the homogeneity and periodicity of the array of bubbles, high signal
to noise ratio velocity measurements are achievable, with high precision and accuracy.
2. Experimental Section
Our proposed approach is described schematically in Figure 1a. A micro-fluidic channel is
constructed with a flow of periodically arranged oil bubbles immersed in water acting as a diffraction
grating. Owing to the constant flow of bubbles within the channel, the frequency of a diffracted beam will
experience a Doppler shift, which is linearly proportional to the flow rate [22,23]. This frequency is
measured by heterodyning [16] the zero order beam with the first order beam, resulting in a real time
measurement of the flow rate of the channel. We refer to such mixing as self-heterodyning. With this
approach, we measured flow rates with a sensitivity in the order of 10 μm/s, limited eventually by the
uniformity of the bubble distribution, the uniformity of the flow rate, and by the acquisition time of
our system.
A micrograph of our constructed microfluidic device that enables the generation of bubbles within a
microfluidic channel is presented in Figure 1b. The device is based on the concept described
in references [35–37], where the dimensions and the operation parameters have been optimized
to our application. The device was fabricated using standard soft-lithography and is made of
poly-dimethyl-siloxane (PDMS).
Sensors 2014, 14 16801
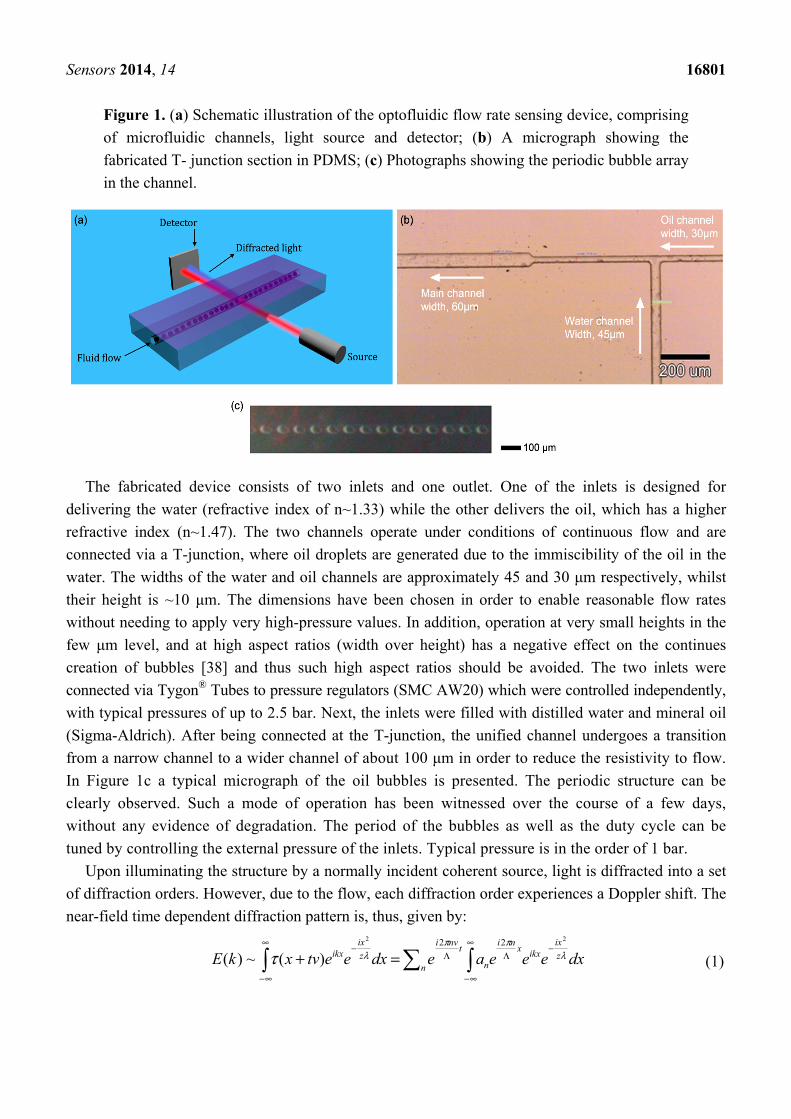
Figure 1. (a) Schematic illustration of the optofluidic flow rate sensing device, comprising
of microfluidic channels, light source and detector; (b) A micrograph showing the
fabricated T- junction section in PDMS; (c) Photographs showing the periodic bubble array
in the channel.
The fabricated device consists of two inlets and one outlet. One of the inlets is designed for
delivering the water (refractive index of n~1.33) while the other delivers the oil, which has a higher
refractive index (n~1.47). The two channels operate under conditions of continuous flow and are
connected via a T-junction, where oil droplets are generated due to the immiscibility of the oil in the
water. The widths of the water and oil channels are approximately 45 and 30 μm respectively, whilst
their height is ~10 μm. The dimensions have been chosen in order to enable reasonable flow rates
without needing to apply very high-pressure values. In addition, operation at very small heights in the
few μm level, and at high aspect ratios (width over height) has a negative effect on the continues
creation of bubbles [38] and thus such high aspect ratios should be avoided. The two inlets were
connected via Tygon® Tubes to pressure regulators (SMC AW20) which were controlled independently,
with typical pressures of up to 2.5 bar. Next, the inlets were filled with distilled water and mineral oil
(Sigma-Aldrich). After being connected at the T-junction, the unified channel undergoes a transition
from a narrow channel to a wider channel of about 100 μm in order to reduce the resistivity to flow.
In Figure 1c a typical micrograph of the oil bubbles is presented. The periodic structure can be
clearly observed. Such a mode of operation has been witnessed over the course of a few days,
without any evidence of degradation. The period of the bubbles as well as the duty cycle can be
tuned by controlling the external pressure of the inlets. Typical pressure is in the order of 1 bar.
Upon illuminating the structure by a normally incident coherent source, light is diffracted into a set
of diffraction orders. However, due to the flow, each diffraction order experiences a Doppler shift. The
near-field time dependent diffraction pattern is, thus, given by:
∞
∞−
−ΛΛ
∞
∞−
−=+ dxeeeaedxeetvxkE z
ixikx
xni
nn
tnvi
z
ixikx λ
ππλτ
22 22
)(~)( (1)

Sensors 2014, 14 16802
where is the transmission complex amplitude function of the grating, v is the translation speed, z is
the distance between the grating and the screen, is the wavelength, and k is the wave number. Indeed,
it can be seen that each Fourier component term is accompanied by a frequency shift of Λ=Δ /nvf .
The spectral spread of this Doppler shift is determined by the uniformity of the diffraction grating, the
flow rate, the sampling rate and the acquisition time. In order to measure such frequency shifts, we
chose to use a heterodyne approach. In such an arrangement, the frequency shifted beam is combined
with a reference unperturbed beam and the beat signal is measured. Here, a more compact and simple
approach of self-heterodyning is adopted. Operating in the near field Fresnel regime [39],
the various diffraction orders propagate a short distance, and thus overlap. As a result the beam
combines both the zero order term, which does not experience Doppler shift, and the higher order,
Doppler shifted terms that are described by Equation 1. This is in contrast to the far field regime where
the signal degrades due to poor spatial overlap. In order to maximize the beat signal, we choose the
height of the channel such that the incident light is diffracted significantly both to the first and the zero
diffraction orders. We calculate the zero order and first order efficiencies in and find them to be 0.6
and 0.15, respectively.
3. Results and Discussion
3.1. Velocity Measurement Calibration Using a Metallic Grating
Before conducting the actual experiment with the bubble sample, we performed a reference
measurement in order to verify and test the feasibility of detecting Doppler shifts created by a moving
grating. In order to do so we fabricate a binary amplitude grating with a period of 4 lines/mm. Using a
translation stage we shifted the grating at a constant velocity ranging from a few mm/s to 20 mm/s.
Next, we illuminated the periodic structure with a collimated HeNe laser beam (1 mm diameter) and
collected the light using a conventional silicon based photodetector (TL DET36A). This approach
allows to measure the Doppler shift experienced by the diffraction orders of the beam. As mentioned
earlier, the different orders overlap spatially at the detector plane, with the beating signal between two
adjacent orders yielding a measurable Fourier component corresponding to the frequency difference.
We placed the photodetector in the Fresnel near field regime (~6 cm from the grating’s plane,
corresponding to a Fresnel number of ~25) in order to achieve spatial beating between the diffraction
orders. In Figure 2a, we plot the measured first order frequency difference as a function of the grating
velocity. A linear dependency is clearly observed, with a slope of 4, corresponding to the grating
period. In Figure 2b, we plot a typical Fourier transform of the obtained signal. Apart from the DC
component three clear Fourier components are visible corresponding to the first three harmonics. The
higher harmonics are the result of beating of the higher diffraction order with the zero diffraction order
and amongst themselves.
The full width half maximum of the Fourier component is measured to be 0.5 Hz, which is mostly
as a result of non-uniformity in the translation speed.

Sensors 2014, 14 16803
Figure 2. (a) Measured frequency shift as a function of the velocity of the grating. The
data is based on measuring the first order beat signal; (b) Fourier transform of the signal
measured by the detector for translation stage speed of 10 mm/s.
3.2. Velocity Measurement of Bubble Array in a Micro Fluidic Channel
Next, we turn into measuring the flow rate in the actual device. As before, we illuminate the sample
(this time being the periodic bubble structure) with a collimated HeNe laser beam, in the same
heterodyne arrangement mentioned above. In our current demonstration, this Doppler shift corresponds
to ~10 Hz. However, higher rates of operations (i.e., larger velocities or smaller grating periods) are
possible yielding higher Doppler shifts, which in principle are easier to measure. In Figure 3a, we plot
the measured Doppler frequency as a function of the directly measured bubble frequency, which is
estimated by measuring the shift between several consecutive snapshots of a standard video camera.
We see an excellent agreement between the Doppler and the direct measurement, where we believe
that the small discrepancies between the two are attributed to the accuracy of measuring the bubble
speed using a standard camera, rather than the accuracy of the Doppler measurement itself.
In Figure 3b, we plot an example of the Fourier transform of the measured signal. Distinct peaks
corresponding to the first and second order are evident.
Figure 3. Measured Doppler frequency shift as a function of the bubble arrival rate as
measured by a camera. The data is based on measuring the first order beat signal;
(b) Fourier transform of a typical signal measured by the detector.

Sensors 2014, 14 16804
The full width half maximum of the Fourier component is measured to be 0.2 Hz. In this case, the
frequency resolution corresponds to 0.05 Hz, which sets a limit on the accuracy of the measurement.
We attribute the broadening of this Fourier component to slight non-uniformities in bubble position
and local velocity (perhaps due to Brownian motion). In order to convert the Doppler shift
measurement to the actual flow velocity, there is a need to extract the period of the bubble grating.
Using straightforward techniques of Fourier analysis of photographs similar to that presented in
Figure 1c the grating period was found to be 198 μm. With this period we can now translate the
Doppler shift to an actual flow velocity of 2.36 mm/s. Assuming that the period is known with great
accuracy (a realistic scenario in pre-calibrated devices), the sensitivity of the velocity measurement is
inherently limited by the sampling period in the frequency domain (0.05 Hz), resulting in ultimate
velocity sensitivity of ~10 μm/s. Realistically, small uncertainties in grating period and linewidth
broadening lead to a slightly lower resolution in measuring the flow velocity. By developing precise
mechanisms for measuring the grating period, increasing the sampling rate in the frequency domain
and by using advanced algorithms for precise peak estimation, the presented approach should provide
high accuracy velocity measurement, in the ~μm/s range. We note that the described method enables
the measurements of flow velocities much higher than reported here. For example, using a fast detector
having a bandwidth of ~1 MHz, flow velocities above 100 m/s could be measured. Not only this
capability of measuring such high flow rate is more than sufficient for conventional microfluidic and
optofluidic devices, it is even more than sufficient in applications such as measuring the flow rate of
jet based dye lasers [40].
4. Conclusions
In summary, we demonstrated a flow rate sensor based on measuring the Doppler shift experienced
by light, which is diffracted from a microfluidic channel consisting of 1-D period array of oil bubbles.
We constructed the device and witnessed stable and controlled periodic bubble flow. Using the device
we measured Doppler shifts of ~10 Hz, corresponding to flow rates of ~2 mm/s. A good agreement
between the predicted and detected Doppler shift was observed.
The device offers two prominent features. First, it introduces a self-generated periodic and
homogeneous array of particles. Such an ordered array of bubbles provides a strong and narrow
Doppler shift peak in the measured spectrum, corresponding to high SNR and sensitivity. This is as
opposed to exploiting random particles in fluids for the measurement of flow rates, an approach, which
might be limited by a low SNR as a result of sporadic scattering from the random distribution and the
random size of the particles. Furthermore, the technique is all liquid, i.e., both materials are liquids,
with no other materials involved. Being an all-liquid approach has the advantage of homogeneity, i.e.,
the same density of materials all over the channel (in all dimensions) and liquid compatibility.
The concept presented here is very general. It enables to combine any two liquids that do not mix,
and have a reasonable contrast in their indices of refraction. Moreover, it is possible to implement such
a technique using gas bubbles instead of oil bubbles, in the same manner introduced in reference [37].
However, in some cases, this might not be ideal, as the density of the liquid and the gas is obviously
very different.

Sensors 2014, 14 16805
The proposed approach is expected to provide an integrated, low cost and high performance tool for
measuring flow rates over broad range of flow velocities. The demonstrated concept can be further
integrated with microfluidic devices in variety of applications such as particle sorting, particle
counting, and flow cytometers.
Author Contributions
Liron Stern designed the experiment and wrote the manuscript, Avraham Bakal fabricated and
measured the samples, Mor Tzur measured the static grating Doppler shifts, Maya Wiegner and
Noa Mazurksi fabricated the samples, Nadav Cohen participated in the definition of the project and in
writing the paper and Uriel Levy conceived and supervised the project and wrote the manuscript.
Conflicts of Interest
The authors declare no conflict of interest.
References
1. Squires, T.M.; Quake, S.R. Microfluidics: Fluid physics at the nanoliter scale. Rev. Mod. Phys.
2005, 77, 977–1026.
2. Lien, V.; Zhao, K.; Berdichevsky, Y.; Lo, Y.-H. High-sensitivity cytometric detection using
fluidic-photonic integrated circuits with array waveguides. IEEE J. Sel. Top. Quantum Electron.
2005, 11, 827–834.
3. Godin, J.; Lien, V.; Lo, Y.-H. Demonstration of two-dimensional fluidic lens for integration into
microfluidic flow cytometers. Appl. Phys. Lett. 2006, 89, 061106.
4. Nguyen, N.-T.; Wereley, S.T. Fundamentals and Applications of Microfluidics; Artech House:
Boston, MA, USA, 2002.
5. Ernst, H.; Jachimowicz, A.; Urban, G.A. High resolution flow characterization in Bio-MEMS.
Sens. Actuators A Phys. 2002, 100, 54–62.
6. Collins, J.; Lee, A.P. Microfluidic flow transducer based on the measurement of electrical
admittance. Lab Chip 2004, 4, 7–10.
7. Lee, G.-B.; Kuo, T.-Y.; Wu, W.-Y. A novel micromachined flow sensor using periodic flapping
motion of a planar jet impinging on a V-shaped plate. Exp. Therm. Fluid Sci. 2002, 26, 435–444.
8. Bayraktar, T.; Pidugu, S.B. Characterization of liquid flows in microfluidic systems. Int. J. Heat
Mass Transf. 2006, 49, 815–824.
9. Santiago, J.G.; Wereley, S.T.; Meinhart, C.D.; Beebe, D.J.; Adrian, R.J. A particle image
velocimetry system for microfluidics. Exp. Fluid. 1998, 25, 316–319.
10. Cierpka, C.; Segura, R.; Hain, R.; Kähler, C.J. A simple single camera 3C3D velocity
measurement technique without errors due to depth of correlation and spatial averaging for
microfluidics. Meas. Sci. Technol. 2010, 21, 045401.
11. Lindken, R.; Rossi, M.; Große, S.; Westerweel, J. Micro-Particle Image Velocimetry (µPIV):
Recent developments, applications, and guidelines. Lab Chip 2009, 9, 2551–2567.

Sensors 2014, 14 16806
12. Cierpka, C.; Kähler, C.J. Particle imaging techniques for volumetric three-component (3D3C)
velocity measurements in microfluidics. J. Vis. 2012, 15, 1–31.
13. Wang, H.L.; Han, W.; Xu, M. The measurements of water flow rates in the straight microchannel
based on the scanning micro-PIV technique. In Proceedings of the 7th International Symposium
on Precision Engineering Measurements and Instrumentation, Lijiang, China, 7–11 August 2011.
14. Scarano, F. Tomographic PIV: Principles and practice. Meas. Sci. Technol. 2013, 24, 012001.
15. Yeh, Y.; Cummins, H.Z. Localized fluid flow measurements with an He-Ne Laser spectrometer.
Appl. Phys. Lett. 1964, 4, 176–178.
16. Goldstein, R. Fluid Mechanics Measurements, 2nd ed.; CRC Press: Washington, DC, USA, 1996.
17. Meier, A.H.; Roesgen, T. Heterodyne Doppler global velocimetry. Exp. Fluid. 2009, 47, 665–672.
18. Giuliani, G.; Norgia, M.; Donati, S.; Bosch, T. Laser diode self-mixing technique for sensing
applications. J. Opt. A: Pure Appl. Opt. 2002, 4, S283.
19. Nikolic, M.; Lim, Y.L.; Wilson, S.J.; Rakic, A.; Campagnolo, L.; Perchoux, J.; Bosch, T.
Flow profile measurement in micro-channels using changes in laser junction voltage due to
self-mixing effect. In Proceedings of 2011 IEEE Sensors, Limerick, Ireland, 28–31 October 2011;
pp. 1394–1397.
20. Dmitriev, A.K.; Konovalov, A.N.; Ul’yanov, V.A. Self-mixing detection of backscattered
radiation in a single-mode erbium fibre laser for Doppler spectroscopy and velocity
measurements. Quantum Electron. 2014, 44, doi:10.1070/QE2014v044n04ABEH015316.
21. Alexandrova, A.S.; Tzoganis, V.; Welsch, C.P. Self-mixing diode laser interferometry for velocity
measurements of different targets. Proc. SPIE 2014, 9141, doi:10.1117/12.2057827.
22. Nikoli, M.; Hicks, E.; Lim, Y.L.; Bertling, K.; Raki, A.D. Self-mixing laser Doppler flow sensor:
An optofluidic implementation. Appl. Opt. 2013, 52, 8128–8133.
23. Stern, M.D.; Lappe, D.L.; Bowen, P.D.; Chimosky, J.E.; Holloway, G.A., Jr.; Keiser, H.R.;
Bowman, R.L. Continuous measurement of tissue blood flow by laser-Doppler spectroscopy.
Am. J. Physiol. 1977, 232, H441–448.
24. Campagnolo, L.; Roman, S.; Perchoux, J.; Lorthois, S. A new optical feedback interferometer for
measuring red blood cell velocity distributions in individual capillaries: A feasibility study in
microchannels. Comput. Method. Biomech. Biomed. Eng. 2012, 15, 1, 104–105.
25. Campbell, K.; Groisman, A.; Levy, U.; Pang, L.; Mookherjea, S.; Psaltis, D.; Fainman, Y.
A microfluidic 2 × 2 optical switch. Appl. Phys. Lett. 2004, 85, 6119–6121.
26. Erickson, D.; Rockwood, T.; Emery, T.; Scherer, A.; Psaltis, D. Nanofluidic tuning of photonic
crystal circuits. Opt. Lett. 2006, 31, 59–61.
27. Levy, U.; Campbell, K.; Groisman, A.; Mookherjea, S.; Fainman, Y. On-chip microfluidic tuning
of an optical microring resonator. Appl. Phys. Lett. 2006, 88, 111107.
28. Gersborg-Hansen, M.; Balslev, S.; Mortensen, N.A.; Kristensen, A. A Coupled Cavity
Micro-fluidic Dye Ring Laser. Microelectron. Eng. 2005, 78–79, 185–189.
29. Garstecki, P.; Fischbach, M.A.; Whitesides, G.M. Design for mixing using bubbles in branched
microfluidic channels. Appl. Phys. Lett. 2005, 86, 244108.
30. Li, Z.; Zhang, Z.; Scherer, A.; Psaltis, D. Mechanically tunable optofluidic distributed feedback
dye laser. Opt. Express 2006, 14, 10494–10499.

Sensors 2014, 14 16807
31. Pang, L.; Chen, H.M.; Freeman, L.M.; Fainman, Y. Optofluidic devices and applications in
photonics, sensing and imaging. Lab Chip 2012, 12, 3543–3551.
32. Psaltis, D.; Quake, S.R.; Yang, C. Developing optofluidic technology through the fusion of
microfluidics and optics. Nature 2006, 442, 381–386.
33. Monat, C.; Domachuk, P.; Eggleton, B.J. Integrated optofluidics: A new river of light. Nat.
Photon. 2007, 1, 106–114.
34. Levy, U.; Shamai, R. Tunable optofluidic devices. Microfluid. Nanofluid. 2008, 4, 97–105.
35. Huebner, A.; Sharma, S.; Srisa-Art, M.; Hollfelder, F.; Edel, J.B.; Demello, A.J. Microdroplets: A
sea of applications? Lab Chip 2008, 8, 1244–1254.
36. Beatus, T.; Bar-Ziv, R.; Tlusty, T. Anomalous Microfluidic Phonons Induced by the Interplay of
Hydrodynamic Screening and Incompressibility. Phys. Rev. Lett. 2007, 99, 124502.
37. Garstecki, P.; Fuerstman, M.J.; Stone, H.A.; Whitesides, G.M. Formation of droplets and bubbles
in a microfluidic T-junction—scaling and mechanism of break-up. Lab Chip 2006, 6, 437–446.
38. Beatus, T.; Bar-Ziv, R.H.; Tlusty, T. The physics of 2D microfluidic droplet ensembles.
Phys. Rep. 2012, 516, 103–145.
39. Goodman, J. Introduction to Fourier Optics, 3rd ed.; Roberts and Company Publishers:
Englewood, CO, USA, 2004.
40. Wellegehausen, B.; Welling, H.; Beigang, R. A narrowband jet stream dye laser. Appl. Phys.
1974, 3, 387–391.
© 2014 by the authors; licensee MDPI, Basel, Switzerland. This article is an open access article
distributed under the terms and conditions of the Creative Commons Attribution license
(http://creativecommons.org/licenses/by/3.0/).