Embed Size (px)
Citation preview
1
DOORS OPENING: AN ANALYSIS OF EQUITY AND ACCESSIBILITY ON PUBLIC TRANSPORTATION SERVICES IN THE UNITED STATES
A dissertation presented
by
Elizabeth Williams
to The Department of Sociology and Anthropology
in partial fulfillment of the requirements for the degree of
Doctor of Philosophy
in the field of
Sociology
Northeastern University Boston, Massachusetts
December, 2016
2
DOORS OPENING: AN ANALYSIS OF EQUITY AND ACCESSIBILITY ON PUBLIC TRANSPORTATION SERVICES IN THE UNITED STATES
By
Elizabeth Williams
ABSTRACT OF DISSERTATION
Submitted in partial fulfillment of the requirements for the degree of Doctor of Philosophy in Sociology in the College of Social Sciences and Humanities of
Northeastern University December, 2016
3
ABSTRACT
Despite the essential role transportation plays in most people’s daily lives, the ways in which our
interactions and experiences with transportation systems affect our well-being is often overlooked.
Transportation is an issue more significant than the political battles over infrastructure and urban planning
generally acknowledge. Existing research has shown that people’s access to reliable, high-quality
transportation options as well as the degree to which these options provide timely and convenient access
to destinations of civic, social, educational, and recreational opportunity varies across race and income
lines. As made clear through social science frameworks like social exclusion theory, these variations in
accessibility can have significant consequences not only on individuals, but on entire communities.
Despite the strong body of research that finds evidence of inequities in the degree to which people can use
public transit services to access certain destinations, several questions have gone unanswered. Only a
handful of analyses have sought to establish macro-level trends that tell us about overall social patterns
regarding variations on the quality and utility of public transit service. Further, much of this work has
failed to probe the sources of these variations or looked into the institutional drivers that might explain
why some people have different experiences riding transit than others.
This dissertation project is comprised of three empirical research articles that respond to these
oversights by introducing a sociological lens to the study of public transportation services broadly, and
destination accessibility research specifically. In the first paper, I generate and describe patterns of transit-
based access to destinations of opportunity across twelve cities nationwide. In the second paper, I
investigate the organizational elements native to transit agencies that have been shown to impact the
effectiveness of public services and the degree to which users can reap their benefits. Finally, in the third
paper I evaluate the use and utility of traditional and alternative transportation planning paradigms for
engendering robust accessibility outcomes. While the three analyses engage three unique research
questions with their own theoretical foundation, hypotheses, and methodological technique, there is an
overarching question that guides my analysis: how useful is public transportation service when it comes
4
to actually meeting people’s accessibility needs, and in what ways do public transit agencies themselves
affect these accessibility outcomes?
Results of this analysis demonstrates there are macro-level, observable differences in people’s
ability to use public transportation to access the places they need or want to go, and that particular
elements of an agency’s organizational structure do in fact impact the utility of transit to various
destinations in ways that are both straightforward and complex across cities and between social groups.
This work also demonstrates that although transportation-based planning initiatives are currently
incorporated in transit agency planning standards and guidelines, the impact of this approach is limited.
Collectively, results across the three studies provide solid evidence that the physical outcomes of transit
systems are reflections of institutional conditions in transit agencies. In reinforcing the role and impact of
public institutions for shaping social service delivery outcomes, this research is an important contribution
to both urban sociology and urban transportation planning literatures.

5
ACKNOWLEDGEMENTS
It feels grossly inaccurate to call this dissertation ‘mine’, considering the legions of people who
have helped me in this crazy endeavor. First and foremost, I must thank my committee – Professors Liza
Weinstein, Steve Vallas, James Connolly, and especially my chair, Gordana Rabrenovic. Without your
continued guidance, this project would not have been completed. Thank you for always being so
responsive and supportive of my research and me personally – words could never express how grateful I
am. To everyone from the long-time colleagues to the recent acquaintances who sat with me and shared
their thoughts and perspectives – thank you so much. This project reflects the accumulation of many of
these conversations, and the insight you provided has been invaluable to my understanding and
appreciation of public transportation and transit equity.
My friends and my family form the best support network anyone could ask for. There are too
many people to name who all mean so much to me, but I must give a special shout-out to Buttman, Firuz,
Marcus, Wanchuk, Tanya, and Alexice. You are all the best friends anyone could ask for, and I feel truly
blessed and lucky to have you in my life. I also have to thank WHAT?! - my writing group, Brett and
Wallis. Thank you for holding me accountable to myself and being so generous and thoughtful with your
time reading over drafts and giving feedback – this project is so much stronger because of you.
This dissertation is dedicated to my mom, Marianne. You’ve never lost faith in me and have
always been my biggest cheerleader. I love you to the ends of the world. ISGI
6
TABLE OF CONTENTS
Abstract 2 Acknowledgements 5 Table of Contents 6 Introduction: 7 Doors Opening: An Analysis of Equity and Accessibility on Public Transportation Services in the United States Paper 1: 19 You Can’t Get There If You Can’t Get There: Trends in Transit-Based Access to Destinations Paper 2 47 What’s Driving Transit Service? Investigating the Organizational Elements of Transit Agencies that Impact Destination Accessibility Outcomes Paper 3 82 Accessibility and Social Exclusion in Local Public Transportation Agencies

7
INTRODUCTION
“Doors Opening: An Analysis of Equity and Accessibility on Public Transportation Services in the
United States” Introduction Despite the essential role transportation plays in most people’s daily lives, the ways in which our
interactions and experiences with transportation systems affect who we are and our well-being is often
overlooked. Transportation is an issue more significant than the political battles over infrastructure and
urban planning generally acknowledge. As a critical resource necessary for humans to realize their full
capabilities in modern society, transportation has long been a central issue in the U.S. civil rights
movement (Bullard and Johnson 1997). Research has shown that people’s access to reliable, high-quality
transportation options as well as the degree to which these options provide timely and convenient access
to destinations of civic, social, educational, and recreational opportunity varies across race and income
lines. This variation can have significant consequences on individuals and entire communities. For
example, the McCone Commission’s description of the events that led to the Watts riots in 1965 reported,
“The inadequate and costly public transportation currently existing throughout the Los Angeles area
seriously restricts the residents of the disadvantaged areas such as south central Los Angeles. This lack of
adequate transportation handicaps them in seeking and holding jobs, attending schools, shopping, and
fulfilling other needs” (Governors Commission on the LA Riots 1965, as quoted in Grengs 2005).
Transportation infrastructure, and related issues of quality and access, is thus a high-profile matter of
social significance, whether it is commonly recognized as such or not.
The relevance of transportation for shaping social outcomes is made explicit by social exclusion
theory, a social science framework for policy evaluation. Social exclusion theory traces the pervasive
inability of particular groups of people to be upwardly mobile and overcome the physical and institutional
obstacles that encumber full participation in social life and access to the opportunities and benefits that
society has to offer (Church, Frost, and Sullivan 2000; Lucas 2004a; Stanley and Lucas 2008; Stanley and
Vella-Brodrick 2009; Ureta 2008). In short, social exclusion theory sees variations in poverty and social
8
vulnerability as the product of variations in accessibility – specifically, people’s ability to access life-
enhancing opportunities (Lucas 2012; Madanipour 1998). The quality and reliability of transportation
options has direct implications for access, and subsequently, social exclusion-related outcomes. As such,
transportation has been the focus of much research that has engaged social exclusion theory and
investigated ways to overcome barriers to broader social inclusion (Church et al. 2000; Clifton and Lucas
2004; Lucas 2004b, 2012; Stanley and Vella-Brodrick 2009; Ureta 2008).
Although the concept of social exclusion has been engaged abroad, little social science research
in the United States has approached issues of transportation and equity from this standpoint (Silver and
Miller 2003). This is a significant oversight because transportation policymakers and stakeholders
struggle to substantively engage issues of accessibility and social equity. As much as transportation is an
input that dictates not just the daily round but land use and other features of the urban environment, it is
itself a product of decisions and values held by policymakers, urban planners, and other high-ranking
bureaucrats. Transportation is a modifiable public service, one whose shape, quality, maintenance, as well
as associated outcomes are the responsibility of people tasked with administering them. Social exclusion
theory recognizes that transportation administrators and agencies must be held accountable and identified
as factors in their own right in analyses that engage transportation-related outcomes (Lucas 2012).
Acknowledging this fact presents an opportunity for policymakers and other administrators to be
conscious of the significant impact their decisions have on entire groups of people and enact policies and
planning practices that promote equity in access to life-enhancing opportunities.
Issues of social exclusion and the role of transportation policy in overcoming them are
particularly relevant in the realm of public mass transit planning. Public transit is an essential resource in
cities – a recent president of the San Francisco Chamber of Commerce observed “If our transit system
were to suddenly stop, our metropolitan transportation operation would grind to a halt. This would make
it impossible for employees to get to work and for businesses to receive and ship goods. The metropolitan
economy would eventually grind to a halt as well” (The National Business Coalition for Rapid Transit
2003). For many people, public transportation service is a lifeline; it is their primary or only means of
9
getting around (Pisarski 2006; Pucher and Renne 2003; Puentes and Tomer 2011). Public transit service is
disproportionately relied upon by social groups commonly considered to be the most disadvantaged,
including communities of color, low-income households, and the foreign-born (Blumenberg and Ong
2001; Garrett and Taylor 1999; Polzin and Chu 2005; Sanchez, Stolz, and Ma 2003). These social groups
are also those considered most at risk for social exclusion. Public transit service thus plays a key role in
the lives of many members of the most marginalized communities and is often quite literally their only
vehicle for accessing those destinations that offer robust opportunities for individual and social
advancement and for overcoming social exclusion.
Despite the significance of transportation generally, and public transit specifically to the life
experiences of socially vulnerable populations at risk for exclusion, little sociological research based in
the United States directly engages these issues. This is not to say that issues of social equity and well-
being with respect to transportation or public transit service have not been discussed by social scientists of
other disciplines (Garrett and Taylor 1999; Grengs 2005; Handy and Niemeier 1997; van Wee and Geurs
2011; Welch 2013). However, a sociological lens offers a robust perspective for responding to and
clarifying the many questions that remain. For example, only a handful of analyses have sought to
establish macro-level trends with respect to variations in transit access. This neglect renders the extent of
issues of access and exclusion unknown, so it has been difficult to assess the degree to which accessibility
is a problem or for whom. Further, studies that have quantified and evaluated variations in race or class-
based transportation or destination accessibility outcomes often fail to probe the sources of these
variations, which, as social exclusion theory suggests, are often found within those institutions
responsible for service in the first place. In fact, one of the most significant limitations of U.S. destination
accessibility research in general has to do with the overall neglect of the very role of institutions in
shaping transportation outcomes, good or bad. From a methodological standpoint, there has also been
almost no qualitative analysis in critical transportation or destination accessibility research to date. This
has meant that academic findings of transportation outcomes often lack context: not only is there a limited
understanding of the tangible impacts of poor-quality transit service, but research thus far has not
10
accounted for the role of informal policies that shape transit service agency decisions and planning
priorities.
A sociological perspective can fill in this gap as well as clarify the utility of transportation as a
necessary resource for overcoming social exclusion. Establishing the significance of transportation in
shaping trends of broad-scale social outcomes is necessary for ensuring that infrastructure and services
are not only well planned and executed, but done so equitably. A sociological perspective draws
connections between the way that urban public services are planned and delivered, and the social
outcomes experienced by users. Given sociology’s emphasis on macro-level social outcomes and the
significance of race and class as well as large social institutions for dictating life experiences, sociological
inquiry is well-prepared to contribute to research and analysis related to public transportation and social
exclusion.
This dissertation project is comprised of three empirical research articles that respond to
oversights in existing research to address issues of transportation equity. While consistently maintaining a
sociological perspective focused on outcomes and equity, these analyses draw on the contributions and
findings across several social science disciplines and approaches. This approach is in step with the
modern sociological tradition of interdisciplinary and mixed-methods analysis, and is here extended to
serve as the foundation of a robust analysis that broadens our understanding about how issues of
accessibility and social exclusion manifest in the context of U.S. public transportation services. While the
three analyses engage three different research questions, each with their own theoretical foundation,
hypotheses, and methodological technique, there is an overarching question that guides my analysis: how
useful is public transportation service when it comes to actually meeting people’s accessibility needs, and
in what ways does the institution of public transit affect these accessibility outcomes?
Paper 1: “You Can’t Get There If You Can’t Get There: Trends in Transit-Based Access to Destinations” The first article in this dissertation is a macro-level analysis that looks into the variations between
social groups with respect to their ability to access destinations of opportunity via public transit service.
11
In asking how transit-based destination access changes between different populations, this research
establishes trends related to social exclusion and associated variations in the utility of public transit for
meeting people’s daily needs and overcoming barriers to social participation. The study seeks to
contribute to the small but growing body of literature that directly assesses race and class-based patterns
in transit-based destination access, and the even smaller share of studies that look at more than a handful
of cities at a time. This analysis introduces a GIS-based methodological approach for evaluating
destination accessibility across several cities simultaneously in order to a) compare and contrast trends
and b) understand broad spatial and social patterns of transit access. Specifically, this research describes
neighborhood-level variations in the degree of access provided to destinations of recreational,
employment, and educational opportunities by public transit in 12 U.S. cities. Block-group level data
retrieved from the American Community Survey indicates the socio-demographic composition of these
neighborhoods, and social trends with respect to transit access are thus established.
The results of this analysis confirm and extend previous research that has found trends in public
transportation service to be inequitable but unpatterned across race, class, and other social factors.
Differences between social groups do exist, but which group is being favored varies. This research shows
much divergence within cities with respect to who is advantaged with respect to transit-based destination
access. In some cities, block groups with high shares of low-income households and/or households of
color have a transit advantage. In other cities, the opposite is true. In many cases, findings show the
relationship between concentrations of social groups and transit outcomes are nonlinear. This research
also demonstrates that there is much variation across cities in the degree to which the socioeconomic
characteristics predict the degree of transit-based access provided within block groups. Although 9 of 12
regression models predicting local accessibility outcomes have R2 scores above .36, the predictive power
of these models across cities ranges from .0024 to .5829. However, results of correlation and regression
analysis do show some consistency across cities and destination types. The major finding of this study
concerns the clear and almost universal advantage on behalf of block groups with high shares of zero-
vehicle households and to a lesser extent, renters. This pattern holds up across all correlation analyses in
12
the aggregate and within individual cities, thus establishing a national trend that had until now gone
unobserved.
These findings suggest that while the relationship between transit and social status is contextual
and highly localized, households without vehicles are uniquely well positioned – either by intention or
design – to take advantage of a city’s transit network. However, the equity narrative associated with these
results becomes complicated when controlling for income and race. Zero-vehicle households are
increasingly high-income and white, especially in cities like San Francisco and Washington, D.C.;
regression results show a positive relationship between accessibility and zero-vehicle households but also
with respect to shares of high-income and white households. Despite the lack of evidence showing
systematic bias against low-income or communities of color, it is critical to point out the significance of
public transit to the lives of the most vulnerable and to recommend that the equitable distribution of high-
quality transit access should be a priority for transit planner and policymakers in all transit agencies
across the U.S.
Paper 2: “What’s Driving Transit Service? Investigating the Organizational Elements of Transit Agencies that Impact Destination Accessibility Outcomes” While variations in transit-based destination accessibility outcomes have been established,
investigation into the sources for these variations has largely been neglected. This oversight is significant,
because in order to effectively respond to and rectify existing inequities in transit service, stakeholders
must understand what causes them in the first place. Existing research that spans several theoretical
perspectives and disciplinary approaches has sought to clarify the causes for variations in the distribution
and quality of public resources and social services, but has not yet engaged public transit service as a
specific site of inquiry. The second article fills these analytical gaps by drawing on the knowledge gained
through existing research to investigate the sources of variation in transit-based destination access. The
analysis seeks to emphasize the significance of transit agencies and their policies for shaping accessibility
outcomes by determining and quantifying their impact. Additionally, this work is an effort to understand
13
if and how these transit policies may differentially affect the accessibility outcomes of different social
groups.
In this paper, I draw on several theoretical perspectives that offer diverse views on which
structural elements of public agencies might affect social outcomes. Specifically, these elements include
the organizational structure of public agencies, the degree of public participation that agencies formally
incorporate, the service delivery standards that agencies rely on to design and execute transit services, and
the funding priorities that dictate investment in resources. Using accessibility scores generated in Paper 1
and local data that reflects each of the administrative elements described above, I develop a hierarchical
linear regression model to evaluate the relative influence of each element on destination accessibility
outcomes in 12 U.S. cities. A sub-regression that limits the analysis to just those households most at risk
for transit dependency estimates the differential impact these elements have on various social groups,
allowing for comparison with the larger model that estimates overall impacts.
The findings of this analysis demonstrate that transit agencies and the way they organize
themselves do wield significant influence over the degree of accessibility enjoyed by riders. Some of
these elements matter more than others. For example, the degree of public participation and input
recognized by public transit agencies is positively associated with advantageous accessibility outcomes,
while funding structures have a more complex impact on accessibility outcomes than the literature
suggests. Indicators that reflect priorities established in the short-term demonstrate the opposite impact of
long-term funding indicators, suggesting that the influence of agency investment on accessibility
outcomes does not truly manifest itself for several years. When broken down by destination type, there is
a significant difference in the impact of organizational elements between work and non-work destinations.
While many of these elements matter significantly for non-work access, the only factors that were found
to significantly influence employment access were service delivery characteristics. Finally, the impact of
these elements was also different for the overall population relative to transit-dependent portions of city
populations. The effects of public participation in particular is more impactful for those living in
neighborhoods with high shares of transit disadvantaged populations (as demonstrated by a higher
14
regression coefficient) and are also significant across both work and non-work destinations. This means
that the configuration of agency-level elements is not only meaningful at a macro-level, but is particularly
meaningful in determining the outcomes of those who most rely on transit service.
Paper 3: “Accessibility and Social Exclusion in Local Public Transportation Agencies” After establishing the significance of a transit agency’s organizational constitution for shaping
outcomes related to transit-based destination access, the final article in this dissertation investigates
whether or not accessibility-based planning practices actually matter for accessibility-based outcomes.
Accessibility-based planning approaches are believed to hold much promise and potential for directly
addressing issues of accessibility and promoting high quality, destination-rich transit service that is also
equitably distributed. However, whether or not accessibility-based planning practices actually engender or
promote high-accessibility outcomes is unknown. This paper looks at patterns of accessibility across
agencies that either incorporate accessibility-based planning protocols or retain a traditional and pure
mobility-oriented perspective.
In response to the lack of clarity surrounding the engagement of accessibility among applied
transportation practices, this analysis first qualitatively evaluates the service delivery plans and guidelines
established by nine U.S. public transit agencies. Using a rubric to discern evidence of an accessibility-
based planning orientation, I empirically assess the presence of accessibility-based planning practices and
evaluate the extent to which public transit agencies are incorporating accessibility in their goals, service
standards, and evaluation metrics. Agencies are determined to be one of two types: either they maintain a
traditional mobility-based orientation that prioritizes the movement of vehicles through a network, or they
move beyond this singular focus and incorporate accessibility-based planning guidelines and evaluation
metrics. Second, I investigate the degree to which the incorporation of accessibility-based planning
techniques impact accessibility outcomes. I use a binary ‘orientation’ category reflecting whether or not
each city’s transit agency has adopted any accessibility-based goals, guidelines, or evaluation metrics to
evaluate accessibility patterns by city. Not only do I rely on descriptive statistics, but I also apply a binary
15
variable reflecting each planning orientation to a multivariate regression model estimating accessibility
outcomes. This additional analysis allows a more thorough understanding of the tangible impact of
accessibility planning practices on riders’ experiences.
Results of this work show that while many agencies are failing to incorporate accessibility-based
planning practices into the way they routinely design and execute transit services, over half of the
agencies in this study do show evidence of engagement with issues of accessibility and transit equity.
However, this oversight does not seem to matter much with respect to outcomes. The evaluation of
accessibility scores across cities that do engage accessibility planning and those that do not reveal few
variations in outcome, meaning that there is no clear trend indicating that people living in cities with
accessibility-conscious public transportation agencies have better accessibility-based outcomes. In fact,
on average, accessibility scores are higher in ‘mobility’ cities, and results of the regression analysis
indicate that the presence of an accessibility orientation has a negative influence. While this finding calls
into question the actual utility of accessibility-based planning protocols for people’s ability to reach
places of social significance, it is also possible that the effects of these policies have not fully manifested
in improved destination access.
Conclusion: Scholarly Contributions and Directions for Future Research These three analyses make significant contributions to both sociological and urban transportation
planning research. First, the analysis used in this dissertation employs an innovative but highly replicable
approach to developing a reliable and robust local indicator of transit-based accessibility outcomes. This
indicator demonstrates that there are macro-level, observable differences in people’s ability to use public
transportation to access the places they need or want to go. Second, this analysis has extends the use of
accessibility scores to probe the unexplored agency-level organizational drivers that contribute to
variations in accessibility outcomes. This research establishes that particular elements of an agency’s
organizational structure do in fact impact the utility of transit to particular destinations in ways that are
both straightforward and complex, both across cities and between social groups. Finally, this work
16
demonstrates that although transportation-based planning initiatives are currently incorporated in transit
agency planning standards and guidelines, the impact of this approach is limited. Collectively, results
across the three studies provide solid evidence that the physical outcomes of transit systems are connected
to institutional conditions in transit agencies, and that the various organizational and cultural elements
affecting these institutions do have the potential to change conditions with respect to social exclusion and
mobility.
One of the goals of this research project has been to introduce distinct but complementary bodies
of literature and research to each other. Throughout these three papers, I have drawn on perspectives that
find their home in different social science disciplines – sociology, urban planning, political science,
environmental science, and others. These perspectives engage a variety of research approaches, stemming
from advanced spatial modeling to qualitative document review. Each contributes frameworks of analyses
that help academics and practitioners alike understand the full context and consequence of transportation
service and its role in the lives of its users. In short, this work has illustrated the true utility of bringing in
a social systems lens is to engender a more interdisciplinary and mixed-methods approach to the field of
transportation analysis. But this dissertation also establishes transportation as a significant and relevant
field of study for sociologists and other urban social scientists. Urban sociology must recognize that
transportation is a major factor that dictates a plethora of outcomes, and must engage transportation as a
focal point, both in its own right as well as an element of topical research that engages other social issues.
For example, work that probes the causes and consequences of urban poverty should understand the role
that transportation plays in helping or obstructing people from accessing employment and other
opportunities for mobility. Research that investigates affordable housing should also consider the costs of
transportation to places like work, school, and other sites that people regularly travel. Analysis that is
concerned with public health would similarly be enhanced by accounting for the convenience of health
care and the associated burdens of transportation to doctors and medical centers. The significance of
transportation in shaping people’s daily lives cannot and should not be ignored, and must be
acknowledged more readily as a determining factor for a multitude of social outcomes.
17
References Blumenberg, Evelyn, and Paul Ong. 2001. “Cars, Buses, and Jobs: Welfare Participants and Employment
Access in Los Angeles.” Transportation Research Record (1756):22–31.
Bullard, Robert D., and Glenn Johnson. 1997. Just Transportation: Dismantling Race and Class Barriers to Mobility. edited by Robert D. Bullard and Glenn S. Johnston. Gabriola Island, British Columbia: New Society Publishers.
Church, a., M. Frost, and K. Sullivan. 2000. “Transport and Social Exclusion in London.” Transport Policy 7(3):195–205.
Clifton, Kelly, and Karen Lucas. 2004. “Examining the Empirical Evidence of Transport Inequality in the US and UK.” Pp. 15–38 in Running on empty: Transport, social exclusion, and environmental justice, edited by Karen Lucas. Bristol: The Policy Press.
Garrett, Mark, and Brian Taylor. 1999. “Reconsidering Social Equity in Public Transit.” Berkeley Planning Journal 13(1):6–27.
Grengs, Joe. 2005. “The Abandoned Social Goals of Public Transit in the Neoliberal City of the USA.” City 9(1):51–66.
Handy, Susan L., and Debbie A. Niemeier. 1997. “Measuring Accessibility: An Exploration of Issues and Alternatives.” Environment and Planning A 29(7):1175–94.
Lucas, Karen. 2004a. “Locating Transport as a Social Policy Problem.” Pp. 7–14 in Running on empty: Transport, social exclusion, and environmental justice, edited by Karen Lucas. Bristol: The Policy Press.
Lucas, Karen. 2004b. “Transport and Social Exclusion.” Pp. 39–54 in Running on empty: Transport, social exclusion, and environmental justice, edited by Lucas. Bristol: The Polity Press.
Lucas, Karen. 2012. “Transport and Social Exclusion: Where Are We Now?” Transport Policy 20:105–13.
Madanipour, Ali. 1998. “Social Exclusion and Space.” The City Reader 158–65.
Pisarski, Alan E. 2006. Commuting in Ameria III: The Third National Report on Commuting Patterns and Trends.
Polzin, Steven E., and Xuehao Chu. 2005. “Public Transit in America : Results from the 2001 National Household Travel Survey.” (September).
Pucher, J., and J. L. Renne. 2003. “Socioeconomics of Urban Travel: Evidence from the 2001 NHTS.” Transportation Quarterly 57(3):49–77.
Puentes, Robert, and Adie Tomer. 2011. Transit Access and Zero Vehicle Households. Washington, D.C.
Sanchez, Thomas W., Rich Stolz, and Jacinta S. Ma. 2003. Moving to Equity: Addressing Inequitable Effects of Transportation Policies on Minorities. Cambridge, MA.
Silver, Hilary, and S. M. Miller. 2003. “Social Exclusion: The European Approach to Social
18
Disadvantage.” Indicators 2(2):1–17.
Stanley, Janet, and Karen Lucas. 2008. “Social Exclusion: What Can Public Transport Offer?” Research in Transportation Economics 22(1):36–40.
Stanley, Janet, and Dianne Vella-Brodrick. 2009. “The Usefulness of Social Exclusion to Inform Social Policy in Transport.” Transport Policy 16(3):90–96.
The National Business Coalition for Rapid Transit. 2003. The Economic Importance of Public Transit. Retrieved (http://www.apta.com/resources/reportsandpublications/Documents/economic_importance.pdf).
Ureta, Sebastian. 2008. “To Move or Not to Move? Social Exclusion, Accessibility and Daily Mobility among the Low-Income Population in Santiago, Chile.” Mobilities 3(2):269–89.
van Wee, Bert, and Karst Geurs. 2011. “Discussing Equity and Social Exclusion in Accessibility Evaluations.” European Journal of Transport and Infrastructure Research 11(4):350–67.
Welch, Timothy F. 2013. “Equity in Transport: The Distribution of Transit Access and Connectivity among Affordable Housing Units.” Transport Policy 30:283–93.
19
PAPER 1
“You Can’t Get There If You Can’t Get There: Trends in Transit-Based Access to Destinations”
“The problem of modern urban transportation is not congestion or speed, but access.” (Schaeffer and Sclar 1980:171)
Introduction
Close proximity to the opportunities associated with urban life, with its rich fabric of social,
cultural, recreational, and educational resources, is one of the most compelling reasons to live in a city.
But there is a growing sense among researchers and advocates alike that one of the most, if not the most,
pressing issue of equity in urban communities concerns access to destinations. Issues of access are largely
functions of transportation systems and networks, but planners and engineers often approach
transportation challenges from the perspective of vehicles moving through a network rather than people
going to places (Walker 2008, 2011). Marginalized and vulnerable populations tend to depend on transit
at greater rates than the general public (Doyle and Taylor 2000; Garrett and Taylor 1999; Glaeser, Kahn,
and Rappaport 2008; Polzin, Chu, and Rey 2000; Pucher, Evans, and Wenger 1998; Pucher and Renne
2003), rendering the role of transit in providing access to destinations of opportunity a particularly
relevant issue. However, only recently have some transit agencies begun to include metrics that measure
accessibility as a performance indicator (Handy 2005, 2008). Despite increased attention within transit
agencies to address the distribution of accessibility, substantive analysis of local patterns and trends is
largely confined to the academic and research arm of transportation work.
Studies that investigate accessibility patterns by race, class, income, and other socioeconomic
and demographic characteristics are fraught with inconsistent and sometimes contradictory findings.
Much of the variation in results can be attributed to inconsistencies with regard to methodological
approaches and the specific travel parameters under analysis. Also absent from accessibility research are
macro-level analyses that attempt to establish patterns at a national scale. This work addresses these gaps
by developing an indicator that measures transit-based access to destinations of opportunity at the block
group level in 12 cities across the United States. As patterns of accessibility vary across block groups
20
with different concentrations of various social groups, we can evaluate accessibility trends that indicate
social equity within cities, between cities, and across the U.S. Results of this analysis are consistent with
previous research in showing evidence of unpatterned inequality by income, race, and Latino status.
However, findings also indicate that accessibility is highest in block groups with high concentrations of
zero-vehicle households and to a lesser extent, renters.
Literature Review Defining Accessibility While accessibility is associated with countless definitions and applications, the social science
and planning literatures tend to use accessibility to describe the relationship between land use patterns and
transportation systems (Handy and Niemeier 1997; Krizek 2005). Conceptually, accessibility is similar to
mobility, but the two mean different things (El-Geneidy and Levinson 2006; Schaeffer and Sclar 1980).
Mobility refers to the base-potential for movement, and is typically measured in terms of the number of
miles travelled or the number of trips taken. Accessibility, on the other hand, refers to the destinations that
can be reached, or the activities that one can conduct or participate in at a particular destination. It is
about connectivity (Krizek 2005; Levinson, Krizek, and Gillen 2005) , or “the potential for interaction”
(Handy and Niemeier 1997; Hansen 1959; Levinson et al. 2005). The notion that there is a purpose or
benefit to travel is consistently emphasized. In short, this analysis understands accessibility as the
achievement of an outcome with a purpose, the ability to reach a person, place, or thing that has an
opportunity, a benefit, or a gain for a recipient (Miller 2005; Walker 2008).
The relationship between access to opportunity and quality of life undergirds social policy
research perspectives on social exclusion. Opportunity exclusion as a barrier to social mobility is not a
new concept; many years ago, Wachs and Kumagi (1973) identified physical mobility as a major
contributor to inequality in the United States. However, only recently has an academic perspective that
includes physical access as an indicator of social well-being and mobility been formalized. In short, social
exclusion is a framework for social policy evaluation and research that emphasizes relative deprivation in
21
people’s ability to fully participate in social and civic life (Church, Frost, and Sullivan 2000; Lucas 2004;
Stanley and Lucas 2008; Stanley and Vella-Brodrick 2009) and refers to people’s ability to access life-
enhancing opportunities (Lucas 2012). One novel rewrite of the concept is in terms of people’s relative
‘accessibility deficits’, evoking the penalty associated with the lack of access to a resource. These
penalties have been found to “lock… people of color and low income people out of activities that support
a reasonable quality of life” (Clifton and Lucas 2004:15). Unfortunately, most applications of the so-
called social exclusion framework to transportation issues are limited to analyses in the UK (Silver and
Miller 2003; Stanley and Vella-Brodrick 2009).
An important dimension of social exclusion involves transportation. Transportation is the means
by which people access activities and opportunities, and participate in social life: transportation facilitates
social inclusion (Stanley and Vella-Brodrick 2009). However in many cases, transportation itself may be
a barrier to civic and social participation. People may not have access to adequate transportation to begin
with, or the transportation that they are able to use may be of poor quality or is highly inconvenient (Hine
and Mitchell 2001). Those who are at the greatest risk for social exclusion, including those who are
unemployed, earn low incomes, display low political participation, and have limited social supports have
been found to travel the least (Stanley et al. 2010).
Transportation planning has traditionally been the domain of engineers who think in terms of
“improving operating conditions for vehicles” (Lucas 2004:11) rather than the utility of transportation for
people who want or need to go places (Hine and Mitchell 2001; Whitelegg 1997). Several analyses of
regional transportation plans show evidence that little attention has historically been paid to issues of
accessibility (Cervero 1997; Cervero, Rood, and Appleyard 1999; Grengs 2010), although some have
suggested that this has started to change in recent years (Handy 2005; Levine et al. 2012). The reasons
that accessibility metrics may have begun to be incorporated as performance indicators is unclear; so are
the tangible impacts on the distribution of services or the effects on accessibility in cities where this
change has occurred. However, social disparities in transportation infrastructure, specifically the quality
22
and availability of public transit among vulnerable populations, have been a concern of environmental
justice advocates for years (Bullard 2003; Bullard and Johnson 1997).
Social Trends in Access to Destinations Although destination accessibility is understood to be a function of land use and transportation
patterns, historical patterns of discrimination and segregation complicate the distribution of people across
cities and regions (Squires and Kubrin 2005). Recognizing this draws attention to the need to investigate
accessibility patterns by race and class (Horner and Mefford 2005). Although a topic of increasing
academic and practical relevance, scholarly analysis that disaggregates measures of access to destinations
by race and class are limited (Grengs 2014, 2015).
Results of this body of research show great variation in the number, density, and type of places
that are most accessible to different social groups across all modes of travel. Much of this work focuses
on access to employment (Grengs 2009; Horner and Mefford 2005; Krizek 2005), but there is a growing
body of research that focuses on non-work destinations – particularly supermarkets. Regardless of
destination type, findings are mixed. In some studies, results show that those population groups identified
as disadvantaged have the worst proximity or access to destinations (Cervero et al. 1999; Grengs 2001,
2010; Helling and Sawicki 2003; Hess 2005; Horner and Mefford 2005). However, in other studies, social
groups identified as being socially disadvantaged – commonly low-income and communities of color –
are found to have the most improved or best degree of access (Foth, Manaugh, and El-Geneidy 2013;
Grengs 2004, 2009, 2015; Helling 1998; Jiao et al. 2012; Larsen and Gilliland 2008; McKenzie 2013a;
Páez et al. 2013; Scott and Horner 2008; Shen 1998, 2001). The most consistent outcome in these studies
has been that low-income and minority households or neighborhoods have the worst access to
supermarkets (Grengs 2001, 2009, 2015). The exceptions are McKenzie (2013), who found that African-
American and low-income households had the most favorable access to supermarkets via transit, and
Larsen and Gilliand (2008), who found that low-income households have better supermarket access than
middle-class households.
23
Thus, the body of destination accessibility literature shows evidence of what researchers have
called ‘unpatterned inequality’ (Cingranelli 1981; Mladenka 1980; Mladenka and Hill 1977; Talen 2001).
While social outcomes are not socially equitable, they do not follow any clear patterns in terms of
variation in access. This has been shown to be the case with respect to both the overall body of
accessibility literature as well as the outcome of individual studies. For example, Talen (2001) found no
clear relationship between the distance between households of varying socioeconomic status and local
schools across three counties in West Virginia. Similarly, in a comparative analysis of 25 cities, Grengs
(2015) finds patterns of job accessibility by race and income across travel modes that are unique to each
city but show no clear trends overall.
Because of the variety in options when it comes to travel mode and the limited number of cities
that offer robust transit service, most accessibility research looks at trends across all modes of travel,
inclusive of private vehicles and mass transit. But the distribution of accessibility as provided by local
public transit systems specifically is an intuitive indicator of social equity. Public transit is a travel mode
disproportionately relied upon by low-income households, households of color, and other socially
disadvantaged groups (Doyle and Taylor 2000; Garrett and Taylor 1999; Glaeser et al. 2008; Polzin et al.
2000; Pucher et al. 1998; Pucher and Renne 2003). Although much of the U.S. transportation network is
oriented towards private vehicles, not everyone has access to one. Most zero-vehicle households in the
United States are low-income, minority, Hispanic, immigrant, and renters (Puentes and Tomer 2011), and
the majority of welfare recipients do not own a car (although are known to rely on other private vehicles
for transportation) (Blumenberg and Ong 1998). Thus, differences in accessibility by public transit are
important to gauge for two reasons: 1) public transit is a public resource, whose benefits are intended to
be equitably distributed among social groups, and 2) for many members of disadvantaged social groups,
public transit is their primary or only means for accessing destinations of opportunity that promote social
mobility and inclusion.
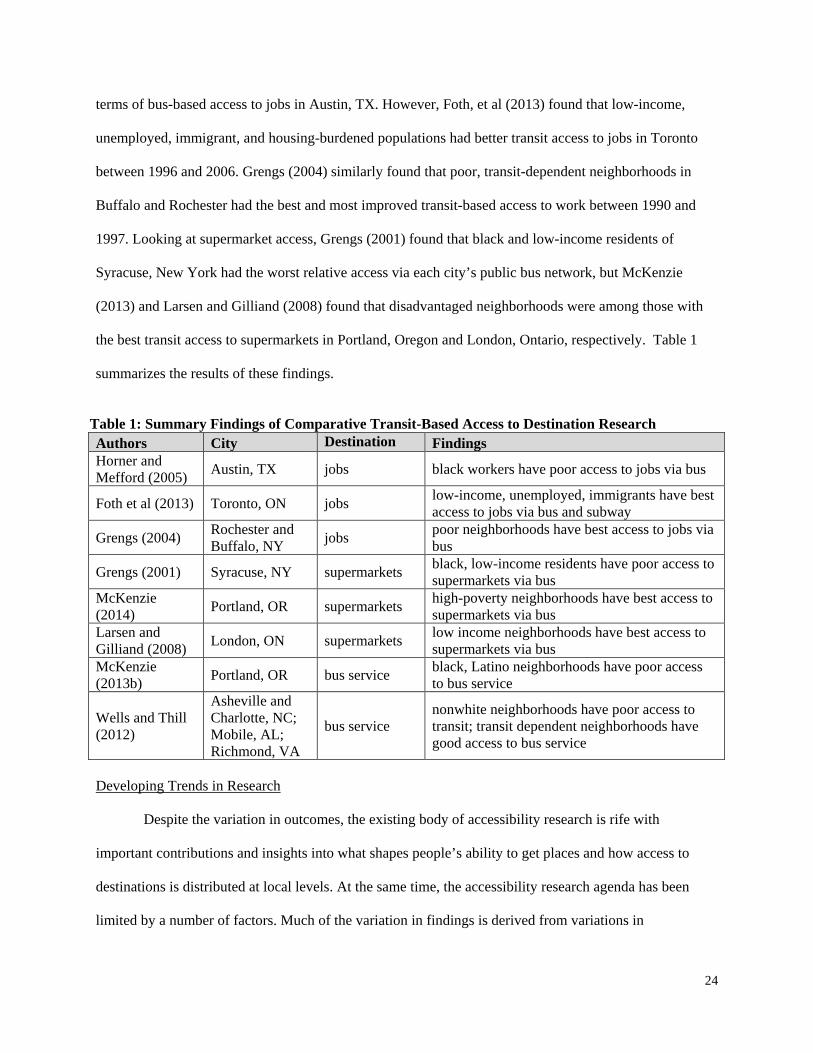
Race and class differences in access via public transit continue to show variation that obfuscates
any conclusive patterns. Horner and Mefford (2005) found that black workers were at a disadvantage in
24
terms of bus-based access to jobs in Austin, TX. However, Foth, et al (2013) found that low-income,
unemployed, immigrant, and housing-burdened populations had better transit access to jobs in Toronto
between 1996 and 2006. Grengs (2004) similarly found that poor, transit-dependent neighborhoods in
Buffalo and Rochester had the best and most improved transit-based access to work between 1990 and
1997. Looking at supermarket access, Grengs (2001) found that black and low-income residents of
Syracuse, New York had the worst relative access via each city’s public bus network, but McKenzie
(2013) and Larsen and Gilliand (2008) found that disadvantaged neighborhoods were among those with
the best transit access to supermarkets in Portland, Oregon and London, Ontario, respectively. Table 1
summarizes the results of these findings.
Table 1: Summary Findings of Comparative Transit-Based Access to Destination Research
Developing Trends in Research
Despite the variation in outcomes, the existing body of accessibility research is rife with
important contributions and insights into what shapes people’s ability to get places and how access to
destinations is distributed at local levels. At the same time, the accessibility research agenda has been
limited by a number of factors. Much of the variation in findings is derived from variations in
Authors City Destination Findings Horner and Mefford (2005) Austin, TX jobs black workers have poor access to jobs via bus
Foth et al (2013) Toronto, ON jobs low-income, unemployed, immigrants have best access to jobs via bus and subway
Grengs (2004) Rochester and Buffalo, NY jobs poor neighborhoods have best access to jobs via
bus
Grengs (2001) Syracuse, NY supermarkets black, low-income residents have poor access to supermarkets via bus
McKenzie (2014) Portland, OR supermarkets high-poverty neighborhoods have best access to
supermarkets via bus Larsen and Gilliand (2008) London, ON supermarkets low income neighborhoods have best access to
supermarkets via bus McKenzie (2013b) Portland, OR bus service black, Latino neighborhoods have poor access
to bus service
Wells and Thill (2012)
Asheville and Charlotte, NC; Mobile, AL; Richmond, VA
bus service nonwhite neighborhoods have poor access to transit; transit dependent neighborhoods have good access to bus service
25
methodological approach. The works that comprise this research body tend to be narrowly focused on one
city at a time, looking at one type of destination or one mode of transportation and incorporating unique
or locally-specific travel parameters that vary city-by-city (Grengs 2014). The lack of consistency in the
literature from a methodological standpoint renders comparisons between studies and cities impossible.
As a result, we are left without a clear understanding of accessibility trends in the aggregate or even how
patterns of transit-based destination accessibility differs between cities.
On top of the relative neglect of studies that focus on transit specifically, accessibility research
has also tended to focus nearly exclusively on access to work destinations (Grengs 2009; Krizek 2005).
While more recent analysis has focused on access to non-work destinations like supermarkets and social
service centers, no published research to date has looked at access to work and non-work destinations
simultaneously. When analysis focuses on one type of destination at the exclusion of another, we impose
a significant limitation on the conclusions we can come to about people’s overall degree of access.
Looking at work and non-work destinations at the same time allows us to gauge the tangible degree to
which transit systems are able to meet their most dependent users’ needs.
This study seeks to fill in the analytical gaps by comparing transit-based access to both work and
non-work destinations by selected demographic characteristics in 12 cities across the United States. The
relationship between accessibility and demographic characteristics of block groups is investigated through
a series of correlation and regression analyses that incorporate a local indicator of accessibility, calculated
with the use of point location information and real-time transit feed data.
Data & Methods Of increasing significance to destination accessibility research is the growing availability of
spatial datasets that are local, reliable, provided publicly, and offered free of charge. Spatial data is often
robust in scope and extent, and is flexible in that it can take an aggregated form as sets of summary
statistics, or reflect specific point-location data, such as the location of schools, hospitals, libraries, or
other landmarks. Point-location data allows us to be specific with questions about space and access,
26
without having to rely on either modeled data or make assumptions about travel behavior. With spatial
data, researchers know where things are and can reliably estimate how long it takes to get there from any
given origin point. This data allows for accessibility analyses to integrate real-world time and distance
measures with continuously updated information about actual destinations. While the strengths of spatial
data are only beginning to be realized outside of the geography and urban planning disciplines, there is
still much versatility with the data as currently offered.
Taking advantage of the availability of actual point location data and tools that allow real-time
transit measurement access, this study develops a cumulative opportunity index, a simplified version of a
gravity model1 that counts the number of destinations accessible given specific starting points and travel
thresholds like travel time or distance. While not as prolific as the gravity model, the cumulative
opportunity index is a reliable and intuitive accessibility indicator that has been used to evaluate access to
jobs and other places (Helling and Sawicki 2003; Horner and Mefford 2005; Jiao et al. 2012; Scott and
Horner 2008). The utility of the cumulative opportunity approach is that it is intuitive and easy to
understand. Because less data manipulation and modeling is involved, the cumulative measure is a
straightforward means to estimating differences in proximity and access2.
1 See Grengs (2009), Krizek (2005). 2 Most of the above-mentioned studies rely on gravity models to develop accessibility indicators at granular geographic levels like traffic analysis zones (TAZ) or Census block groups. The design, use, and interpretation of gravity models is well-discussed in the accessibility literature (Cervero et al. 1999; Grengs 2009; Krizek 2005; Miller 2005), and the reliance of researchers on the gravity model as means to evaluate accessibility is well-documented (Handy and Niemeier 1997; Kwan 1998). Although prolific in the accessibility literature, the gravity model is premised on assumptions that are not always valid. Gravity models estimate accessibility based on two factors associated with travel: the attractiveness of a particular destination, and the costs of traveling from an origin point to that particular destination. But the model is premised on the notion that the influence of destination attractiveness and costs are uniform throughout a population or population segment. Attractiveness is often instrumented using quantifiable characteristics about destinations, such as the number of employees or the volume of retail or commercial sales. The cost of travel is usually based on time or distance, and assumes that everyone is willing to travel the same time or distance to get to a variety of different places. In short, the gravity model assumes that everyone is uniformly more or less willing to travel given certain incentives or disincentives. Another limitation of the gravity model involves the use of the actual data required for its use. The calculation of the impedance function, or the modeled costs incurred given travel to a specific destination, involves collecting modeled trip data calculated through travel demand models. This data is usually made available by local governments or planning agencies (Grengs 2009), but the data itself is sophisticated in nature and tends to be inaccessible to applied researchers who are not specialists in transportation planning or advanced statistics.
27
The transit-based accessibility score is calculated at the block group level in 12 major cities in the
United States. These cities – Baltimore, Boston, Chicago, Denver, Los Angeles, Miami, Philadelphia,
Pittsburgh, San Diego, San Francisco, Seattle, and Washington DC – have large populations and are the
central cities of each respective region, but offer a mixture of transit options. Some cities (Miami,
Pittsburgh, San Diego) are bus-only, while others have robust or growing light-rail systems (Seattle,
Denver). Others offer heavy rail (Boston, Baltimore, Chicago, Los Angeles, Philadelphia, San Francisco,
Washington, DC). While reflecting the diversity of transit options available to residents of different cities
across the country, the study encompasses cities of varying sizes, demographics, and land use orientations.
Regardless of geography, public transit’s mission is the same across space, and this study in part
evaluates the ability of transit agencies in different regions to be successful in terms of service provision.
The project’s methodological framework involves three stages, described in more detail next. The
first stage visualizes accessibility to non-work locations through the generation of coverage polygons or
‘transit sheds’ that represent total accessible land given origin points3. Phase two is ‘accessibility
metrification’ (a phrase borrowed from Farber, Morang, and Widener 2014), where each city block
group’s non-work accessibility score is aggregated, standardized, and joined with a standardized transit-
based jobs per capita accessibility score. In phase three, block-group level accessibility scores are joined
to socio-demographic data. Data sources for each phase are included in a more detailed description of the
methodological approach that follows.
Transit Shed Generation From any given starting point, there is only so much geographic space that a person can access in
a given period of time. If we use the example of 1135 Tremont Street in Boston, a pedestrian, walking at
an average pace and not delayed by any obstacles or impedances, can go about one mile in any direction.
From this starting point, the resulting coverage area, meaning the total reachable area given the travel
time parameters of ‘30 minutes’, ‘walking’, ‘3.1 miles per hour’, and ‘1135 Tremont Street’, is roughly
3 Access to work destinations is calculated separately due to data limitations.
28
four square miles. To measure transit-based accessibility, I first determine and generate coverage areas or
‘transit sheds’ that correspond to the total accessible land given the centroid of each block group as the
starting points. The transit sheds are visualized through the generation of service area polygons in ArcGIS
10.3.
Transit shed polygons are generated using a networked spatial dataset and the Network Analyst
Service Area Analysis tool available in ArcGIS 10.3. A networked spatial dataset calculates travel time,
speed, or coverage over geographical spaces according to fixed routes or other inputs. In this case, I have
calculated coverage based on real-time transit data with the assistance of the ‘Add GTFS to a Network
Dataset’ suite of geospatial processing tools. These tools draw on real-time transit schedule information
that is publicly provided by most major transit agencies (see http://www.gtfs-data-exchange.com) and
street centerline data to integrate public transit route and schedule information into a spatial analysis. The
integration of transit data allows GIS users to estimate coverage areas according to real-world scenarios
that determine travel behaviors and outcomes4.
Accessibility Metrification Once the polygons are generated, pre-selected non-work destinations of opportunity are located
and visualized in tandem with the transit sheds; these destinations include recreational (open spaces and
youth or community centers) and educational opportunities (primary schools, secondary schools, higher
education institutions, libraries). After this destination data is added to the maps that visualize coverage
polygons, a ‘spatial join’ counts the number of locations of a given type within each polygon. These
4 Building a transit-based network dataset requires defining several travel parameters. Transit users are also pedestrians in that they generally walk to a transit stop and then from a transit stop to a desired destination (Walker 2011). I assume a walk speed of approximately 3.1 miles per hour, the average walking pace. Admittedly somewhat generous and giving the benefit to transit systems, I have allowed 5 minutes for the entire process of transitioning between streets, transit lines, and boarding transit vehicles. Generating polygons based on GTFS data is optimized when users select a specific time and day for analysis. I have chosen 8:00 am on a Tuesday because previous work that also uses the GTFS tool uses this time and day(Farber et al. 2014; Ma and Jan-Knapp 2014), and because this represents a typical weekday near peak operating and service hours, and thus calculates coverage according to the maximum degree of accessibility provided by the system. Again, this is giving a benefit to the transit system, in that it allows accessibility calculations based on peak service. Finally, the generated transit sheds are based on 35 minutes of total travel time, inclusive of the 5 minutes allotted to accessing transit vehicles.
29
locations represent the specific destinations that are accessible via transit from the centroid of each block
group.
Rather than the raw count of destinations, this study is interested in the relative share of
destinations accessible to one block group compared to another. After the number of accessible
destinations of each type is counted for every block group, the destination ratio (the number of
destinations accessible by block group out of the total number of destinations) for each type is calculated
at the block group level. For example, if just one library out of 10 total libraries in a city is accessible via
transit from Block Group A, Block Group A’s library accessibility ratio is .1. Non-work destination
accessibility ratios are then aggregated across destination types, resulting in a cumulative non-work
accessibility score at the block group level. The accessibility score is calculated for all block groups that
fall within a city’s boundary within each of the 12 cities.
Measuring access to job opportunities is more complicated because of the unavailability of public
and reliable point location data on job sites and locations. The Environmental Protection Agency’s (EPA)
Smart Location Database is a downloadable spatial geodatabase with broad U.S. coverage that includes
data on 1) the number of working-age residents and 2) the number of jobs accessible within 45 minutes of
transit travel time at the block group level. A simple transit-accessible jobs per capita ratio was
constructed from this dataset at the block group level.
Both non-work and job accessibility scores are standardized at the city level by indexing each
block group’s respective non-work and work accessibility score to the highest respective accessibility
scores of each type. The ‘most accessible’ block group in a city for each destination type, then, has an
accessibility score of 1. This is done for purposes of comparison. Cities differ in terms of resources: not
every city has the same amount of population or land, and cities of different sizes have different numbers
of parks, schools, and libraries. This affects the calculation of raw scores; for example, a block group in a
small city with access to one of two urban libraries has a higher raw library accessibility ratio than a block
group in a large city with access to five out of twenty libraries. Standardizing accessibility scores locally
transforms the metric into a comparable indicator of relative transit-based accessibility that respects each
30
city’s unique volume of resources. Additionally, we cannot say that any given accessibility score is ‘good’
or ‘high’ in absolute terms. Rather, higher accessibility scores reflect more access, and lower scores
reflect less. The data does not suggest that the block group with the highest accessibility score in the
dataset is well-served by transit; rather, higher scores reflect more accessible rather than less accessible
(and again, this is only relative to each city).
Within each city, block-group level work and non-work accessibility scores are standardized
separately to reflect differences in construction of the work and non-work scores. To gauge the global
degree of access inclusive of work and non-work locations, these standardized accessibility scores are
then aggregated into an overall transit-based accessibility score5. The overall score thus represents the
relative share of recreational, educational, and job opportunities accessible via transit from a block group
in a given city.
Socio-Demographic Variables The U.S. Census has made available spatial datasets based on American Community Survey
(ACS) data that disaggregate social and demographic characteristics of residents and households to the
block group level. Joining this data with block-group level accessibility scores allows for an analysis of
accessibility patterns by race, income, and other social characteristics. Running this analysis on several
cities simultaneously using the same accessibility indicator allows analysis on patterns both within cities
and also between cities. Owing to this consistency, we can then see how cities compare to each other in
terms of the degree of access provided by population segment. Identifying block groups in this way
allows for stratification of accessibility scores across social groups, and for an opportunity to gauge the
social distribution of transit accessibility across cities.
Although a household’s transit dependency is officially defined according to whether or not a
household’s members own any vehicles, other urban population segments found to heavily rely on public
transit for transportation are often included in accessibility analyses. As we are approaching accessibility
5 Given that the score is an aggregate of standardized scores, there is no need for further standardization.
31
through a lens of social exclusion and transit dependency, this analysis is particularly interested in
accessibility patterns among block groups with varying shares of nonwhite, Hispanic, renter, and zero-
vehicle households. This study also analyzes accessibility variations across income groups; block groups
are organized by quartile into groups based on median household income. The share of each population
segment within each block group is captured from 2013 American Community Survey (ACS) 5-year data.
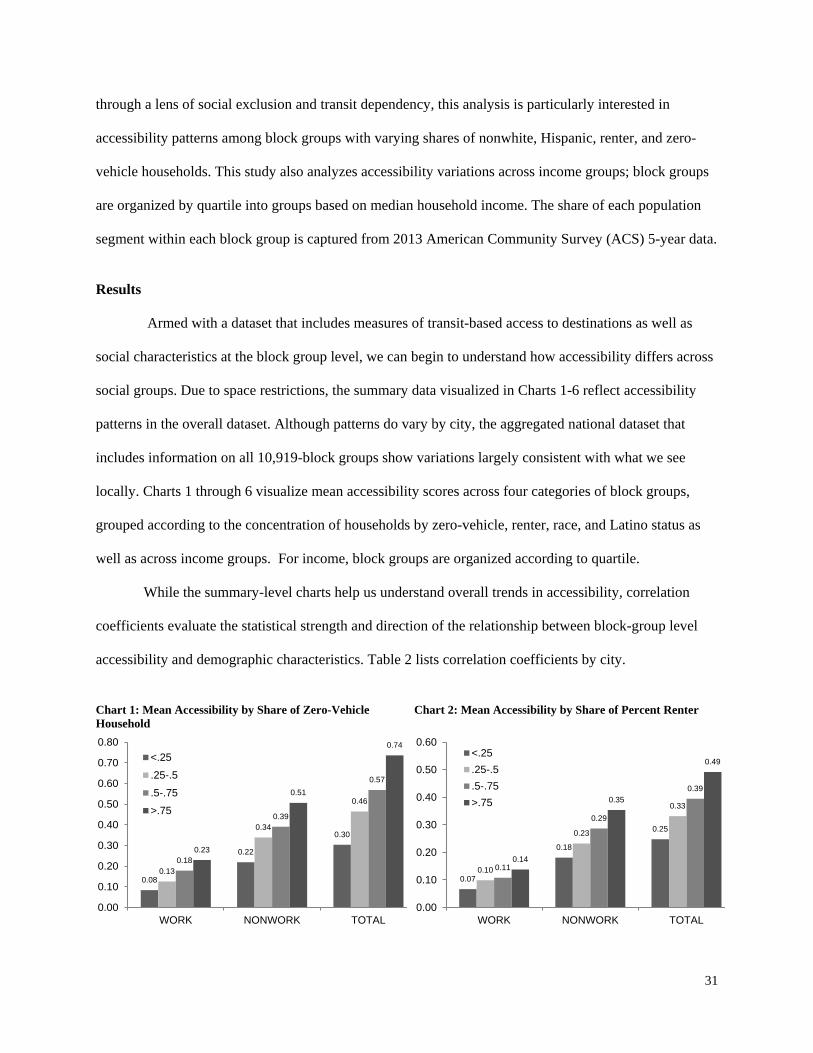
Results Armed with a dataset that includes measures of transit-based access to destinations as well as
social characteristics at the block group level, we can begin to understand how accessibility differs across
social groups. Due to space restrictions, the summary data visualized in Charts 1-6 reflect accessibility
patterns in the overall dataset. Although patterns do vary by city, the aggregated national dataset that
includes information on all 10,919-block groups show variations largely consistent with what we see
locally. Charts 1 through 6 visualize mean accessibility scores across four categories of block groups,
grouped according to the concentration of households by zero-vehicle, renter, race, and Latino status as
well as across income groups. For income, block groups are organized according to quartile.
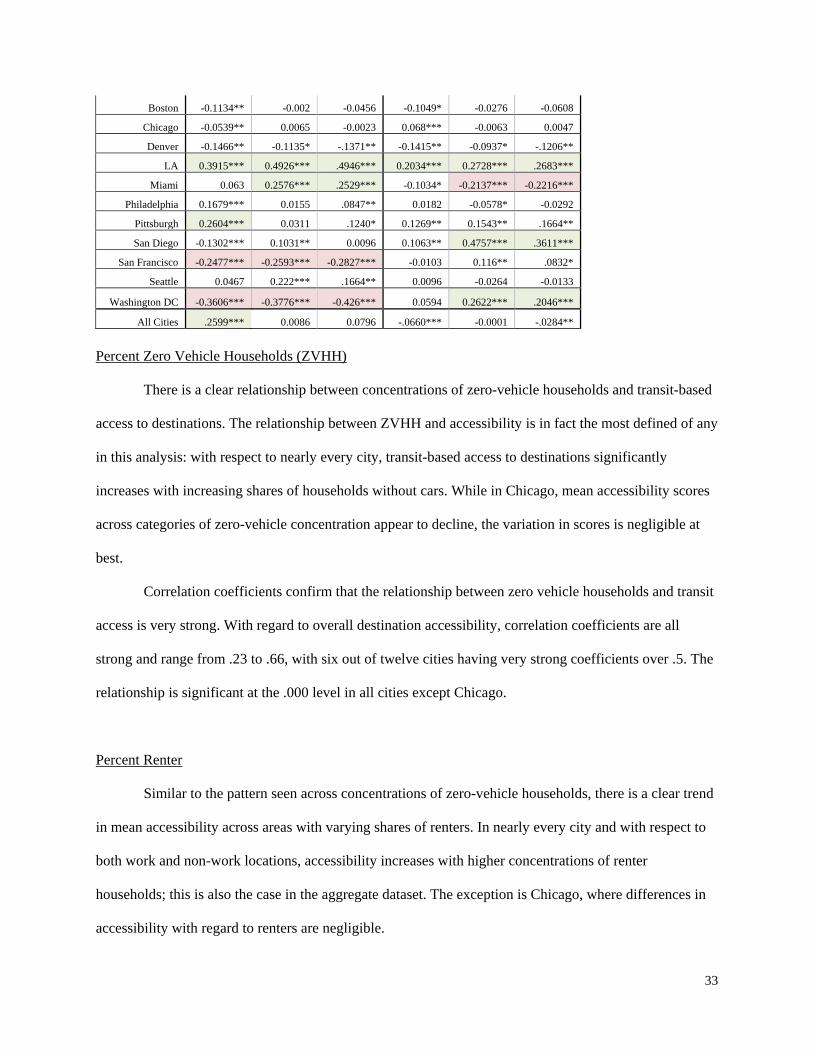
While the summary-level charts help us understand overall trends in accessibility, correlation
coefficients evaluate the statistical strength and direction of the relationship between block-group level
accessibility and demographic characteristics. Table 2 lists correlation coefficients by city.
Chart 1: Mean Accessibility by Share of Zero-Vehicle Household
Chart 2: Mean Accessibility by Share of Percent Renter
0.08
0.22
0.30
0.13
0.34
0.46
0.18
0.39
0.57
0.23
0.51
0.74
0.00
0.10
0.20
0.30
0.40
0.50
0.60
0.70
0.80
WORK NONWORK TOTAL
<.25.25-.5.5-.75>.75
0.07
0.18
0.25
0.10
0.23
0.33
0.11
0.29
0.39
0.14
0.35
0.49
0.00
0.10
0.20
0.30
0.40
0.50
0.60
WORK NONWORK TOTAL
<.25.25-.5.5-.75>.75

32
Chart 3: Mean Accessibility by Quartile of Median Household Income
Chart 4: Mean Accessibility by Share of Percent Nonwhite
Chart 5: Mean Accessibility by Share of Percent Latino
Table 2: Correlation Coefficients
% ZVHH % RENT MEDIAN HH INCOME
WORK NONWORK TOTAL WORK NONWORK TOTAL WORK NONWORK TOTAL
Baltimore 0.4051*** 0.2573*** .3591*** 0.2678*** 0.1854*** .2509*** -0.2507*** -0.204*** -.2617***
Boston 0.3325*** 0.5946*** .5594*** 0.1444*** 0.3552*** .3131*** 0.1487*** -0.0692 0.0079
Chicago 0.0443* -0.0148 -0.007 0.044* -0.0029 0.0041 0.0164 0.0065 0.0087
Denver 0.2759*** 0.4431*** .4283*** 0.1314** 0.3307*** .2927*** 0.0401 -0.0951* -0.0561
LA 0.5057*** 0.6583*** .6536*** 0.3978*** 0.557*** .5404*** -0.3185*** -0.4527*** -.4372***
Miami 0.1499** 0.2724*** 0.2867*** 0.1531** 0.3144*** .3263*** -0.0632 -0.1388** -.1430**
Philadelphia 0.4789*** 0.4543*** .5067*** 0.3057*** 0.3891*** .3874*** -0.1498*** 0.0044 -.0638*
Pittsburgh 0.2921*** 0.2895*** 0.333*** 0.2528*** 0.4332*** .4274*** -0.1222** -0.0987 -.1222*
San Diego 0.3477*** 0.5372*** .5098*** 0.473*** 0.5351*** .5645*** -0.3631*** -0.5268*** -.5098***
San Francisco 0.3442*** 0.7812*** .6609*** 0.3329*** 0.5862*** .5580*** 0.0405 -0.206*** -.1397**
Seattle 0.5366*** 0.6227*** .6403*** 0.4594*** 0.5466*** .5570*** -0.2176*** -0.3864*** -.3479***
Washington DC 0.1299** 0.2491*** 0.2294*** 0.0395 0.1805*** .1402** 0.1647*** 0.0749 .1290**
All Cities .3027*** .3995*** .4196*** .2053*** .3167*** .3178*** -.1750*** -.0812*** -.0994***
% NONWHITE % LATINO
WORK NONWORK TOTAL WORK NONWORK TOTAL
Baltimore 0.2265*** 0.2067*** .2562*** -0.0773* -0.1579*** -.1645***
0.13
0.33
0.46
0.11
0.27
0.38
0.09
0.24
0.33
0.09
0.23
0.32
0.000.050.100.150.200.250.300.350.400.450.50
WORK NONWORK TOTAL
<.25.25-.5.5-.75>.75
0.10
0.25
0.35
0.10
0.26
0.36
0.12
0.28
0.39
0.11
0.29
0.40
0.00
0.05
0.10
0.15
0.20
0.25
0.30
0.35
0.40
0.45
WORK NONWORK TOTAL
<.25.25-.5.5-.75>.75
0.11
0.27
0.39
0.09
0.26
0.35
0.08
0.26
0.34
0.10
0.28
0.38
0.00
0.05
0.10
0.15
0.20
0.25
0.30
0.35
0.40
0.45
WORK NONWORK TOTAL
<.25.25-.5.5-.75>.75
33
Boston -0.1134** -0.002 -0.0456 -0.1049* -0.0276 -0.0608
Chicago -0.0539** 0.0065 -0.0023 0.068*** -0.0063 0.0047
Denver -0.1466** -0.1135* -.1371** -0.1415** -0.0937* -.1206**
LA 0.3915*** 0.4926*** .4946*** 0.2034*** 0.2728*** .2683***
Miami 0.063 0.2576*** .2529*** -0.1034* -0.2137*** -0.2216***
Philadelphia 0.1679*** 0.0155 .0847** 0.0182 -0.0578* -0.0292
Pittsburgh 0.2604*** 0.0311 .1240* 0.1269** 0.1543** .1664**
San Diego -0.1302*** 0.1031** 0.0096 0.1063** 0.4757*** .3611***
San Francisco -0.2477*** -0.2593*** -0.2827*** -0.0103 0.116** .0832*
Seattle 0.0467 0.222*** .1664** 0.0096 -0.0264 -0.0133
Washington DC -0.3606*** -0.3776*** -0.426*** 0.0594 0.2622*** .2046***
All Cities .2599*** 0.0086 0.0796 -.0660*** -0.0001 -.0284**
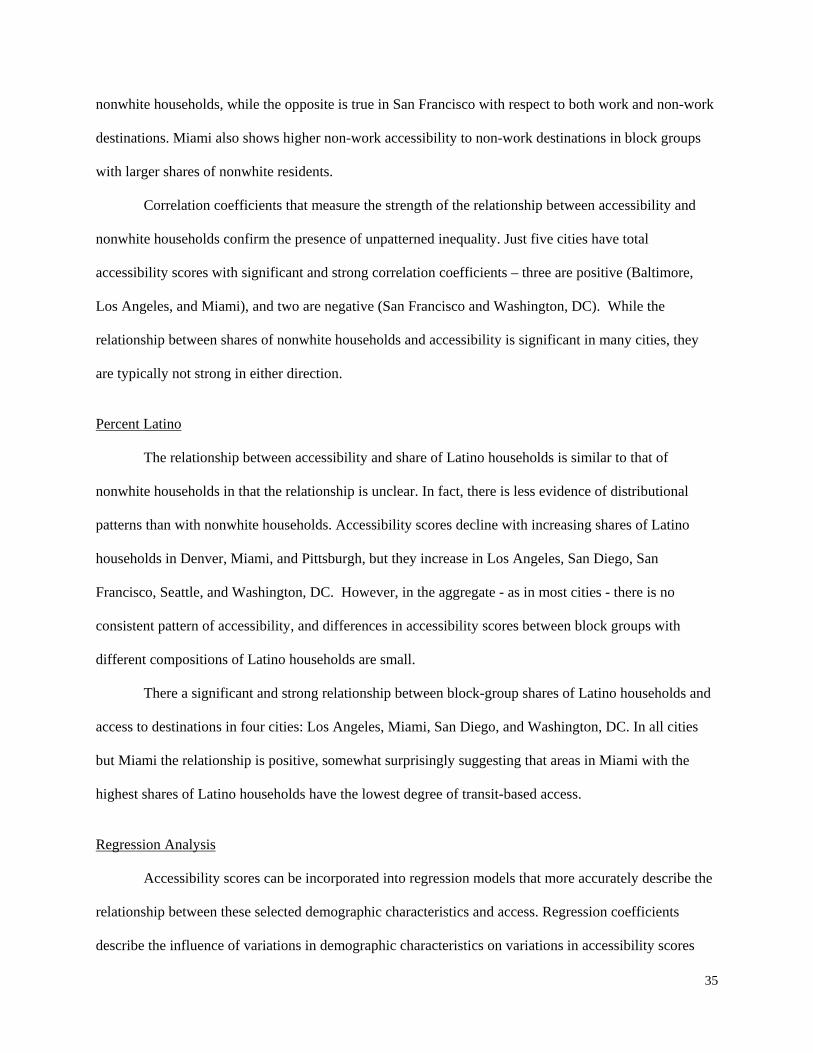
Percent Zero Vehicle Households (ZVHH)
There is a clear relationship between concentrations of zero-vehicle households and transit-based
access to destinations. The relationship between ZVHH and accessibility is in fact the most defined of any
in this analysis: with respect to nearly every city, transit-based access to destinations significantly
increases with increasing shares of households without cars. While in Chicago, mean accessibility scores
across categories of zero-vehicle concentration appear to decline, the variation in scores is negligible at
best.
Correlation coefficients confirm that the relationship between zero vehicle households and transit
access is very strong. With regard to overall destination accessibility, correlation coefficients are all
strong and range from .23 to .66, with six out of twelve cities having very strong coefficients over .5. The
relationship is significant at the .000 level in all cities except Chicago.
Percent Renter
Similar to the pattern seen across concentrations of zero-vehicle households, there is a clear trend
in mean accessibility across areas with varying shares of renters. In nearly every city and with respect to
both work and non-work locations, accessibility increases with higher concentrations of renter
households; this is also the case in the aggregate dataset. The exception is Chicago, where differences in
accessibility with regard to renters are negligible.
34
Correlation results mirror the summary patterns. In all cities except Chicago and Washington, DC
the relationship between the share of renter households and the total accessibility scores of block groups
is significant and strong. In Washington, DC, the relationship is significant but weak. In seven out of
twelve cities the relationship between renter households and work accessibility is strong, significant, and
positive, as is the case with nine out of twelve cities with respect to non-work accessibility. In these cities,
the relationship between renters and non-work access is particularly strong, with correlation coefficients
ranging from .31 on the low end to .57 at the upper limit.
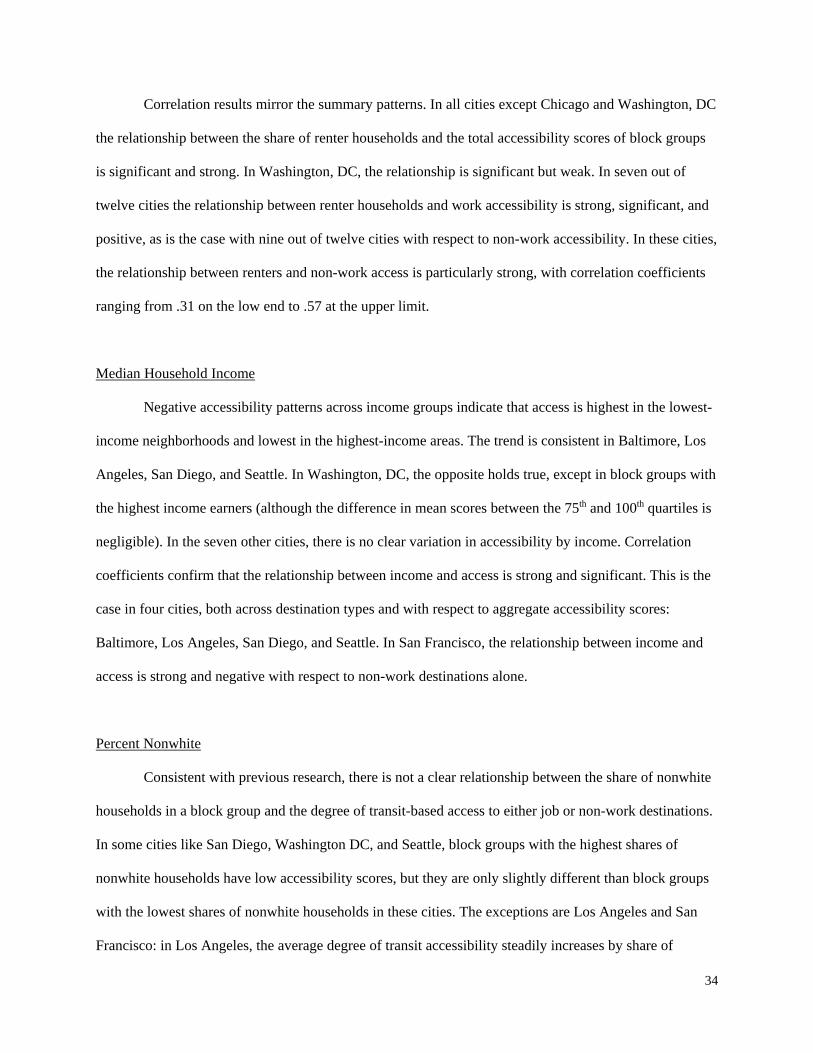
Median Household Income
Negative accessibility patterns across income groups indicate that access is highest in the lowest-
income neighborhoods and lowest in the highest-income areas. The trend is consistent in Baltimore, Los
Angeles, San Diego, and Seattle. In Washington, DC, the opposite holds true, except in block groups with
the highest income earners (although the difference in mean scores between the 75th and 100th quartiles is
negligible). In the seven other cities, there is no clear variation in accessibility by income. Correlation
coefficients confirm that the relationship between income and access is strong and significant. This is the
case in four cities, both across destination types and with respect to aggregate accessibility scores:
Baltimore, Los Angeles, San Diego, and Seattle. In San Francisco, the relationship between income and
access is strong and negative with respect to non-work destinations alone.
Percent Nonwhite
Consistent with previous research, there is not a clear relationship between the share of nonwhite
households in a block group and the degree of transit-based access to either job or non-work destinations.
In some cities like San Diego, Washington DC, and Seattle, block groups with the highest shares of
nonwhite households have low accessibility scores, but they are only slightly different than block groups
with the lowest shares of nonwhite households in these cities. The exceptions are Los Angeles and San
Francisco: in Los Angeles, the average degree of transit accessibility steadily increases by share of
35
nonwhite households, while the opposite is true in San Francisco with respect to both work and non-work
destinations. Miami also shows higher non-work accessibility to non-work destinations in block groups
with larger shares of nonwhite residents.
Correlation coefficients that measure the strength of the relationship between accessibility and
nonwhite households confirm the presence of unpatterned inequality. Just five cities have total
accessibility scores with significant and strong correlation coefficients – three are positive (Baltimore,
Los Angeles, and Miami), and two are negative (San Francisco and Washington, DC). While the
relationship between shares of nonwhite households and accessibility is significant in many cities, they
are typically not strong in either direction.
Percent Latino The relationship between accessibility and share of Latino households is similar to that of
nonwhite households in that the relationship is unclear. In fact, there is less evidence of distributional
patterns than with nonwhite households. Accessibility scores decline with increasing shares of Latino
households in Denver, Miami, and Pittsburgh, but they increase in Los Angeles, San Diego, San
Francisco, Seattle, and Washington, DC. However, in the aggregate - as in most cities - there is no
consistent pattern of accessibility, and differences in accessibility scores between block groups with
different compositions of Latino households are small.
There a significant and strong relationship between block-group shares of Latino households and
access to destinations in four cities: Los Angeles, Miami, San Diego, and Washington, DC. In all cities
but Miami the relationship is positive, somewhat surprisingly suggesting that areas in Miami with the
highest shares of Latino households have the lowest degree of transit-based access.
Regression Analysis
Accessibility scores can be incorporated into regression models that more accurately describe the
relationship between these selected demographic characteristics and access. Regression coefficients
describe the influence of variations in demographic characteristics on variations in accessibility scores
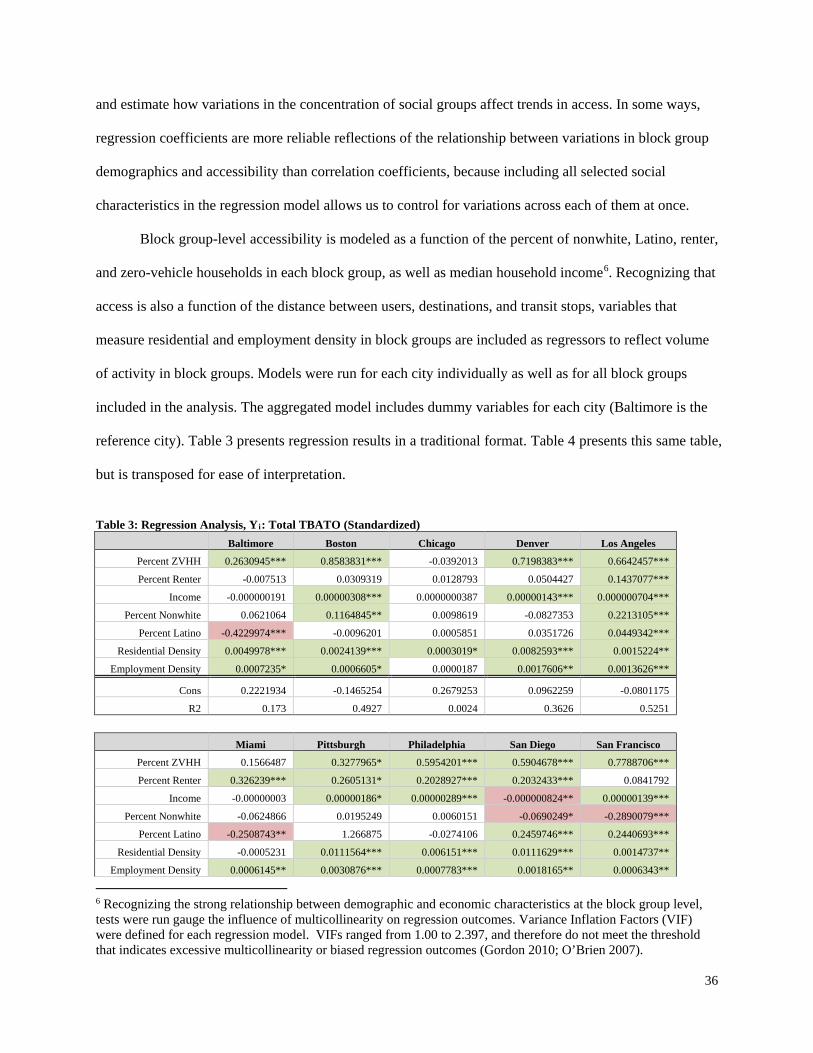
36
and estimate how variations in the concentration of social groups affect trends in access. In some ways,
regression coefficients are more reliable reflections of the relationship between variations in block group
demographics and accessibility than correlation coefficients, because including all selected social
characteristics in the regression model allows us to control for variations across each of them at once.
Block group-level accessibility is modeled as a function of the percent of nonwhite, Latino, renter,
and zero-vehicle households in each block group, as well as median household income6. Recognizing that
access is also a function of the distance between users, destinations, and transit stops, variables that
measure residential and employment density in block groups are included as regressors to reflect volume
of activity in block groups. Models were run for each city individually as well as for all block groups
included in the analysis. The aggregated model includes dummy variables for each city (Baltimore is the
reference city). Table 3 presents regression results in a traditional format. Table 4 presents this same table,
but is transposed for ease of interpretation.
Table 3: Regression Analysis, Yi: Total TBATO (Standardized)
Baltimore Boston Chicago Denver Los Angeles
Percent ZVHH 0.2630945*** 0.8583831*** -0.0392013 0.7198383*** 0.6642457***
Percent Renter -0.007513 0.0309319 0.0128793 0.0504427 0.1437077***
Income -0.000000191 0.00000308*** 0.0000000387 0.00000143*** 0.000000704***
Percent Nonwhite 0.0621064 0.1164845** 0.0098619 -0.0827353 0.2213105***
Percent Latino -0.4229974*** -0.0096201 0.0005851 0.0351726 0.0449342***
Residential Density 0.0049978*** 0.0024139*** 0.0003019* 0.0082593*** 0.0015224**
Employment Density 0.0007235* 0.0006605* 0.0000187 0.0017606** 0.0013626***
Cons 0.2221934 -0.1465254 0.2679253 0.0962259 -0.0801175
R2 0.173 0.4927 0.0024 0.3626 0.5251
Miami Pittsburgh Philadelphia San Diego San Francisco
Percent ZVHH 0.1566487 0.3277965* 0.5954201*** 0.5904678*** 0.7788706***
Percent Renter 0.326239*** 0.2605131* 0.2028927*** 0.2032433*** 0.0841792
Income -0.00000003 0.00000186* 0.00000289*** -0.000000824** 0.00000139***
Percent Nonwhite -0.0624866 0.0195249 0.0060151 -0.0690249* -0.2890079***
Percent Latino -0.2508743** 1.266875 -0.0274106 0.2459746*** 0.2440693***
Residential Density -0.0005231 0.0111564*** 0.006151*** 0.0111629*** 0.0014737**
Employment Density 0.0006145** 0.0030876*** 0.0007783*** 0.0018165** 0.0006343**
6 Recognizing the strong relationship between demographic and economic characteristics at the block group level, tests were run gauge the influence of multicollinearity on regression outcomes. Variance Inflation Factors (VIF) were defined for each regression model. VIFs ranged from 1.00 to 2.397, and therefore do not meet the threshold that indicates excessive multicollinearity or biased regression outcomes (Gordon 2010; O’Brien 2007).
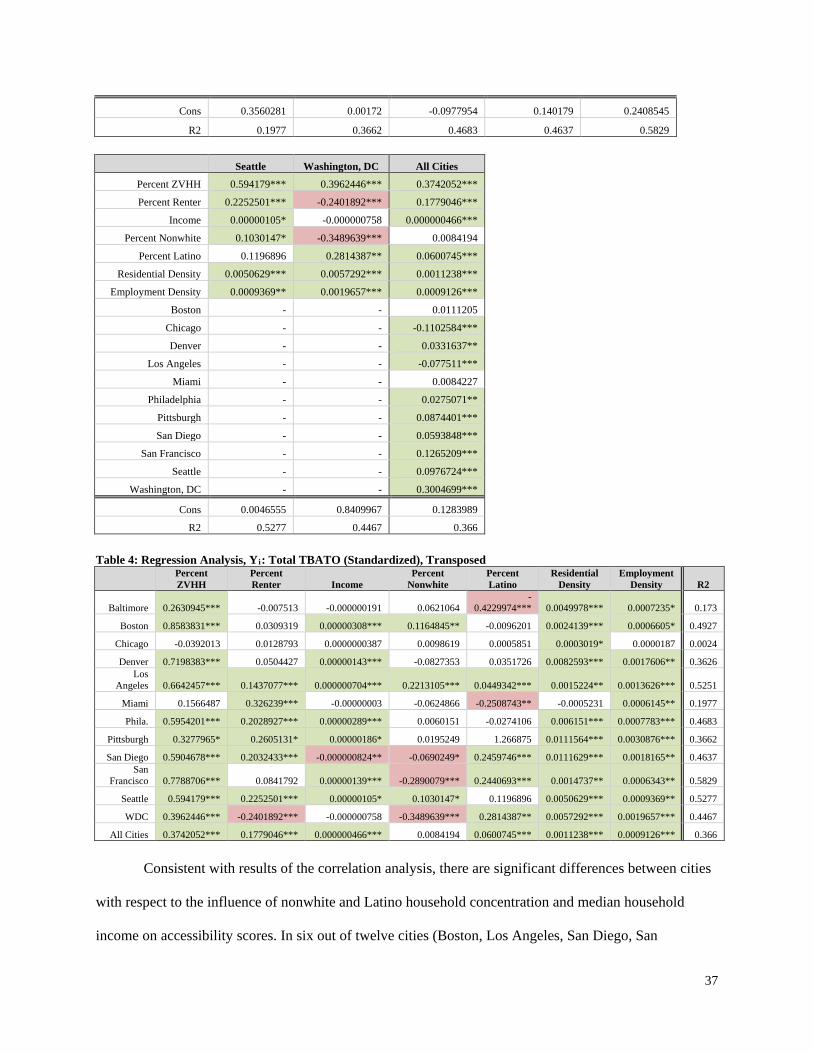
37
Cons 0.3560281 0.00172 -0.0977954 0.140179 0.2408545
R2 0.1977 0.3662 0.4683 0.4637 0.5829
Seattle Washington, DC All Cities
Percent ZVHH 0.594179*** 0.3962446*** 0.3742052***
Percent Renter 0.2252501*** -0.2401892*** 0.1779046*** Income 0.00000105* -0.000000758 0.000000466*** Percent Nonwhite 0.1030147* -0.3489639*** 0.0084194 Percent Latino 0.1196896 0.2814387** 0.0600745*** Residential Density 0.0050629*** 0.0057292*** 0.0011238*** Employment Density 0.0009369** 0.0019657*** 0.0009126*** Boston - - 0.0111205 Chicago - - -0.1102584*** Denver - - 0.0331637** Los Angeles - - -0.077511*** Miami - - 0.0084227 Philadelphia - - 0.0275071** Pittsburgh - - 0.0874401*** San Diego - - 0.0593848*** San Francisco - - 0.1265209*** Seattle - - 0.0976724*** Washington, DC - - 0.3004699***
Cons 0.0046555 0.8409967 0.1283989 R2 0.5277 0.4467 0.366
Table 4: Regression Analysis, Yi: Total TBATO (Standardized), Transposed
Percent ZVHH
Percent Renter Income
Percent Nonwhite
Percent Latino
Residential Density
Employment Density R2
Baltimore 0.2630945*** -0.007513 -0.000000191 0.0621064 -
0.4229974*** 0.0049978*** 0.0007235* 0.173
Boston 0.8583831*** 0.0309319 0.00000308*** 0.1164845** -0.0096201 0.0024139*** 0.0006605* 0.4927
Chicago -0.0392013 0.0128793 0.0000000387 0.0098619 0.0005851 0.0003019* 0.0000187 0.0024
Denver 0.7198383*** 0.0504427 0.00000143*** -0.0827353 0.0351726 0.0082593*** 0.0017606** 0.3626 Los
Angeles 0.6642457*** 0.1437077*** 0.000000704*** 0.2213105*** 0.0449342*** 0.0015224** 0.0013626*** 0.5251
Miami 0.1566487 0.326239*** -0.00000003 -0.0624866 -0.2508743** -0.0005231 0.0006145** 0.1977
Phila. 0.5954201*** 0.2028927*** 0.00000289*** 0.0060151 -0.0274106 0.006151*** 0.0007783*** 0.4683
Pittsburgh 0.3277965* 0.2605131* 0.00000186* 0.0195249 1.266875 0.0111564*** 0.0030876*** 0.3662
San Diego 0.5904678*** 0.2032433*** -0.000000824** -0.0690249* 0.2459746*** 0.0111629*** 0.0018165** 0.4637 San
Francisco 0.7788706*** 0.0841792 0.00000139*** -0.2890079*** 0.2440693*** 0.0014737** 0.0006343** 0.5829
Seattle 0.594179*** 0.2252501*** 0.00000105* 0.1030147* 0.1196896 0.0050629*** 0.0009369** 0.5277
WDC 0.3962446*** -0.2401892*** -0.000000758 -0.3489639*** 0.2814387** 0.0057292*** 0.0019657*** 0.4467
All Cities 0.3742052*** 0.1779046*** 0.000000466*** 0.0084194 0.0600745*** 0.0011238*** 0.0009126*** 0.366
Consistent with results of the correlation analysis, there are significant differences between cities
with respect to the influence of nonwhite and Latino household concentration and median household
income on accessibility scores. In six out of twelve cities (Boston, Los Angeles, San Diego, San
38
Francisco, Seattle, and Washington, DC), the share of nonwhite households in a block group is a
significant predictor of accessibility, but coefficients vary by direction and strength. The same is true for
shares of Latino households, although when the relationship is positive (as it is in San Diego, San
Francisco, and Washington DC), the effect is significant. Income is significant in seven out of the twelve
models (Boston, Denver, Los Angeles, Philadelphia, Pittsburgh, San Francisco, Seattle); all coefficients
are positive but the effects are very small.
Contrary to expectations, the percent of renters in a block group is a significant predictor of
accessibility in just seven out of twelve cities (Los Angeles, Miami, Philadelphia, Pittsburgh, San Diego,
Seattle, and Washington DC). Although the influence is large, in Washington DC the relationship is
negative. As we would expect, the percent of zero vehicle households is almost universally significant,
with the exception of Chicago and Miami. When significant, the relationship between accessibility and
zero vehicle households is strong – regression coefficients across cities range from .26 (Baltimore) to .85
(Boston).
The additional density regressors are also significant predictors of accessibility across most cities,
the exceptions again being Miami with respect to residential density and Chicago with respect to
employment density. While consistently significant, the influence of the density variables is very small.
Across the models, the R2 ranges from .0024 to .5829. Clearly, there is significant local variation
regarding the predictability of accessibility based on demographic and land use patterns.
Discussion
Given what we know about transit reliance by socially vulnerable households, one hypothesis
might have anticipated a strong and positive relationship between access to destinations and the share of
nonwhite, Latino, renter, and zero-vehicle households. On the other hand, patterns of residential land use
and the high valuation of homes in public transit station areas often render transit access difficult for low-
income households. And yet, existing research shows that the most frequent trend with respect to access
39
by social group is one of unpatterned inequality, where little consistency is found. The results offered by
this analysis point to three key findings that in fact confirm this suite of hypotheses.
The first major finding concerns the variation across cities in terms of how much the
socioeconomic characteristics of block groups predict the degree of transit-based access provided at the
block-group level. There is much variation in the predictive power of the regression model by city: the R2
of the city-specific models range from .0024 to .5829. In some cities like Chicago, Baltimore, and Miami,
very little about accessibility differences are explained race, income, tenure, and the other control
variables. But in 9 out of 12 cities, the R2 is over .36. This means in these places, that the socio-
demographic makeup of a local neighborhood is a good indicator of the level of transit service that is
available there.
In addition to the fluctuations in accessibility patterns across cities, the distribution of transit-
based access to destinations across social groups greatly varies within cities. In some cities, trends favor
block groups with high shares of low-income households and/or households of color. In other cities, the
opposite is true. With respect to the concentration of nonwhite populations, regression coefficients are
strong and positive for four out of twelve cities, meaning that increases in accessibility scores are
positively related to rising concentrations of nonwhite residents, even while controlling for other factors.
However, in San Diego, San Francisco, and Washington DC, the coefficients on percent nonwhite are
strong but negative. In these cities, the lower accessibility scores in areas with greater nonwhite
concentrations may reflect the high degree of racial segregation that define residential housing patterns
there, particularly in neighborhoods close to transit stations. For example, a recent Census report found
that the share of black workers who lived within a half mile of a transit rail stop in Washington, DC
declined nearly ten percent between the 2006-2008 and 2011-2013 ACS data collection periods, while the
share of white and high-income earners increased. According to this data, white workers now comprise
56% of all workers in DC neighborhoods with proximate transit rail access (McKenzie 2015).
The widest variation concerns the distribution of transit access by Latino households. In many
cities, there appears to be no significant relationship between access and percent Latino following both
40
correlation and regression analysis. However, in Miami, the relationship surprisingly appears to be
negative. Latinos make up a significant share of the population there, but the rate of Latino
suburbanization is much higher in the Miami-Dade region than in other U.S. Latino enclaves (Martin
2006). Miami also has the highest dissimilarity rates between Cubans – the most populous Latino group
in Miami – and non-Hispanic whites in the country, which again suggest high levels of residential
segregation by race and ethnicity (Iceland, Weinberg, and Hughes 2014).
Accessibility patterns with respect to median household income are particularly complex.
Correlation coefficients initially suggest a largely negative pattern between income and access, meaning
that as income goes up, access goes down. This appears to bias accessibility towards low-income
households. But when access is regressed on income and demographic factors are controlled for, the sign
on the coefficient flips in nearly every city. In other words, when percent nonwhite, Latino, renter, and
zero-vehicle household are taken into consideration, access tends to be positively associated with median
household income.
In showing the variation in accessibility patterns across social groups and that these patterns are
unique to different cities, this research confirms the results of existing accessibility analyses. However,
the macro-level approach that this project has adopted contributes a new finding that single-city case
studies cannot. The third finding of this research is the consistency with respect to transit-based access
across zero-vehicle households and renters. As the share of zero-vehicle households and renters in a block
group increases, so does accessibility. This is almost universally true, and is consistent even in regression
analyses that control for potentially confounding socio-demographic and land use characteristics. Often
the minority in cities, households without cars tend to concentrate in areas that have high transit
accessibility. This outcome suggests that those who are most directly dependent on transit – those without
private vehicles of their own – are generally very well positioned in cities to maximize the utility of the
transit system. This is true in cities with or without heavy rail or rapid transit, with transit systems that are
small, medium-sized, or extensive. There is much overlap between the renter and zero-vehicle
populations, but even independent of zero-vehicle households, renters maintain a strong presence in areas
41
with the best degree of transit-based access across most cities as well. As the above discussion suggests,
however, we however cannot be confident that these zero-vehicle and renter households are representative
of those social groups that are traditionally socially vulnerable. For example, these zero-vehicle
households may be high-earning Millennials, who have shown preference towards alternative forms of
transit besides driving (USPIRG, McDonald 2015).
Taken as a whole, these results suggest that transit equity outcomes are the product of local
narratives: cities each have their own equity stories to tell that are often reflections of local social forces.
In San Francisco, access is positively related to shares of zero vehicle and renter households. But
accessibility scores go down as shares of nonwhite and Latino households go up, meaning that the block
groups with the fewest nonwhite and Latino households have the highest degree of access. Accessibility
also rises with income, indicating that the city’s highest earning households also have the best relative
transit access. The San Francisco accessibility pattern, then, appears to benefit households that are white,
non-Latino, earn relatively high incomes, rent their homes, and/or do not own a car. This is congruent
with the acknowledgement that the dual themes of gentrification and displacement have been key trends
in San Francisco for many years.
Conclusion
Accessibility is primarily a product of local land use patterns and the design of the local
transportation network, including the public transit system. In describing the drivers of access, land use
features tend to receive a lot of attention in academic and policy circles. The density of development, the
share of affordable housing available in station areas, the degree of residential segregation, and the
distribution of employment are routinely discussed as factors that shape accessibility patterns and travel
behaviors. Meanwhile, the impact of transportation-related policies – and especially public transit agency
policies – is less understood. This is puzzling, given that level of transit service provided in cities is a
direct result of decisions made within or with respect to transit agencies. The availability, frequency,
quality, and distribution of transit service have clear repercussions on its utility and the degree of access
42
provided to users. How variations in these agency-level features impact variations in accessibility
deserves further exploration. Future research will investigate how local, agency-level characteristics like
the size and shape of transit systems, the ratio of capital to operating funds, and degree of citizen
participation in decision-making impact accessibility patterns. The overall intention of this research is to
better understand the role and significance of local factors in shaping patterns of access. The analysis
presented in this paper represents a significant first step towards meeting this goal.
43
References Blumenberg, Evelyn, and Paul Ong. 1998. “Job Accessibility and Welfare Usage: Evidence from Los
Angeles.” Journal of Policy Analysis and Management 17(4):639–57.
Bullard, Robert D. 2003. “Addressing Urban Transportation Equity in the United States Addressing Urban Transportation Equity in the United States.” Fordham Urban Law Journal 31(5):1183–1209.
Bullard, Robert D., and Glenn Johnson. 1997. Just Transportation: Dismantling Race and Class Barriers to Mobility. edited by Robert D. Bullard and Glenn S. Johnston. Gabriola Island, British Columbia: New Society Publishers.
Cervero, R., T. Rood, and B. Appleyard. 1999. “Tracking Accessibility: Employment and Housing Opportunities in the San Francisco Bay Area.” Environment and Planning A 31:1259–78.
Cervero, Robert. 1997. “Paradigm Shift: From Automobility to Accessibility Planning.” Urban Futures: Issues for Australian cities (Issue 22):9–20.
Church, a., M. Frost, and K. Sullivan. 2000. “Transport and Social Exclusion in London.” Transport Policy 7(3):195–205.
Cingranelli, David L. 1981. “Race, Politics and Elites: Testing Alternative Models of Municipal Service Distribution.” American Journal of Political Science 25(4):664–92.
Clifton, Kelly, and Karen Lucas. 2004. “Examining the Empirical Evidence of Transport Inequality in the US and UK.” Pp. 15–38 in Running on empty: Transport, social exclusion, and environmental justice, edited by Karen Lucas. Bristol: The Policy Press.
Doyle, D.Gregg, and Brian D. Taylor. 2000. “Variation in Metropolitan Travel Behavior by Sex and Ethnicity.” Pp. 181–244 in Travel Patterns of People of Color. Washington, D.C.: U.S. Department of Transportation.
El-Geneidy, Ahmed, and David Levinson. 2006. “Mapping Accessibility over Time.” Journal of Maps 3(1):76–87.
Farber, Steven, Melinda Z. Morang, and Michael J. Widener. 2014. “Temporal Variability in Transit-Based Accessibility to Supermarkets.” Applied Geography 53:149–59.
Foth, Nicole, Kevin Manaugh, and Ahmed M. El-Geneidy. 2013. “Towards Equitable Transit: Examining Transit Accessibility and Social Need in Toronto, Canada, 1996–2006.” Journal of Transport Geography 29:1–10.
Garrett, Mark, and Brian Taylor. 1999. “Reconsidering Social Equity in Public Transit.” Berkeley Planning Journal 13(1):6–27.
Glaeser, Edward L., Matthew E. Kahn, and Jordan Rappaport. 2008. “Why Do the Poor Live in Cities? The Role of Public Transportation.” Journal of Urban Economics 63(1):1–24.
Gordon, Rachel A. 2010. Regression Analysis for the Social Sciences. New York: Routledge.
Grengs, Joe. 2001. “Does Public Transit Counteract the Segregation of Carless Households? Measuring Spatial Patterns of Accessibility.” Transportation Research Record 1753(1):3–10.
Grengs, Joe. 2004. “Measuring Change in Small-Scale Transit Accessibility with Geographic Information Systems: Buffalo and Rochester, New York.” Transportation Research Record 1887(1):10–17.
Grengs, Joe. 2009. Nonwork Travel and Accessibility A Social Equity Analysis of Detroit Nonwork Travel and Accessibility A Social Equity Analysis of Detroit Prepared for the Federal Transit
44
Administration. Ann Arbor, MI.
Grengs, Joe. 2010. “Job Accessibility and the Modal Mismatch in Detroit.” Journal of Transport Geography 18(1):42–54.
Grengs, Joe. 2014. “Equity of What in Transportation? Accessibility Evaluation in Intermetropolitan Comparison.” San Antonio, Texas: Urban Affairs Association Annual Meeting.
Grengs, Joe. 2015. “Nonwork Accessibility as a Social Equity Indicator.” International Journal of Sustainable Transportation 9(1):1–14.
Handy, Susan. 2005. “Planning for Accessibility: In Theory and In Practice.” Pp. 131–47 in Access to Destinations, edited by David Levinson and Kevin J. Krizek. Burlington, MA: Elsevier Ltd.
Handy, Susan. 2008. “Regional Transportation Planning in the US: An Examination of Changes in Technical Aspects of the Planning Process in Response to Changing Goals.” Transport Policy 15(2):113–26.
Handy, Susan L., and Debbie A. Niemeier. 1997. “Measuring Accessibility: An Exploration of Issues and Alternatives.” Environment and Planning A 29(7):1175–94.
Hansen, Walter G. 1959. “How Accessibility Shapes Land Use.” Journal of the American Institute of Planners 25(2):73–76.
Helling, A. 1998. “Changing Intra-Metropolitan Accessibility in the US: Evidence from Atlanta.” Progress in Planning 49:55–107. Retrieved (isi:000072810400001).
Helling, Amy, and David S. Sawicki. 2003. “Race and Residential Accessibility to Shopping and Services.” Housing Policy Debate 14(1–2):69–101.
Hess, Daniel Baldwin. 2005. “Access to Employment for Adults in Poverty in the Buffalo-Niagara Region.” Urban Studies 42(7):1177–1200.
Hine, Julian, and Fiona Mitchell. 2001. “Better for Everyone? Travel Experiences and Transport Exclusion.” Urban Studies 38(2):319–32.
Horner, Mark W., and Jessica N. Mefford. 2005. “Examining the Spatial and Social Variation in Employment Accessibility: A Case Study of Bus Transit in Austin, TX.” Pp. 193–214 in Access to Destinations, edited by David Levinson and Kevin J. Krizek. Burlington, MA: Elsevier Ltd.
Iceland, John, Daniel Weinberg, and Lauren Hughes. 2014. “The Residential Segregation of Detailed Hispanic and Asian Groups in the United States: 1980-2010.” Demographic Research 31(September):593–624.
Jiao, Junfeng, Anne V. Moudon, Jared Ulmer, Philip M. Hurvitz, and Adam Drewnowski. 2012. “How to Identify Food Deserts: Measuring Physical and Economic Access to Supermarkets in King County, Washington.” American Journal of Public Health 102(10):32–40.
Krizek, Kevin J. 2005. “Perspectives on Accessibility and Travel.” Pp. 109–30 in Access to Destinations, edited by David M. Levinson and Kevin J. Krizek. Burlington, MA: Elsevier Ltd.
Kwan, Mei-Po. 1998. “Space-Time and Integral Measures of Individual Accessibility: A Comparative Analysis Using a Point-Based Framework.” Geographical Analysis 30(3):191–216.
Larsen, Kristian, and Jason Gilliland. 2008. “Mapping the Evolution of ‘Food Deserts’ in a Canadian City: Supermarket Accessibility in London, Ontario, 1961-2005.” International Journal of Health Geographics 7(16).
Levine, Jonathan, Joe Grengs, Quingyun Shen, and Qing Shen. 2012. “Does Accessibility Require

45
Density or Speed?” Journal of the American Planning Association 78(2):157–72.
Levinson, David, Kevin J. Krizek, and David Gillen. 2005. “The Machine for Access.” Pp. 1–10 in Access to Destinations, edited by David Levinson and Kevin J. Krizek. Burlington, MA: Elsevier Ltd.
Lucas, Karen. 2004. “Locating Transport as a Social Policy Problem.” Pp. 7–14 in Running on empty: Transport, social exclusion, and environmental justice, edited by Karen Lucas. Bristol: The Policy Press.
Lucas, Karen. 2012. “Transport and Social Exclusion: Where Are We Now?” Transport Policy 20:105–13.
Ma, Ting, and Gerrit Jan-Knapp. 2014. “Analyzing Employment Accessibility in a Multimodal Network Using GTFS: A Demonstration of the Purple Line, Maryland.” Philadelphia, PA: Association of Collegiate Schools of Planning (ACSP) Annual Conference. Retrieved October 29, 2015 (http://smartgrowth.umd.edu/assets/documents/research/acsp_tingma_20141029.pdf).
Martin, Michael E. 2006. Residential Segregation Patterns of Latinos in the United States, 1990–2000. Routledge.
McKenzie, Brian S. 2013a. “Access to Supermarkets Among Poorer Neighborhoods: A Comparison of Time and Distance Measures.” Urban Geography 35(1):133–51.
McKenzie, Brian S. 2013b. “Neighborhood Access to Transit by Race, Ethnicity, and Poverty in Portland, OR.” City & Community 12(2):134–55.
Miller, Harvey J. 2005. “Place-Based Versus People-Based Accessibility.” Pp. 63–89 in Access to Destinations, edited by David Levinson and Kevin J. Krizek. Burlington, MA: Elsevier Ltd.
Mladenka, Kenneth R. 1980. “The Urban Bureaucracy and the Chicago Political Machine : Who Gets What and the Limits to Political Control.” The American Political Science Review 74(4):991–98.
Mladenka, Kenneth R., and Kim Quaile Hill. 1977. “The Distribution of Benefits in an Urban Environment: Parks and Libraries in Houston.” Urban Affairs Review 13(1):73–94.
O’Brien, Robert M. 2007. “A Caution Regarding Rules of Thumb for Variance Inflation Factors.” Quality & Quantity 41(5):673–90.
Páez, Antonio, Steven Farber, Ruben Mercado, Matthew Roorda, and Catherine Morency. 2013. “Jobs and the Single Parent: An Analysis of Accessibility to Employment in Toronto.” Urban Geography 34(April 2015):815–42.
Polzin, S. E., X. Chu, and J. R. Rey. 2000. “Density and Captivity in Public Transit Success: Observations from the 1995 Nationwide Personal Transportation Study.” Transportation Research Record: Journal of the Transportation Research Board 1735:10–18.
Pucher, J., T. M. Evans, and J. Wenger. 1998. “SOCIOECONOMICS OF URBAN TRAVEL: EVIDENCE FROM THE 1995 NPTS.” Transportation Quarterly 52(3).
Pucher, J., and J. L. Renne. 2003. “Socioeconomics of Urban Travel: Evidence from the 2001 NHTS.” Transportation Quarterly 57(3):49–77.
Puentes, Robert, and Adie Tomer. 2011. Transit Access and Zero Vehicle Households. Washington, D.C.
Schaeffer, K. H., and Elliott Sclar. 1980. Access for All: Transportation and Urban Growth. Columbia University Press.
Scott, Darren M., and Mark W. Horner. 2008. “The Role of Urban Form in Shaping Access to
46
Opportunities.” Journal of Transport and Land Use 2(Fall):89–119.
Shen, Q. 1998. “Location Characteristics of Inner-City Neighborhoods and Employment Accessibility of Low-Wage Workers.” Environment and planning B: Planning and Design 25(3):345–65.
Shen, Qing. 2001. “A Spatial Analysis of Job Openings and Access in a U.S. Metropolitan Area.” Journal of the American Planning Association 67(1):53–68.
Silver, Hilary, and S. M. Miller. 2003. “Social Exclusion: The European Approach to Social Disadvantage.” Indicators 2(2):1–17.
Squires, Gregory, and Charis Kubrin. 2005. “Privileged Places: Race, Uneven Development and the Geography of Opportunity in Urban America.” Urban Studies 42(1):47–68.
Stanley, Janet, and Karen Lucas. 2008. “Social Exclusion: What Can Public Transport Offer?” Research in Transportation Economics 22(1):36–40.
Stanley, Janet, John Stanley, Dianne Vella-Brodrick, and Graham Currie. 2010. “The Place of Transport in Facilitating Social Inclusion via the Mediating Influence of Social Capital.” Research in Transportation Economics 29(1):280–86.
Stanley, Janet, and Dianne Vella-Brodrick. 2009. “The Usefulness of Social Exclusion to Inform Social Policy in Transport.” Transport Policy 16(3):90–96.
Talen, Emily. 2001. “An Empirical Investigation of Access to Elementary Schools in West Virginia.” Annals of the Association of American Geographers 91(3):465–86.
Tallis, Federico. 2014. “Evaluating Transit and Driving Disaggregated Commutes through GTFS in ArcGIS.” University of Southern California. Retrieved October 29, 2015 (http://digitallibrary.usc.edu/cdm/ref/collection/p15799coll3/id/457621).
Wachs, Martin, and T.Gordo. Kumagai. 1973. “Physical Accessibility as a Social Indicator.” Socio-Economic Planning Sciences 7(5):437–56.
Walker, Jarrett. 2008. “Purpose-Driven Public Transport: Creating a Clear Conversation About Public Transport Goals.” Journal of Transport Geography 16(6):436–42.
Walker, Jarrett. 2011. Human Transit: How Clearer Thinking about Public Transit Can Enrich Our Communities and Our Lives. Washington, D.C.: Island Press.
Wells, Kirstin, and Jean-Claude Thill. 2012. “Do Transit-Dependent Neighborhoods Receive Inferior Bus Access? A Neighborhood Analysis in Four U.S. Cities.” Journal of Urban Affairs 34(1):43–63.
Whitelegg, John. 1997. Critical Mass: Transport, Environment and Society in the Twenty-First Century. London: Pluto Press.
47
PAPER 2
“What’s Driving Transit Service? Investigating the Organizational Elements of Transit Agencies that Impact Destination Accessibility Outcomes”
Introduction
Recent innovations in spatial analysis have led to more robust and reliable measures used to
evaluate destination accessibility. However, the improved reliability of data has been accompanied by
research outcomes that are increasingly inconsistent and inconclusive. This is especially true with respect
to studies investigating the social equity of accessibility outcomes via public transit service. In some cities,
low-income and communities of color are found to benefit from destination-rich transit access (Foth,
Manaugh, and El-Geneidy 2013; Grengs 2004; McKenzie 2013a) while in others, these groups experience
objectively poor transit service quality (Grengs 2001; Horner and Mefford 2005; Larsen and Gilliland
2008; McKenzie 2013b). This lack of empirical consistency leaves advocates, researchers and the general
public without a reliable sense as to the overall quality of public transportation service in the U.S.; an
understanding of how well public transit systems are delivering on their mission; or the degree to which
systematic inequality within public transit outcomes is a problem.
On top of the lack of consensus that can be drawn from this research, the ‘unpatterned inequality’
or lack of discernable trends with respect to outcomes (Lineberry 1977) that characterize differences in
accessibility outcomes has been left unexplored, as are the sources that shape these trends. This is a
significant oversight on two related counts: first, public transit is an essential service in cities, especially
within low-income and communities of color. Members of these vulnerable populations tend to rely on
transit more than other types of users for their primary transportation needs (Giuliano 2003; Giuliano, Hu,
and Lee 2001). In one of the most comprehensive national surveys of travel behavior, Pucher and Renne
(2003) found that low-income households and households of color account for roughly 63% of all transit
riders in the U.S. But even beyond the integral role that transit plays in the daily lives of socially
marginalized communities, public transit is a public service whose very purpose is to provide access to
destinations, services, and other people (Handy 2002; Litman 2015; Miller and Wu 2000; van Wee and

48
Geurs 2011). Identifying sources of variations in service quality is important for transit planners,
administrators, and equity stakeholders who have an interest in ensuring that transit service is being
delivered as efficiently and equitably as possible. It is especially important to know how transit agencies
themselves establish and reinforce differences in service outcomes. Previous research has found that
particular elements that constitute public service agencies have a significant impact on service delivery
outcomes. The research presented here addresses lingering questions about destination accessibility and
public transit service delivery by looking within transit agencies to evaluate the effects that specific
policies, procedures, and agency-level characteristics have on transit service outcomes.
To be clear, there is no one “right way” to supply a city with public transportation service.
Different cities have different transportation needs, cultures, and land use orientations that justify
variations in the way that transit service is organized and operated. It is expected, then, that each agency’s
unique operating structure will have different impacts on the distribution and delivery of transit service.
But as Coulter points out, the particular contexts of metropolitan areas does not diminish the fact that
agencies “still must satisfy certain basic objectives” (Coulter, MacGillivray, and Vickery 1976: 232).
Public transit’s very existence is premised upon providing people a way of accessing destinations, yet
those agency-level factors that either promote or hinder accessibility have been left unexplored. In this
paper, I ask first, which organizational elements of public transit agencies matter the most for
accessibility outcomes? And second, is there a difference in the impact of these elements on accessibility
outcomes across social groups? Drawing on evidence from research investigating the efficiency of urban
public services both transportation-related and otherwise, this study looks specifically at four
organizational elements that have been found to impact the effectiveness of public transit service delivery
across twelve large transit agencies in the United States. It examines the organizational structure within
agencies; the degree to which agencies incorporate public participation; transit agency service delivery
standards; and transit agency funding priorities.
This study contributes to existing research by expanding the application of accessibility indicators
beyond the quantification of accessibility outcomes. As accessibility is the primary goal of transit systems,
49
these measures can also be thought of as indicators of the effectiveness of the public transit network
especially in terms of reliability and equity. Specifically, this analysis uses transit-based accessibility
scores calculated at the block-group level as dependent variables in a hierarchical linear regression model
that includes both agency-level and block-group level data as independent variables. This analysis also
includes a sub-regression that isolates the effects of these elements on ‘transit-vulnerable’ populations to
gauge the differential impact of agency-level elements on those who are most reliant on public transit
service. Findings suggest that some organizational elements of transit agencies are significant in terms of
destination accessibility outcomes, and that there is a difference in the degree to which these elements
impact outcomes between the general public and transport-disadvantaged populations.
Literature Review Prior research has established that the elements that define public service agencies, including their
size, governance structure, and funding structures, are significant variables in terms of how effectively
services are delivered. The present analysis draws on this work to establish a framework for exploring
how some of these elements shape the delivery of public transit services. Among the most relevant for the
study of public transportation outcomes include a transit agency’s organizational structure, the
incorporation of public participation, adherence to public service decision rules, and agency-level funding
priorities. While a wealth of research has been conducted into various determinants of high-quality public
service delivery, this work has not generated much knowledge that speaks to how these elements interact
and work together, how these elements impact public transit services specifically, or how these elements
impact destination accessibility outcomes. While some hypotheses can be drawn, much of this research is
inconclusive, fails to directly address public transportation, neglects consideration of people’s lived
experiences as reliable indicators of delivery outcomes, and with the exception of decision rules research,
does not discuss the social equity impacts of differences in organizational design.
Organizational Structure: Size & Degree of Bureaucratic Complexity
50
The size of an organization and its degree of bureaucratic complexity are two distinguishing
elements of what is known as an organization’s structure. In the social science literature, ‘organizational
structure’ refers to how the responsibilities of the agency or organization are distributed and assigned
(Egeberg 2003). Size - traditionally measured in terms of number of employees or financial largesse (Hall
and Tolbert 2005) - and structural complexity are related concepts, but are operationally distinct.
Structural complexity means the degree to which tasks are ‘fragmented’ within an organization, and
encompasses both the division of labor and the decentralization of activities. Structural complexity can be
thought of as analogous to bureaucratization: the more complex an organization, the greater tendency
toward task differentiation (Beyer and Trice 1979; Hinings, Greenwood, and Ranson 1975; Rainey 2009).
While “size is the single most powerful predictor of bureaucratization” (Hinings et al. 1975:170), it is not
a measure of the degree of bureaucratic complexity in and of itself (Hall, Johnson, and Haas 1967; Rainey
2009). Instead, many studies that incorporate measures of bureaucratization rely on other metrics, such as
qualitative data collected from employees (Hage and Aiken 1967) or data that counts the number of
divisions or departments within an organization (Andrews, Beynon, and McDermott 2015; Andrews and
Boyne 2014; Hall et al. 1967). In studies of public police departments, measures of bureaucracy have also
relied on data that reflects the social distance between high-ranking and low-ranking officers (Eitle,
D’Alessio, and Stolzenberg 2014; Langworthy 1986; Maguire 1997).
Those who study public administration and/or organizational theory tend to be divided into two
camps with respect to the impact of size and structural complexity on the effectiveness of service delivery.
With respect to size, one side believes that larger organizations are prone to suffer from problems of
communication and coordination (Damanpour 1992; Rushing 1974). Others argue that larger
organizations may possess more technical knowledge and capacity than smaller firms, which positively
affects their ability to innovate (Blau 1972; Damanpour 1992). Some believe that larger and more
complex organizations may suffer from communication and coordination problems (Murnane and Nelson
1984), while others maintain that big, complex organizations are better able to allocate resources and
deliver specialized services more effectively (Andrews 2010; Boyne 1998). Empirical findings of studies
51
that test the impact of size and/or structural complexity on effectiveness fan the flames of the size and
complexity debate by offering findings that are mixed at best. In fact, many analyses show a nonlinear or
insignificant relationship between effectiveness and size or complexity (Andrews et al. 2015; Boyne
2003; Jung 2013). These findings further complicate the relationship and obfuscate solid conclusions. To
paraphrase Andrews, Benyon, and McDermott (Andrews et al. 2015:242), both size and structural
complexity may either positively or negatively impact public sector organizational capacity.
Public Participation
Academics and social theorists from many fields have long emphasized the benefits of including
citizen participation in public sector decision-making processes (Irvin and Stansbury 2004; Neshkova and
Guo 2012). This is especially true with respect to those organizations that oversee the delivery of public
services. Soliciting citizen input is believed to have many advantages for service delivery outcomes,
including providing decision-makers with specialized knowledge that leads to more refined and localized
delivery procedures (Innes and Booher 2004; Irvin and Stansbury 2004; Rowe and Frewer 2000; Stewart
and Sinclair 2007) and the ability to more immediately address stakeholder issues to avoid the prospect of
future litigation (Innes and Booher 2004; Irvin and Stansbury 2004; Randolph and Bauer 1999; Stewart
and Sinclair 2007). Significantly for social justice advocates, public participation allows an opportunity
for marginalized groups who often lack representation in local affairs to participate and potentially affect
social change (Brabham 2012; Fung 2015).
Despite these assertions, research that systematically investigates the relationship between the
effective or equitable delivery of transportation services and public participation is limited (Neshkova and
Guo 2012; Rowe and Frewer 2000; Yang and Pandey 2011). In one of the only peer-reviewed papers that
looks into the impact of citizen participation on transportation service delivery outcomes, Neshkova and
Guo (2012) investigate the influence of citizen input on the activities of state transportation agencies.
Using a weighted index of mechanisms for public participation, they find overwhelming evidence that
52
citizen input has a positive impact on efficiency and effectiveness as reflected by cost efficiency measures,
road condition evaluations, and fatality rates. Unfortunately, subsequent research into public participation
within public organizations has largely failed to follow up on these findings. Instead, much contemporary
analysis focuses on the internal agency mechanisms that either promote or hinder the incorporation of
public input in agency-level decisions (Risner and Bergan 2012; Thomas 2013; Yang and Pandey 2011).
Despite the lack of research into outcomes, it is not uncommon for public transit agencies to
incorporate public participation into the decision-making process (Neshkova and Guo 2012). One specific
vehicle of public participation that many transit agencies have engaged with is citizen advisory boards,
often known by other names such as rider oversight committees (Blaylock et al. 2010). Although there is
great variation in how they are composed and function, citizen advisory boards are often found to be
strong vehicles for effective participation (Applegate 1998; Innes and Booher 2004; Lynn and Busenberg
1995). Lynn and Busenberg note that a citizen advisory board “(1) educates the sponsor in regard to
community attitudes, (2) educates the participants (and the public) in regard to the proposed institutional
actions, (3) provides a forum for citizen involvement in decision-making, (4) provides public support for
the decisions, and (5) allows government and industry to deal with one relatively small body of citizens
rather than the entire community” (Lynn and Busenberg 1995: 147-148).
Research that investigates the impact and utility of citizen advisory boards often fails to evaluate
their relationship with service outcomes, instead taking the form of single case studies that focus on one
particular project, and in most cases rely on qualitative perceptions of effectiveness (Landre and Knuth
1993; Neshkova and Guo 2012; Vigoda 2002). The most comprehensive research to date that looks into
the impact of public participation on transportation outcomes is the evaluation by Neshkova and Guo
(2012) that finds a positive relationship. However, like aforementioned research investigating the
efficiency impacts of public agency organizational structure, the authors do not include destination
accessibility or any other quality-of-life outcome as an indicator of effectiveness.
Service Delivery Standards
53
Like other public service agencies, mass transit must be consistent and predictable in order to
meet the needs of users. In the body of research that looks into the distribution of public goods and
resources, the policies and procedures that streamline and direct urban services to be consistent and
predictable are called ‘decision-rules’ (Jones et al. 1978; Levy, Meltsner, and Wildavsky 1974). Examples
of decision-rules include the days the week trash is picked up from private households, the minimum
response time the police adhere to when responding to a public complaint, or the paperwork that parents
or guardians must fill out for public school enrollment. Decision-rules are established to allow public
agencies to fulfill their respective missions with an eye towards efficiency and fairness. Without decision-
rules, services could be arbitrarily administered according to vague expectations and conflicting priorities
that could metaphorically or literally leave people stranded at the station.
Like more recent work on destination accessibility, research that has investigated public service
delivery outcomes has found evidence of “unpatterned inequality” with respect the experiences of
different social groups (Cingranelli 1981; Maroko et al. 2009; Miyake et al. 2010; Mladenka 1980;
Mladenka and Hill 1977; Talen 2001). For example, in testing the relationship between socioeconomic
status (SES) and access to schools in several counties in West Virginia, Talen (2001) found significant
differences between students living in low-SES households versus students living in high-SES households.
However, the exact nature of this relationship differed by county. In Jackson and Kanawha Counties, low-
SES students have less proximate access to schools, while low-SES students in Berkeley County live
closer to their school than other students. This lack of a discernable trend has been found with respect to
trash collection, access to library facilities, the quality of local parks, and many other public services and
resources (Cingranelli 1981; Koehler and Wrightson 1987; Levy et al. 1974; Maroko et al. 2009; Miyake
et al. 2010; Mladenka 1980; Mladenka and Hill 1977; Rich 1979; Talen 2001).
Researchers have concluded that while decision-rules are not intentionally biased or
discriminatory, adherence to standardized decision-rules can result in inequitable public service outcomes.
This is especially true when standardized rules and processes fail to acknowledge the contextual
differences between social groups that mediate the impacts of service delivery processes. For example,
54
Levy et al (1974) found that, contrary to expectations, low-income households experienced better
residential road conditions than other households in the same city. The authors realized that a) the local
public works department paves streets according to volume, resulting in arterial streets being paved more
regularly than secondary roads, and b) low-income households tend to live in multifamily apartment
buildings that are disproportionately placed along these arterial streets. The interaction of policy and
social context thus led to low-income households experiencing a benefit in this instance. However,
socially vulnerable groups are not generally on the benefits-end of these policy-context interactions. As a
result, the disproportionate delivery of services due to institutionalized processes and procedures is a
concern for social justice advocates and public policy stakeholders alike.
Within public transit agencies, standard decision rules are formalized as ‘service delivery
standards’. These standards set uniform thresholds and protocols for administering transit services.
Examples of service standards include frequency of service, service coverage, span of service, passenger
load, and net cost per passenger. Services are often evaluated in terms of adherence to these standards,
and are modified based on performance in each category. While service evaluations are conducted
internally within transit agencies, results are not made public and the impacts of changes in service
delivery standards are often unclear. Perhaps because of these data challenges, there has not been a
systematic, academic analysis into the impacts of service delivery standards on transit service outcomes –
cost-benefit related or otherwise. Put simply, there is a dearth of research that helps us understand the
impact of certain service planning and delivery decisions on public transportation outcomes of any sort.
Funding Priorities
Critical transportation scholars have long argued that the fiscal priorities and policies associated
with public transportation contribute to significant variations in service delivery, particularly between
social groups. The expenses of public transit agencies fall into two categories: operating costs and capital
costs. Operating costs are those that are associated with the day-to-day delivery of services, including
labor costs, fuel costs, and vehicle maintenance costs. Because of the labor-heavy operational and
55
maintenance needs of buses, operating costs generally refer to bus services. On the other hand, capital
expenses refer to the costs of infrastructure (Federal Transit Administration 2015). Because traditional
buses run on existing public streets but rail service requires the acquisition of land and the construction of
tracks and stations, the vast majority of capital funds are spent on rail transit. Further, because most
capital funds are dedicated to hardware and construction, these costs are primarily associated with rail
introduction or rail expansion.
In an era when the vast majority of U.S. transit agencies suffer from perpetual and growing
budget deficits, federal transit subsidies are specifically earmarked to cover capital costs and not
operating expenses (Fielding 1983; Pucher 2004). This creates certain incentives for public transit
administrators, who are already politically motivated to advance capital-intensive rail projects rather than
enhance existing bus services (Richmond 2001). Taylor explains:
“since nearly three-quarters of all transit operating revenues nationwide are locally generated (from the fare box and from local and regional subsidies) while over half the capital funding for transit capital comes from an outside source (the federal government), transit operators tend to view capital costs as ‘cheaper’ than operating costs” (Taylor 2004: 323).
Thus, funding priorities that are largely set at the federal level eventually manifest into the transit agency
spending priorities set in local budgets. Transit agencies are incentivized to establish funding patterns that
that maximize rail-intensive capital spending while keeping bus-intensive operating costs to a minimum
(Richmond 2001; Taylor and Morris 2015). These funding patterns can directly impact service delivery
and distribution patterns. In his evaluation of recent transit investments, Richmond observes that “the
start-up of new rail service has generally been accompanied by a restructuring of bus services to feed rail
stations and a discontinuation of direct bus services from suburbs to downtown…many journeys that now
require feeder buses as well as trains take longer than they did on the discontinued bus lines” (Richmond
2001: 158-159).
The impact of transit funding priorities on service delivery outcomes is of particular concern for
social justice advocates. Different social groups tend to ride different modes of transit: low-income riders
and riders of color are more likely to ride buses, while white and more affluent riders are more likely to
56
live in areas served by rail (Garrett and Taylor 1999; Pucher 1981; Pucher and Renne 2003; Taylor and
Morris 2015). When funding structures prioritize capital costs over operating costs, they are implicitly
prioritizing costs associated with white, affluent subway riders over those of poor, nonwhite bus riders.
Poor service delivery outcomes that had been seen as the result of these capital-intensive transit funding
structures have been the basis for civil rights lawsuits in at least ten cities in the past several decades,
including Hartford, St. Louis, Chicago, Boston, Dallas, Atlanta, Detroit, New York City, Philadelphia,
and Los Angeles (Grengs 2002; Pucher 1982; Taylor 2004; Taylor and Morris 2015; Wachs 2004).
Hypotheses and Research Question
These bodies of research into urban public services establish that the organizational elements that
define public agencies have discernable impacts on the efficiency and effectiveness with which public
services are distributed and delivered, both overall and across social groups. While some hypotheses can
be drawn, the gaps within these research bodies also leave us with several questions that are addressed
through the present analysis.
There is a wealth of research suggesting that the size and bureaucratic complexity of a public
agency’s organizational framework have discernable impacts on the delivery and quality of public
services. This research is not only inconclusive with respect to the analysis of each element on its own,
but these elements have not been assessed in tandem to gauge how they combine to shape various
outcomes. Although each element may drive specific outcomes independently of other organizational
processes and elements, practical outcomes are the result of the interaction of these elements that work
alongside each other and simultaneously. The lack of clear evidence as to what the effects of various
structural formulations are on public service delivery outcomes limits our ability to formulate hypotheses
or anticipate what the outcomes on destination accessibility may be. I therefore present no hypothesis
with respect to the impact of organizational structure on accessibility outcomes; rather, this analysis is a
test of each element on its own as well as the combined effect of these elements on accessibility outcomes.
57
Based on the investigation of Neshkova and Guo (2014) into state transportation agencies, I
expect that the incorporation of citizen advisory boards in public transportation planning and decision-
making processes will have a positive impact on accessibility outcomes. To test this hypothesis, this paper
takes a systematic and quantitative approach to the question of public participation. It includes two binary
measures of public participation within agencies, one of which reflects whether or not agencies have
established citizen advisory boards. The other measure of participation is another binary indicator
reflecting whether or not a public referendum on transit-related matters has been held. Research
investigating public referendum and service delivery outcomes is even more limited than research
focusing on public participation through citizen advisory boards and other channels; this analysis is an
opportunity to begin filling these analytical gaps.
While the impact of standard decision-rules on public service delivery outcomes has received
much attention with respect to a variety of urban resources (Boyle and Jacobs 1982; Cihan, Zhang, and
Hoover 2012; Jones et al. 1978; Moore et al. 2008; Small and Stark 2005; Talen 2013; Thacher 2010),
investigation into the decision-rules within public transit agencies is not well researched. In one of the
few analyses in this area, Wells and Thill (2012) studied bus service in four U.S. cities and concluded that
adherence to standard decision-rules which relied on knowledge of where low-income and transit-
dependent communities are in the planning process resulted in more bus service being provided within
these communities. However, their use of the concentration of zero-vehicle households as a proxy for
adherence to standard decision rules is tenuous at best. This analysis uses actual thresholds and metrics
that define the service delivery standards used by transit agencies to evaluate if and how these elements
have discernable accessibility impacts. Because of the lack of existing literature evaluating these codified
standards, hypotheses are cannot be established. It is, however, expected that differences in these
standards will lead to variations in destination accessibility outcomes.
Finally, although a concern for social justice advocates, social scientists have yet to
systematically evaluate the impact of transit funding patterns on service delivery outcomes. Existing
scholarship suggests that agencies that prioritize operating expenditures to capital expenditures are in a
58
better position to address the needs of those most dependent on transit service, i.e. low-income bus riders.
To test this hypothesis, I include two measures of transit agency funding expenditures, one single-year
measure and one longitudinal measure, as the final elements in the package of organizational elements
that are proposed to impact transit service.
There are several oversights in these literature bodies addressing urban public services that are
addressed by the present analysis. In general, there is limited attention paid to public transportation. At
best, a handful of studies have been conducted that focus on transportation, and even fewer investigate
public transportation. A simultaneous empirical shortcoming of existing research is the oversight of lived
experiences as reliable indicators of service quality. For example, the relationship between the
organizational effectiveness and the organizational structure within public transit agencies has been the
focus of previous research, but the vast majority of these studies measure the effectiveness of transit
agencies in terms of monetary outcomes such as costs, benefits, and resource allocation (Cubukcu 2008;
Iseki 2008; Leland and Smirnova 2009; Perry and Babitsky 1986; Sclar 2000). As noted, the very utility
of transit service is derived from its ability to provide access to destinations, services, and other people.
While cost-benefit analyses that emphasize financial outcomes are valuable from a business perspective,
this metric has little relevance for daily transit riders who depend on reliable, convenient modes of
transportation. With the exception of work related to decision rules, these studies also largely fail to
address the social or equity impacts of these organizational elements.
To both test the hypotheses that are offered and fill the gaps left remaining by existing research,
the present study is an evaluation of the outcomes associated with various organizational elements of
public transportation agencies. Results of this analysis establish which organizational elements of public
transit agencies matter the most for accessibility outcomes, and whether or not is there a difference in the
impact of these elements on accessibility outcomes across social groups.
Data & Methods
Geography, Unit of Analysis, and Dependent Variable
59
Data reflecting transit-based accessibility outcomes was generated at the block group level for 12
cities across the United States. These cities are: Baltimore, Boston, Chicago, Denver, Los Angeles, Miami,
Philadelphia, Pittsburgh, San Diego, San Francisco, Seattle, and Washington DC. These cities were
initially selected from a list of the 50 largest U.S. metropolitan areas and narrowed down based on 1) the
presence of an existing public transit network, and 2) the availability of local geocoded location data for
use in the calculation of an accessibility score.
Although the overall goal of a public transit network is to enable access to destinations, it is
particularly crucial that the system provide access to destinations of opportunity, meaning places that
encourage social mobility and the maintenance of a high quality of life. Three different accessibility
scores are used in this analysis that specifically emphasize access to civic, educational, recreational, and
employment opportunities: the first score reflects access to nonwork destinations including schools,
libraries, parks, and recreation centers; the second to work destinations; and the third to both nonwork and
work destinations. The nonwork accessibility score is modeled after traditional cumulative opportunity
scores that count the number of locations accessible from various origin points given certain travel
parameters, such as within a certain travel time or distance (Helling and Sawicki 2003; Horner and
Mefford 2005; Jiao et al. 2012; Scott and Horner 2008). Scores are generated with the use of ArcGIS
network analyst and a publicly available add-on called ‘Add GTFS to a Network Dataset’ that generates
polygons representing transit-accessible spaces with the use of real-time transit schedule data. Within
each city, the number of destinations of opportunity accessible via transit within 35 minutes of travel time
is counted, and a ratio is calculated that reflects the overall share of non-work destinations accessible
from each block group. Scores are standardized within each city with an index so that the block group
with the highest relative share of transit-accessible non-work destinations receives a score of ‘1’.
Data reflecting access to jobs via transit is retrieved from the EPA’s Smart Location Database, a
publicly available spatial dataset that includes a host of block-group level information, including the
number of working-age residents and the share of jobs accessible within a 45-minute transit commute. A
data point reflecting the share of jobs accessible per working age population was calculated for each block
60
group in the 12 cities, and again standardized with an index for purposes of comparison. The
standardized non-work and work accessibility scores are summed into an overall transit-based destination
accessibility score, with a maximum possible accessibility score of ‘2’. For a more in-depth discussion of
the metrification of the accessibility score used in this analysis, see Williams (2016).
Independent Variables
The independent variables used in this analysis measure the organizational elements that have
been found to impact the effectiveness and equity of the distribution of public services generally and
public transit specifically as described above. Consistent with previous research, with respect to
organizational structure the size of transit agencies is represented as the total number of employees per
service area square mile (SA) during 2014. Degrees of bureaucratic complexity are more difficult to
measure, but data is available that reflects variations in employee workload by function, including the
number of employees and hours worked by administrative, maintenance, and operating labor power. The
more employees tasked with administrative and decision-making functions relative to the number of
overall employees suggest a greater degree of bureaucratization within an agency. Bureaucratic
complexity is therefore included as the share of administrative employees working for the agency out of
all agency functions including operating labor, capital labor, and vehicle-specific operations and
maintenance labor during 2014. Each of these variables is collected through the National Transit Database
(NTD). The NTD is a data warehouse maintained by the Federal Transit Administration (FTA). Large
transit agencies that receive federal funding are required to submit annual reports to the NTD, which are
eventually made public (Federal Transit Administration 2016).
Two different binary measures are used to estimate the degree of public participation in agency-
level affairs: 1) the presence of a citizen advisory board, and 2) whether or not a public referendum on
transit-related legislation has been held since the year 2000. Data on citizen/rider oversight boards is
mined from Internet searches, and this information is generally available on agency websites. Data on
public referendum is gathered from The Center for Transportation Excellence, which maintains up-to-date
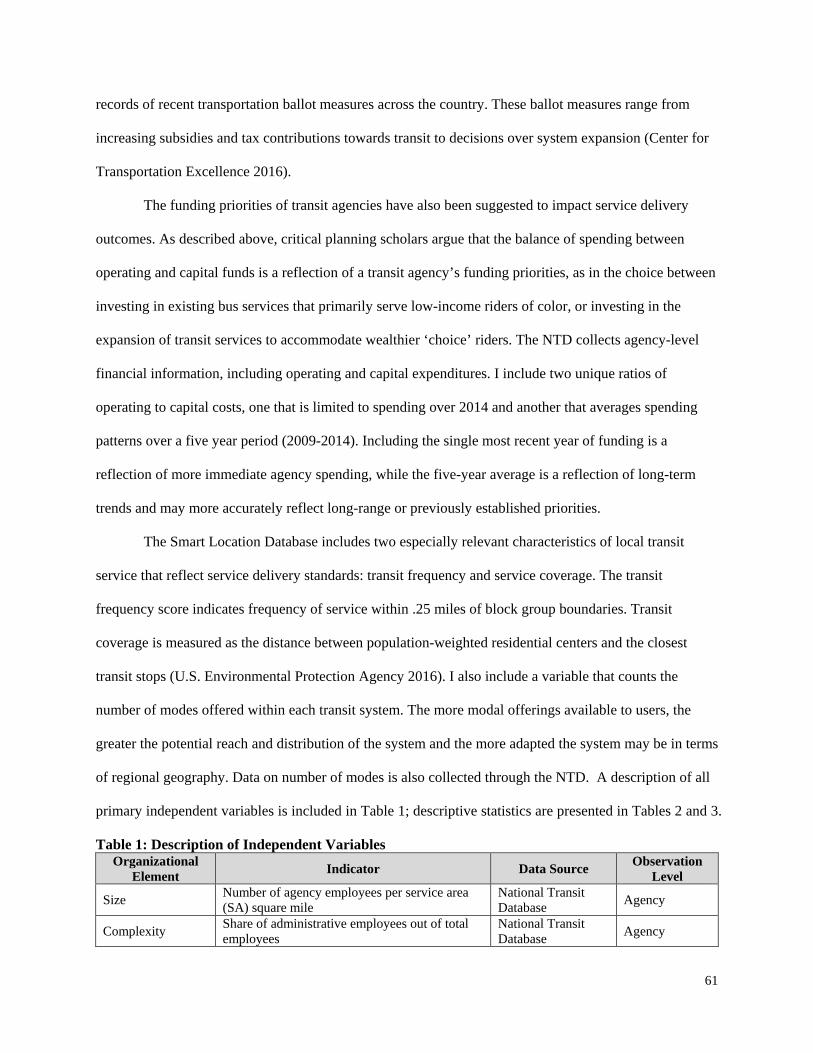
61
records of recent transportation ballot measures across the country. These ballot measures range from
increasing subsidies and tax contributions towards transit to decisions over system expansion (Center for
Transportation Excellence 2016).
The funding priorities of transit agencies have also been suggested to impact service delivery
outcomes. As described above, critical planning scholars argue that the balance of spending between
operating and capital funds is a reflection of a transit agency’s funding priorities, as in the choice between
investing in existing bus services that primarily serve low-income riders of color, or investing in the
expansion of transit services to accommodate wealthier ‘choice’ riders. The NTD collects agency-level
financial information, including operating and capital expenditures. I include two unique ratios of
operating to capital costs, one that is limited to spending over 2014 and another that averages spending
patterns over a five year period (2009-2014). Including the single most recent year of funding is a
reflection of more immediate agency spending, while the five-year average is a reflection of long-term
trends and may more accurately reflect long-range or previously established priorities.
The Smart Location Database includes two especially relevant characteristics of local transit
service that reflect service delivery standards: transit frequency and service coverage. The transit
frequency score indicates frequency of service within .25 miles of block group boundaries. Transit
coverage is measured as the distance between population-weighted residential centers and the closest
transit stops (U.S. Environmental Protection Agency 2016). I also include a variable that counts the
number of modes offered within each transit system. The more modal offerings available to users, the
greater the potential reach and distribution of the system and the more adapted the system may be in terms
of regional geography. Data on number of modes is also collected through the NTD. A description of all
primary independent variables is included in Table 1; descriptive statistics are presented in Tables 2 and 3.
Table 1: Description of Independent Variables Organizational
Element Indicator Data Source Observation Level
Size Number of agency employees per service area (SA) square mile
National Transit Database Agency
Complexity Share of administrative employees out of total employees
National Transit Database Agency
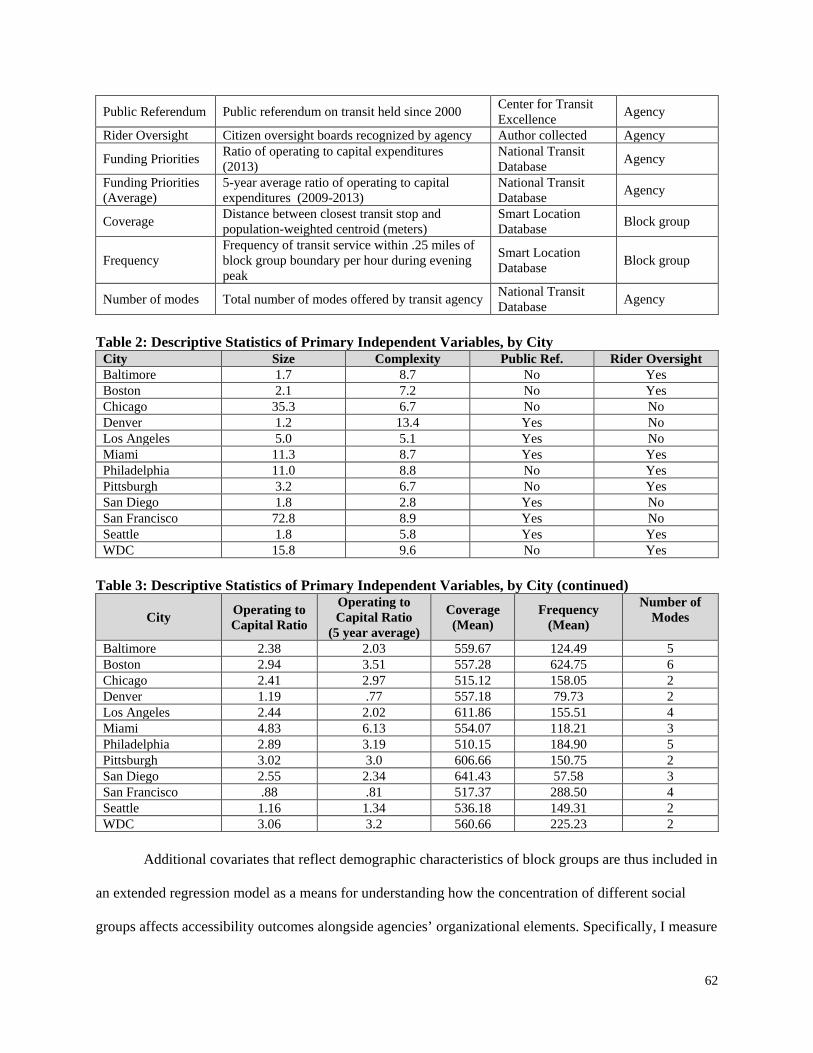
62
Public Referendum Public referendum on transit held since 2000 Center for Transit Excellence Agency
Rider Oversight Citizen oversight boards recognized by agency Author collected Agency
Funding Priorities Ratio of operating to capital expenditures (2013)
National Transit Database Agency
Funding Priorities (Average)
5-year average ratio of operating to capital expenditures (2009-2013)
National Transit Database Agency
Coverage Distance between closest transit stop and population-weighted centroid (meters)
Smart Location Database Block group
Frequency Frequency of transit service within .25 miles of block group boundary per hour during evening peak
Smart Location Database Block group
Number of modes Total number of modes offered by transit agency National Transit Database Agency
Table 2: Descriptive Statistics of Primary Independent Variables, by City
City Size Complexity Public Ref. Rider Oversight Baltimore 1.7 8.7 No Yes Boston 2.1 7.2 No Yes Chicago 35.3 6.7 No No Denver 1.2 13.4 Yes No Los Angeles 5.0 5.1 Yes No Miami 11.3 8.7 Yes Yes Philadelphia 11.0 8.8 No Yes Pittsburgh 3.2 6.7 No Yes San Diego 1.8 2.8 Yes No San Francisco 72.8 8.9 Yes No Seattle 1.8 5.8 Yes Yes WDC 15.8 9.6 No Yes
Table 3: Descriptive Statistics of Primary Independent Variables, by City (continued)
City Operating to Capital Ratio
Operating to Capital Ratio
(5 year average)
Coverage (Mean)
Frequency (Mean)
Number of Modes
Baltimore 2.38 2.03 559.67 124.49 5 Boston 2.94 3.51 557.28 624.75 6 Chicago 2.41 2.97 515.12 158.05 2 Denver 1.19 .77 557.18 79.73 2 Los Angeles 2.44 2.02 611.86 155.51 4 Miami 4.83 6.13 554.07 118.21 3 Philadelphia 2.89 3.19 510.15 184.90 5 Pittsburgh 3.02 3.0 606.66 150.75 2 San Diego 2.55 2.34 641.43 57.58 3 San Francisco .88 .81 517.37 288.50 4 Seattle 1.16 1.34 536.18 149.31 2 WDC 3.06 3.2 560.66 225.23 2
Additional covariates that reflect demographic characteristics of block groups are thus included in
an extended regression model as a means for understanding how the concentration of different social
groups affects accessibility outcomes alongside agencies’ organizational elements. Specifically, I measure
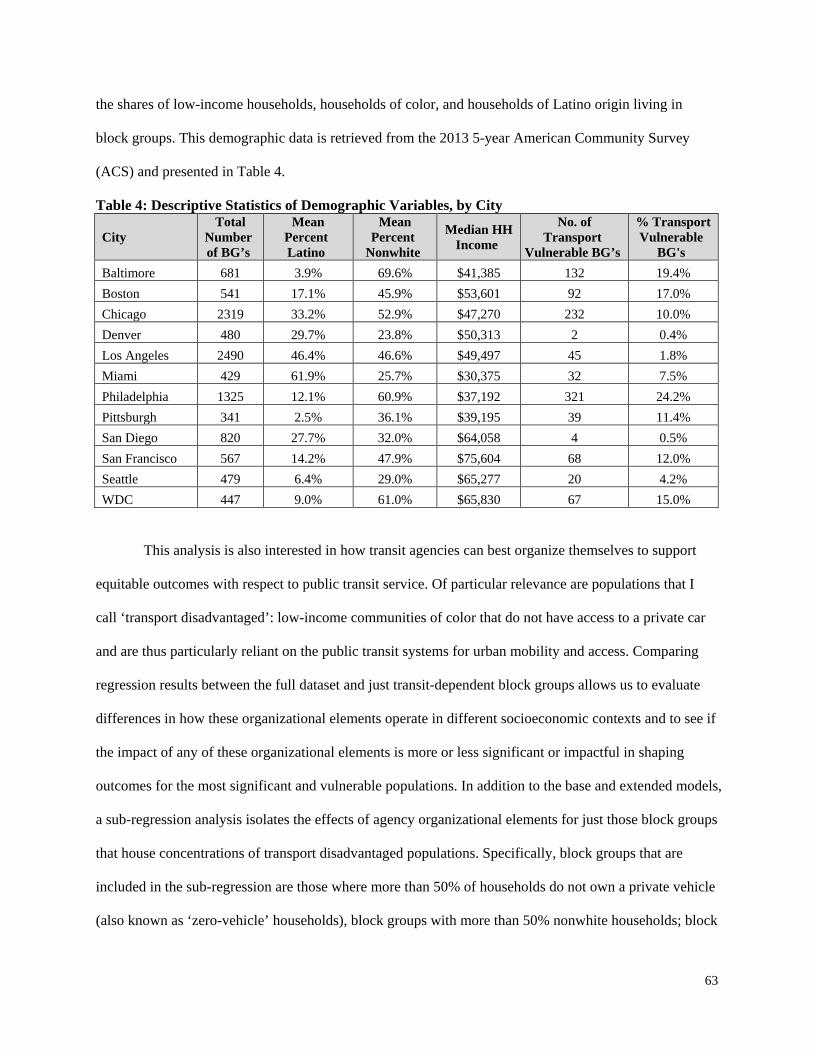
63
the shares of low-income households, households of color, and households of Latino origin living in
block groups. This demographic data is retrieved from the 2013 5-year American Community Survey
(ACS) and presented in Table 4.
Table 4: Descriptive Statistics of Demographic Variables, by City
City Total
Number of BG’s
Mean Percent Latino
Mean Percent
Nonwhite
Median HH Income
No. of Transport
Vulnerable BG’s
% Transport Vulnerable
BG's Baltimore 681 3.9% 69.6% $41,385 132 19.4% Boston 541 17.1% 45.9% $53,601 92 17.0% Chicago 2319 33.2% 52.9% $47,270 232 10.0% Denver 480 29.7% 23.8% $50,313 2 0.4% Los Angeles 2490 46.4% 46.6% $49,497 45 1.8% Miami 429 61.9% 25.7% $30,375 32 7.5% Philadelphia 1325 12.1% 60.9% $37,192 321 24.2% Pittsburgh 341 2.5% 36.1% $39,195 39 11.4% San Diego 820 27.7% 32.0% $64,058 4 0.5% San Francisco 567 14.2% 47.9% $75,604 68 12.0% Seattle 479 6.4% 29.0% $65,277 20 4.2% WDC 447 9.0% 61.0% $65,830 67 15.0%
This analysis is also interested in how transit agencies can best organize themselves to support
equitable outcomes with respect to public transit service. Of particular relevance are populations that I
call ‘transport disadvantaged’: low-income communities of color that do not have access to a private car
and are thus particularly reliant on the public transit systems for urban mobility and access. Comparing
regression results between the full dataset and just transit-dependent block groups allows us to evaluate
differences in how these organizational elements operate in different socioeconomic contexts and to see if
the impact of any of these organizational elements is more or less significant or impactful in shaping
outcomes for the most significant and vulnerable populations. In addition to the base and extended models,
a sub-regression analysis isolates the effects of agency organizational elements for just those block groups
that house concentrations of transport disadvantaged populations. Specifically, block groups that are
included in the sub-regression are those where more than 50% of households do not own a private vehicle
(also known as ‘zero-vehicle’ households), block groups with more than 50% nonwhite households; block
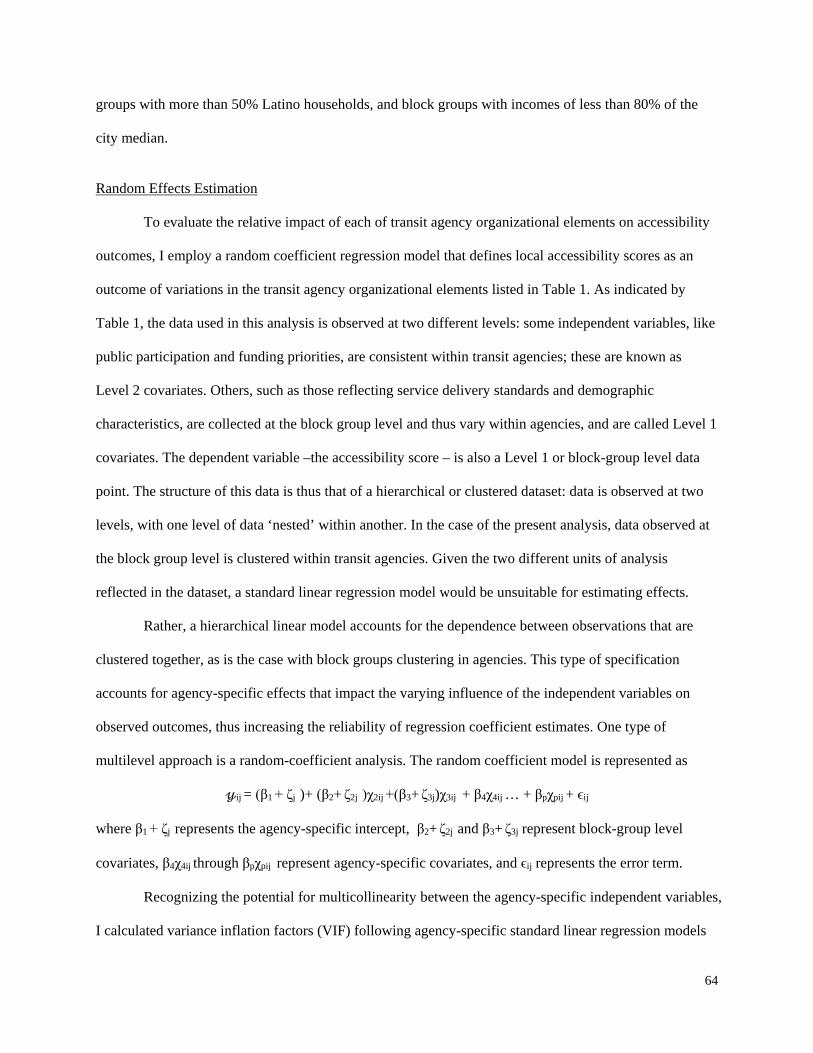
64
groups with more than 50% Latino households, and block groups with incomes of less than 80% of the
city median.
Random Effects Estimation
To evaluate the relative impact of each of transit agency organizational elements on accessibility
outcomes, I employ a random coefficient regression model that defines local accessibility scores as an
outcome of variations in the transit agency organizational elements listed in Table 1. As indicated by
Table 1, the data used in this analysis is observed at two different levels: some independent variables, like
public participation and funding priorities, are consistent within transit agencies; these are known as
Level 2 covariates. Others, such as those reflecting service delivery standards and demographic
characteristics, are collected at the block group level and thus vary within agencies, and are called Level 1
covariates. The dependent variable –the accessibility score – is also a Level 1 or block-group level data
point. The structure of this data is thus that of a hierarchical or clustered dataset: data is observed at two
levels, with one level of data ‘nested’ within another. In the case of the present analysis, data observed at
the block group level is clustered within transit agencies. Given the two different units of analysis
reflected in the dataset, a standard linear regression model would be unsuitable for estimating effects.
Rather, a hierarchical linear model accounts for the dependence between observations that are
clustered together, as is the case with block groups clustering in agencies. This type of specification
accounts for agency-specific effects that impact the varying influence of the independent variables on
observed outcomes, thus increasing the reliability of regression coefficient estimates. One type of
multilevel approach is a random-coefficient analysis. The random coefficient model is represented as
𝓎𝓎ij = (β1 + ζj )+ (β2+ ζ2j )χ2ij +(β3+ ζ3j)χ3ij + β4χ4ij … + βpχpij + ϵij
where β1 + ζj represents the agency-specific intercept, β2+ ζ2j and β3+ ζ3j represent block-group level
covariates, β4χ4ij through βpχpij represent agency-specific covariates, and ϵij represents the error term.
Recognizing the potential for multicollinearity between the agency-specific independent variables,
I calculated variance inflation factors (VIF) following agency-specific standard linear regression models
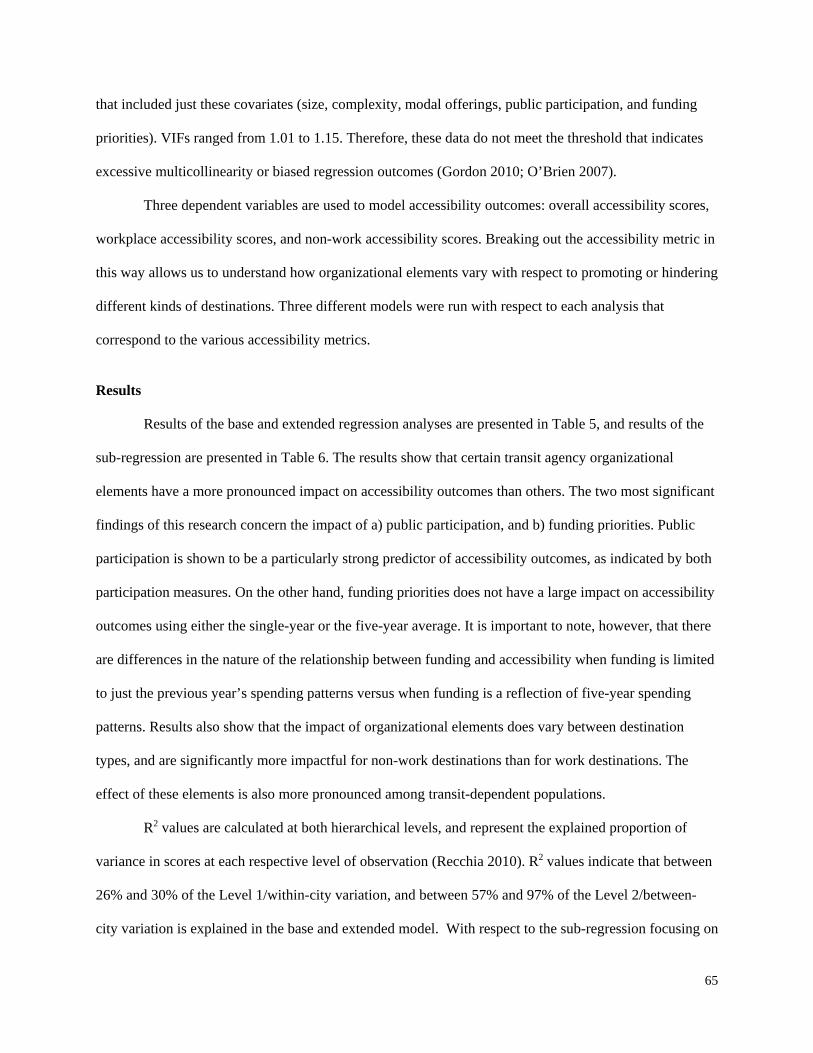
65
that included just these covariates (size, complexity, modal offerings, public participation, and funding
priorities). VIFs ranged from 1.01 to 1.15. Therefore, these data do not meet the threshold that indicates
excessive multicollinearity or biased regression outcomes (Gordon 2010; O’Brien 2007).
Three dependent variables are used to model accessibility outcomes: overall accessibility scores,
workplace accessibility scores, and non-work accessibility scores. Breaking out the accessibility metric in
this way allows us to understand how organizational elements vary with respect to promoting or hindering
different kinds of destinations. Three different models were run with respect to each analysis that
correspond to the various accessibility metrics.
Results Results of the base and extended regression analyses are presented in Table 5, and results of the
sub-regression are presented in Table 6. The results show that certain transit agency organizational
elements have a more pronounced impact on accessibility outcomes than others. The two most significant
findings of this research concern the impact of a) public participation, and b) funding priorities. Public
participation is shown to be a particularly strong predictor of accessibility outcomes, as indicated by both
participation measures. On the other hand, funding priorities does not have a large impact on accessibility
outcomes using either the single-year or the five-year average. It is important to note, however, that there
are differences in the nature of the relationship between funding and accessibility when funding is limited
to just the previous year’s spending patterns versus when funding is a reflection of five-year spending
patterns. Results also show that the impact of organizational elements does vary between destination
types, and are significantly more impactful for non-work destinations than for work destinations. The
effect of these elements is also more pronounced among transit-dependent populations.
R2 values are calculated at both hierarchical levels, and represent the explained proportion of
variance in scores at each respective level of observation (Recchia 2010). R2 values indicate that between
26% and 30% of the Level 1/within-city variation, and between 57% and 97% of the Level 2/between-
city variation is explained in the base and extended model. With respect to the sub-regression focusing on
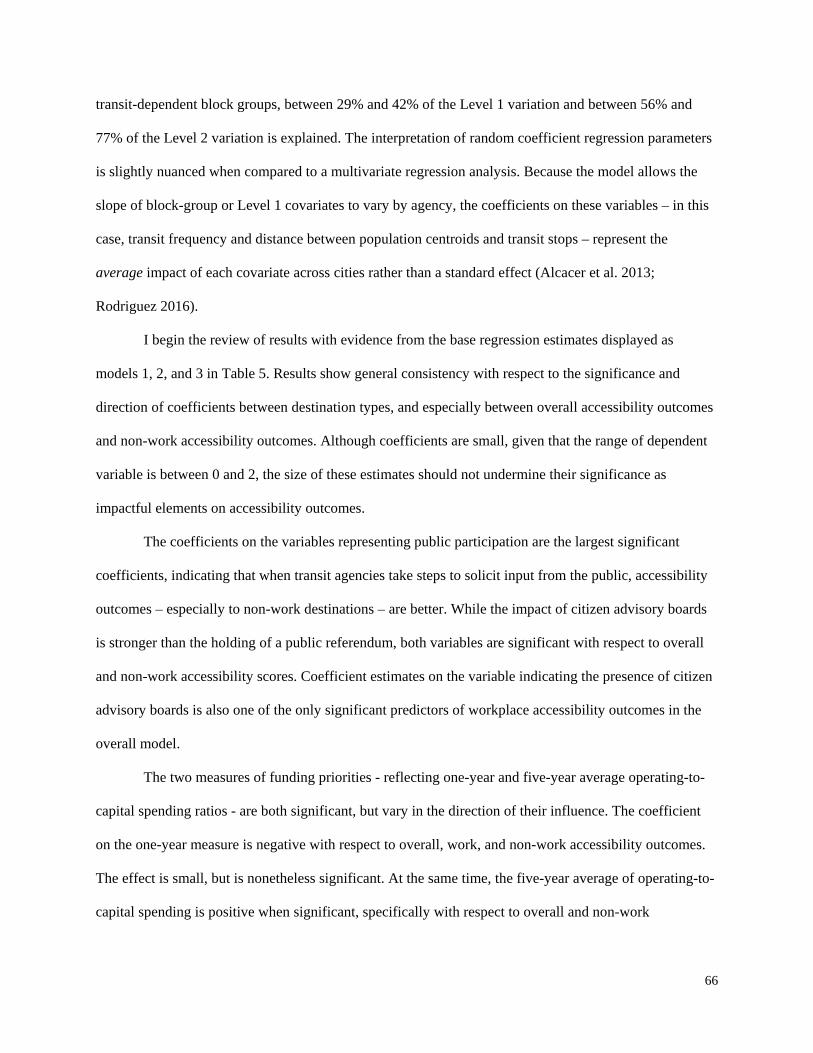
66
transit-dependent block groups, between 29% and 42% of the Level 1 variation and between 56% and
77% of the Level 2 variation is explained. The interpretation of random coefficient regression parameters
is slightly nuanced when compared to a multivariate regression analysis. Because the model allows the
slope of block-group or Level 1 covariates to vary by agency, the coefficients on these variables – in this
case, transit frequency and distance between population centroids and transit stops – represent the
average impact of each covariate across cities rather than a standard effect (Alcacer et al. 2013;
Rodriguez 2016).
I begin the review of results with evidence from the base regression estimates displayed as
models 1, 2, and 3 in Table 5. Results show general consistency with respect to the significance and
direction of coefficients between destination types, and especially between overall accessibility outcomes
and non-work accessibility outcomes. Although coefficients are small, given that the range of dependent
variable is between 0 and 2, the size of these estimates should not undermine their significance as
impactful elements on accessibility outcomes.
The coefficients on the variables representing public participation are the largest significant
coefficients, indicating that when transit agencies take steps to solicit input from the public, accessibility
outcomes – especially to non-work destinations – are better. While the impact of citizen advisory boards
is stronger than the holding of a public referendum, both variables are significant with respect to overall
and non-work accessibility scores. Coefficient estimates on the variable indicating the presence of citizen
advisory boards is also one of the only significant predictors of workplace accessibility outcomes in the
overall model.
The two measures of funding priorities - reflecting one-year and five-year average operating-to-
capital spending ratios - are both significant, but vary in the direction of their influence. The coefficient
on the one-year measure is negative with respect to overall, work, and non-work accessibility outcomes.
The effect is small, but is nonetheless significant. At the same time, the five-year average of operating-to-
capital spending is positive when significant, specifically with respect to overall and non-work

67
accessibility outcomes. Clearly, there are complexities associated with the manner and strategy associated
with transit funding patterns; these are addressed more substantively in the discussion.
The suite of covariates measuring service delivery characteristics are also significant predictors of
accessibility, but differ among each other with respect to the direction of the relationship and the
magnitude of the impact. The number of modes offered by transit agencies depresses accessibility
outcomes; this is the case with both overall and non-work destinations. The proximity between
households and transit stops is also both significant and negatively correlated with accessibility across all
destination types, but the impact is so small it is effectively zero. The coefficient on transit frequency is
positive and significant across all destination types, but is again very small and thus is effectively
inconsequential in shaping accessibility outcomes.
With respect to organizational structure, the coefficient on the variable transit agency size,
measured as labor force per service area square mile, is significant and positive. As with the service
delivery characteristics, the impact of size is very small and effectively zero. The degree of
bureaucratization in the transit agency, measured through the relative size of the administrative labor
force, was not found to be a significant predictor of accessibility outcomes.
As evidenced in Models 4, 5, and 6, the addition of block-group level demographic
characteristics as control variables has little impact on regression results. Coefficient estimates on each of
the independent variables do not change much, with the exception of the public participation-rider
oversight variable, which increases in strength. Some of the coefficients on the demographic control
variables are themselves significant: the share of Latino households in block groups has a positive
relationship to accessibility outcomes across destination type. In fact, the impact is more substantial than
that of some primary independent variables like service delivery and organizational structure. This finding
suggests that as the share of Latino households in block groups increases, accessibility outcomes improve.
While we cannot conclusively say that accessibility is higher within these communities because of
conscious decision-making on the part of transit planners, it may point to the value that Latino and other
transit-vulnerable households place on proximity to transit service. The coefficient on the income control

68
variable is also significant across destination types, but the impact is again so small, it is effectively
irrelevant.
Table 5: Effects of Organizational Elements on Accessibility Outcomes, All Block Groups Model 1 Model 2 Model 3 Model 4 Model 5 Model 6
Total Work Nonwork Total Work Nonwork Service Delivery Characteristics Centroid to Transit -0.000*** -0.000*** -0.000*** -0.000*** -0.000*** -0.000*** Transit Frequency 0.001*** 0.000*** 0.001*** 0.001*** 0.000*** 0.001*** Modes -0.072*** -0.022* -0.054*** -0.076*** -0.022* -0.057*** Public Participation Vote 0.154*** 0.034 0.119*** 0.161*** 0.034 0.125*** Public Oversight 0.445*** 0.173** 0.277*** 0.491*** 0.178** 0.318*** Funding Priorities Operating to Capital Funds -0.098*** -0.033* -0.067*** -0.109*** -0.034* -0.077*** Operating to Capital Funds (5 year average) 0.053*** -0.003 0.058*** 0.054*** -0.003 0.058*** Organizational Structure
Administrative Labor Share -0.009 -0.005 -0.005 -0.010* -0.005 -0.005 Labor Force per Service Area Sq. Mile 0.003*** 0.001 0.003*** 0.004*** 0.001 0.003*** Demographic Characteristics
Percent Nonwhite
0.005 0.005 0.000 Percent Latino
0.049*** 0.010** 0.039***
Median HH Income
-0.000*** -0.000* -0.000*** Constant 0.469*** 0.214*** 0.268*** 0.509*** 0.215*** 0.307*** Observations 10,383 10,383 10,383 10,383 10,383 10,383 R2 (Level 1) 0.4248 0.3303 0.4182 0.3089 0.2531 0.2938 R2 (Level 2) 0.7851 0.6443 0.8851 0.8258 0.5714 0.9672
Results of the sub-regression are presented in Table 6 and show much overlap with the base and
extended analysis. Coefficient estimates reveal that the organizational elements that impact service
outcomes for the general public are the same elements that impact service outcomes for the transport-
disadvantaged population, but that the degree of influence wielded by these elements is, in fact, different.
Notably, the impact of public participation is greater within transit-dependent communities than in the
general population. As in the base and extended models, these coefficients are not only the most
significant predictors in the model, but the variable reflecting citizen advisory boards is one of the only
significant predictors of workplace accessibility scores. In particular, the coefficient on the variable
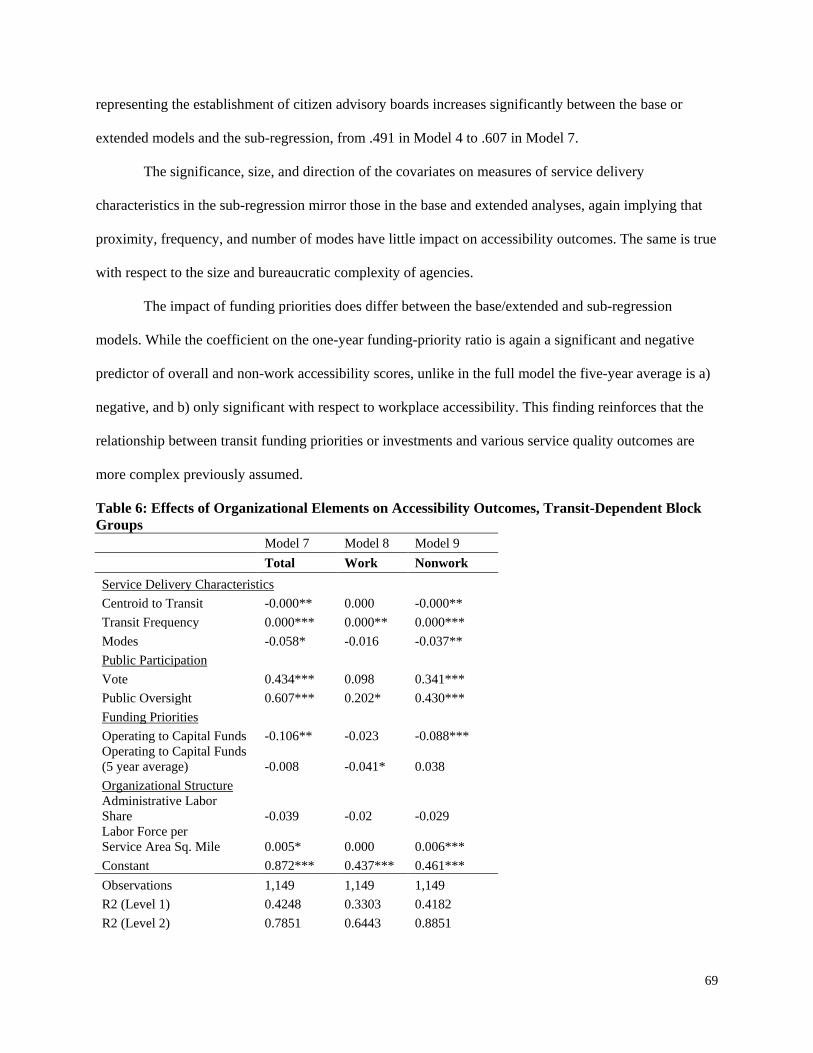
69
representing the establishment of citizen advisory boards increases significantly between the base or
extended models and the sub-regression, from .491 in Model 4 to .607 in Model 7.
The significance, size, and direction of the covariates on measures of service delivery
characteristics in the sub-regression mirror those in the base and extended analyses, again implying that
proximity, frequency, and number of modes have little impact on accessibility outcomes. The same is true
with respect to the size and bureaucratic complexity of agencies.
The impact of funding priorities does differ between the base/extended and sub-regression
models. While the coefficient on the one-year funding-priority ratio is again a significant and negative
predictor of overall and non-work accessibility scores, unlike in the full model the five-year average is a)
negative, and b) only significant with respect to workplace accessibility. This finding reinforces that the
relationship between transit funding priorities or investments and various service quality outcomes are
more complex previously assumed.
Table 6: Effects of Organizational Elements on Accessibility Outcomes, Transit-Dependent Block Groups Model 7 Model 8 Model 9
Total Work Nonwork
Service Delivery Characteristics Centroid to Transit -0.000** 0.000 -0.000** Transit Frequency 0.000*** 0.000** 0.000*** Modes -0.058* -0.016 -0.037** Public Participation
Vote 0.434*** 0.098 0.341*** Public Oversight 0.607*** 0.202* 0.430*** Funding Priorities
Operating to Capital Funds -0.106** -0.023 -0.088*** Operating to Capital Funds (5 year average) -0.008 -0.041* 0.038 Organizational Structure
Administrative Labor Share -0.039 -0.02 -0.029 Labor Force per Service Area Sq. Mile 0.005* 0.000 0.006*** Constant 0.872*** 0.437*** 0.461*** Observations 1,149 1,149 1,149 R2 (Level 1) 0.4248 0.3303 0.4182 R2 (Level 2) 0.7851 0.6443 0.8851
70
Discussion The development of a package of organizational elements to test as independent variables in the
regression analysis is an acknowledgement that service delivery outcomes are the product of several
overlapping and intersecting agency-level characteristics, and their impact must be determined in the
context of the overall organizational setting that defines public agencies. The results of this analysis show
that much of the variability in local transit-based destination accessibility outcomes is explained by
differences in key organizational elements, but that there are differences in the degree of influence that
these elements wield in shaping accessibility outcomes. Much of the between-city variability in the
distribution of accessibility outcomes is explained by transit agency organizational elements, as evidenced
by the high Level 2 R2. This finding confirms that the organizational elements that define transit agencies
are significant factors that influence local degrees of destination access. The more conservative R2 on the
Level 1 coefficients that vary within agencies suggests that neighborhood-level differences in access are
also significantly influenced by local contexts, such as local land use patterns and prevailing orientations
towards transit use.
The results of this analysis suggest several key takeaways. First, public participation in the
oversight and decision-making process matters a great deal for public transit accessibility outcomes. This
is especially true for outcomes among transit-dependent populations. Alongside prior research showing
the positive impact of participation on the efficiency of public services, the significance of citizen
advisory boards (as well as public referendum with respect to transit-dependent communities) underscores
the utility of engaging the public for the effective and equitable service delivery. This is significant for
advocates of transit equity, civic engagement and government transparency alike, and in some cities there
is an opportunity to organize around issues of public participation. Just seven out of twelve agencies
included in this analysis engage citizen advisory boards, only six have held a public referendum on
transit-related matters, and only two have had both. Strengthening the dialogue and the channels of
communication that exist between riders and service planners is critical for ensuring that the outcomes of
service delivery are valued and prioritized in the planning process.
71
Second, the relationship between transit agency funding structures and service delivery outcomes
is not as straightforward as some critical transit scholars have argued. Variables that reflect just the
previous year’s portfolio of investments indicate that higher operating-to-capital expenditures depress
accessibility outcomes, a finding that runs counter to expectations posited by the critical planning
community. On the other hand, the measure that averages investment and spending patterns over a five-
year span has the opposite impact – i.e., that higher operations-to-capital spending ratios are in fact
commensurate with improved accessibility outcomes. The varying relationship between the two funding
measures is clearly due to differences in the temporal scope of each funding measure. Although there are
year-over-year variations in spending, the five-year measure is a reflection of established priorities and
funding patterns that have manifested over time. This extended measure not only incorporates variations
in agency-level priorities and resource allocation for each previous year, but also serves as a more reliable
indicator of an agency’s long-term planning and investment goals. These results suggest that when
evaluating the impact of funding priorities on service delivery outcomes, more robust measures that
reflect deep-rooted trends are more reliable measures than one-year measures that may be the result of
necessary one-time or short-term investments in either capital or operating projects.
It is important to note that data included in this analysis does not delineate agency expenditures
beyond those going towards operating or capital purposes defined at their broadest level. While this limits
the opportunity to probe funding patterns in sharper detail, it is also necessary to acknowledge that capital
funds can be used for the improvement of bus services that serve low-income communities. In any given
year, an agency may be slated to rehabilitate or overhaul their fleet of buses, funding for which would
come out of an agency’s capital budget. The negative coefficient on the one-year funding variable may be
picking up on these nuances, but more detailed data is necessary for a more thorough investigation into
the intricacies of operating versus capital funding and spending and their impacts on service delivery
outcomes.
Third, across all block groups there is a significant difference in the impact of organizational
elements between work and non-work locations. The only significant factors in access to jobs in either the
72
base or extended model were service delivery characteristics, and the impact of these elements are small
enough to be effectively inconsequential. Large urban job centers are often positioned in close proximity
to existing or planned transit for employee access, as are commercial centers as a means of attracting
customers. Perhaps the location of jobs near transit is not a function of agency-level organizational
elements, but rather is a function of orientations and preferences on the part of employers. While the
findings of this analysis are limited in their ability to explain differences in accessibility outcomes
between destinations, results indicate that the kind of destination is significant in itself for the way that
transit agencies approach service planning. Different organizational structures, funding priorities, and
delivery standards, for example, are important for some kinds of destinations rather than others, and vice-
versa. Another area of future research raised in this analysis concerns the specific elements that shape
accessibility outcomes to work destinations.
Finally, organizational elements do have different impacts on accessibility outcomes among
transport-disadvantaged populations relative to the general public. The effects of organizational elements
are significant with respect to both work and nonwork destinations, which establishes transport-
disadvantaged populations as different from a service delivery perspective. Agencies that provide more
frequent transit service, establish direct patterns of citizen engagement, and are large enough to serve
demand but limit the degree of bureaucratic complexity within agencies tend to be better equipped to
provide transit dependent populations access to destinations of opportunity. Although race and class
characteristics of block groups are not strong predictors of accessibility outcomes, this outcome could be
viewed positively, as an indication that transit systems are blind to demographic characteristics of users
and strive to provide a uniform level of service across all social groups. However, alongside results of the
sub-regression, this analysis shows that engaging transit agencies in strategies that elevate the access to
opportunities for transport-disadvantaged groups has positive outcomes for low-income populations and
communities of color.
Conclusion
73
Differences in the way that transit agencies organize themselves, make decisions, and distribute
transit service are very important in terms of the ultimate delivery of services and for service quality.
Public participation matters – how much voice residents and riders get in terms of service delivery and
funding decisions is positively related to their relative degree of destination accessibility. The relationship
of funding priorities to transit service outcomes is complex, but more robust figures that reflect
established spending patterns are more reliable than data that reflects only recent investments. Transit
agency organizational elements have different impacts on work versus non-work locations as well as on
different social groups, notably the general population versus those with limited transportation options.
This study presents one of the first empirical examinations of the effect of transit agency
organizational elements on destination accessibility outcomes. Several potential areas of future research
have been identified that speak to both destination accessibility research and urban public service research.
First, the role of transit funding structures and the nature of their influence in defining access to
opportunities remains unclear. As transit agencies struggle to cover basic costs, the formula that agencies
employ for allocating funds between purposes must be evaluated in the context of its effects on service
delivery. Agencies must ensure that funds are spent and distributed in a way that enhances or at least
maintains a certain degree of destination accessibility for all users. Second, the factors that shape access
to work destinations remain vague. Third, future research could extend the scope of the organizational
elements that may shape destination outcomes.
One limitation of this analysis is the lack of data availability with respect to within-agency
variations in organizational elements. Future research looking into the quality of public transit services,
including accessibility outcomes, must take a detailed look at the full range of elements that shape the
delivery of services. This work should make efforts to include data that reflects highly localized variations
in the transit service delivery to estimate differences across social groups and between different
communities or neighborhoods. As demonstrated in this paper, local indicators of outcomes, included
here as transit-based accessibility scores, are robust and reliable indicators of service quality that reflect

74
the tangible utility of transit service to users. It is my hope that future research similarly explores the use
of accessibility scores as reflections of local transit service quality.
75
References Alcacer, Juan, Wilbur Chung, Ashton Hawk, and Goncalo Pacheco-de-Almeida. 2013. Applying Random
Coefficeint Models to Strategy Research: Testing For Firm Heterogeneity, Predicting Firm-Specific Coefficients, and Estimating Strategy Trade-Offs. Cambridge, MA.
Andrews, R., M. J. Beynon, and A. M. McDermott. 2015. “Organizational Capability in the Public Sector: A Configurational Approach.” Journal of Public Administration Research and Theory (Winter 2003):239–58.
Andrews, Rhys. 2010. “Organizational Structure and Public Service Performance.” Pp. 281–94 in Public management performance: Research directions, edited by Richard M. Walker, George A. Boyne, and Gene A. Brewer. Cambridge: Cambridge University Press.
Andrews, Rhys, and George A. Boyne. 2014. “Task Complexity, Organization Size, and Administrative Intensity: The Case of UK Universities.” Public Administration 92(3):656–72.
Applegate, John S. 1998. “Beyond the Usual Suspects: The Use of Citizens Advisory Boards in Environmental Decisionmaking.” Indiana Law Journal 73(3):903–57.
Beyer, Janice M., and Harrison M. Trice. 1979. “A Reexamination of the Relations Between Size and Various Components of Organizational Complexity.” Administrative Science Quarterly 24(1):48–64.
Blau, Peter M. 1972. “Interdependence and Hierarchy in Organizations.” Social Science Research 1(1):1–24.
Blaylock, Michael et al. 2010. “Effective Use of Citizen Advisory Committees for Transit Planning and Operations.” Transportation Research 76.
Boyle, John, and David Jacobs. 1982. “The Intracity Distribution of Services : A Multivariate Analysis.” The American Political Science Review 76(2):371–79.
Boyne, G. a. 2003. “Sources of Public Service Improvement: A Critical Review and Research Agenda.” Journal of Public Administration Research and Theory 13(3):367–94. Retrieved (http://jpart.oupjournals.org/cgi/doi/10.1093/jopart/mug027).
Boyne, George. 1998. Public Choice Theory and Local Government: A Comparative Analysis of the UK and the USA. Houndmills Basingstoke Hampshire; New York: Macmillan Press; St. Martin’s Press.
Brabham, Daren C. 2012. “Motivations for Participation in a Crowdsourcing Application to Improve Public Engagement in Transit Planning.” Journal of Applied Communication Research 40(3):307–28.
Center for Transportation Excellence. 2016. “Transportation Ballot Measures.” Retrieved May 20, 2016 (http://www.cfte.org/elections).
Cihan, A., Y. Zhang, and L. Hoover. 2012. “Police Response Time to In-Progress Burglary: A Multilevel Analysis.” Police Quarterly 15(3):308–27.
Cingranelli, David L. 1981. “Race, Politics and Elites: Testing Alternative Models of Municipal Service Distribution.” American Journal of Political Science 25(4):664–92.

76
Coulter, Philip B., Lois MacGillivray, and William Edward Vickery. 1976. “Municipal Fire Protection Performance in Urban Areas: Environmental and Organizational Influences on Effectivenes and Productivity Measures.” Pp. 231–60 in The Delivery of Urban Services, Volume 10, Urban Affairs Annual Reviews, edited by Elinor Ostrom. Beverly Hills, CA: SAGE Publications.
Cubukcu, K.Mert. 2008. “Examining the Cost Structure of Urban Bus Transit Industry: Does Urban Geography Help?” Journal of Transport Geography 16(4):278–91.
Damanpour, F. 1992. “Organizational Size and Innovation.” Organization Studies 13(3):375–402.
Egeberg, Morten. 2003. “How Bureaucratic Structure Matters: An Organizational Perspective.” Pp. 116–26 in Handbook of Public Administration, edited by Peters. B. Guy and Jon Pierre. London: SAGE Publications.
Eitle, D., S. J. D’Alessio, and L. Stolzenberg. 2014. “The Effect of Organizational and Environmental Factors on Police Misconduct.” Police Quarterly 17(2):103–26.
Federal Transit Administration. 2015. “National Transit Database Glossary.” Retrieved March 5, 2016 (http://www.ntdprogram.gov/ntdprogram/Glossary.htm).
Federal Transit Administration. 2016. “National Transit Database - Data.” Retrieved May 20, 2016 (http://www.ntdprogram.gov/ntdprogram/data.htm).
Fielding, Gordon J. 1983. “Changing Objectives for American Transit Part 1. 1950–1980.” Transport Reviews 3(3):287–99.
Foth, Nicole, Kevin Manaugh, and Ahmed M. El-Geneidy. 2013. “Towards Equitable Transit: Examining Transit Accessibility and Social Need in Toronto, Canada, 1996–2006.” Journal of Transport Geography 29:1–10.
Fung, Archon. 2015. “Putting the Public Back into Governance: The Challenges of Citizen Participation and Its Future.” Public Administration Review 75(4):513–22.
Garrett, Mark, and Brian Taylor. 1999. “Reconsidering Social Equity in Public Transit.” Berkeley Planning Journal 13(1):6–27.
Giuliano, Genevieve. 2003. “Travel, Location and Race/ethnicity.” Transportation Research Part A: Policy and Practice 37:351–72.
Giuliano, Genevieve, Hsi-Hwa Hu, and Kyoung Lee. 2001. The Role of Public Transit in the Mobility of Low-Income Households. Los Angeles, CA. Retrieved (https://www.metrans.org/sites/default/files/research-project/99-11_Final_0_0.pdf).
Gordon, Rachel A. 2010. Regression Analysis for the Social Sciences. New York: Routledge.
Grengs, Joe. 2001. “Does Public Transit Counteract the Segregation of Carless Households? Measuring Spatial Patterns of Accessibility.” Transportation Research Record 1753(1):3–10.
Grengs, Joe. 2002. “Community-Based Planning as a Source of Political Change: The Transit Equity Movement of the Los Angeles’ Bus Riders Union.” Journal of the American Planning Association 68(2):165–178.
77
Grengs, Joe. 2004. “Measuring Change in Small-Scale Transit Accessibility with Geographic Information Systems: Buffalo and Rochester, New York.” Transportation Research Record 1887(1):10–17.
Hage, Jerald, and Michael Aiken. 1967. “Relationship of Centralization to Other Structural Properties.” Administrative Science Quarterly 12(1):72–92.
Hall, Richard H., Norman J. Johnson, and J.Eugene Haas. 1967. “Organizational Size, Complexity and Formalization.” American Sociological Review 32(6):903–12.
Hall, Richard H., and Pamerla S. Tolbert. 2005. Organizations: Structures, Processes, and Outcomes. Ninth. Upper Saddle River, NJ: Pearson Prentice Hall.
Handy, Susan L. 2002. “Accessibility- vs. Mobility-Enhancing Strategies for Addressing Automobile Dependence in the U.S.” Institute of Transportation Studies. Retrieved (http://www.des.ucdavis.edu/faculty/handy/ECMT_report.pdf).
Helling, Amy, and David S. Sawicki. 2003. “Race and Residential Accessibility to Shopping and Services.” Housing Policy Debate 14(1–2):69–101.
Hinings, C. R., Royston Greenwood, and Stewart Ranson. 1975. “Contingency Theory and the Organization of Local Authorities: Part II Contingencies and Structure.” Public Administration 53(2):169–194.
Horner, Mark W., and Jessica N. Mefford. 2005. “Examining the Spatial and Social Variation in Employment Accessibility: A Case Study of Bus Transit in Austin, TX.” Pp. 193–214 in Access to Destinations, edited by David Levinson and Kevin J. Krizek. Burlington, MA: Elsevier Ltd.
Innes, Judith E., and David E. Booher. 2004. “Reframing Public Participation: Strategies for the 21st Century.” Planning Theory & Practice 5(4):419–436.
Irvin, Renee a., and John Stansbury. 2004. “Citizen Participation in Decision Making: Is It Worth the Effort?” Public Administration Review 64(1):55–65.
Iseki, Hiroyuki. 2008. “Economies of Scale in Bus Transit Service in the USA: How Does Cost Efficiency Vary by Agency Size and Level of Contracting?” Transportation Research Part A: Policy and Practice 42(8):1086–1097.
Jiao, Junfeng, Anne V. Moudon, Jared Ulmer, Philip M. Hurvitz, and Adam Drewnowski. 2012. “How to Identify Food Deserts: Measuring Physical and Economic Access to Supermarkets in King County, Washington.” American Journal of Public Health 102(10):32–40.
Jones, Bryan D., Saadia R. Greenberg, Clifford Kaufman, and Joseph Drew. 1978. “Service Delivery Rules and the Distribution of Local Government Services: Three Detroit Bureaucracies.” The Journal of Politics 40:332–68.
Jung, Chan Su. 2013. “Navigating a Rough Terrain of Public Management: Examining the Relationship between Organizational Size and Effectiveness.” Journal of Public Administration Research and Theory 23(3):663–86.
Koehler, David H., and Margaret T. Wrightson. 1987. “Inequality in the Delivery of Urban Services: A Reconsideration of the Chicago Parks.” The Journal of Politics 49:80–99.
78
Landre, Betsy K., and Barbara A. Knuth. 1993. Success of Citizen Advisory Committees in Consensus‐based Water Resources Planning in the Great Lakes Basin. Society & Natural Resources 6(3): 229-257.
Langworthy, Robert. 1986. The Structure of Police Organizations. New York: Praeger.
Larsen, Kristian, and Jason Gilliland. 2008. “Mapping the Evolution of ‘Food Deserts’ in a Canadian City: Supermarket Accessibility in London, Ontario, 1961-2005.” International Journal of Health Geographics 7(16).
Leland, Suzanne, and Olga Smirnova. 2009. “Reassessing Privatization Strategies 25 Years Later: Revisiting Perry and Babitsky’s Comparative Performance Study of Urban Bus Transit Services.” Public Administration Review 69(5):855–67.
Levy, Frank, Arnold J. Meltsner, and Aaron Wildavsky. 1974. Urban Outcomes: Schools, Streets, and Libraries. Berkeley: University of California Press.
Lineberry, Robert L. 1977. Equality and Urban Policy: The Distribution of Municipal Public Services. Beverly Hills, CA: Sage Publications.
Litman, Todd. 2015. Evaluating Accessibility for Transportation Planning: Measuring People’s Ability to Reach Desired Goods and Activities. Victoria, British Columbia. Retrieved March 1, 2015 (http://www.vtpi.org/access.pdf).
Lynn, F. M., and G. J. Busenberg. 1995. “Citizen Advisory Committees and Environmental Policy: What We Know, What’s Left to Discover.” Risk Analysis 15(2):147–62.
Maguire, Edward R. 1997. “Structural Change in Large Municipal Police Organizations during the Community Policing Era.” Justice Quarterly 14(3):547–76.
Maroko, Andrew R., Juliana a Maantay, Nancy L. Sohler, Kristen L. Grady, and Peter S. Arno. 2009. “The Complexities of Measuring Access to Parks and Physical Activity Sites in New York City: A Quantitative and Qualitative Approach.” International journal of health geographics 8:34.
McKenzie, Brian S. 2013a. “Access to Supermarkets Among Poorer Neighborhoods: A Comparison of Time and Distance Measures.” Urban Geography 35(1):133–51.
McKenzie, Brian S. 2013b. “Neighborhood Access to Transit by Race, Ethnicity, and Poverty in Portland, OR.” City & Community 12(2):134–55.
Miller, Harvey J., and Yi-Hwa Wu. 2000. “GIS Software for Measuring Space-Time Accessibility in Transportation Planning and Analysis.” GeoInformatica 4(2):141–59.
Miyake, Keith K., Andrew R. Maroko, Kristen L. Grady, Juliana A. Maantay, and Peter S. Arno. 2010. “Not Just a Walk in the Park: Methodological Improvements for Determining Environmental Justice Implications of Park Access in New York City for the Promotion of Physical Activity.” Cities and the environment 3(1):1–17.
Mladenka, Kenneth R. 1980. “The Urban Bureaucracy and the Chicago Political Machine : Who Gets What and the Limits to Political Control.” The American Political Science Review 74(4):991–98.
79
Mladenka, Kenneth R., and Kim Quaile Hill. 1977. “The Distribution of Benefits in an Urban Environment: Parks and Libraries in Houston.” Urban Affairs Review 13(1):73–94.
Moore, Latetia V, Ana V Diez Roux, Kelly R. Evenson, Aileen P. McGinn, and Shannon J. Brines. 2008. “Availability of Recreational Resources in Minority and Low Socioeconomic Status Areas.” American Journal of Preventive Medicine 34(1):16–22.
Murnane, Richard J., and Richard R. Nelson. 1984. “Production and Innovation When Techniques Are Tacit. The Case of Education.” Journal of Economic Behavior and Organization 5(3–4):353–73.
Neshkova, Milena I., and Hai David Guo. 2012. “Public Participation and Organizational Performance: Evidence from State Agencies.” Journal of Public Administration Research and Theory 22(2):267–88.
O’Brien, Robert M. 2007. “A Caution Regarding Rules of Thumb for Variance Inflation Factors.” Quality & Quantity 41(5):673–90.
Perry, James L., and Timlynn T. Babitsky. 1986. “Comparative Performance in Urban Bus Transit : Strategies Assessing Privatization.” Public Administration Review 46(1):57–66.
Pucher, J., and J. L. Renne. 2003. “Socioeconomics of Urban Travel: Evidence from the 2001 NHTS.” Transportation Quarterly 57(3):49–77.
Pucher, John. 1981. “Equity in Transit Finance: Distribution of Transit Subsidy Benefits and Costs Among Income Classes.” Journal of the American Planning Association 47(November):387–407.
Pucher, John. 1982. “Discrimination in Mass Transit.” Journal of the American Planning Association 48(November):315–26.
Pucher, John. 2004. “Public Transportation.” Pp. 199–236 in The Geography of Urban Transportation, edited by Genevieve Giuliano and Susan Hanson. New York, NY: The Guilford Press.
Rainey, Hal G. 2009. Understanding and Managing Public Organizations. 4th ed. San Francisco, CA: Jossey-Bass.
Randolph, John, and Michael Bauer. 1999. “Improving Environmental Decision-Making through Collaborative Methods.” Policy Studies Review 16:3/4:168–91.
Recchia, Anthony. 2010. “R-Squared Measures for Two-Level Hierarchical Linear Models Using SAS.” Journal of Statistical Software 32(January):1–9.
Rich, Richard. 1979. “Neglected Issues in the Study of Urban Service Distributions: A Research Agenda.” Urban Studies 16(2):143–56.
Richmond, Jonathan. 2001. “A Whole-System Approach to Evaluating Urban Transit Investments.” Transport Reviews 21(2):141–79.
Risner, Geneviève, and Daniel Bergan. 2012. “The Perils of Participation : The Effect of Participation Messages on Citizens ’ Policy Support.” Journal of Public Transportation 15(2):137–56.
Rodriguez, German. 2016. “Random-Coefficient Models.” Retrieved March 6, 2016 (http://data.princeton.edu/pop510/lang2.html).
80
Rowe, G., and L. J. Frewer. 2000. “Public Participation Methods: A Framework for Evaluation.” Science, Technology & Human Values 25(1):3–29.
Rushing, William. 1974. “Differences in Profit and Nonprofit Organizations: A Study of Effectiveness and Efficiency in General Short-Stay Hospitals.” Administrative Science Quarterly 19(4):474–84.
Sclar, Elliott D. 2000. You Don’t Always Get What You Pay For: The Economics of Privatization. Ithaca, NY: Cornell University Press.
Scott, Darren M., and Mark W. Horner. 2008. “The Role of Urban Form in Shaping Access to Opportunities.” Journal of Transport and Land Use 2(Fall):89–119.
Small, Mario Luis, and Laura Stark. 2005. “Are Poor Neighborhoods Resource Deprived? A Case Study of Childcare Centers in New York*.” Social Science Quarterly 86(1):1013–36.
Stewart, Jennifer M. P., and A.John Sinclair. 2007. “Meaningful Public Participation in Environmental Assessment: Perspectives From Canadian Participants, Proponents, and Government.” Journal of Environmental Assessment Policy and Management 9(2):161–83.
Talen, Emily. 2001. “An Empirical Investigation of Access to Elementary Schools in West Virginia.” Annals of the Association of American Geographers 91(3):465–86.
Talen, Emily. 2013. “The Social Equity of Urban Service Distribution: An Exploration of Park Access in Pueblo, Colorado and Macon, Georgia.” Urban Geography 18(6):521–41.
Taylor, Brian D. 2004. “The Geography of Urban Transportation Finance.” Pp. 294–331 in The Geography of Urban Transportation, edited by Susan Hansen and Genevieve Giuliano. New York, NY: The Guilford Press.
Taylor, Brian D., and Eric A. Morris. 2015. “Public Transportation Objectives and Rider Demographics: Are Transit’s Priorities Poor Public Policy?” Transportation 42(2):347–67.
Thacher, David. 2010. “The Distribution of Police Protection.” Journal of Quantitative Criminology 27(3):275–98.
Thomas, John Clayton. 2013. “Citizen, Customer, Partner: What Should Be the Role of the Public in Public Management.” Public Administration Review 73(6):786–96.
U.S. Environmental Protection Agency. 2016. “Smart Location Mapping.” Retrieved May 20, 2016 (https://www.epa.gov/smartgrowth/smart-location-mapping#_edn4).
Vigoda, E. 2002. “Administrative Agents of Democracy? A Structural Equation Modeling of the Relationship between Public-Sector Performance and Citizenship Involvement.” Journal of Public Administration Research and Theory 12(2):241–72.
Wachs, Martin. 2004. “Reflections on the Planning Process.” Pp. 141–62 in The Geography of Urban Transportation, edited by Genevieve Giuliano and Susan Hanson. New York, NY: The Guilford Press.
van Wee, Bert, and Karst Geurs. 2011. “Discussing Equity and Social Exclusion in Accessibility Evaluations.” European Journal of Transport and Infrastructure Research 11(4):350–67.

81
Wells, Kirstin, and Jean-Claude Thill. 2012. “Do Transit-Dependent Neighborhoods Receive Inferior Bus Access? A Neighborhood Analysis in Four U.S. Cities.” Journal of Urban Affairs 34(1):43–63.
Williams, Elizabeth. 2016. “You Can’t Get There If You Can’t Get There: Trends in Transit-Based Access to Destinations.”
Yang, Kaifeng, and Sanjay K. Pandey. 2011. “Further Dissecting the Black Box of Citizen Participation: When Does Citizen Involvement Lead to Good Outcomes?” Public Administration Review 71(6):880–92.
82
PAPER 3
“Accessibility and Social Exclusion in Local Public Transportation Agencies”
Introduction Many scholars who are considered critical transportation planners are also vocal advocates of the
adoption of accessibility-based planning principles in local planning practices (Cervero 2005; Handy
2002; Litman 2013). As opposed to traditional mobility-based approaches that prioritize the movement of
vehicles through the network (Lucas 2004a; Walker 2008, 2011; Whitelegg 1997), accessibility-based
planning emphasizes the outcomes experienced by users, including the reliability of service and the
degree to which people are able to travel to the places they need or want to go (Ewing 1995; Lucas 2004b;
Martens 2006; Papa et al. 2015). Accessibility-based planning is believed to not only be progressive and
promote social equity with respect to destination access, but is seen as reflecting the true ‘goals’ of
transportation systems, i.e. getting people to the places they need or want to go (Cervero 2005; Litman
2013; Martens 2015; Salomon and Mokhtarian 1998; Wachs and Kumagai 1973). Planning practices that
enhance accessibility outcomes are also relevant for academics that engage social exclusion theory, a
framework for understanding the institutional barriers that prohibit full participation in social and civic
life (Church, Frost, and Sullivan 2000; Madanipour 1998; Stanley and Vella-Brodrick 2009; Ureta 2008).
As the means by which people physically access places, transportation can be both a barrier to social
inclusion and a means for overcoming exclusionary obstacles. Although the relationship between social
mobility and transportation planning is often overlooked, social exclusion theory clarifies the significance
of prioritizing accessibility in transportation planning policies and practices for a variety of social
outcomes.
Despite the promises and potential benefits associated with accessibility-based planning practices,
whether or not local transportation planning practitioners are actively moving beyond traditional
approaches to planning and addressing issues of accessibility via targeted planning practices and
protocols remains largely unknown, as is whether or not these practices have an observable impact on
people’s actual experiences. Given the emphasis on accessibility-based planning for encouraging positive,
83
inclusion-enhancing social outcomes in the academic literature, the lack of clarity with respect to the
tangible effects of accessibility-based planning is a significant oversight. The present analysis is a
response to this research gap, and asks two questions: first, to what degree do local planning practitioners
move beyond traditional mobility-oriented approaches and incorporate accessibility-based planning
principles in their regular service design and evaluation protocols? Second, what is the impact of an
accessibility-based planning orientation on accessibility outcomes?
This research specifically engages public transportation as a site of inquiry. Issues of institutional
accountability around accessibility outcomes are particularly significant with respect to public
transportation service, as are issues of social exclusion. Not only are most mass transit services public
resources administered by government agencies, but their very existence is premised on enabling people
to travel to places they would otherwise be unable to go. More significantly, public transit is the mode of
transit disproportionately relied upon by those socioeconomic and demographic groups most at risk for
social disadvantage (Giuliano 2005; Lucas 2012; Pucher and Renne 2003; Puentes and Tomer 2011). This
analysis is therefore both an evaluation of the incorporation and effectiveness of accessibility-based
planning practices, as well as an investigation into an important institutional driver of social mobility.
This study relies on both qualitative and quantitative techniques. The first part of this analysis is a
review of the service delivery standards developed by nine U.S. public transit agencies to establish the
degree to which accessibility-based planning practices are being engaged in local transportation planning
practices. Using evidence gathered from these documents, transit agencies are considered as either
accessibility-oriented or mobility-oriented. To gauge the impact of an accessibility-based orientation on
accessibility outcomes, the second part of this analysis draws on quantitative destination accessibility
scores developed in a previous analysis. These scores are highly localized measures of access that can be
aggregated and modeled to illustrate how differences in orientation affect the experiences of urban transit
riders. Results show that while incorporation of accessibility-based planning is limited, the impacts of
accessibility-based planning on the outcomes experienced by users are not as robust as the literature
suggests. These findings suggest that the determinants of destination accessibility are complex, and
84
addressing accessibility through targeted transportation planning guidelines and policies is not a silver
bullet for more robust destination accessibility outcomes. However, rather than invalidating the
effectiveness of accessibility-based techniques, this research encourages the further exploration of
accessibility-conscious issues and planning approaches to gain a deeper sense as to what policies and
protocols would be most effective for affecting more robust accessibility outcomes.
Literature Review Traditional Transportation Planning in Practice: The Emphasis on Mobility
Within academic and applied transportation research circles, ‘mobility’ is widely recognized as
the traditional ‘paradigm’ that has long guided urban transportation planning (Ganning 2014; Levine,
Grengs, Quingyun Shen, et al. 2012; Litman 2013; Martens 2015). The term and concept of mobility is
likely familiar to most people, which simply refers to one’s actual ability to get around, or the base
potential for movement (Handy 2002, 2005; Martens 2015). Mobility is therefore about motion, travel,
and moving about different places in space. Under the mobility paradigm, the primary task facing
transportation agencies and planners is ensuring the continual optimization of travel itself via the
transportation network’s internal performance (Coppola and Papa 2013). In other words, maximizing the
efficient and timely movement of vehicles and/or people through a transportation network is the primary
motivation of most if not all transportation planning efforts (Lucas 2004a; Walker 2008, 2011; Whitelegg
1997). Speed and travel time are classic indicators of mobility, and are the chief factors by which existing
and proposed services are designed and evaluated (Ewing 1993, 1995; Handy 2005; Levine, Grengs,
Qingyun Shen, et al. 2012; Levinson, Krizek, and Gillen 2005; Martens 2015). Other commonly used
mobility measures include volume-to-capacity ratios, the number of trips made, or the number of miles
travelled by individuals, households, or cars within a network (Handy 2005).
Although emphasizing transportation network performance may seem like a logical goal,
practitioners’ focus on mobility has long been a target of criticism in academic circles for several related
reasons (Martens 2015). The technical criticism argues that by prioritizing speed and travel time as the
85
factors that best reflect the effectiveness of transportation networks, planners implicitly incentivize the
private automobile as the best and most efficient mode of transportation (Cervero 1997). This not only
undermines the legitimacy of public transit service and other travel modes like biking and walking, but in
the words of some, “directs attention to the wrong problems” (Martens 2015:18). Under the mobility
paradigm, congestion is public enemy number one. Transportation interventions and initiatives designed
to decrease congestion and improve speed or travel time tend to focus on expansion of the transportation
network, increasing the speed traveled through the network, or removing obstacles that make high-speed,
long-distance movement fast and convenient. Despite intentions, these strategies not only make
congestion worse (Duranton and Turner 2011; Handy 2015; Litman 2016,Puentes 2015), but a mobility-
based planning orientation exacerbates negative impacts on the built environment, environmental and
public health, urban sustainability, and accessible land use patterns (see Cervero 1997; Ewing 1993;
Squires 2002; or Squires and Kubrin 2005 for a more detailed discussion).
In addition to the technical concerns with the traditional approach, critical transportation scholars
have also questioned the elevation of vehicles above people as the orienting ‘goal’ that drives
transportation planning and subsequent investment decisions. Despite the acknowledgement that
transportation networks are a) infrastructure tools built largely at the expense of and in the interest of the
public, and b) are critical for enabling social inclusion and mobility, the applied transportation policy and
planning community in the United States has historically been seen as ambivalent about social welfare
and advocacy (Hine and Mitchell 2001; Lucas 2004a, 2012; Root 2003; Whitelegg 1997). This has
arguably led to a deeper engagement with accessibility as a dimension of social exclusion and an indicator
of social well-being on the part of the academic transportation research community.
The Significance of Transportation Planning to Social Inclusion Social exclusion theory is a theoretical framework seeks to understand how and why some people
and social groups are able to be upwardly mobile and experience a good quality of life, while others seem
to be chronically left behind. Social exclusion theory emphasizes those obstacles both tangible and
86
intangible that prevent people from fully participating in society (Stanley and Vella-Brodrick 2009; Ureta
2008). These obstacles are disincentives to participation – literal and metaphorical barriers to access. The
shape of these barriers can take many forms, including physical, monetary, or value-based barriers such as
racism or xenophobia (Silver and Miller 2003). Perpetuated by institutional rather than individual forces,
processes of social exclusion are self-perpetuating and reinforcing, as the disadvantage that leads to social
exclusion begets more disadvantages, and complicates the channels by which exclusion can be overcome
(Church et al. 2000; Clifton and Lucas 2004).
Transportation is a critical dimension of social exclusion. In order to be engaged as a full member
of society, to exercise civic engagement, and to benefit from the resources that society has to offer, people
must be able to access opportunities. These opportunities include but are not limited to education,
employment, healthcare, and civic events The ability to physically travel to places that promote social
capital and the ability to exercise voice and agency is a significant determinant of social outcomes.
Clifton and Lucas (2004) cogently summarize the cyclical and infusive nature of the lack of adequate
transportation, and explain how this can reverberate throughout various dimensions of a person’s life and
generate negative, enduring results:
In a highly mobile society, a lack of adequate transport provision means that individuals become cut off from employment, education, and training and other opportunities. This in turn perpetuates their inability to secure a living wage and thus to fully participate in society. Poor access to healthy affordable food, primary and secondary healthcare and social services exacerbates the health inequalities that are already evident among low-income groups, further reducing their life changes. People can become housebound, isolated and cut off from friends, family, and other social networks. This can seriously undermine their quality of life and, in extreme circumstances, may lead to social alienation, disengagement, and thus, undermined social cohesion (ibid:29).
The consequences of transportation disadvantage are significant because the majority of those at risk for
social exclusion – including low-income and minority groups (Lucas 2012; Silver and Miller 2003) - are
usually those most likely to lack adequate means of travel (Blumenberg and Ong 2001; Giuliano 2003;
Pucher and Renne 2003). Transportation disadvantage and social exclusion are, in technical terms,
mutually exclusive because not everyone who is disadvantaged is excluded, and vice-versa. But
transportation disadvantage itself is key a barrier to social inclusion, because the lack of reliable and
87
adequate transportation is a major disincentive that undermines the ability or willingness of people to
travel in the first place. Ensuring adequate access to convenient, reliable, and high-quality transportation
services that go places people need and want is thus a key response to a critical and prohibitive barrier of
social exclusion.
The challenges of being socially excluded and transportation disadvantaged are difficult to
overcome because transportation is an institutional barrier that is the product of decisions and values held
by public agencies and administrators. The great utility of the social exclusion framework is that it
clarifies the lineage of accountability for the outcomes rendered by social institutions. Specifically, the
drivers of adverse outcomes must be traced “back to the values, processes, and actions of key delivery
agencies, which are seen to have systematically excluded certain individuals, groups, or communities
from the benefits of their policy decisions and practices” (Lucas 2012:106). With respect to influencing
transportation behaviors and outcomes, policymakers and planners, as well as the standards and
guidelines they adhere to in their regular planning practices, are obvious sites of consequence.
Following the process of social exclusion down the line from a transportation disadvantage
perspective thus eventually brings us to the details of transportation policy and planning protocols – or the
aforementioned ‘values, processes, and actions’ of transportation agencies. The guidelines that planners
adhere to when designing services directly impact the effort and ease with which people can access not
only the network itself, but the final destinations they are intending to go. While traditional planning
practices focus on the movement of vehicles through a network, alternative accessibility-based planning
paradigms that emphasize the end-result of transportation systems – the quality and utility of the system
to users – have found a large advocacy base within the critical academic transportation community
because of the anticipated impacts of such practices. Although there are many approaches to addressing
issues of accessibility, practices that emphasize an accessibility orientation emphasize the social utility of
transportation networks to users, in contrast to the aforementioned mobility-based approaches that
primarily focus on movement.
88
Defining and Applying Accessibility as a Transportation Paradigm
While the concept of and connection to social exclusion is not made explicit in U.S. academic
transportation literature, the principles that define an accessibility orientation directly engage the issues of
social exclusion. Compared with mobility, ‘accessibility’ has proven to be a decidedly more difficult term
to define. In fact, it has been suggested that of the lack of attention to accessibility issues in urban
transportation planning practices is in part due to the difficulty many practitioners have comprehending
and operationalizing the concept (Ganning 2014; Koenig 1980). In the academic literature, accessibility
broadly refers to ‘the ease of reaching destinations’ (Levine and Garb 2002), but has also been used to
mean ‘the opportunity or potential for interaction’ (Handy 2005; Handy and Niemeier 1997). If the
essence of mobility is movement, the essence of accessibility refers to what can be done with this
movement. In the words of one transportation scholar, the concept of accessibility “expresses what is
possibly the major function of cities: i.e. providing opportunities for easy interaction or exchange”
(Koenig 1980:169).
Many scholars treat the concepts of accessibility and mobility as if they are mutually exclusive
when in fact, the degree of access available to people or vehicles in a system initially depends on
mobility-based elements (Levine and Garb 2002). A person cannot access people or destinations if they
are not mobile, rendering mobility itself a key factor that determines accessibility outcomes (Berdica
2002; Coppola and Papa 2013; Levine, Grengs, Qingyun Shen, et al. 2012). However, while it is true that
planning practices must at some level and some point attend to elements of mobility, planning for
accessibility moves a step beyond mobility approaches and addresses a larger scope and vision of the
utility of a transportation network. Rather than limiting the planning vision to the transportation network
itself, accessibility planning also involves attention to land use, variations in travel needs and behaviors,
and a reliable sense of the places that people need and want to go. If planning for mobility is reaching the
finish line, planning for accessibility is going the extra mile, and is a natural and necessary complement to
traditional planning efforts (Cervero 1997).
89
Instead of focusing on the internal performance of the network or the ease with which vehicles
move through a system, accessibility-based planning focuses on outcomes and improving the degree to
which people can travel to places and gain utility from the transportation system (Coppola and Papa 2013;
Lucas 2004b). Under this orientation, the main outcome of interest is the overall effect of the
transportation system – i.e. the quality and variety of destinations that a user can easily access (Ewing
1995; Martens 2006; Papa et al. 2015; Wachs and Kumagai 1973). This is not to say that the evaluation of
internal performance is overlooked; instead, an accessibility orientation gives planners and practitioners
an opportunity to expand the scope of their activities beyond the network itself and consider viable design
alternatives that will impact overall system utility. Lucas (2004b) argues that the benefits of accessibility
planning are many, including the consideration of needs of groups who are often overlooked, the ability to
better assess the effects of changes to a system, and ensuring consistency between policy goals. Handy
and Niemeier (1997:1176) have similarly argued that the use of accessibility measures could be
particularly significant in directing transportation investments towards those improvements that would be
most impactful with respect to social equity and service quality.
In theory, there are many ways of incorporating and adopting accessibility principles in urban
transportation planning. Given the shared goal of promoting equity and access, each has the potential to
have significant impacts for social inclusion. One step is the recognition or establishment of accessibility
in the mission, priority, vision, and goals at the agency level. Another approach is the formal and regular
use of measures and indicators that directly reflect outcomes related to destination accessibility when
establishing and evaluating services. A kaleidoscope of approaches to measuring destination accessibility
have been developed in the literature (see Geurs and van Wee 2004; Handy and Niemeier 1997; Koenig
1980 for further discussion), and most are recognized as reliable indicators of transportation performance
that reflect outcomes that mobility measures cannot and do not capture.
Accessibility-based approaches are believed to hold much potential for the ways in which
services are designed and outcomes are realized. To paraphrase a classic example by Wachs and Kumagi
(1973), consider that traditional, mobility-based approaches begin with travel demand models that
90
estimate the existing capacity for services. These models are based on existing service levels, and so if
demand in a particular area appears low, planners are unlikely to develop or design robust transportation
networks there. However, this may be a reflection of the lack of utility people derive from the network as
it is presently configured rather than a lack of demand or need. Under an accessibility-based approach, the
utility of existing services are first evaluated, giving planners an opportunity to update services to better
meet the needs of users. A mobility approach, in effect, may perpetuate the inefficiencies that presently
exist, while an accessibility approach that starts with the question of utility works to update services in the
name of efficiency and destination access.
Despite the promises and potential benefits associated with accessibility-based planning practices,
little about their practical application is known. A previous analysis by Handy (2002) conducted over ten
years ago evaluated the presence of accessibility-oriented planning practices in four regional planning
agencies in Northern California, but these agencies’ directives are broad in scope and not limited to
transportation planning alone. Her research found no conclusive evidence pointing to the incorporation of
accessibility-based planning. A corollary empirical oversight concerns the impact of accessibility-based
planning practices on accessibility outcomes. Although they are anticipated to have positive effects on
outcomes, this assumption appears to be based on speculation rather than empirical research. This
research aims to fill these important research gaps by first gauging ‘if’ and ‘how’ issues of accessibility
are being engaged in local planning practices, as well as what the impact of these practices actually are
with respect to destination access.
Accessibility and Mobility in Public Transportation Planning The analysis of accessibility-based planning practices in the context of social exclusion is
particularly significant for the delivery of public transportation services. Public transit is first and
foremost a public good, and its very existence is predicated on connecting origins with destinations and
providing potential riders with access to jobs, schools, and other places they need or want to go (Handy
2002; Litman 2015; Miller and Wu 2000; van Wee and Geurs 2011). Further, the decisions and values
91
held by public transit service planners and administrators are directly manifested in the services that are
delivered to users. While the drivers of private vehicles hold much agency with respect to their
transportation outcomes, public transit users are beholden to the decisions made at the agency level. The
effects of certain decisions and design or delivery processes are more immediately visible and impactful,
and are directly related to how much utility and use transit riders derive from the system.
Second, the emphasis on destination accessibility is also uniquely important for public transit
agencies because of public transit’s significance for overcoming social exclusion among those who are
most at risk. Fan, Guthrie, and Levinson (2012) eloquently argue that the service that public transit
provides is “more than a means of transportation. It serves as a key component in addressing poverty,
unemployment and equal opportunity goals” (ibid:28). Members of disadvantaged social groups are
disproportionately members of zero-vehicle households (Puentes and Tomer 2011) and thus are most at
risk for experiencing transportation disadvantage (Lucas 2009). Additionally, members of disadvantaged
social groups as well as members of zero-vehicle households are two of the most dedicated and reliable
riders of public transportation services; in fact, most of these riders rely on public transit service as their
primary means of transportation (Giuliano 2003; Giuliano, Hu, and Lee 2001; Pucher and Renne 2003;
Puentes and Tomer 2011). Incorporating principles of accessibility in public transit service planning and
evaluation is thus not just a matter of prioritizing the true goals of transportation planning, but also a
matter of contributing to the social equity, social mobility, and social inclusion on the part of those who
most stand to benefit from it.
Existing research has established that organizational characteristics and elements of public transit
agencies are important drivers of outcomes related to accessibility and thus social exclusion, and as such
are relevant and important sites for scrutiny and analysis. These findings indicate that the way that transit
agencies organize themselves, including how they prioritize expenditures and investments and the degree
of public input in decision-making, has an impact on both overall accessibility outcomes as well as for
outcomes experienced by those at risk for social exclusion and transportation disadvantage (Williams
2016b, Hine and Mitchell 2001). The present research thus explores public transportation systems as
92
institutional drivers of social mobility as well as extends existing analysis by clarifying the degree to
which accessibility-focused planning orientations additionally matter as an agency-level characteristic in
shaping accessibility outcomes.
Methods This analysis is divided into two parts. To evaluate the observed impact of accessibility practices,
it is first necessary to establish whether or not they have been adopted. To initially assess the degree to
which accessibility-based planning practices are being incorporated by local public transit agencies, I
build upon a qualitative approach developed by Handy (2002). Handy’s work is similar to the present
study in asking about the degree to which planning practitioners emphasize an accessibility orientation,
but Handy’s analysis is limited to four regional metropolitan planning agencies in Northern California
that are broad in scope and not only include but heavily emphasize the roadway network and vehicle
travel. Of great utility is the rubric Handy developed to classify agency goals, measures, and strategies.
Although the present analysis focuses solely on the orientations of public transportation agencies rather
than on regional planning organizations, much of the criteria and coding rationale used to develop the
rubric and classify evidence draws on Handy’s previous research.
This work reviews the published documents that specify the goals and service standards or
evaluation metrics used by nine of the largest public transportation agencies in the United States (see
Table 1). Service standards are the codified design and service delivery guidelines that establish where
transit vehicles go, how often, how many passengers can be carried, hours of operation, and so on.
Service standards documents formalize an agency’s objectives and policies with respect to the elements
required for the successful delivery of services. Although some agencies might engage in service design
and delivery practices that are not publicly disclosed or described in the materials included in this analysis,
the published service standards documents are the most official guidelines and procedures that each
agency uses. As seen in Table 1, the documents included in this analysis also reflect standards adopted as
recently as 2015 or as early as 2001. Two of the documents – from Chicago and Denver – are fourteen
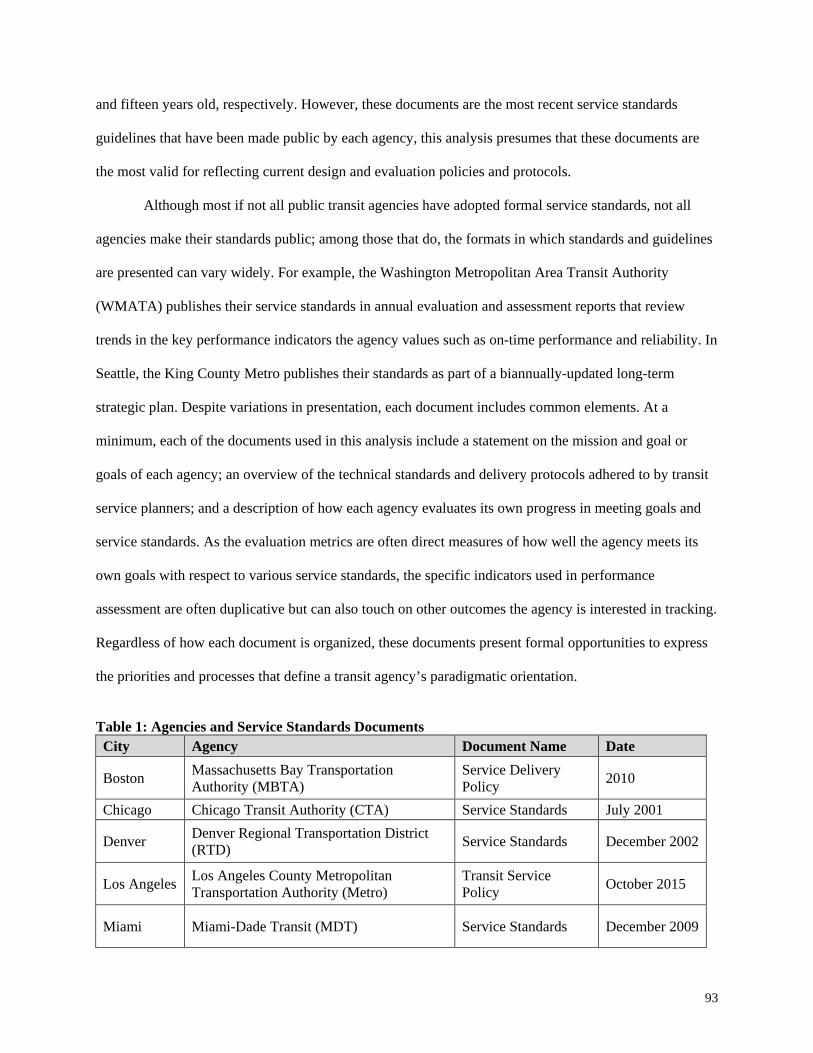
93
and fifteen years old, respectively. However, these documents are the most recent service standards
guidelines that have been made public by each agency, this analysis presumes that these documents are
the most valid for reflecting current design and evaluation policies and protocols.
Although most if not all public transit agencies have adopted formal service standards, not all
agencies make their standards public; among those that do, the formats in which standards and guidelines
are presented can vary widely. For example, the Washington Metropolitan Area Transit Authority
(WMATA) publishes their service standards in annual evaluation and assessment reports that review
trends in the key performance indicators the agency values such as on-time performance and reliability. In
Seattle, the King County Metro publishes their standards as part of a biannually-updated long-term
strategic plan. Despite variations in presentation, each document includes common elements. At a
minimum, each of the documents used in this analysis include a statement on the mission and goal or
goals of each agency; an overview of the technical standards and delivery protocols adhered to by transit
service planners; and a description of how each agency evaluates its own progress in meeting goals and
service standards. As the evaluation metrics are often direct measures of how well the agency meets its
own goals with respect to various service standards, the specific indicators used in performance
assessment are often duplicative but can also touch on other outcomes the agency is interested in tracking.
Regardless of how each document is organized, these documents present formal opportunities to express
the priorities and processes that define a transit agency’s paradigmatic orientation.
Table 1: Agencies and Service Standards Documents City Agency Document Name Date
Boston Massachusetts Bay Transportation Authority (MBTA)
Service Delivery Policy 2010
Chicago Chicago Transit Authority (CTA) Service Standards July 2001
Denver Denver Regional Transportation District (RTD) Service Standards December 2002
Los Angeles Los Angeles County Metropolitan Transportation Authority (Metro)
Transit Service Policy October 2015
Miami Miami-Dade Transit (MDT) Service Standards December 2009
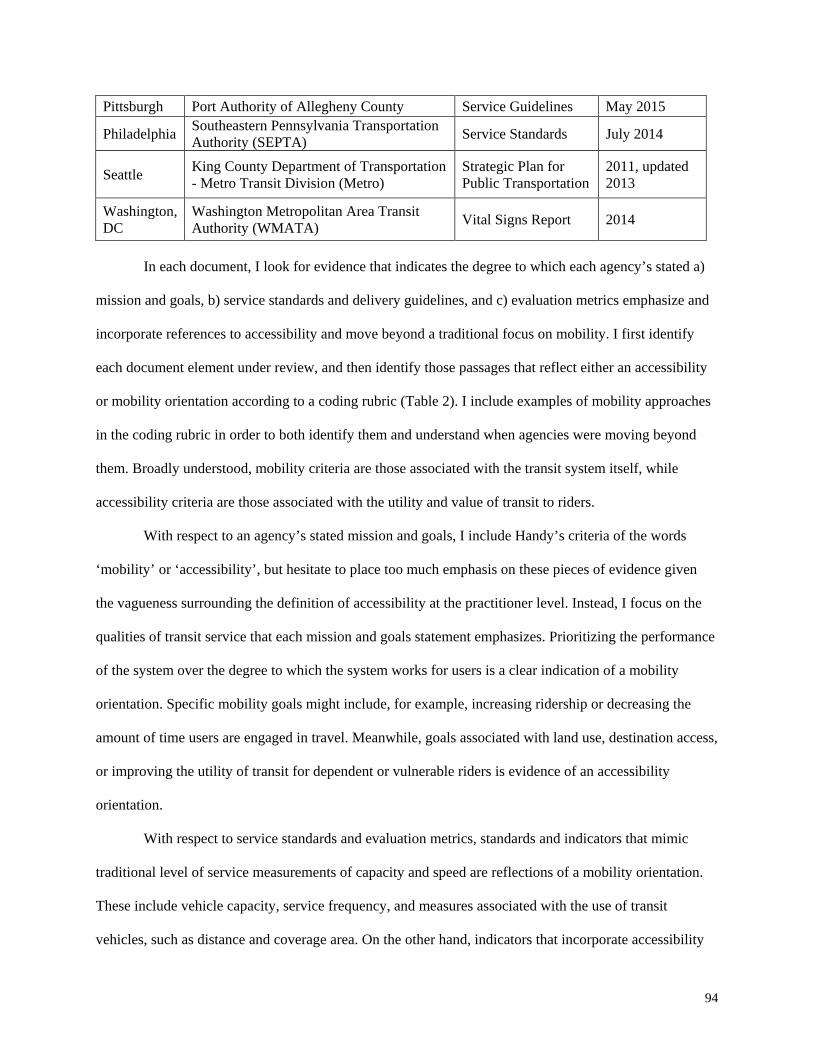
94
Pittsburgh Port Authority of Allegheny County Service Guidelines May 2015
Philadelphia Southeastern Pennsylvania Transportation Authority (SEPTA) Service Standards July 2014
Seattle King County Department of Transportation - Metro Transit Division (Metro)
Strategic Plan for Public Transportation
2011, updated 2013
Washington, DC
Washington Metropolitan Area Transit Authority (WMATA) Vital Signs Report 2014
In each document, I look for evidence that indicates the degree to which each agency’s stated a)
mission and goals, b) service standards and delivery guidelines, and c) evaluation metrics emphasize and
incorporate references to accessibility and move beyond a traditional focus on mobility. I first identify
each document element under review, and then identify those passages that reflect either an accessibility
or mobility orientation according to a coding rubric (Table 2). I include examples of mobility approaches
in the coding rubric in order to both identify them and understand when agencies were moving beyond
them. Broadly understood, mobility criteria are those associated with the transit system itself, while
accessibility criteria are those associated with the utility and value of transit to riders.
With respect to an agency’s stated mission and goals, I include Handy’s criteria of the words
‘mobility’ or ‘accessibility’, but hesitate to place too much emphasis on these pieces of evidence given
the vagueness surrounding the definition of accessibility at the practitioner level. Instead, I focus on the
qualities of transit service that each mission and goals statement emphasizes. Prioritizing the performance
of the system over the degree to which the system works for users is a clear indication of a mobility
orientation. Specific mobility goals might include, for example, increasing ridership or decreasing the
amount of time users are engaged in travel. Meanwhile, goals associated with land use, destination access,
or improving the utility of transit for dependent or vulnerable riders is evidence of an accessibility
orientation.
With respect to service standards and evaluation metrics, standards and indicators that mimic
traditional level of service measurements of capacity and speed are reflections of a mobility orientation.
These include vehicle capacity, service frequency, and measures associated with the use of transit
vehicles, such as distance and coverage area. On the other hand, indicators that incorporate accessibility
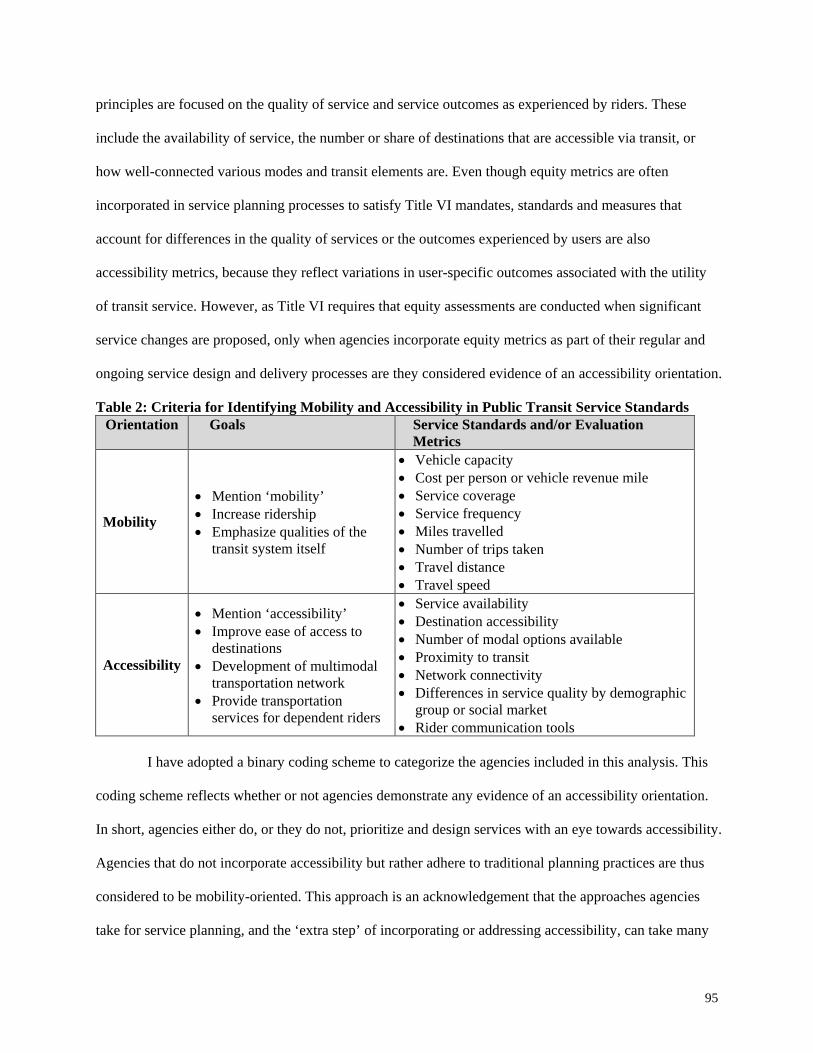
95
principles are focused on the quality of service and service outcomes as experienced by riders. These
include the availability of service, the number or share of destinations that are accessible via transit, or
how well-connected various modes and transit elements are. Even though equity metrics are often
incorporated in service planning processes to satisfy Title VI mandates, standards and measures that
account for differences in the quality of services or the outcomes experienced by users are also
accessibility metrics, because they reflect variations in user-specific outcomes associated with the utility
of transit service. However, as Title VI requires that equity assessments are conducted when significant
service changes are proposed, only when agencies incorporate equity metrics as part of their regular and
ongoing service design and delivery processes are they considered evidence of an accessibility orientation.
Table 2: Criteria for Identifying Mobility and Accessibility in Public Transit Service Standards Orientation Goals Service Standards and/or Evaluation
Metrics
Mobility
• Mention ‘mobility’ • Increase ridership • Emphasize qualities of the
transit system itself
• Vehicle capacity • Cost per person or vehicle revenue mile • Service coverage • Service frequency • Miles travelled • Number of trips taken • Travel distance • Travel speed
Accessibility
• Mention ‘accessibility’ • Improve ease of access to
destinations • Development of multimodal
transportation network • Provide transportation
services for dependent riders
• Service availability • Destination accessibility • Number of modal options available • Proximity to transit • Network connectivity • Differences in service quality by demographic
group or social market • Rider communication tools
I have adopted a binary coding scheme to categorize the agencies included in this analysis. This
coding scheme reflects whether or not agencies demonstrate any evidence of an accessibility orientation.
In short, agencies either do, or they do not, prioritize and design services with an eye towards accessibility.
Agencies that do not incorporate accessibility but rather adhere to traditional planning practices are thus
considered to be mobility-oriented. This approach is an acknowledgement that the approaches agencies
take for service planning, and the ‘extra step’ of incorporating or addressing accessibility, can take many
96
forms. Rather than establish hierarchical thresholds that rank agencies according to variations in the
means by which accessibility is prioritized and an accessibility perspective is adopted, this research seeks
to establish whether or not accessibility principles are being incorporated at all - and if so, in what ways.
The two-tiered coding scheme I have applied is therefore more than sufficient for the purposes of the
present analysis.
The second part of this analysis investigates the degree to which accessibility-based planning
practices actually matter for accessibility outcomes. A previous analysis by this author generated scores
that quantitatively indicate the relative degrees of access to destinations of opportunity – specifically,
places that offer educational, employment, and recreational opportunities – from every block-group in 12
cities nationwide, including the 9 included in the present work. Accessibility scores are aggregated across
destination type and standardized by the same method within each city so as to be comparable across
cities (see Williams 2016a for a more detailed description of the generation of these scores). To illustrate
variations in accessibility outcomes across agencies exhibiting evidence of either a mobility-based or
accessibility-based planning orientation, average accessibility scores are calculated for each city as well
as averaged across cities showing evidence of either a mobility-based or accessibility-based orientation. A
regression model is also developed that estimates block-group level scores as a function of orientation
among other factors that have been shown to affect accessibility outcomes to better understand the
localized effect of an accessibility-based planning paradigm. These factors include demographic and land
use characteristics such as the concentration of renters and zero-vehicle households, and the density of
employment. Data that reflects the socioeconomic, demographic, and land use composition of each block
group is gathered from the American Community Survey’s 2013 5-year dataset.
Findings The results of the first part of this analysis show a fair amount of variation in terms of the degree
to which public transit agencies are adopting an accessibility orientation and responding to issues of
social exclusion in their regular and routinized planning practices. Some agencies acknowledge and
97
define accessibility in their goals and mission statements, and some have incorporated accessibility
indicators in their regular service planning and evaluation processes. It is important to emphasize that
while some agencies are more comprehensive in their incorporation of accessibility principles, by no
means can any of the agencies under study be said to represent a ‘gold standard’ in this area. Rather, these
agencies have demonstrated some extent of an accessibility orientation relative to the other agencies
included in this analysis. In this sense, they demonstrate that the adoption of an accessibility orientation in
large public transit agencies is possible, even if only to a small degree. On the other hand, several
agencies included in this analysis show no evidence of an accessibility orientation whatsoever. This
means that none of the elements of the service delivery plan reflect the regular engagement of rider-
oriented outcomes, knowledge of land use patterns, flexibility around service scheduling, or accessibility-
based criteria to any measurable degree. Therefore, while some agencies do exhibit some degree of an
accessibility orientation, there is much work to be done with respect to substantively and
comprehensively engaging issues of accessibility and social exclusion at local levels in public
transportation planning.
Agencies Demonstrating Evidence of an Accessibility Orientation Five out of the nine agencies included in this analysis exhibit evidence of some degree of an
accessibility orientation: the Chicago Transit Authority (CTA); the Port Authority of Allegheny County;
serving Pittsburgh; the Southeastern Pennsylvania Transit Authority (SEPTA), serving Philadelphia; the
King County Metro Transit, serving Seattle; and the Regional Transportation District, serving Denver.
This means that these agencies show evidence of moving beyond basic mobility-oriented service
standards to address and incorporate accessibility in the everyday delivery of services. These agencies
show strengths in different areas of service planning: Pittsburgh’s Port Authority of Allegheny County is
thorough in defining and operationalizing the terms it uses to describe goals and service outcomes, while
Seattle’s King County Metro Transit has gone so far as to include an accessibility metric that parallels

98
those used in academic research. The evidence collected through this analysis strongly suggests that these
transit agencies are leading the way in terms of the incorporation of accessibility-based planning practices.
Table 3: Agencies Demonstrating Significant Evidence of an Accessibility Orientation Mission/
Goals Standards Evaluation
Metrics Chicago Transit Authority Yes Yes Yes Port Authority of Allegheny County (Pittsburgh) Yes Yes Yes Southeastern Pennsylvania Transit Authority (Philadelphia)
Yes Yes Yes
King County Metro Transit (Seattle) No Yes Yes Regional Transportation District (Denver) No Yes n/a
Mission and Goals Three out of five of these transit agencies express a strong accessibility orientation in their goals
and mission statements by acknowledging the role of transit in social and economic outcomes rather than
focusing on the state of the system itself. For example, the mission of the CTA (Chicago) is “to deliver
quality, affordable transit services that link people, jobs, and communities” (Chicago Transit Authority
2001:3), and the agency’s goals include ensuring the design of equitable transit service and responding to
“changing travel patterns and new market opportunities” (ibid:7). In Philadelphia, SEPTA’s mission
dedicates the agency to “delivering safe, reliable, sustainable, accessible, and customer-focused transit
services, contributing to the region’s economic vitality, sustainability, and enhanced quality of life”
(Southeastern Pennsylvania Public Transit Authourity 2014:5). Each of these statements acknowledges
the role of transit in achieving larger social and environmental outcomes: the CTA explicitly links transit
provision with the goal of connecting people to opportunity, and SEPTA recognizes its role in enhancing
regional planning goals.
In Pittsburgh, the Port Authority’s mission is “to provide quality transit service in a manner that is
efficient, effective, and equitable” (Port Authority of Allegheny County 2015:4). Despite the brevity of
the statement, the Port Authority is unique in explicitly defining what each of these characteristics means
to them. The way the Port Authority defines equity is particularly notable: “In order to foster widespread
mobility, the Authority shall strive to provide targeted and representative service to populations within
99
Allegheny County with a greater need for transit so as not to allow a disproportionate burden to fall upon
these populations. Operations targeting these groups should at minimum provide a proportion of services
equal or greater to that which the sub-population represents as a portion of the total population” (ibid).
Not only does the Authority implicitly acknowledge its role as the primary means for connecting people
to destinations, it defines the groups it considers most vulnerable and emphasizes the need to provide
more than standard services within these communities. The Authority even moves beyond those
populations protected by Title VI to include other social markets that are at risk for transportation
disadvantage and social exclusion.
Service Standards An accessibility orientation notwithstanding, the specific service design guidelines and standards
adhered to by transit agencies are often similar across agencies. Although specific targets and guidelines
may vary between agencies, the vast majority of agencies have defined minimum thresholds and
guidelines for elements such as service coverage, span of service, frequency of service, vehicle capacity,
and vehicle productivity. Each of these elements is reflective of mobility principles, which is expected
given the necessity of these standards for the basic delivery of service. However, the high-performing
agencies reviewed in this analysis establish operating guidelines that go beyond mobility-based elements.
The CTA (Chicago), the Port Authority (Pittsburgh), the RTD (Denver), and SEPTA
(Philadelphia) acknowledge and account for transit dependency, variations and changes in land use, and
other social and environmental factors when making service adjustments. For example, with respect to
service coverage, the CTA’s service standards document states that “Due to population and employment
shifts in the service area, CTA regularly makes adjustments in its service to reflect changing markets”
(Chicago Transit Authority 2001:12). The CTA further notes that “Routes are designed to operate as
directly as possible”, but that “there are times when a route deviation is recommended to bring service
closer to a major trip generator such as an employer” (ibid:13). Similarly in Pittsburgh, the Port
Authority’s standards include the caveat that “routes should operate along pathways that connect the

100
greatest number of people to the greatest number of destinations, so as to carry out the mission of the
Authority with the greatest effect” (Port Authority of Allegheny County 2015:7). Another Port Authority
guideline is to minimize route deviations, but the Authority acknowledges that “there are many instances
when the deviation of service off of the most direct route is appropriate, for example to provide service to
major shopping centers, employment sites, schools, etc.” (ibid).
Seattle’s King County Metro Transit Authority defines fewer service guidelines than other
agencies, but makes the most robust commitment to accessibility in its initial design of services. In King
County, transit service is implemented and distributed based on three factors: the number of households
and jobs in areas near proposed service, the share of “historically disadvantaged” populations near
proposed service, and land use factors. According to the service standards document, “These factors give
Metro a way to take into account the elements that make transit successful as well as the populations and
areas that must be served to support social equity and deliver geographic value” (King County Metro
Transit 2015:3). Incorporating knowledge and measures of who would benefit and what the utility of the
service would be in providing access to jobs is a clear reflection of accessibility principles. Planners are
focusing on what the potential outcomes could be to both riders and the economy at-large.
Denver’s RTD includes a ‘Standard for Service for Transit-Dependent Persons and to Social
Service Destinations’. In practice, this standard reduces the thresholds on other standards in order to
ensure services are provided to transit-dependent people and key resource-based destinations even when
technical expectations are not being met. But unlike other agencies, the RTD offers a definition to clarify
who they consider to be transit-dependent as “riders who either live in a household which does not own a
car or who have a physical or mental disability that prevents the transit patron from driving a car”
(Regional Transportation District 2002:16). Social Service destinations are also defined, as “those
destinations that are provided as a public service that may not have consistently sufficient ridership to
otherwise warrant the establishment or continuation of a route or route segment” (ibid). Examples include
courthouses, hospital, schools, and other public institutions. While the RTD clarifies that this standard
does not guarantee a minimum level of service to these patrons, the agency includes this standard to
101
ensure that regardless of technical efficiency, transit service exists for these patrons and to or from these
destinations.
Service Evaluation In terms of ongoing service assessment practices, many of the agencies included in this analysis
(who are doing well on accessibility and otherwise) evaluate performance in terms of how well the actual
delivery of services match the predetermined thresholds that are established as service standards. For
example, the Port Authority (Pittsburgh) evaluates the equity of transit services by measuring the
proportion of transit trips and the percent of the total transit service area that serves low-income and
minority populations. However, some agencies extend their evaluation to include elements for which no
service standards have been established. The CTA (Chicago) has established ‘primary’ and ‘secondary’
criteria through which to evaluate proposed service changes, including expansions and reductions.
Although each primary criterion is a reflection of mobility-based planning principles (measuring net cost
per passenger, fare revenue, and effects on service coverage), several secondary criteria do incorporate
accessibility, including key characteristics of the existing market and the contribution of each service
change to policy objectives.
The King County Metro Transit (Seattle) agency is one of the most advanced in terms of its
incorporation of accessibility principles, and nowhere is this better evidenced than in the measures the
agency uses to evaluate progress towards meeting its stated goals, objectives, and strategies (2015).
Progress towards the agency’s Human Potential goal (which seeks to “provide equitable opportunities for
people from all areas of King County to access the public transportation system”) evaluation metrics
include the population and number of jobs within ¼ mile walk to a transit stop, the percent of households
in low-income and low-income areas within ¼ mile walk to transit, and the average number of jobs and
households accessible within 30 minutes countywide by social group (ibid:6). Each of these measures is
an explicit acknowledgement of the utility and convenience of transit to riders. The last measure – the
number of jobs and households within 30 minutes via transit - is an accessibility indicator in its truest
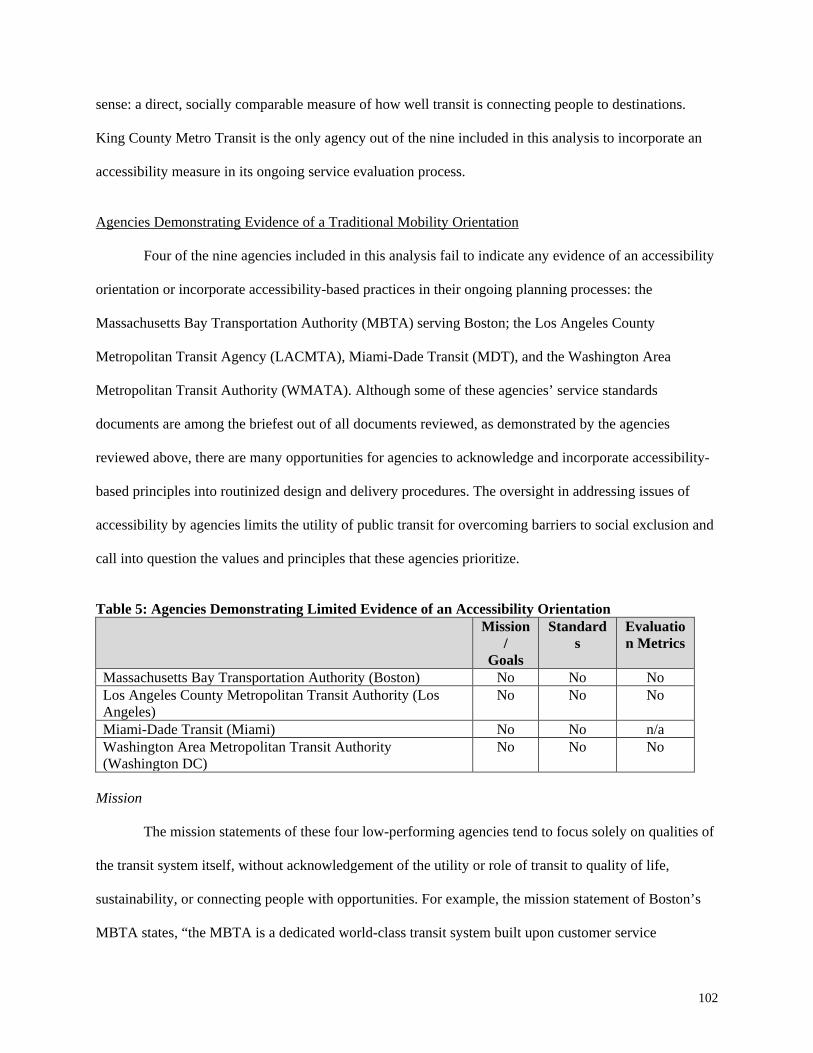
102
sense: a direct, socially comparable measure of how well transit is connecting people to destinations.
King County Metro Transit is the only agency out of the nine included in this analysis to incorporate an
accessibility measure in its ongoing service evaluation process.
Agencies Demonstrating Evidence of a Traditional Mobility Orientation Four of the nine agencies included in this analysis fail to indicate any evidence of an accessibility
orientation or incorporate accessibility-based practices in their ongoing planning processes: the
Massachusetts Bay Transportation Authority (MBTA) serving Boston; the Los Angeles County
Metropolitan Transit Agency (LACMTA), Miami-Dade Transit (MDT), and the Washington Area
Metropolitan Transit Authority (WMATA). Although some of these agencies’ service standards
documents are among the briefest out of all documents reviewed, as demonstrated by the agencies
reviewed above, there are many opportunities for agencies to acknowledge and incorporate accessibility-
based principles into routinized design and delivery procedures. The oversight in addressing issues of
accessibility by agencies limits the utility of public transit for overcoming barriers to social exclusion and
call into question the values and principles that these agencies prioritize.
Table 5: Agencies Demonstrating Limited Evidence of an Accessibility Orientation Mission
/ Goals
Standards
Evaluation Metrics
Massachusetts Bay Transportation Authority (Boston) No No No Los Angeles County Metropolitan Transit Authority (Los Angeles)
No No No
Miami-Dade Transit (Miami) No No n/a Washington Area Metropolitan Transit Authority (Washington DC)
No No No
Mission The mission statements of these four low-performing agencies tend to focus solely on qualities of
the transit system itself, without acknowledgement of the utility or role of transit to quality of life,
sustainability, or connecting people with opportunities. For example, the mission statement of Boston’s
MBTA states, “the MBTA is a dedicated world-class transit system built upon customer service
103
excellence, accessibility, reliability, state-of-the-art technology, and a diverse workforce that reflects our
commitment to the communities we serve” (Massachusetts Bay Transportation Authority 2010:3); Miami
Dade Transit’s mission is “to meet the needs of the public for the highest quality transit service: safe,
reliable, efficient, and courteous” (ibid); and LACMTA (Los Angeles) defines their mission as being
“responsible for the continuous improvement of an efficient and effective transportation system that is
sustainable for Los Angeles County” (Los Angeles County Metropolitan Transportation Authority
2015:10). These statements suggest that rather than being oriented towards the purpose and utility of
transit service, these agencies establish their mission as oriented towards the system itself. Among these
agencies, system performance is the penultimate task of transit planning. Although a high performance
system may be more effective in the delivery of services, the emphasis is on maximizing the capacity of
vehicles and infrastructure rather than on riders or the actual utility of the system. These agencies also
largely fail to include definitions of what ‘efficient’, ‘effective’, or ‘reliable’ means in practice or how
these qualities are realized through goals and outcomes.
Service Standards Like the high-performing agencies reviewed above, the specific service standards that each
agency has established as valuable for their service delivery are often consistent in form and in reflecting
mobility-based planning principles. However, unlike the more advanced agencies, the MBTA, LACTMA,
MDT, and WMATA fail to go beyond mobility-based standards to additionally address and incorporate
accessibility-oriented service guidelines and delivery standards. For example, Miami’s MDT lists six
service standards that guide service delivery: route design, schedule design, service delivery, passenger
comfort and safety, and route performance and productivity (Miami-Dade Transit 2009). These standards
again define specific delivery thresholds and guidelines, including how far apart bus stops should be, on-
time performance requirements, and the anticipated net cost per passenger. LACMTA’s service design
guidelines are more comprehensive, and include standards for vehicle headways, frequencies, passenger
loading ratios, route alignment, bus route length, and span of service (Los Angeles County Metropolitan
104
Transportation Authority 2015). On the other hand, the Washington, DC-area’s WMATA describes just
three service-specific guidelines: hours of service, headways, and passengers-per-car (aka vehicle load)
(Washington Metropolitan Area Transit Authority 2015).
The service standards defined here are focused solely on the efficiency of vehicles moving
through the transit network. Although some agencies, notably LACMTA in LA and MDT in Miami,
allow for bus route deviation in consideration of new land uses that might benefit from transit service, this
deviation is only allowed when the net ‘cost’ of the deviation is 5 minutes or less (Los Angeles County
Metropolitan Transportation Authority 2015; Miami-Dade Transit 2009). This caveat reduces the
applicability of the flexibility rule as well as the utility or impact on tangible rider experiences.
In the context of evidence collected from high-performing agencies, there are many missed
opportunities in this set of service standards documents for agencies to expand protocols and strategies to
address accessibility. Some are more obvious than others. For example, in explaining how the agency
weighs whether or not to design or redesign a bus route, the MDT service standards document indicates
that employment and transit dependency are factors that are taken into consideration. However, the
document does not offer any indication as to how these considerations are made, or what thresholds must
be met in order to establish new or changed services. DC’s WMATA system also fails to make direct
connections between its stated goals and the means by which the agency defines and evaluates services.
One of WMATA’s stated goals is to “improve regional mobility and connect communities”, but as
demonstrated above, none of the service standards (that double as evaluation metrics) that WMATA
describes indicate any attention whatsoever is paid to connectivity, rider outcomes, or the degree to which
transit can be used to access destinations.
Service Evaluation
The failure to incorporate accessibility-based principles into service design guidelines and
delivery standards lays the groundwork for the oversight of these elements as evaluation metrics. If
accessibility has not been incorporated to this point as either a stated goal or a defining element of an
105
agency’s service delivery and distribution, it is unlikely that agencies would address accessibility-based
elements as performance indicators. For example, evaluation of WMATA (Washington, DC) and MBTA
(Boston) is primarily a reflection of how well the agency’s actual delivery of services stacks up against its
predefined service standards. In the MBTA, there are two levels to the service planning process, one that
is continual and ongoing, and another that is in response to the need to update the Service Standards
themselves. Changes to MBTA services are considered by evaluating the impacts of potential service
adjustments in terms of average cost per passenger, changes in ridership, or effects on travel time, for
example. In each of these low-performance agencies, the vast majority of the criteria used to assess and
update services are reflections of mobility values.
Unlike other agencies, the service design and routing guidelines established by LACMTA (Los
Angeles) are not the same qualities by which services are evaluated. Instead, after services have been
planned and designed, a separate set of service performance indicators are used to evaluate service
performance. These evaluation measures include availability, quality, quantity, and effectiveness. Quality
is measured through on-time performance and the number of customer complaints; quantity is measured
in terms of headway standards, service frequency, and passenger loading; and effectiveness is measured
through boardings per service hour, cost per passenger mile, passengers per seat mile, and the ‘route
performance index’ - a score that reflects per-passenger monetary return on investment. As they are
measures of how well the system performs as a means of the base potential for movement, each of these
measures are mobility-oriented. Accessibility is included as one indicator of service availability, but upon
closer inspection, is more of a coverage standard requiring that service must be provided within one-
quarter mile of 99% of all Census tracts in the service area. An additional evaluative metric that measures
connectivity is in many respects a reflection of accessibility-oriented practices because ensuring
alignment between services works to maximize the efficiency of the system with respect to ultimate
destination access. However, given the comprehensive nature of the LACTMA (Los Angeles) document
and the separation of evaluation indicators from service standards, the agency has neglected to
incorporate accessibility in its overall evaluation process despite a plethora of promising opportunities.
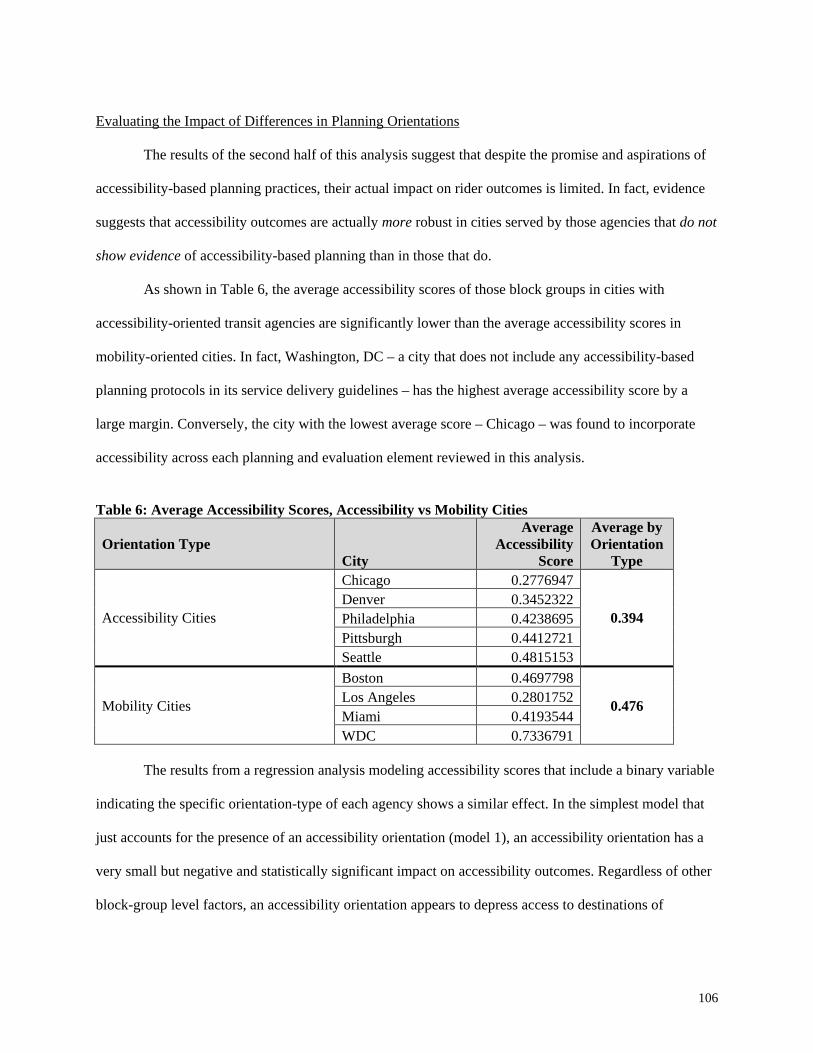
106
Evaluating the Impact of Differences in Planning Orientations The results of the second half of this analysis suggest that despite the promise and aspirations of
accessibility-based planning practices, their actual impact on rider outcomes is limited. In fact, evidence
suggests that accessibility outcomes are actually more robust in cities served by those agencies that do not
show evidence of accessibility-based planning than in those that do.
As shown in Table 6, the average accessibility scores of those block groups in cities with
accessibility-oriented transit agencies are significantly lower than the average accessibility scores in
mobility-oriented cities. In fact, Washington, DC – a city that does not include any accessibility-based
planning protocols in its service delivery guidelines – has the highest average accessibility score by a
large margin. Conversely, the city with the lowest average score – Chicago – was found to incorporate
accessibility across each planning and evaluation element reviewed in this analysis.
Table 6: Average Accessibility Scores, Accessibility vs Mobility Cities
Orientation Type City
Average Accessibility
Score
Average by Orientation
Type
Accessibility Cities
Chicago 0.2776947
0.394 Denver 0.3452322 Philadelphia 0.4238695 Pittsburgh 0.4412721 Seattle 0.4815153
Mobility Cities
Boston 0.4697798
0.476 Los Angeles 0.2801752 Miami 0.4193544 WDC 0.7336791
The results from a regression analysis modeling accessibility scores that include a binary variable
indicating the specific orientation-type of each agency shows a similar effect. In the simplest model that
just accounts for the presence of an accessibility orientation (model 1), an accessibility orientation has a
very small but negative and statistically significant impact on accessibility outcomes. Regardless of other
block-group level factors, an accessibility orientation appears to depress access to destinations of
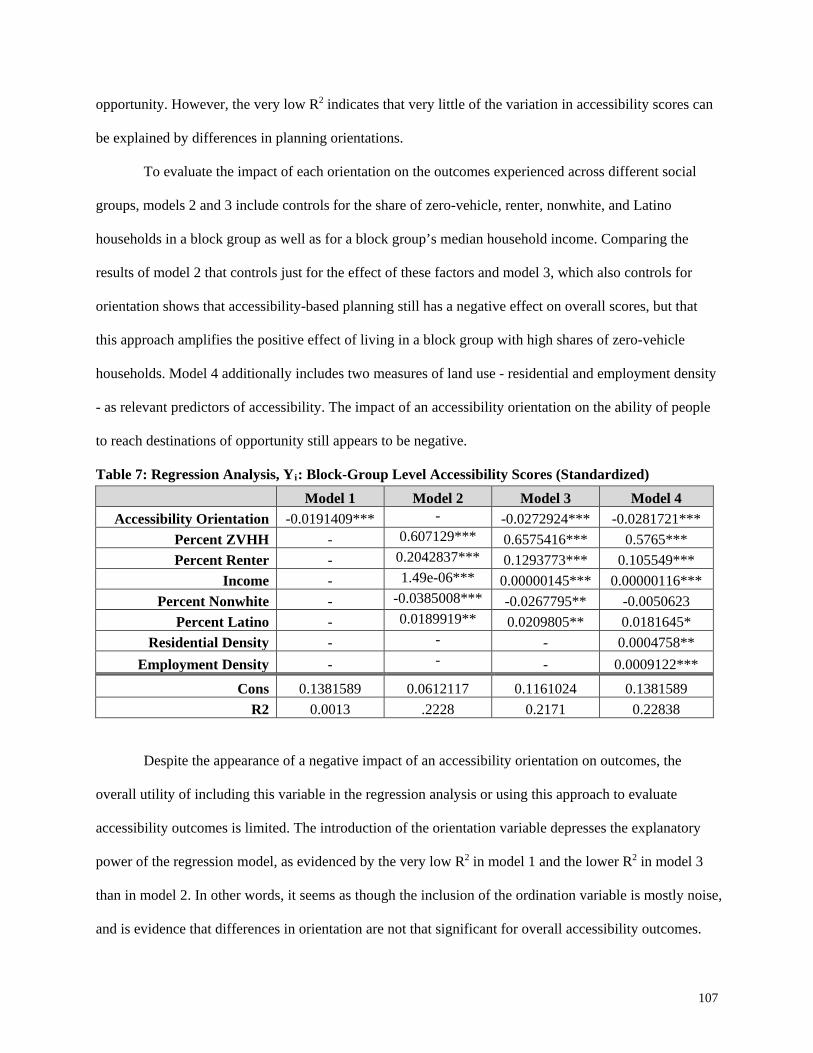
107
opportunity. However, the very low R2 indicates that very little of the variation in accessibility scores can
be explained by differences in planning orientations.
To evaluate the impact of each orientation on the outcomes experienced across different social
groups, models 2 and 3 include controls for the share of zero-vehicle, renter, nonwhite, and Latino
households in a block group as well as for a block group’s median household income. Comparing the
results of model 2 that controls just for the effect of these factors and model 3, which also controls for
orientation shows that accessibility-based planning still has a negative effect on overall scores, but that
this approach amplifies the positive effect of living in a block group with high shares of zero-vehicle
households. Model 4 additionally includes two measures of land use - residential and employment density
- as relevant predictors of accessibility. The impact of an accessibility orientation on the ability of people
to reach destinations of opportunity still appears to be negative.
Table 7: Regression Analysis, Yi: Block-Group Level Accessibility Scores (Standardized)
Despite the appearance of a negative impact of an accessibility orientation on outcomes, the
overall utility of including this variable in the regression analysis or using this approach to evaluate
accessibility outcomes is limited. The introduction of the orientation variable depresses the explanatory
power of the regression model, as evidenced by the very low R2 in model 1 and the lower R2 in model 3
than in model 2. In other words, it seems as though the inclusion of the ordination variable is mostly noise,
and is evidence that differences in orientation are not that significant for overall accessibility outcomes.
Model 1 Model 2 Model 3 Model 4 Accessibility Orientation -0.0191409*** - -0.0272924*** -0.0281721***
Percent ZVHH - 0.607129*** 0.6575416*** 0.5765*** Percent Renter - 0.2042837*** 0.1293773*** 0.105549***
Income - 1.49e-06*** 0.00000145*** 0.00000116*** Percent Nonwhite - -0.0385008*** -0.0267795** -0.0050623
Percent Latino - 0.0189919** 0.0209805** 0.0181645* Residential Density - - - 0.0004758**
Employment Density - - - 0.0009122***
Cons 0.1381589 0.0612117 0.1161024 0.1381589 R2 0.0013 .2228 0.2171 0.22838
108
Discussion and Conclusions The first major finding of this analysis is that although some agencies demonstrate evidence of
accessibility planning, its incorporation is far from widespread. Additionally, those agencies that are
addressing issues of accessibility are often doing so in a piecemeal rather than comprehensive fashion.
While nods to accessibility outcomes are made here and there, there is scant acknowledgement of the
connections between the stated mission and/or goals of agencies, and the service standards and evaluation
metrics that are so critical for service delivery. While King County Metro Transit is advanced in its use of
an accessibility indicator to measure system performance, the agency fails to establish accessibility as a
goal of service. Likewise, although the CTA regularly updates its services to accommodate evolving land
use and development initiatives, the means by which system performance is assessed is almost
exclusively in terms of mobility outcomes.
The second major finding of this analysis is that local accessibility outcomes do not appear to be
robustly affected by transportation-based planning practices. In fact, accessibility is not only associated
with a lower overall accessibility score, the adoption of an accessibility orientation was shown to depress
accessibility outcomes. Clearly, accessibility-based planning – at least in the manner in which the cities in
this analysis have adopted these approaches – is not a silver bullet that will uniformly lead to strong
accessibility outcomes. However, the findings of this research also do not invalidate the effectiveness of
accessibility-based planning approaches. In the first place, many of these policies are likely still evolving.
The adoption of many of these planning strategies and guidelines is recent, and it is possible that it will
take time for the observed impacts of these policies to fully manifest themselves. Just because the
trajectory of these policies and accessibility outcomes are not moving together right now does not mean
they will not be ultimately impactful.
In many respects, these results should be encouraging for accessibility planning advocates.
Documents gathered from five out of nine large public transportation agencies do suggest that some
agencies are paying attention to accessibility-based issues in their regular design and planning procedures.
109
The evidence that has been gathered also can also serve as examples of how accessibility can be actively
incorporated and even emphasized as not only an agency goal, but as a service standard and as a
performance metric. These results are simultaneously encouraging for advocates of socially inclusive
public policies and for those working to develop pathways through barriers of social exclusion. Although
their impact is unclear, measures designed to improve and maximize accessibility within transit agencies
are important steps for ensuring the goals of transit as a public good are met and for acknowledging the
role of transit as an institutional mediator of social exclusion.
The findings of this work present many fruitful opportunities for future research. It is important to
note that accessibility-based planning does not comprise one cohesive or comprehensive set of metrics,
standards, or strategies. Rather, accessibility-based planning approaches can take many shapes and forms.
Each city that was found to show evidence of accessibility-based planning addressed issues of
accessibility in different ways. Perhaps the next logical research direction involves developing a detailed
typology or catalog of the various approaches identified as engaging accessibility. Once the universe of
practices is identified, the dimensions by which these strategies impact accessibility can be more clearly
ascertained and described. This analysis could be expanded to include more cities and adopt additional
approaches and methodologies to collecting and evaluating local transportation planning practices. The
assigned orientations of two of the cities included in this analysis are based on documents that are over a
decade old, and it is not only possible but it is likely that the delivery standards and guidelines developed
by these agencies will be updated soon.
Just as there is no one ‘right’ way to incorporate accessibility, there is no ‘right’ way to deliver
public transit service. Different places have different shapes, topographies, densities, needs, and
transportation cultures that each likely impact variations in people’s ability to travel to places. However, it
is important to ensure that the utility of public transit service is fully realized, and done so in a way that
allows people access to opportunities rather than restricting their movement. Transportation disadvantage
and the lack of reliable and high-quality transit services that take people to the places they need or want to
go is a significant driver of social exclusion, and ensuring high-quality, destination-rich public transit
110
service is available is not only a reasonable ask of a public agency, but a social policy that promotes
equity and engagement. The accessibility planning and social exclusion research communities should
more fully recognize and emphasize the consistencies between their goals and priorities and opportunities
for collaboration in order to advance shared goals and amplify the call for robust, outcome-oriented, and
socially comprehensive transportation planning practices.
111
References Berdica, Katja. 2002. “An Introduction to Road Vulnerability: What Has Been Done, Is Done and Should
Be Done.” Transport Policy 9(2):117–27.
Blumenberg, Evelyn, and Paul Ong. 2001. “Cars, Buses, and Jobs: Welfare Participants and Employment Access in Los Angeles.” Transportation Research Record (1756):22–31.
Cervero, Robert. 1997. “Paradigm Shift: From Automobility to Accessibility Planning.” Urban Futures: Issues for Australian cities (Issue 22):9–20.
Cervero, Robert. 2005. “Accessible Cities and Regions: A Framework for Sustainable Transport and Urbanism in the 21st Century.” Working paper-UC Berkeley Centre for Future Urban Transport-A Volvo Center of Excellence, Institute of Transportation studies, University of California, Berkeley. (August). Retrieved (http://repositories.cdlib.org/its/future urban transport/vwp-2005-3).
Chicago Transit Authority. 2001. “Chicago Transit Authority Service Standards.” Retrieved (http://www.transitchicago.com/assets/1/miscellaneous_documents/servicestandards129737.pdf).
Church, a., M. Frost, and K. Sullivan. 2000. “Transport and Social Exclusion in London.” Transport Policy 7(3):195–205.
Clifton, Kelly, and Karen Lucas. 2004. “Examining the Empirical Evidence of Transport Inequality in the US and UK.” Pp. 15–38 in Running on empty: Transport, social exclusion, and environmental justice, edited by Karen Lucas. Bristol: The Policy Press.
Coppola, Pierluigi, and Enrica Papa. 2013. “Accessibility Planning Tools for Sustainable and Integrated Land Use/Transport (LUT) Development: An Application to Rome.” Procedia - Social and Behavioral Sciences 87:133–46.
Duranton, Gilles, and Matthew A. Turner. 2011. “The Fundamental Law of Road Congestion: Evidence from US Cities.” American Economic Review 101(6):2616–52.
Ewing, Reid. 1993. “Transportation Service Standards - As If People Matter.” Transportation Research Record 1400:10–17.
Ewing, Reid. 1995. “Measuring Transportation Performance.” Transportation Quarterly 49(1):91–104.
Fan, Yingling, Andrew E. Guthrie, and David M. Levinson. 2012. “Impact of Light Rail Implementation on Labor Market Accessibility: A Transportation Equity Perspective.” Journal of Transport and Land Use 5(3):28–39.
Ganning, Joanna. 2014. Accessibility-Based Transportatoin Planning: Literature and Application for Shrinking Cities. Washington, DC.
Geurs, Karst T., and Bert van Wee. 2004. “Accessibility Evaluation of Land-Use and Transport Strategies: Review and Research Directions.” Journal of Transport Geography 12(2):127–40.
Giuliano, Genevieve. 2003. “Travel, Location and Race/ethnicity.” Transportation Research Part A: Policy and Practice 37:351–72.
Giuliano, Genevieve. 2005. “Low Income, Public Transit, and Mobility.” Transportation Research Record: Journal of the Transportation Research Board 1927:63–70.
112
Giuliano, Genevieve, Hsi-Hwa Hu, and Kyoung Lee. 2001. The Role of Public Transit in the Mobility of Low-Income Households. Los Angeles, CA. Retrieved (https://www.metrans.org/sites/default/files/research-project/99-11_Final_0_0.pdf).
Handy, Susan. 2005. “Planning for Accessibility: In Theory and In Practice.” Pp. 131–47 in Access to Destinations, edited by David Levinson and Kevin J. Krizek. Burlington, MA: Elsevier Ltd.
Handy, Susan. 2015. Increasing Highway Capacity Unlikely to Relieve Traffic Congestion. Davis, CA. Retrieved September 19, 2016 (http://www.dot.ca.gov/newtech/researchreports/reports/2015/10-12-2015-NCST_Brief_InducedTravel_CS6_v3.pdf).
Handy, Susan L. 2002. “Accessibility- vs. Mobility-Enhancing Strategies for Addressing Automobile Dependence in the U.S.” Institute of Transportation Studies. Retrieved (http://www.des.ucdavis.edu/faculty/handy/ECMT_report.pdf).
Handy, Susan L., and Debbie A. Niemeier. 1997. “Measuring Accessibility: An Exploration of Issues and Alternatives.” Environment and Planning A 29(7):1175–94.
Hine, Julian, and Fiona Mitchell. 2001. “Better for Everyone? Travel Experiences and Transport Exclusion.” Urban Studies 38(2):319–32.
King County Metro Transit. 2015. “Strategic Plan for Public Transportation 2011-2021.” Retrieved (http://metro.kingcounty.gov/planning/pdf/KCMTStratPlan_2013_Update_LR.pdf).
Koenig, J. G. 1980. “Indicators of Urban Accessibility: Theory and Application.” Transportation (9):145–72.
Levine, Jonathan, and Yaakov Garb. 2002. “Congestion Pricing’s Conditional Promise: Promotion of Accessibility or Mobility?” Transport Policy 9(3):179–88.
Levine, Jonathan, Joe Grengs, Qingyun Shen, and Qing Shen. 2012. “Does Accessibility Require Density or Speed?” Journal of the American Planning Association 78(2):157–72.
Levine, Jonathan, Joe Grengs, Quingyun Shen, and Qing Shen. 2012. “Does Accessibility Require Density or Speed?” Journal of the American Planning Association 78(2):157–72.
Levinson, David, Kevin J. Krizek, and David Gillen. 2005. “The Machine for Access.” Pp. 1–10 in Access to Destinations, edited by David Levinson and Kevin J. Krizek. Burlington, MA: Elsevier Ltd.
Litman, Todd. 2013. “The New Transportation Planning Paradigm.” ITE Journal (Institute of Transportation Engineers) 83(6):20–28.
Litman, Todd. 2015. Evaluating Accessibility for Transportation Planning: Measuring People’s Ability to Reach Desired Goods and Activities. Victoria, British Columbia. Retrieved March 1, 2015 (http://www.vtpi.org/access.pdf).
Litman, Todd. 2016. Generated Traffic and Induced Travel: Implications for Transport Planning Generated Traffic: Implications for Transport Planning. Victoria, British Columbia. Retrieved September 19, 2016 (http://www.vtpi.org/gentraf.pdf).
Los Angeles County Metropolitan Transportation Authority. 2015. “Transit Service Policy.” Retrieved (http://media.metro.net/images/service_changes_transit_service_policy.pdf).
113
Lucas, Karen. 2004a. “Locating Transport as a Social Policy Problem.” Pp. 7–14 in Running on empty: Transport, social exclusion, and environmental justice, edited by Karen Lucas. Bristol: The Policy Press.
Lucas, Karen. 2004b. “Transport and Social Exclusion.” Pp. 39–54 in Running on empty: Transport, social exclusion, and environmental justice, edited by Lucas. Bristol: The Polity Press.
Lucas, Karen. 2012. “Transport and Social Exclusion: Where Are We Now?” Transport Policy 20:105–13.
Madanipour, Ali. 1998. “Social Exclusion and Space.” The City Reader 158–65.
Martens, Karel. 2006. “Basing Transport Planning Principles on Social Justice.” Berkeley Planning Journal 19(1).
Martens, Karel. 2015. “Accessibility and Potential Mobility as a Guide for Policy Action.” Transportation Research Record: Journal of the Transportation Research Board 2499:18–24.
Massachusetts Bay Transportation Authority. 2010. “Service Delivery Policy.” Retrieved (http://mbta.com/uploadedfiles/About_the_T/T_Projects/T_Projects_List/2010ServiceDeliveryPolicy.pdf).
Miami-Dade Transit. 2009. “Service Standards.” Retrieved (https://www.miamidade.gov/transit/library/service_standards_dec_09.pdf).
Miller, Harvey J., and Yi-Hwa Wu. 2000. “GIS Software for Measuring Space-Time Accessibility in Transportation Planning and Analysis.” GeoInformatica 4(2):141–59.
Papa, Enrica, Cecilia Silva, Marco Te Brömmelstroet, and Angela Hull. 2015. “Accessibility Instruments for Planning Practice: A Review of European Experiences.” Journal of Transport and Land Use 1–20.
Port Authority of Allegheny County. 2015. “Transit Service Guidelines.” Retrieved (http://www.portauthority.org/PAAC/Portals/1/PDFs/ServiceGuidelines_Draft.pdf).
Pucher, J., and J. L. Renne. 2003. “Socioeconomics of Urban Travel: Evidence from the 2001 NHTS.” Transportation Quarterly 57(3):49–77.
Puentes, Robert. 2015. “Rethinking Urban Traffic Congestion to Put People First.” Brookings Institution: Washington, DC. Retrieved (https://www.brookings.edu/blog/the-avenue/2015/08/27/rethinking-urban-traffic-congestion-to-put-people-first/)
Puentes, Robert, and Adie Tomer. 2011. Transit Access and Zero Vehicle Households. Brookings Institution: Washington, D.C. Retrieved (https://www.brookings.edu/wp-content/uploads/2016/06/0818_transportation_tomer.pdf)
Regional Transportation District. (2002). "Service Standards." Retrieved (http://www.rtd-denver.com/documents/serviced/service-standards-12-2002.pdf)
Root, Amanda, ed. 2003. Delivering Sustainable Transport. Somerville, MA: Emerald Group Publishing.
Salomon, Ilan, and Patricia L. Mokhtarian. 1998. “What Happens When Mobility-Inclined Market Segments Face Accessibility-Enhancing Policies?” Transportation Research Part D: Transport and
114
Environment 3(3):129–40.
Silver, Hilary, and S. M. Miller. 2003. “Social Exclusion: The European Approach to Social Disadvantage.” Indicators 2(2):1–17.
Southeastern Pennsylvania Public Transit Authourity. 2014. “Service Standards and Process.” Retrieved (http://septa.org/strategic-plan/reports/service-standards-2014.pdf).
Squires, Gregory D. 2002. Urban Sprawl: Causes, Consequences, & Policy Responses. Washingoton, DC: Urban Institute Press.
Squires, Gregory, and Charis Kubrin. 2005. “Privileged Places: Race, Uneven Development and the Geography of Opportunity in Urban America.” Urban Studies 42(1):47–68.
Stanley, Janet, and Dianne Vella-Brodrick. 2009. “The Usefulness of Social Exclusion to Inform Social Policy in Transport.” Transport Policy 16(3):90–96.
Ureta, Sebastian. 2008. “To Move or Not to Move? Social Exclusion, Accessibility and Daily Mobility among the Low-Income Population in Santiago, Chile.” Mobilities 3(2):269–89.
Wachs, Martin, and T.Gordo. Kumagai. 1973. “Physical Accessibility as a Social Indicator.” Socio-Economic Planning Sciences 7(5):437–56.
Walker, Jarrett. 2008. “Purpose-Driven Public Transport: Creating a Clear Conversation About Public Transport Goals.” Journal of Transport Geography 16(6):436–42.
Walker, Jarrett. 2011. Human Transit: How Clearer Thinking about Public Transit Can Enrich Our Communities and Our Lives. Washington, D.C.: Island Press.
Washington Metropolitan Area Transit Authority. 2015. “Vital Signs Report.” Retrieved (http://www.wmata.com/about_metro/scorecard/documents/Vital_Signs_Report_Q4_2014.pdf).
van Wee, Bert, and Karst Geurs. 2011. “Discussing Equity and Social Exclusion in Accessibility Evaluations.” European Journal of Transport and Infrastructure Research 11(4):350–67.
Whitelegg, John. 1997. Critical Mass: Transport, Environment and Society in the Twenty-First Century. London: Pluto Press.