Embed Size (px)
Citation preview
DECEMBER 2000
ASSOCIATION OF BAY AREA GOVERNME
AirpB
Eart
Don’tWing
It
NTS
orts anday Areahquakes
i
Using Airport Vulnerability Data and Response Capability toImprove Planning for Post-Earthquake Transportation Disruptions
in the San Francisco Bay Region
DECEMBER 2000
ASSOCIATION OF BAY AREA GOVERNMENTSMailing Address: P.O. Box 2050 -- Oakland, CA 94604-2050
Location: Joseph P. Bort MetroCenter -- Eighth and Oak Streets -- OaklandPhone: (510) 464-7900 -- Fax: (510) 464-7979
Internet Access through abagOnline at http://quake.abag.ca.gov
Publication Number: P00002EQK
Don’t Wing ItAirports and Bay Area
Earthquakes
ii
CREDITS ...Report Authors:
Jeanne B. Perkins – Earthquake Program Manager, Association of Bay Area Governments
ABAG Technical Assistance:William Lettis & Associates – Keith Knudsen, John Baldwin, and Jeff BachhuberKathleen Mikulis – Regional Planner, Association of Bay Area GovernmentsPatricia R. Perry – Senior Regional Planner, Association of Bay Area Governments
ABAG Management:Eugene Y. Leong -- Executive Director
Acknowledgements:
The description of the vulnerability of airport runways draws from a report prepared by William Lettis &Associates, particularly Keith Knudsen, John Baldwin and Jeff Bachhuber.
The research, writing, and production of this report and planning effortEarthquake Hazards Reduction Program of the Federal Aviation AdminMetropolitan Transportation Commission, as well as by the Associationfindings, conclusions or recommendations expressed in this material are treflect the views of the funding agencies.
MTC TRANSPORTATIONCOMMISSION
ASSOCIATION
METROPOLITAN
was supported, in part, by the Nationalistration (FAA), through funding from the of Bay Area Governments. Any opinions,
hose of the authors and do not necessarily
ABAG OF BAY AREAGOVERNMENTS
iii
TABLE OF CONTENTS ...Background and Objectives
Findings – Earthquakes and Airports
The Issue – Why Worry About Airport Disruptions Following Future Earthquakes in the Bay Area?
Past Earthquakes – What Happened Last Time?1989 Loma Prieta Earthquake1994 Northridge Earthquake1995 Kobe, Japan Earthquake1999 Turkey Earthquake1999 Taiwan Earthquake
The Airport System – How Does It Operate?
The Vulnerabilities – What Problems Do We Expect?ISSUE 1 - Liquefaction Damage to Airport RunwaysISSUE 2 - Structural Damage to Air Control and Terminal FacilitiesISSUE 3 - Power and Communications DisruptionsISSUE 4 - Disruptions to the Transportation System Serving the Airports
The Airport System in an Emergency – What Are Our Current Procedures?Federal Aviation Administration (FAA)Bay Area International AirportsGeneral Aviation AirportsOut-of-Region Airports
Travis Air Force Base Air Cargo Carriers Airline Passenger Carriers Bay Area Red Cross and Other Disaster Service Providers Business Users
Ideas for Action – How Can We Better Plan?
REFERENCES
APPENDIX A – Table – Runway Information for AirportsAPPENDIX B – Table – Airport Liquefaction Hazard and Access Vulnerability
PageIv
1
2
3 35678
9
1212192020
22222223232424252526
27
29
3036
iv
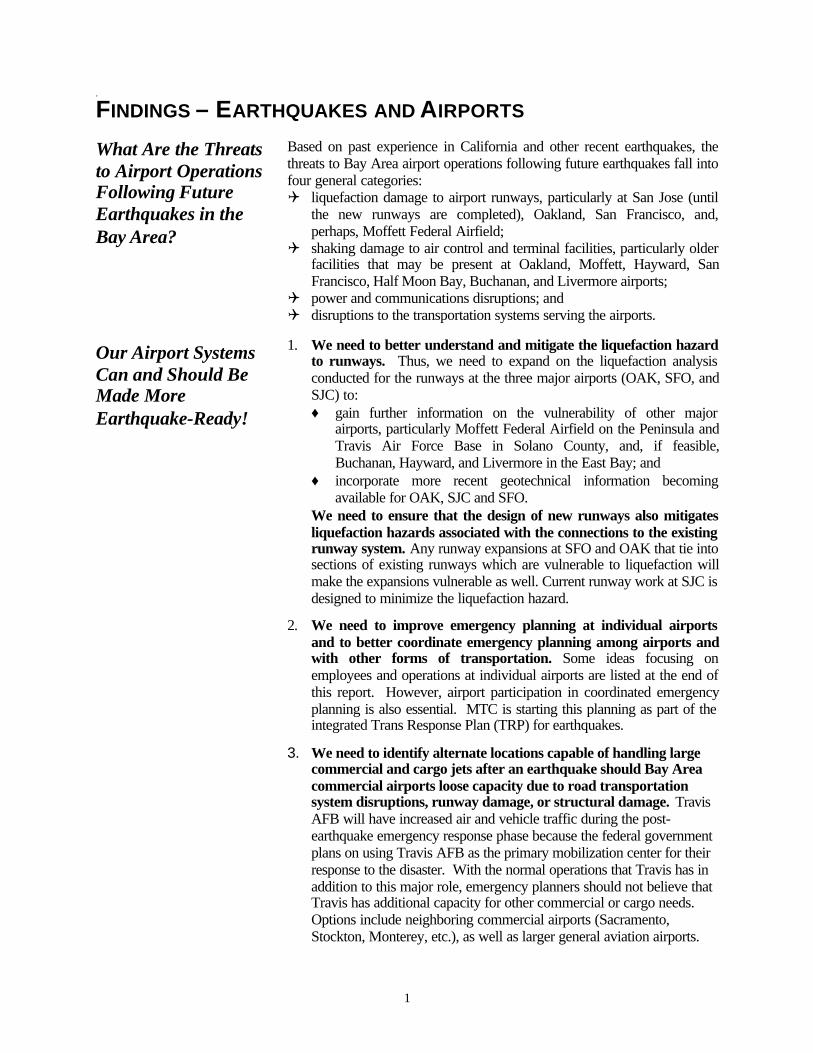
BACKGROUND AND OBJECTIVES ...These materials build on two reports on thevulnerability of the region’s transportationsystem to earthquakes published by ABAG –! Riding Out Future Quakes – October 1997! Riding Out Future Quakes – Ideas for
Action – March 1999
The Riding Out Future Quakes project wasinitiated by ABAG and Caltrans following theNorthridge and Loma Prieta earthquakes. Welearned that we need our transportation systems tobe functional after earthquakes for two principalreasons:! Emergency responders need to use transportation
systems, including airports, after earthquakes.! Transportation system disruptions, including
disruptions to airports, can have a severe impact ona region’s economy for months, if not years.
As a second step in the planning process, ABAGheld a series of five subregional workshopsdiscussing hypothetical road and rail closuresresulting from selected scenario earthquakes inOctober and November 1998. “Tabletop”disaster drills and extensive discussion led toidentification of the major issues, interagencydependencies, and areas of potential conflictlikely to face transportation providers,governments, utilities and businesses as theystruggle to address the transportation impactsafter a large earthquake. The Riding Out FutureQuakes – Ideas for Action report is both theproceedings of those workshops, as well as a toolto inspire innovative planning for minimizingtransportation disruption following futureearthquakes. One conclusion of these workshopswas the importance of airports in the region’sresponse and recovery to earthquakes.
At the same time, MTC is continuing to test andrefine the Trans Response Plan (TRP) whichintegrates response and recovery efforts among allmodes of transportation. The TRP coordinatesthe activities of MTC, Caltrans, State and localOffices of Emergency Services, and othertransportation providers, including transit agenciesand airports.
Our work on airports and earthquakes has fiveprincipal overall objectives:! To develop a long-term partnership among air
transportation providers, users, the earthquakeresearch community, and earthquake responders tofoster cooperation for response and recovery.
! To assess the vulnerability of our air transportationsystem to liquefaction and land-side access issuesgiven the scenario earthquakes considered likely BayArea.
! To assist in collaborative planning for emergencyresponse among the airports, emergency responders,and cargo and passenger carriers. Emergencyresponders are depending on our airports fordelivering disaster cargo and disaster relief workers.
! To identify methods for minimizing long-termimpacts of reduced land-side access and airportdamage following future earthquakes, therebyminimizing impacts on airport business, the cargoindustry, and our regional economy.
! To increase public awareness and support ofemergency planning activities at and among airports.
As a first step in this process, ABAG has beenactively involved in the discussion of earthquakeissues as part of the Regional Airport System Plan(RASP) Update 2000 process. In addition, ABAGheld a workshop on October 10, 2000, to discuss thepotential problems outlined in this report and tobegin the process of developing strategies to cope toearthquake-related disruptions to airports. ! What are the options for bringing relief aircraft into
the region if all runways at one or more majorairports are damaged beyond immediate repair?
! What kinds of concerns should airport safetymanagers be addressing? What specific Bay Areaearthquake issues should be included in theirearthquake plans?
! What are the potential problems and solutionsrelated to land-side access?
! How should emergency plans be improved to dealwith areas likely to be damaged in an earthquake?
! If an airport lifeline network is established, what arethe critical land-side components of that network(control towers, runways, key access routes, etc.)?
1
222
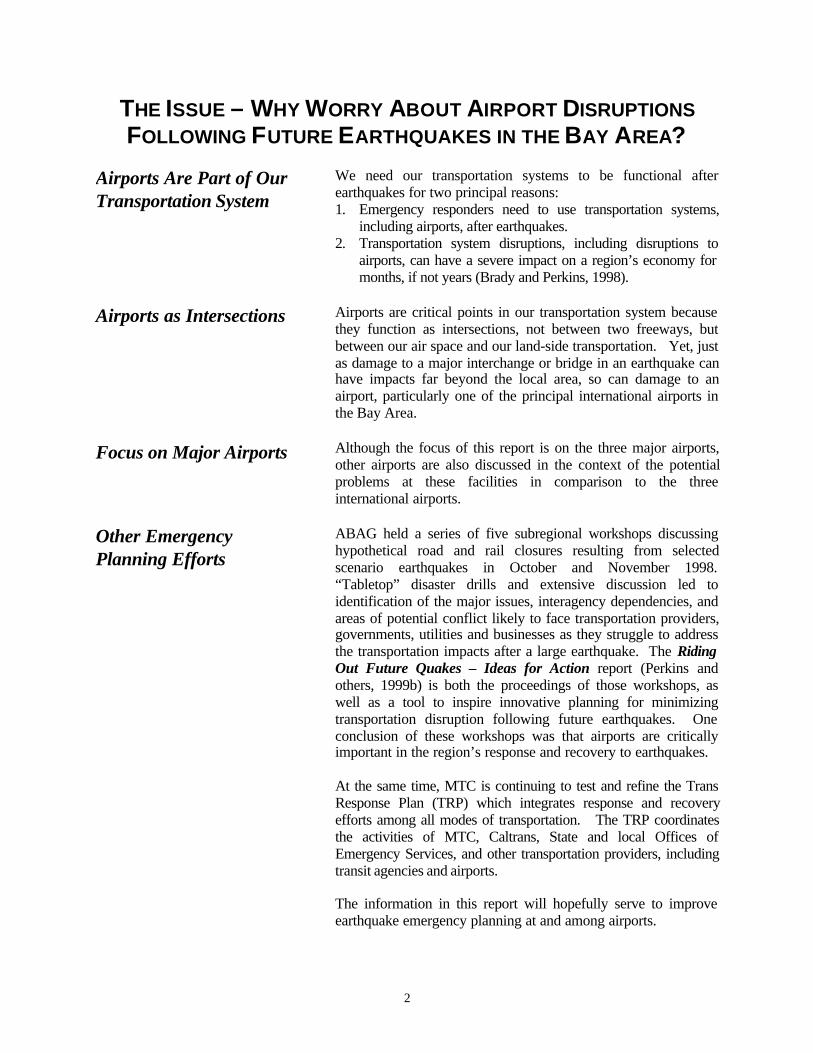
FINDINGS – EARTHQUAKES AND AIRPORTS
Based on past experience in California and other recent earthquakes, thethreats to Bay Area airport operations following future earthquakes fall intofour general categories:Q liquefaction damage to airport runways, particularly at San Jose (until
the new runways are completed), Oakland, San Francisco, and,perhaps, Moffett Federal Airfield;
Q shaking damage to air control and terminal facilities, particularly olderfacilities that may be present at Oakland, Moffett, Hayward, SanFrancisco, Half Moon Bay, Buchanan, and Livermore airports;
Q power and communications disruptions; andQ disruptions to the transportation systems serving the airports.
1. We need to better understand and mitigate the liquefaction hazardto runways. Thus, we need to expand on the liquefaction analysisconducted for the runways at the three major airports (OAK, SFO, andSJC) to:♦ gain further information on the vulnerability of other major
airports, particularly Moffett Federal Airfield on the Peninsula andTravis Air Force Base in Solano County, and, if feasible,Buchanan, Hayward, and Livermore in the East Bay; and
♦ incorporate more recent geotechnical information becomingavailable for OAK, SJC and SFO.
We need to ensure that the design of new runways also mitigatesliquefaction hazards associated with the connections to the existingrunway system. Any runway expansions at SFO and OAK that tie intosections of existing runways which are vulnerable to liquefaction willmake the expansions vulnerable as well. Current runway work at SJC isdesigned to minimize the liquefaction hazard.
2. We need to improve emergency planning at individual airportsand to better coordinate emergency planning among airports andwith other forms of transportation. Some ideas focusing onemployees and operations at individual airports are listed at the end ofthis report. However, airport participation in coordinated emergencyplanning is also essential. MTC is starting this planning as part of theintegrated Trans Response Plan (TRP) for earthquakes.
3. We need to identify alternate locations capable of handling largecommercial and cargo jets after an earthquake should Bay Areacommercial airports loose capacity due to road transportationsystem disruptions, runway damage, or structural damage. TravisAFB will have increased air and vehicle traffic during the post-earthquake emergency response phase because the federal governmentplans on using Travis AFB as the primary mobilization center for theirresponse to the disaster. With the normal operations that Travis has inaddition to this major role, emergency planners should not believe thatTravis has additional capacity for other commercial or cargo needs.Options include neighboring commercial airports (Sacramento,Stockton, Monterey, etc.), as well as larger general aviation airports.
Our Airport SystemsCan and Should BeMade MoreEarthquake-Ready!
What Are the Threatsto Airport OperationsFollowing FutureEarthquakes in theBay Area?
2
THE ISSUE – WHY WORRY ABOUT AIRPORT DISRUPTIONSFOLLOWING FUTURE EARTHQUAKES IN THE BAY AREA?
We need our transportation systems to be functional afterearthquakes for two principal reasons:1. Emergency responders need to use transportation systems,
including airports, after earthquakes.2. Transportation system disruptions, including disruptions to
airports, can have a severe impact on a region’s economy formonths, if not years (Brady and Perkins, 1998).
Airports are critical points in our transportation system becausethey function as intersections, not between two freeways, butbetween our air space and our land-side transportation. Yet, justas damage to a major interchange or bridge in an earthquake canhave impacts far beyond the local area, so can damage to anairport, particularly one of the principal international airports inthe Bay Area.
Although the focus of this report is on the three major airports,other airports are also discussed in the context of the potentialproblems at these facilities in comparison to the threeinternational airports.
ABAG held a series of five subregional workshops discussinghypothetical road and rail closures resulting from selectedscenario earthquakes in October and November 1998.“Tabletop” disaster drills and extensive discussion led toidentification of the major issues, interagency dependencies, andareas of potential conflict likely to face transportation providers,governments, utilities and businesses as they struggle to addressthe transportation impacts after a large earthquake. The RidingOut Future Quakes – Ideas for Action report (Perkins andothers, 1999b) is both the proceedings of those workshops, aswell as a tool to inspire innovative planning for minimizingtransportation disruption following future earthquakes. Oneconclusion of these workshops was that airports are criticallyimportant in the region’s response and recovery to earthquakes.
At the same time, MTC is continuing to test and refine the TransResponse Plan (TRP) which integrates response and recoveryefforts among all modes of transportation. The TRP coordinatesthe activities of MTC, Caltrans, State and local Offices ofEmergency Services, and other transportation providers, includingtransit agencies and airports.
The information in this report will hopefully serve to improveearthquake emergency planning at and among airports.
Airports Are Part of OurTransportation System
Airports as Intersections
Focus on Major Airports
Other EmergencyPlanning Efforts
3
PAST EARTHQUAKES – WHAT HAPPENED LAST TIME?The magnitude 6.9 Loma Prieta earthquake occurred in the Santa Cruzmountains near the border of Santa Cruz and Santa Clara counties onOctober 17, 1989. Because the earthquake source fault was far south ofthe main urban center of the Bay Area, it only serves as a wake-up callfor what might happen in a closer or larger magnitude earthquake.Thus, it is inappropriate to assume that since a problem did not occur inthis earthquake, it will not occur in the future.
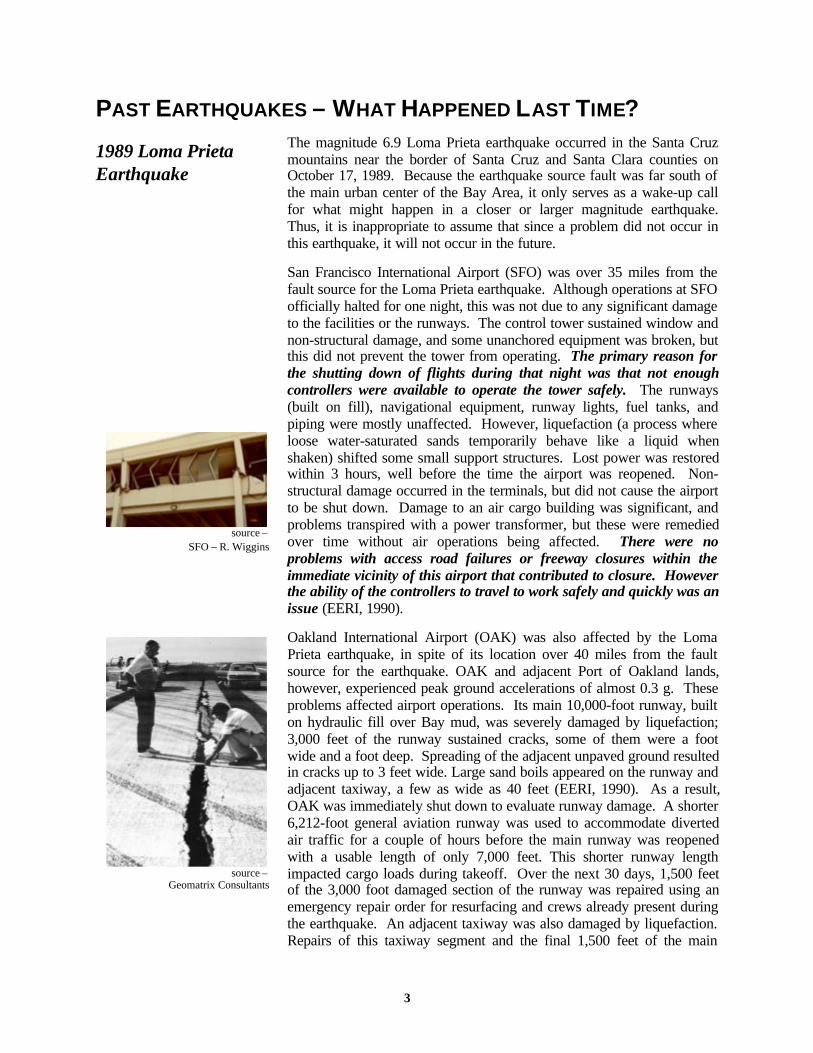
San Francisco International Airport (SFO) was over 35 miles from thefault source for the Loma Prieta earthquake. Although operations at SFOofficially halted for one night, this was not due to any significant damageto the facilities or the runways. The control tower sustained window andnon-structural damage, and some unanchored equipment was broken, butthis did not prevent the tower from operating. The primary reason forthe shutting down of flights during that night was that not enoughcontrollers were available to operate the tower safely. The runways(built on fill), navigational equipment, runway lights, fuel tanks, andpiping were mostly unaffected. However, liquefaction (a process whereloose water-saturated sands temporarily behave like a liquid whenshaken) shifted some small support structures. Lost power was restoredwithin 3 hours, well before the time the airport was reopened. Non-structural damage occurred in the terminals, but did not cause the airportto be shut down. Damage to an air cargo building was significant, andproblems transpired with a power transformer, but these were remediedover time without air operations being affected. There were noproblems with access road failures or freeway closures within theimmediate vicinity of this airport that contributed to closure. Howeverthe ability of the controllers to travel to work safely and quickly was anissue (EERI, 1990).
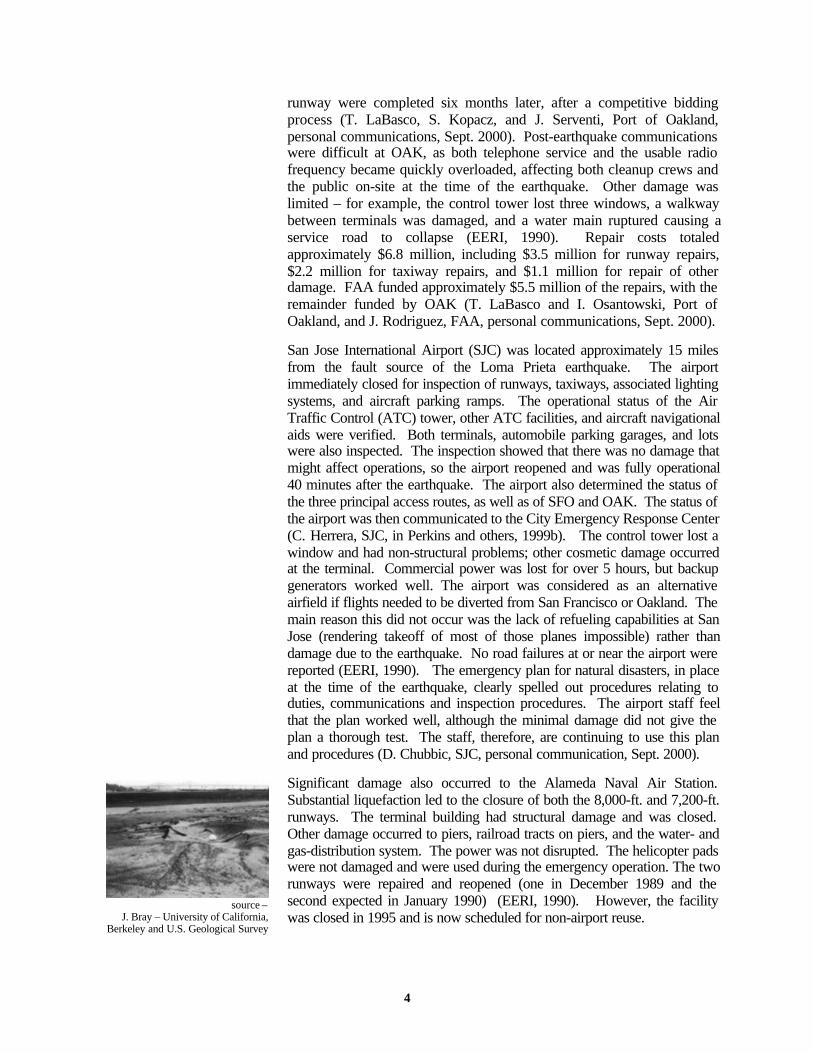
Oakland International Airport (OAK) was also affected by the LomaPrieta earthquake, in spite of its location over 40 miles from the faultsource for the earthquake. OAK and adjacent Port of Oakland lands,however, experienced peak ground accelerations of almost 0.3 g. Theseproblems affected airport operations. Its main 10,000-foot runway, builton hydraulic fill over Bay mud, was severely damaged by liquefaction;3,000 feet of the runway sustained cracks, some of them were a footwide and a foot deep. Spreading of the adjacent unpaved ground resultedin cracks up to 3 feet wide. Large sand boils appeared on the runway andadjacent taxiway, a few as wide as 40 feet (EERI, 1990). As a result,OAK was immediately shut down to evaluate runway damage. A shorter6,212-foot general aviation runway was used to accommodate divertedair traffic for a couple of hours before the main runway was reopenedwith a usable length of only 7,000 feet. This shorter runway lengthimpacted cargo loads during takeoff. Over the next 30 days, 1,500 feetof the 3,000 foot damaged section of the runway was repaired using anemergency repair order for resurfacing and crews already present duringthe earthquake. An adjacent taxiway was also damaged by liquefaction.Repairs of this taxiway segment and the final 1,500 feet of the main
1989 Loma PrietaEarthquake
source –Geomatrix Consultants
source –SFO – R. Wiggins
4
runway were completed six months later, after a competitive biddingprocess (T. LaBasco, S. Kopacz, and J. Serventi, Port of Oakland,personal communications, Sept. 2000). Post-earthquake communicationswere difficult at OAK, as both telephone service and the usable radiofrequency became quickly overloaded, affecting both cleanup crews andthe public on-site at the time of the earthquake. Other damage waslimited – for example, the control tower lost three windows, a walkwaybetween terminals was damaged, and a water main ruptured causing aservice road to collapse (EERI, 1990). Repair costs totaledapproximately $6.8 million, including $3.5 million for runway repairs,$2.2 million for taxiway repairs, and $1.1 million for repair of otherdamage. FAA funded approximately $5.5 million of the repairs, with theremainder funded by OAK (T. LaBasco and I. Osantowski, Port ofOakland, and J. Rodriguez, FAA, personal communications, Sept. 2000).
San Jose International Airport (SJC) was located approximately 15 milesfrom the fault source of the Loma Prieta earthquake. The airportimmediately closed for inspection of runways, taxiways, associated lightingsystems, and aircraft parking ramps. The operational status of the AirTraffic Control (ATC) tower, other ATC facilities, and aircraft navigationalaids were verified. Both terminals, automobile parking garages, and lotswere also inspected. The inspection showed that there was no damage thatmight affect operations, so the airport reopened and was fully operational40 minutes after the earthquake. The airport also determined the status ofthe three principal access routes, as well as of SFO and OAK. The status ofthe airport was then communicated to the City Emergency Response Center(C. Herrera, SJC, in Perkins and others, 1999b). The control tower lost awindow and had non-structural problems; other cosmetic damage occurredat the terminal. Commercial power was lost for over 5 hours, but backupgenerators worked well. The airport was considered as an alternativeairfield if flights needed to be diverted from San Francisco or Oakland. Themain reason this did not occur was the lack of refueling capabilities at SanJose (rendering takeoff of most of those planes impossible) rather thandamage due to the earthquake. No road failures at or near the airport werereported (EERI, 1990). The emergency plan for natural disasters, in placeat the time of the earthquake, clearly spelled out procedures relating toduties, communications and inspection procedures. The airport staff feelthat the plan worked well, although the minimal damage did not give theplan a thorough test. The staff, therefore, are continuing to use this planand procedures (D. Chubbic, SJC, personal communication, Sept. 2000).
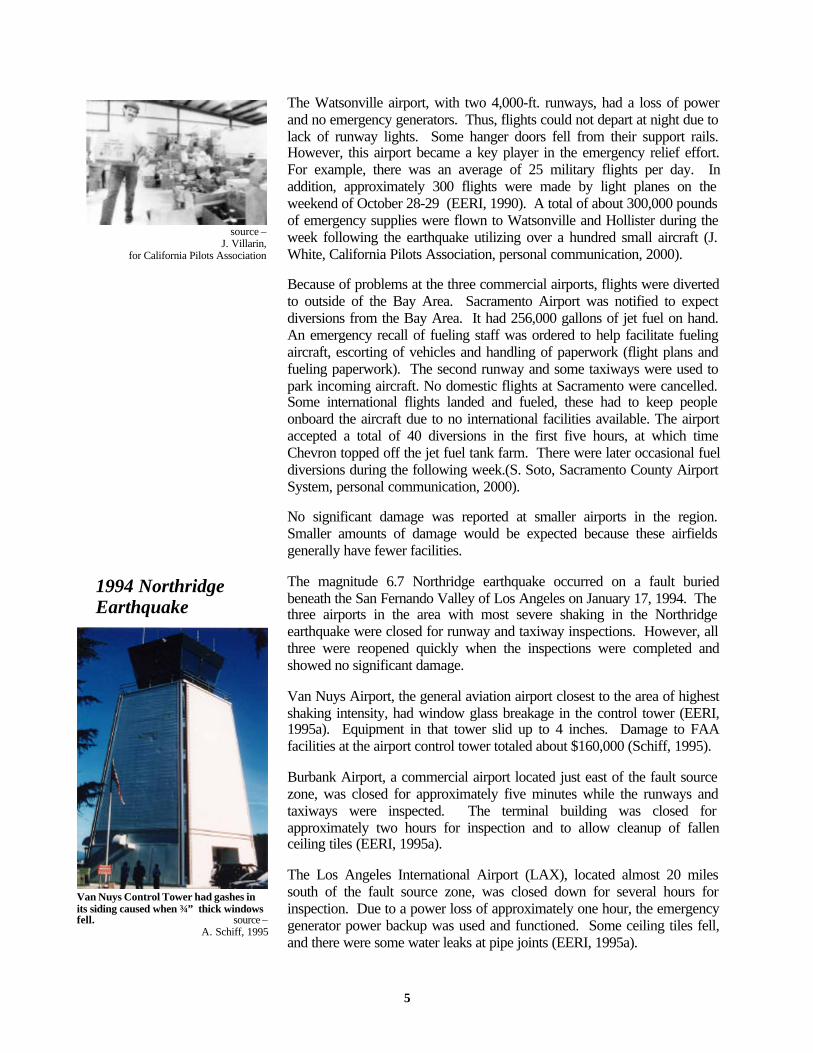
Significant damage also occurred to the Alameda Naval Air Station.Substantial liquefaction led to the closure of both the 8,000-ft. and 7,200-ft.runways. The terminal building had structural damage and was closed.Other damage occurred to piers, railroad tracts on piers, and the water- andgas-distribution system. The power was not disrupted. The helicopter padswere not damaged and were used during the emergency operation. The tworunways were repaired and reopened (one in December 1989 and thesecond expected in January 1990) (EERI, 1990). However, the facilitywas closed in 1995 and is now scheduled for non-airport reuse.
source –J. Bray – University of California,
Berkeley and U.S. Geological Survey
5
The Watsonville airport, with two 4,000-ft. runways, had a loss of powerand no emergency generators. Thus, flights could not depart at night due tolack of runway lights. Some hanger doors fell from their support rails.However, this airport became a key player in the emergency relief effort.For example, there was an average of 25 military flights per day. Inaddition, approximately 300 flights were made by light planes on theweekend of October 28-29 (EERI, 1990). A total of about 300,000 poundsof emergency supplies were flown to Watsonville and Hollister during theweek following the earthquake utilizing over a hundred small aircraft (J.White, California Pilots Association, personal communication, 2000).
Because of problems at the three commercial airports, flights were divertedto outside of the Bay Area. Sacramento Airport was notified to expectdiversions from the Bay Area. It had 256,000 gallons of jet fuel on hand.An emergency recall of fueling staff was ordered to help facilitate fuelingaircraft, escorting of vehicles and handling of paperwork (flight plans andfueling paperwork). The second runway and some taxiways were used topark incoming aircraft. No domestic flights at Sacramento were cancelled.Some international flights landed and fueled, these had to keep peopleonboard the aircraft due to no international facilities available. The airportaccepted a total of 40 diversions in the first five hours, at which timeChevron topped off the jet fuel tank farm. There were later occasional fueldiversions during the following week.(S. Soto, Sacramento County AirportSystem, personal communication, 2000).
No significant damage was reported at smaller airports in the region.Smaller amounts of damage would be expected because these airfieldsgenerally have fewer facilities.
The magnitude 6.7 Northridge earthquake occurred on a fault buriedbeneath the San Fernando Valley of Los Angeles on January 17, 1994. Thethree airports in the area with most severe shaking in the Northridgeearthquake were closed for runway and taxiway inspections. However, allthree were reopened quickly when the inspections were completed andshowed no significant damage.
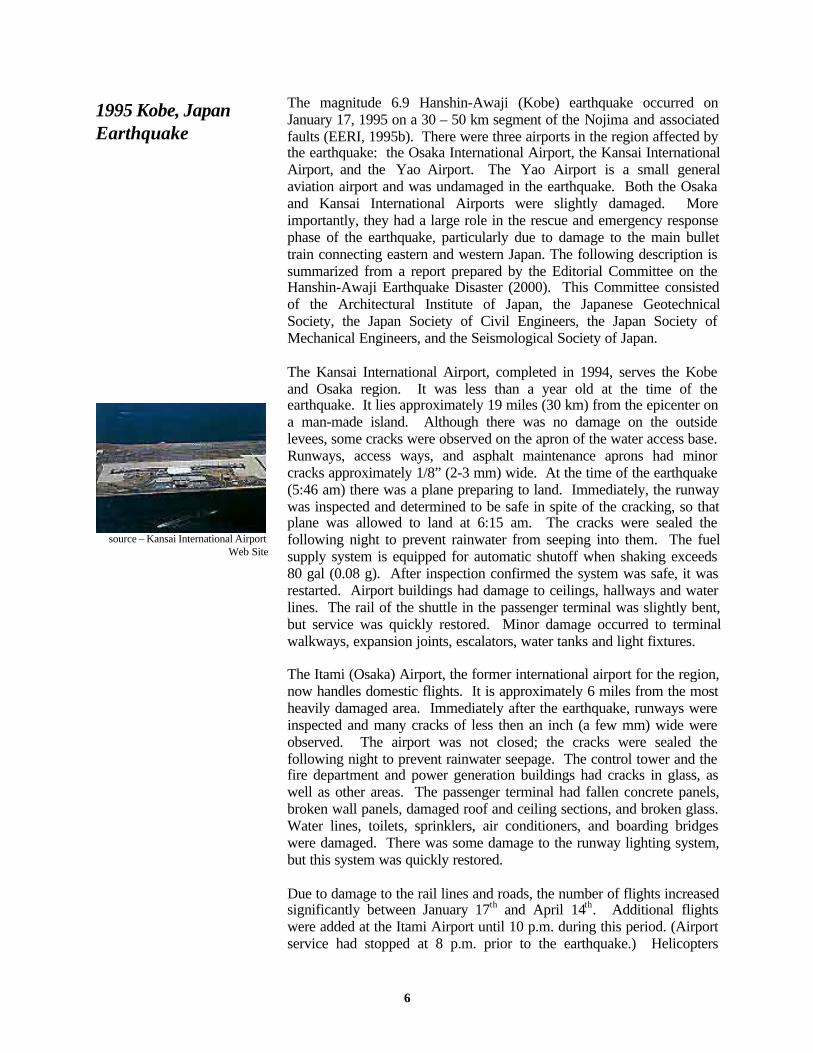
Van Nuys Airport, the general aviation airport closest to the area of highestshaking intensity, had window glass breakage in the control tower (EERI,1995a). Equipment in that tower slid up to 4 inches. Damage to FAAfacilities at the airport control tower totaled about $160,000 (Schiff, 1995).
Burbank Airport, a commercial airport located just east of the fault sourcezone, was closed for approximately five minutes while the runways andtaxiways were inspected. The terminal building was closed forapproximately two hours for inspection and to allow cleanup of fallenceiling tiles (EERI, 1995a).
The Los Angeles International Airport (LAX), located almost 20 milessouth of the fault source zone, was closed down for several hours forinspection. Due to a power loss of approximately one hour, the emergencygenerator power backup was used and functioned. Some ceiling tiles fell,and there were some water leaks at pipe joints (EERI, 1995a).
1994 NorthridgeEarthquake
source –J. Villarin,
for California Pilots Association
Van Nuys Control Tower had gashes inits siding caused when ¾” thick windowsfell. source –
A. Schiff, 1995
6
The magnitude 6.9 Hanshin-Awaji (Kobe) earthquake occurred onJanuary 17, 1995 on a 30 – 50 km segment of the Nojima and associatedfaults (EERI, 1995b). There were three airports in the region affected bythe earthquake: the Osaka International Airport, the Kansai InternationalAirport, and the Yao Airport. The Yao Airport is a small generalaviation airport and was undamaged in the earthquake. Both the Osakaand Kansai International Airports were slightly damaged. Moreimportantly, they had a large role in the rescue and emergency responsephase of the earthquake, particularly due to damage to the main bullettrain connecting eastern and western Japan. The following description issummarized from a report prepared by the Editorial Committee on theHanshin-Awaji Earthquake Disaster (2000). This Committee consistedof the Architectural Institute of Japan, the Japanese GeotechnicalSociety, the Japan Society of Civil Engineers, the Japan Society ofMechanical Engineers, and the Seismological Society of Japan.
The Kansai International Airport, completed in 1994, serves the Kobeand Osaka region. It was less than a year old at the time of theearthquake. It lies approximately 19 miles (30 km) from the epicenter ona man-made island. Although there was no damage on the outsidelevees, some cracks were observed on the apron of the water access base.Runways, access ways, and asphalt maintenance aprons had minorcracks approximately 1/8” (2-3 mm) wide. At the time of the earthquake(5:46 am) there was a plane preparing to land. Immediately, the runwaywas inspected and determined to be safe in spite of the cracking, so thatplane was allowed to land at 6:15 am. The cracks were sealed thefollowing night to prevent rainwater from seeping into them. The fuelsupply system is equipped for automatic shutoff when shaking exceeds80 gal (0.08 g). After inspection confirmed the system was safe, it wasrestarted. Airport buildings had damage to ceilings, hallways and waterlines. The rail of the shuttle in the passenger terminal was slightly bent,but service was quickly restored. Minor damage occurred to terminalwalkways, expansion joints, escalators, water tanks and light fixtures.
The Itami (Osaka) Airport, the former international airport for the region,now handles domestic flights. It is approximately 6 miles from the mostheavily damaged area. Immediately after the earthquake, runways wereinspected and many cracks of less then an inch (a few mm) wide wereobserved. The airport was not closed; the cracks were sealed thefollowing night to prevent rainwater seepage. The control tower and thefire department and power generation buildings had cracks in glass, aswell as other areas. The passenger terminal had fallen concrete panels,broken wall panels, damaged roof and ceiling sections, and broken glass.Water lines, toilets, sprinklers, air conditioners, and boarding bridgeswere damaged. There was some damage to the runway lighting system,but this system was quickly restored.
Due to damage to the rail lines and roads, the number of flights increasedsignificantly between January 17th and April 14th. Additional flightswere added at the Itami Airport until 10 p.m. during this period. (Airportservice had stopped at 8 p.m. prior to the earthquake.) Helicopters
1995 Kobe, JapanEarthquake
source – Kansai International AirportWeb Site
7
transported emergency relief goods. Those goods were mainly food anddrinking water during the first 4-5 days, followed by tents, portabletoilets, blankets and heaters for the next 6-10 days, and then clothes andgoods for infants. The Itami Osaka Airport accepted domestic reliefgoods and distributed them via trucks and helicopters to the disaster area.The Kansai Airport accepted both domestic and international reliefgoods, which were then distributed via trucks, helicopters and ships tothe disaster area. Between January 19th and May 10th, about 1,722 tonsof goods were transported. The sky over the disaster area was crowdedwith airplanes from the Japanese self-defense forces, police, fire fighters,and media groups. NATM was provided to control them. The process ofobtaining permits to land in non-equipped areas was simplified in orderto speed up the transportation of relief goods by helicopter.
The Kobe report notes that the role of air transportation is to provideemergency and alternate transportation, and to contribute to the recoveryof the disaster area. Recommendations included:Q seismic reinforcement of current facilities;Q alternate or redundancy for aircraft control facilities;Q establishment of air emergency response and recovery systems; andQ research on earthquake investigation methods.
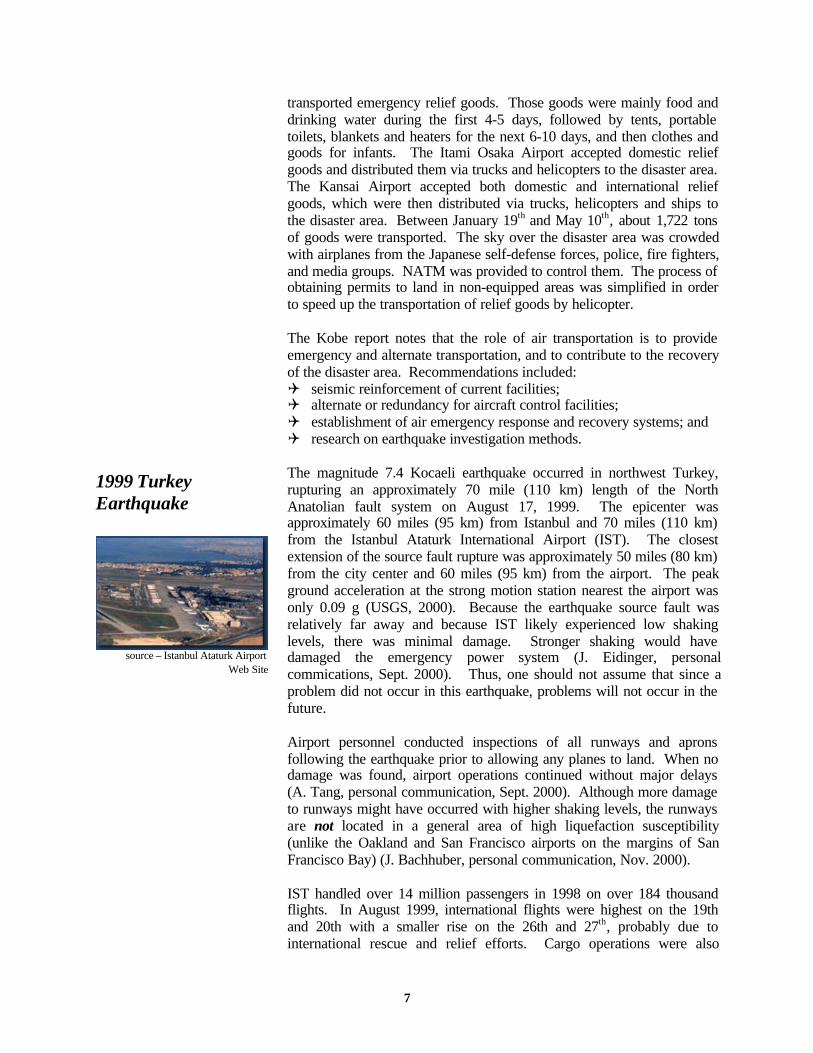
The magnitude 7.4 Kocaeli earthquake occurred in northwest Turkey,rupturing an approximately 70 mile (110 km) length of the NorthAnatolian fault system on August 17, 1999. The epicenter wasapproximately 60 miles (95 km) from Istanbul and 70 miles (110 km)from the Istanbul Ataturk International Airport (IST). The closestextension of the source fault rupture was approximately 50 miles (80 km)from the city center and 60 miles (95 km) from the airport. The peakground acceleration at the strong motion station nearest the airport wasonly 0.09 g (USGS, 2000). Because the earthquake source fault wasrelatively far away and because IST likely experienced low shakinglevels, there was minimal damage. Stronger shaking would havedamaged the emergency power system (J. Eidinger, personalcommications, Sept. 2000). Thus, one should not assume that since aproblem did not occur in this earthquake, problems will not occur in thefuture.
Airport personnel conducted inspections of all runways and apronsfollowing the earthquake prior to allowing any planes to land. When nodamage was found, airport operations continued without major delays(A. Tang, personal communication, Sept. 2000). Although more damageto runways might have occurred with higher shaking levels, the runwaysare not located in a general area of high liquefaction susceptibility(unlike the Oakland and San Francisco airports on the margins of SanFrancisco Bay) (J. Bachhuber, personal communication, Nov. 2000).
IST handled over 14 million passengers in 1998 on over 184 thousandflights. In August 1999, international flights were highest on the 19thand 20th with a smaller rise on the 26th and 27th, probably due tointernational rescue and relief efforts. Cargo operations were also
1999 TurkeyEarthquake
source – Istanbul Ataturk AirportWeb Site
8
increased due to the increase in foreign aid (A. Tang, personalcommunication, Sept. 2000). In addition, during the month following theearthquake, there was a significant drop in inbound passenger arrivalsover historical seasonal trends, reflecting the 30% to 50% reduction intourism for the month following the post-earthquake. Outbounddepartures may have increased after the earthquake, reflecting theshortened vacation plans of tourists and the departure of displaced people(J. Eidinger, personal communication, Sept. 2000).
A new $305 million terminal was under construction when theearthquake occurred. As a result of the earthquake, the decision wasmade to review the design for the terminal, although construction was90% complete at the time of the earthquake. Needed changes were madeand it was opened in January 2000 (Eng. News Record, 1-17- 2000).
Much less information is available on the performance of the CengizTopel Military Airport in Izmit. It appears that there was significantdamage to the control tower rendering it unusable. It was furtherreported that airport operations were reduced as a result of the damage(A. Tang, personal communication, Sept. 2000).
The magnitude 7.6 Chi-Chi earthquake occurred in central Taiwan onSeptember 21, 1999. The international airport is located approximately75 miles (120 km) from the earthquake epicenter and approximately 50miles (90 km) from the fault source. It was undamaged and functionalfollowing the earthquake, enabling it to serve a critical role in theearthquake response and recovery effort.
1999 TaiwanEarthquake
9
THE AIRPORT SYSTEM – HOW DOES IT OPERATE?The airport system in the Bay Area consists of three commercialinternational airports –Q San Francisco International Airport (SFO),Q Oakland International Airport (OAK), andQ San Jose International Airport (SJC).
There are also two military/federal airfields –Q Travis Air Force Base, andQ Moffett (NASA).
In addition, there are several general aviation airports that vary greatly insize. The principal general aviation airports include –Q Hayward (in Alameda County)Q Livermore (in Alameda County)Q Oakland – North Field (in Alameda County)Q Buchanan – Concord (in Contra Costa County)Q Napa CountyQ Half Moon Bay (in San Mateo County)Q Rio Vista (in Solano County)Q Nut Tree (in Vacaville in Solano County)Q Sonoma County – Santa Rosa
Other significant general aviation airports include –Q Byron (in Contra Costa County)Q Marin County (Gnoss Field)Q San Carlos (in San Mateo County)Q Reid Hillview (in San Jose in Santa Clara County)Q South County (in Gilroy in Santa Clara County)Q Palo Alto (in Santa Clara County)
The three major commercial airports serviced 56.6 million passengers on639,000 total flights in 1999, for an average of 1,750 flights per day. Inaddition, there were 71,000 cargo flights, or 195 flights per day. SFOhandled 66% of the passengers, while OAK handled 76% of the cargoflights (MTC, 2000a). The current airport usage statistics and projectionsfor that usage in the future are shown on Figure 1.
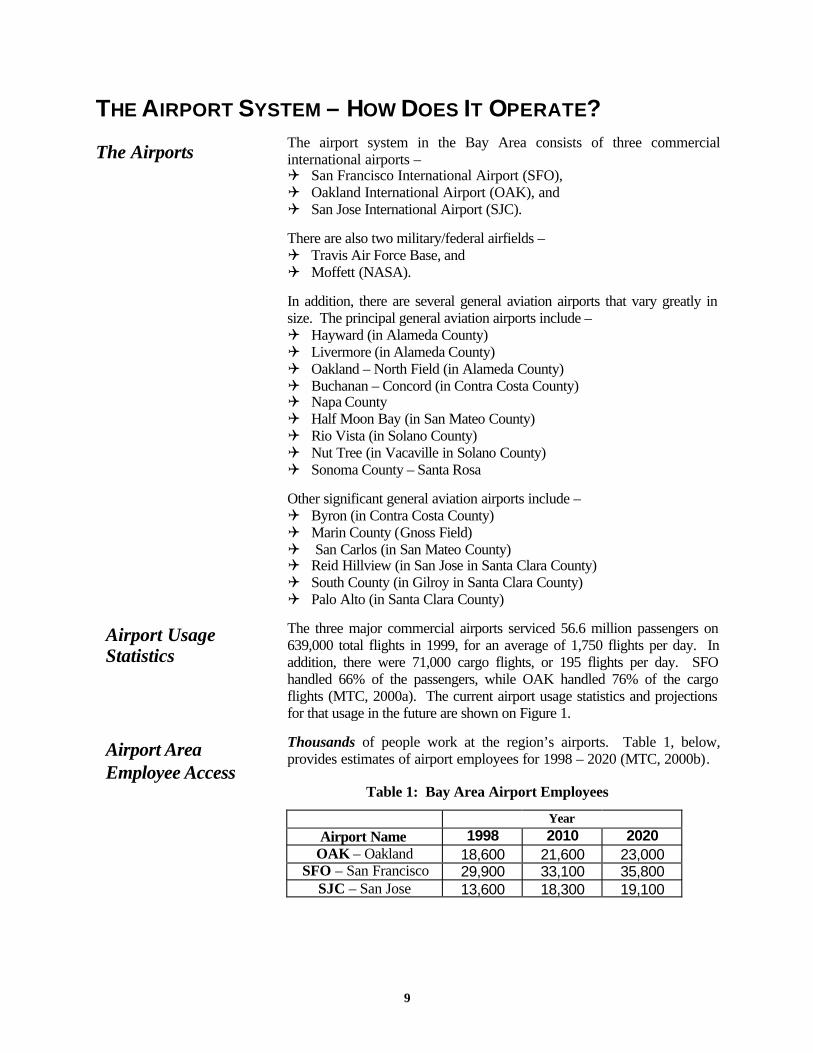
Thousands of people work at the region’s airports. Table 1, below,provides estimates of airport employees for 1998 – 2020 (MTC, 2000b).
Table 1: Bay Area Airport Employees
Year
Airport Name 1998 2010 2020OAK – Oakland 18,600 21,600 23,000
SFO – San Francisco 29,900 33,100 35,800SJC – San Jose 13,600 18,300 19,100
The Airports
Airport UsageStatistics
Airport AreaEmployee Access
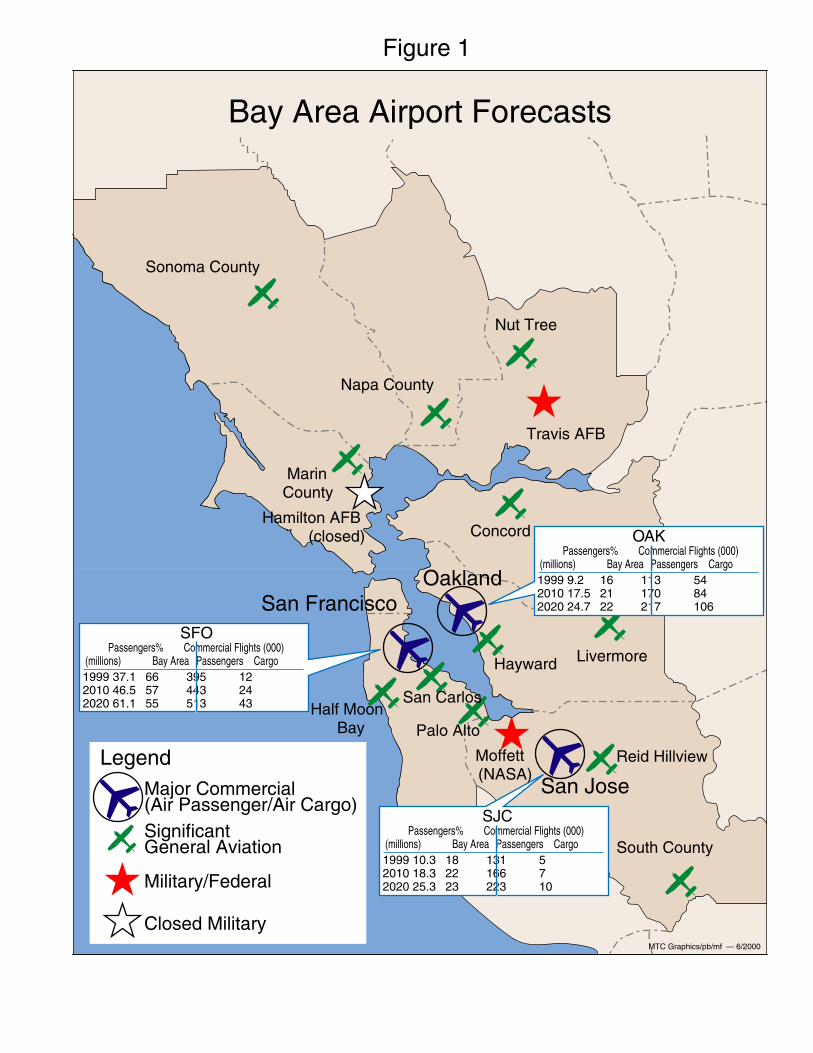
Bay Area Airport Forecasts
Oakland
San Jose
San Francisco
Sonoma County
Napa County
MarinCounty
Nut Tree
Travis AFB
Concord
Livermore
Reid Hillview
Hayward
San Carlos
Palo AltoHalf Moon
Bay
South County
Moffett(NASA)
MTC Graphics/pb/mf — 6/2000
Legend
SignificantGeneral Aviation
Major Commercial(Air Passenger/Air Cargo)
Military/Federal
Closed Military
Hamilton AFB(closed) OAK
Passengers% Commercial Flights (000)(millions) Bay Area Passengers Cargo19999.2 16 113 54201017.5 21 170 84202024.7 22 217 106
Figure 1
SJC Passengers% Commercial Flights (000)(millions) Bay Area Passengers Cargo199910.3 18 131 5201018.3 22 166 7202025.3 23 223 10
SFO Passengers% Commercial Flights (000)(millions) Bay Area Passengers Cargo199937.1 66 395 12201046.5 57 443 24202061.1 55 513 43
11
According to the Regional Airport System Plan – Update 2000 AirportAccess Report (MTC, 2000b):
Currently, the majority of airport employees drive alone to work(71%). The remaining employees either share rides (14%), takepublic transit (11%) or bike or walk to work (4%). By 2020, thepercentages of employees taking these transportation modes areprojected to look essentially the same as today.
Thus, any disruption of the road transportation system could seriouslyimpact the commute patterns of airport employees, as well as theiravailability after an earthquake.
Similarly, the majority of air passengers get to the three majorcommercial airports by private car (72%). The vast majority of theremainder take a door-to-door shuttle or taxi (17%), or a private bus,chartered bus, or hotel shuttle (9%). Only 2% ride public transit (MTC,2000b). The completion of BART to SFO in approximately 2002 maychange this pattern. Disruptions of the road transportation system or ofBART could seriously impact the ability of these passengers to get to theairport.
The third source of airport-related traffic is air cargo trucking. Accordingto the Regional Airport System Plan – Update 2000 Airport AccessReport (MTC, 2000b):
On an average work week (Monday through Friday) the threeairports generate 33,456 air cargo related truck trips to and fromthe airport… . Daily truck trips were highest at SFO (17,348),followed by OAK (11,765) and SJC (4,344).
Thus, any disruption of the road transportation system also could beexpected to seriously impacts air cargo truck traffic and associatedflights.
A table listing runway facilities for the various airports within the nineBay Area counties is included as Appendix A. In addition, because ofthe focus of this project on emergency planning, the table also includesthe larger airport facilities in adjacent counties.
Airline PassengerAccess
Cargo AccessPatterns
See Appendix A forMore Information
12
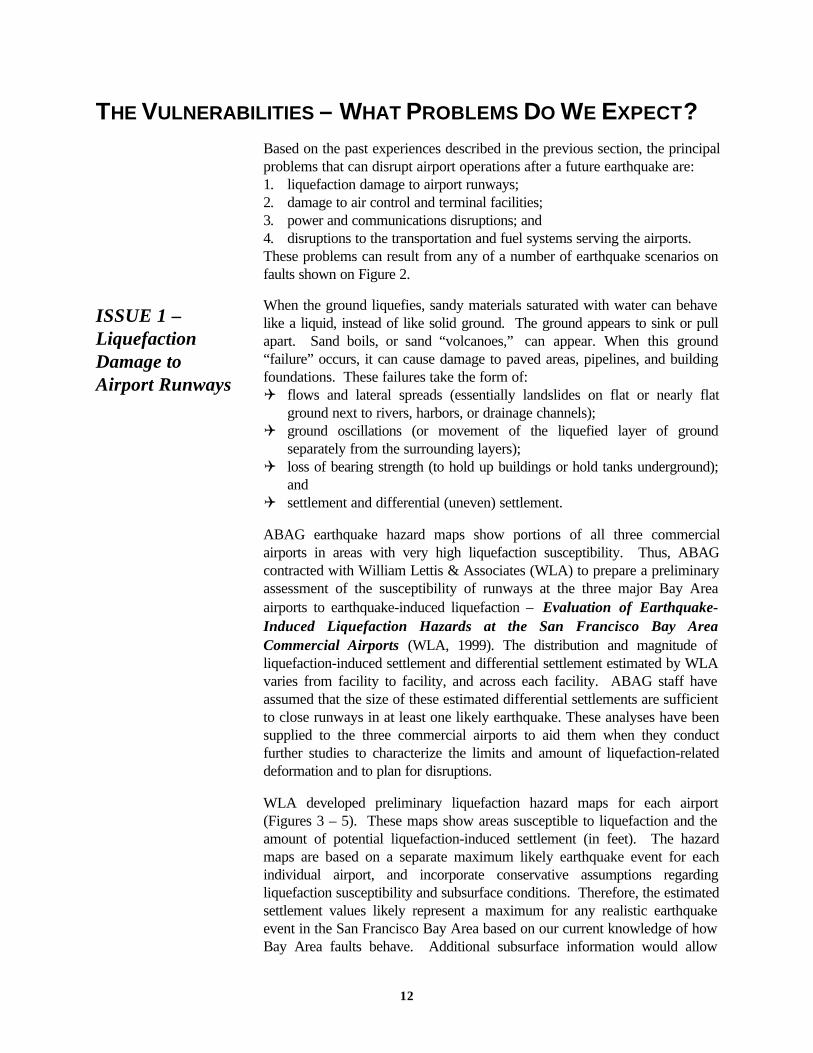
THE VULNERABILITIES – WHAT PROBLEMS DO WE EXPECT?Based on the past experiences described in the previous section, the principalproblems that can disrupt airport operations after a future earthquake are:1. liquefaction damage to airport runways;2. damage to air control and terminal facilities;3. power and communications disruptions; and4. disruptions to the transportation and fuel systems serving the airports.These problems can result from any of a number of earthquake scenarios onfaults shown on Figure 2.
When the ground liquefies, sandy materials saturated with water can behavelike a liquid, instead of like solid ground. The ground appears to sink or pullapart. Sand boils, or sand “volcanoes,” can appear. When this ground“failure” occurs, it can cause damage to paved areas, pipelines, and buildingfoundations. These failures take the form of:Q flows and lateral spreads (essentially landslides on flat or nearly flat
ground next to rivers, harbors, or drainage channels);Q ground oscillations (or movement of the liquefied layer of ground
separately from the surrounding layers);Q loss of bearing strength (to hold up buildings or hold tanks underground);
andQ settlement and differential (uneven) settlement.
ABAG earthquake hazard maps show portions of all three commercialairports in areas with very high liquefaction susceptibility. Thus, ABAGcontracted with William Lettis & Associates (WLA) to prepare a preliminaryassessment of the susceptibility of runways at the three major Bay Areaairports to earthquake-induced liquefaction – Evaluation of Earthquake-Induced Liquefaction Hazards at the San Francisco Bay AreaCommercial Airports (WLA, 1999). The distribution and magnitude ofliquefaction-induced settlement and differential settlement estimated by WLAvaries from facility to facility, and across each facility. ABAG staff haveassumed that the size of these estimated differential settlements are sufficientto close runways in at least one likely earthquake. These analyses have beensupplied to the three commercial airports to aid them when they conductfurther studies to characterize the limits and amount of liquefaction-relateddeformation and to plan for disruptions.
WLA developed preliminary liquefaction hazard maps for each airport(Figures 3 – 5). These maps show areas susceptible to liquefaction and theamount of potential liquefaction-induced settlement (in feet). The hazardmaps are based on a separate maximum likely earthquake event for eachindividual airport, and incorporate conservative assumptions regardingliquefaction susceptibility and subsurface conditions. Therefore, the estimatedsettlement values likely represent a maximum for any realistic earthquakeevent in the San Francisco Bay Area based on our current knowledge of howBay Area faults behave. Additional subsurface information would allow
ISSUE 1 –LiquefactionDamage toAirport Runways
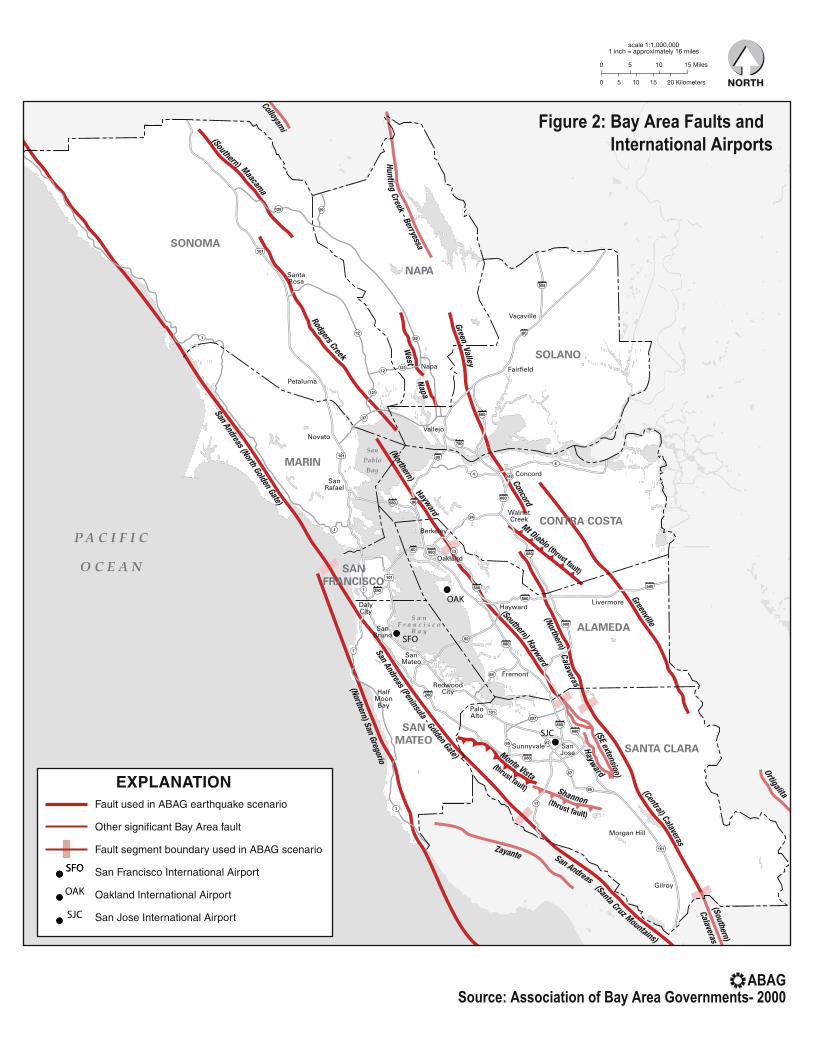
EXPLANATIONFault used in ABAG earthquake scenario
Other significant Bay Area fault
Fault segment boundary used in ABAG scenario
San Francisco International Airport
Oakland International Airport
San Jose International Airport
SFOSFO
OAK
SJC
SJC
OAK
SFO
Figure 2: Bay Area Faults andInternational Airports
Source: Association of Bay Area Governments- 2000ABAG
14
The Oakland International Airport (OAK) is susceptible to liquefactiondue to its particularly sandy artificial fill overlying Bay mud. In the eventof a large earthquake on the Hayward fault, liquefaction-relatedsettlement is estimated to be at least 0.5 ft. across runways, and potentialsettlement could exceed 1 foot over the northernmost 30-40% of the mainrunways. Significant differential settlement at OAK is expected alongthe south and north margins of the runways. Differential settlement likelywill be most severe at fill boundaries and along Bay margin levees. Thisassessment is partly supported by the liquefaction-related damagedocumented at OAK following the Loma Prieta earthquake.
Oakland International Airport LiquefactionSusceptibility Due toParticularly SandyFill on Bay Mud
15
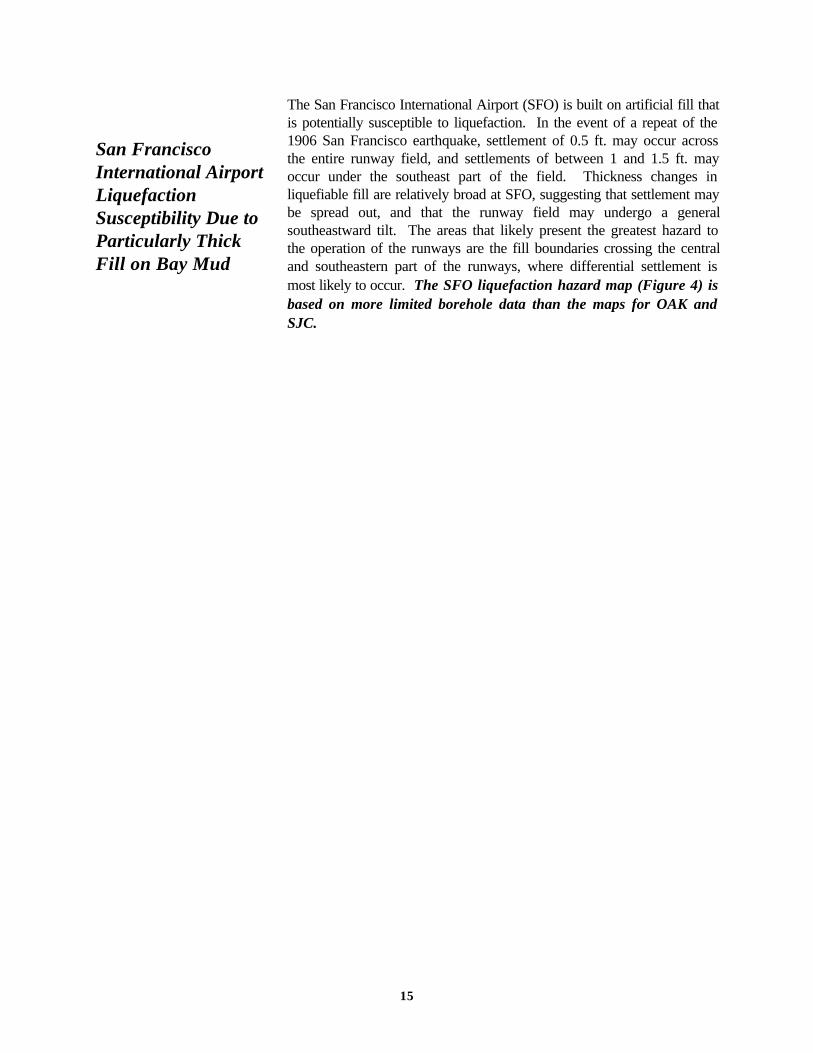
The San Francisco International Airport (SFO) is built on artificial fill thatis potentially susceptible to liquefaction. In the event of a repeat of the1906 San Francisco earthquake, settlement of 0.5 ft. may occur acrossthe entire runway field, and settlements of between 1 and 1.5 ft. mayoccur under the southeast part of the field. Thickness changes inliquefiable fill are relatively broad at SFO, suggesting that settlement maybe spread out, and that the runway field may undergo a generalsoutheastward tilt. The areas that likely present the greatest hazard tothe operation of the runways are the fill boundaries crossing the centraland southeastern part of the runways, where differential settlement ismost likely to occur. The SFO liquefaction hazard map (Figure 4) isbased on more limited borehole data than the maps for OAK andSJC.
San FranciscoInternational AirportLiquefactionSusceptibility Due toParticularly ThickFill on Bay Mud
16
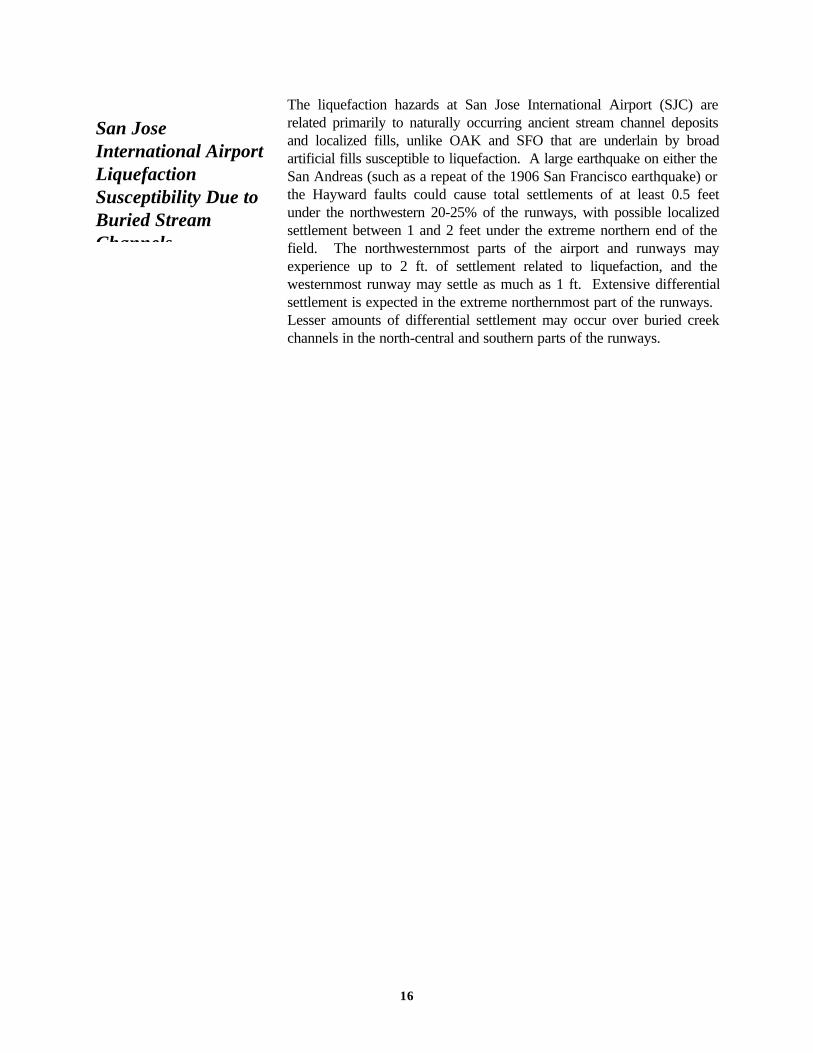
The liquefaction hazards at San Jose International Airport (SJC) arerelated primarily to naturally occurring ancient stream channel depositsand localized fills, unlike OAK and SFO that are underlain by broadartificial fills susceptible to liquefaction. A large earthquake on either theSan Andreas (such as a repeat of the 1906 San Francisco earthquake) orthe Hayward faults could cause total settlements of at least 0.5 feetunder the northwestern 20-25% of the runways, with possible localizedsettlement between 1 and 2 feet under the extreme northern end of thefield. The northwesternmost parts of the airport and runways mayexperience up to 2 ft. of settlement related to liquefaction, and thewesternmost runway may settle as much as 1 ft. Extensive differentialsettlement is expected in the extreme northernmost part of the runways. Lesser amounts of differential settlement may occur over buried creekchannels in the north-central and southern parts of the runways.
San JoseInternational AirportLiquefactionSusceptibility Due toBuried StreamChannels
17
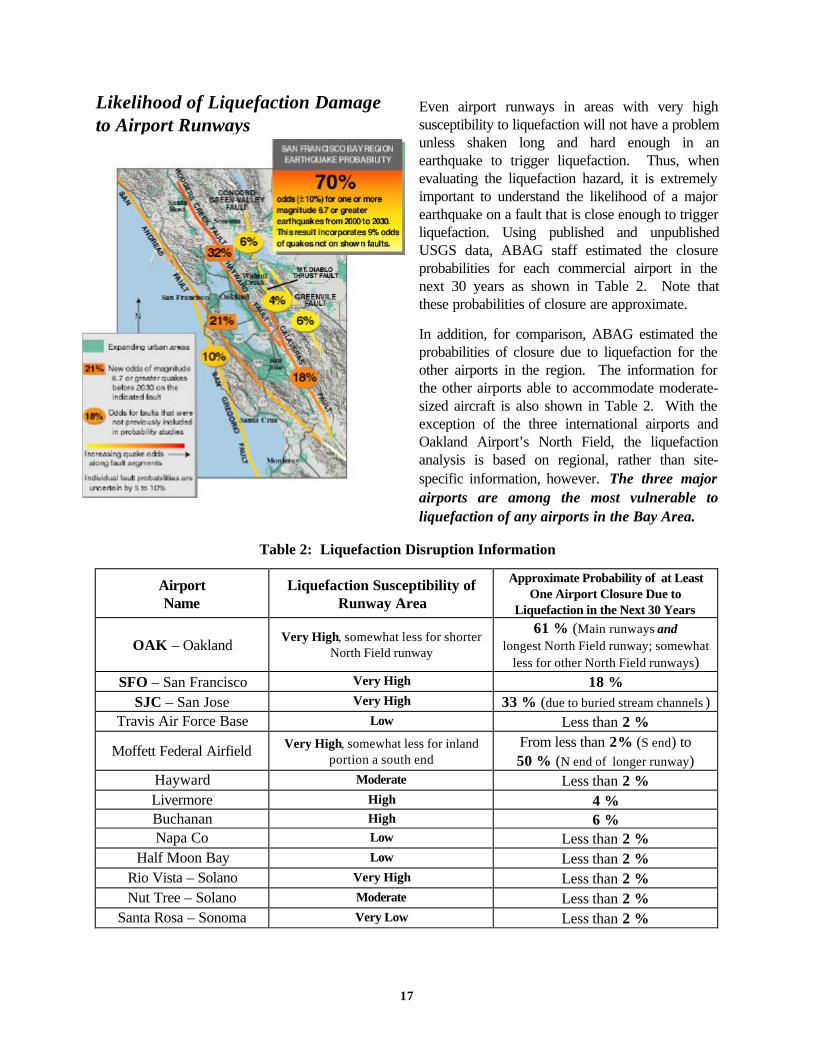
Even airport runways in areas with very highsusceptibility to liquefaction will not have a problemunless shaken long and hard enough in anearthquake to trigger liquefaction. Thus, whenevaluating the liquefaction hazard, it is extremelyimportant to understand the likelihood of a majorearthquake on a fault that is close enough to triggerliquefaction. Using published and unpublishedUSGS data, ABAG staff estimated the closureprobabilities for each commercial airport in thenext 30 years as shown in Table 2. Note thatthese probabilities of closure are approximate.
In addition, for comparison, ABAG estimated theprobabilities of closure due to liquefaction for theother airports in the region. The information forthe other airports able to accommodate moderate-sized aircraft is also shown in Table 2. With theexception of the three international airports andOakland Airport’s North Field, the liquefactionanalysis is based on regional, rather than site-specific information, however. The three majorairports are among the most vulnerable toliquefaction of any airports in the Bay Area.
Table 2: Liquefaction Disruption Information
AirportName
Liquefaction Susceptibility ofRunway Area
Approximate Probability of at LeastOne Airport Closure Due to
Liquefaction in the Next 30 Years
OAK – OaklandVery High, somewhat less for shorter
North Field runway
61 % (Main runways andlongest North Field runway; somewhat
less for other North Field runways)SFO – San Francisco Very High 18 %
SJC – San Jose Very High 33 % (due to buried stream channels )Travis Air Force Base Low Less than 2 %
Moffett Federal Airfield Very High, somewhat less for inlandportion a south end
From less than 2% (S end) to50 % (N end of longer runway)
Hayward Moderate Less than 2 %Livermore High 4 %Buchanan High 6 %Napa Co Low Less than 2 %
Half Moon Bay Low Less than 2 %Rio Vista – Solano Very High Less than 2 %Nut Tree – Solano Moderate Less than 2 %
Santa Rosa – Sonoma Very Low Less than 2 %
Likelihood of Liquefaction Damageto Airport Runways

18
TABLE NOTES – See Appendix B for data on other Bay Area airports. Liquefaction information – Variations inliquefaction susceptibility at individual airports can be quite large, particularly at Moffett Field. Probabilityinformation – In 1999, the U.S. Geological Survey (USGS) released revised estimates of the overall probability of amagnitude 6.7 earthquake in the region, as well as the probabilities of earthquakes on each fault system, but not oneach fault segment. ABAG used additional preliminary USGS information on the probability of earthquakes occurringon each fault segment(s) to perform this analysis (personal communication, David Schwartz, USGS).
19
The engineering measures usually used to mitigate potential problemsdue to liquefaction typically require closing runways to perform majorground improvement work. Such efforts are usually not cost effectiveor feasible unless undertaken as part of a larger runway construction orreconstruction project, such as that underway at San Jose InternationalAirport.
Runway Program at the San Jose International Airport
SJC is currently extending a shorter runway to create a new full-length(11,000 ft) runway (30R/12L) that should be far less vulnerable todamage because the new pavement section is sufficient to “bridge” thestream channels. Upon completion of this project, the existing full-length runway (30L/12R) will be taken out of service and reconfiguredin a similar fashion. Both projects should be completed by 2004.
The FAA has funding for assisting airports in various capitalimprovements. Airport Capital Improvement Plan (AIP) funding isdescribed in U.S. Department of Transportation Federal AviationAdministration Order 5100.38A. Additional information on howpriorities are established for distribution of these funds is provided inOrder 5100.39A. Although there are no special funds set aside formaking runways more liquefaction resistant, FAA will evaluateimprovements critical for pavement service life and continuedoperation of the runways, particularly for SFO, OAK, and SJC. Federal AIP funds pay for 75% of eligible expenses at SFO, and80.56% of eligible expenses at OAK and SJC. Improvements at thecommercial service airports of Buchanan and Santa Rosa/Sonoma areof a lower priority, while funding improvements at general aviationairports are the lowest priority. The FAA will fund 90% of eligibleexpenses at these other airports, however, if the improvements aredeemed a high priority in competing for the limited funds. AIP fundscover 90% of the eligible cost, with emphasis placed on runwayrehabilitation projects at general aviation reliever airports. The FAAwould review all funding requested following a major earthquake, or atsites suffering from major storm damage due to heavy rains thatresulted n subsurface damage or erosion.
For more information, contact Fernando Yanez of the FAA SanFrancisco Airports District Office at 650/876-2803 or seehttp://www.faa.gov/arp/app500/acip/fedfinal.htm.
A table listing general liquefaction hazard information for the runwayfacilities at the various airports within the nine Bay Area counties isincluded as Appendix B.
The types of liquefaction hazard information for airport runwaysprovided in this report are more useful for planning purposes than
Can Runways BeMade MoreLiquefaction
See Appendix B forMore Information
Is Funding Availablefor Making RunwaysMore LiquefactionResistant?

20
for design of specific mitigation programs. The information is also useful to provide a comparative analysis of hazards amongairports, rather than specific to an individual airport.
21
A second major potential source of airport disruption is damage toair traffic control and terminal facilities. A structural analysis ofthese facilities is beyond the scope of this plan. In general,prior to constructing control and terminal facilities, seismicfactors are investigated and new facilities are designed toresist shaking damage.
However, structural damage in past earthquakes is clearlycorrelated with the measured intensity of shaking. Thus, foremergency planning purposes, it is useful to know the probabilitythat Bay Area airports may be subject to very violent or violentground shaking (modified Mercalli intensity (MMI) IX or greater) inthe next 30 years. The shaking intensity information is based onthe latest version of ABAG’s ground shaking maps (Perkins andBoatwright, 1995; Perkins, 1998; Perkins and others, 1999a). Asmentioned in the discussion of liquefaction issues, the scenario-specific USGS probability information is preliminary at this time. Facility managers at Oakland, Moffett, Hayward, SanFrancisco, Half Moon Bay, Buchanan and Livermore all needto be particularly concerned about the potential for violentground shaking when designing new facilities. In addition, astructural assessment of older existing facilities may bewarranted.
In addition, even if the airport itself is not damaged, damage tobuildings in the surrounding area may make the functioning of theairport particularly useful immediately after earthquakes, such asfor airlifting in critical medical supplies or search and rescue teams. This makes conservative design of facilities at these seven airportsparticularly important.
Table 3: Shaking Exposure Information
AirportName
Approximate Probability of AirportsBeing Exposed to Violent or Very
Violent Shaking in the Next 30 Years
OAK – Oakland 24 %SFO – San Francisco 12 %
SJC – San Jose Less than 2 %Travis Air Force Base Less than 2 %
Moffett Federal Airfield 23 %Hayward 13 %Livermore 4 %Buchanan 6 %Napa Co Less than 2 %
Half Moon Bay 7 %Rio Vista – Solano Less than 2 %Nut Tree – Solano Less than 2 %
ISSUE 2 –Potential Damage to AirTraffic Control andTerminal Facilities
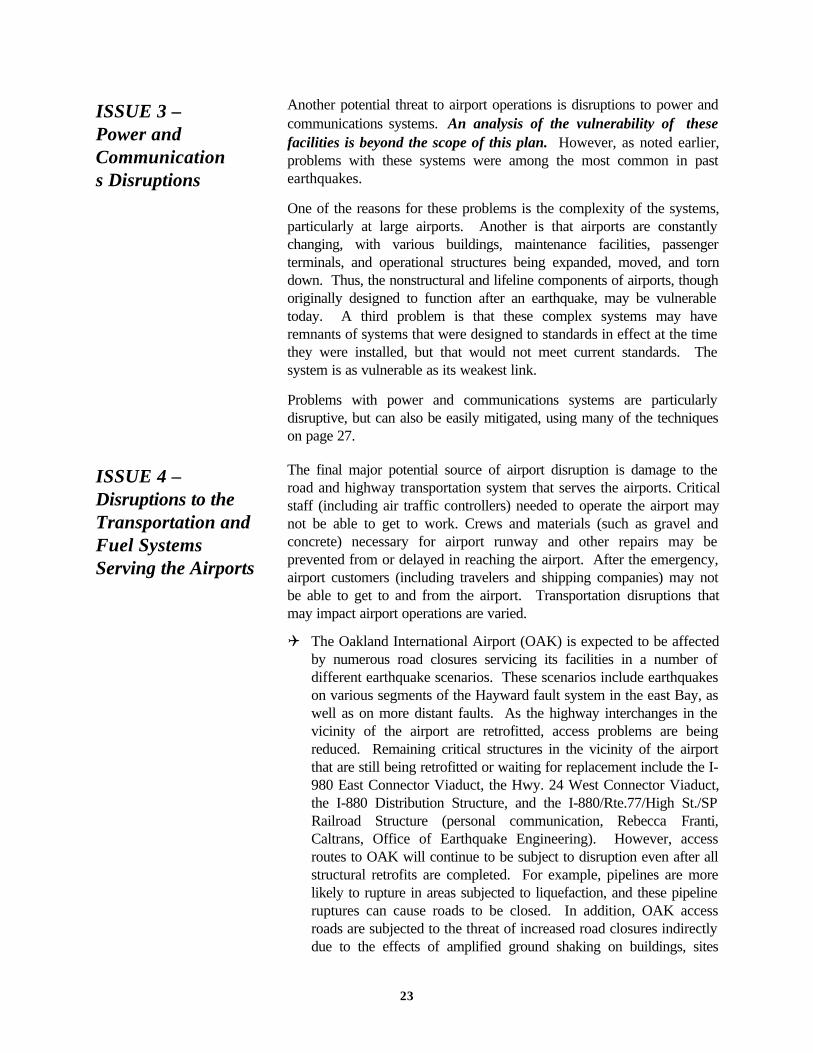
source –SFO terminal damage due to Loma Prieta
earthquake – R. Wiggins
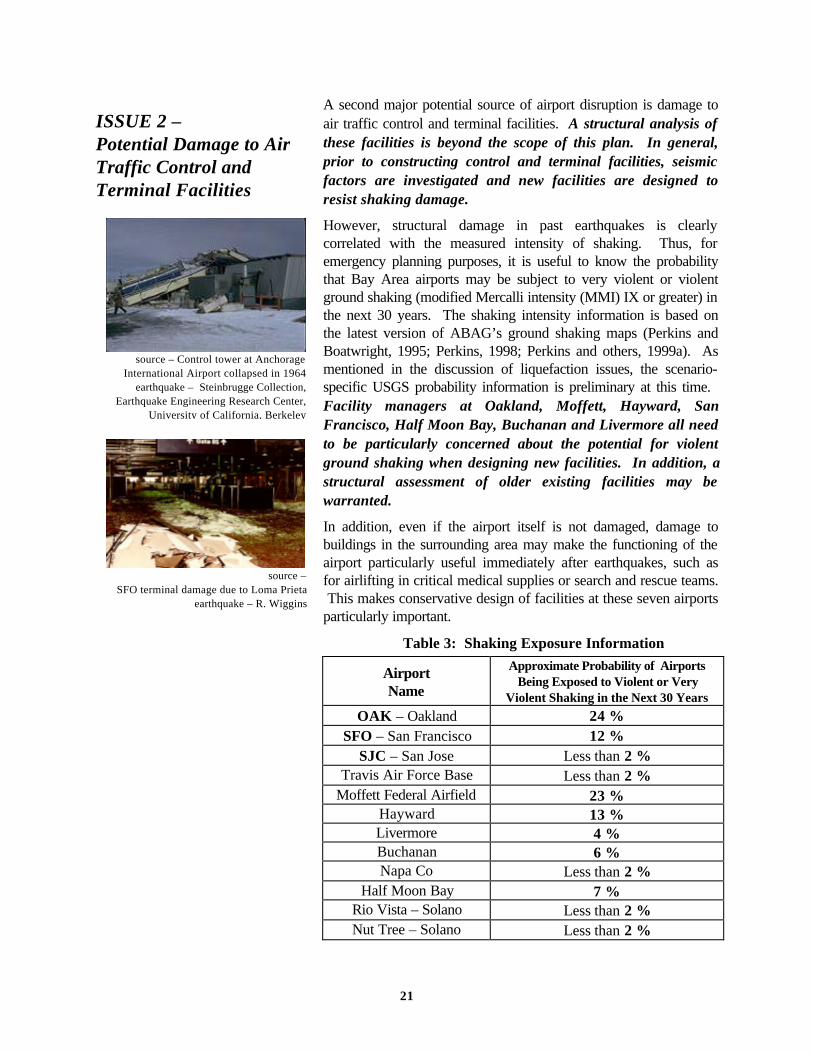
source – Control tower at Anchorage
International Airport collapsed in 1964earthquake – Steinbrugge Collection,
Earthquake Engineering Research Center,University of California, Berkeley

22
Santa Rosa – Sonoma Less than 2 %
TABLE NOTES – See Appendix B for data on other Bay Areaairports. Probability information – As stated on page 17, ABAG used acombination of published and unpublished probability information as abasis for these estimates.
23
Another potential threat to airport operations is disruptions to power andcommunications systems. An analysis of the vulnerability of thesefacilities is beyond the scope of this plan. However, as noted earlier,problems with these systems were among the most common in pastearthquakes.
One of the reasons for these problems is the complexity of the systems,particularly at large airports. Another is that airports are constantlychanging, with various buildings, maintenance facilities, passengerterminals, and operational structures being expanded, moved, and torndown. Thus, the nonstructural and lifeline components of airports, thoughoriginally designed to function after an earthquake, may be vulnerabletoday. A third problem is that these complex systems may haveremnants of systems that were designed to standards in effect at the timethey were installed, but that would not meet current standards. Thesystem is as vulnerable as its weakest link.
Problems with power and communications systems are particularlydisruptive, but can also be easily mitigated, using many of the techniqueson page 27.
The final major potential source of airport disruption is damage to theroad and highway transportation system that serves the airports. Criticalstaff (including air traffic controllers) needed to operate the airport maynot be able to get to work. Crews and materials (such as gravel andconcrete) necessary for airport runway and other repairs may beprevented from or delayed in reaching the airport. After the emergency,airport customers (including travelers and shipping companies) may notbe able to get to and from the airport. Transportation disruptions thatmay impact airport operations are varied.
Q The Oakland International Airport (OAK) is expected to be affectedby numerous road closures servicing its facilities in a number ofdifferent earthquake scenarios. These scenarios include earthquakeson various segments of the Hayward fault system in the east Bay, aswell as on more distant faults. As the highway interchanges in thevicinity of the airport are retrofitted, access problems are beingreduced. Remaining critical structures in the vicinity of the airportthat are still being retrofitted or waiting for replacement include the I-980 East Connector Viaduct, the Hwy. 24 West Connector Viaduct,the I-880 Distribution Structure, and the I-880/Rte.77/High St./SPRailroad Structure (personal communication, Rebecca Franti,Caltrans, Office of Earthquake Engineering). However, accessroutes to OAK will continue to be subject to disruption even after allstructural retrofits are completed. For example, pipelines are morelikely to rupture in areas subjected to liquefaction, and these pipelineruptures can cause roads to be closed. In addition, OAK accessroads are subjected to the threat of increased road closures indirectlydue to the effects of amplified ground shaking on buildings, sites
ISSUE 4 –Disruptions to theTransportation andFuel SystemsServing the Airports
ISSUE 3 –Power andCommunications Disruptions
24
containing hazardous materials, and other problems which willcontinue to affect access to the airport.
Q Similarly, the San Francisco International Airport (SFO) is expectedto be affected by numerous road closures servicing its facilities in anumber of different earthquake scenarios. Since the highwayinterchanges in the vicinity of the airport have been retrofitted, accessproblems are reduced. In addition, since most of the faults in the BayArea are closer to OAK than SFO, the access problems in theimmediate vicinity of the airport are less. On the other hand, many ofthose traveling to SFO cross one or more toll bridges in route to theairport. Thus, to the extent that retrofits on those bridges have notbeen completed, access problems will remain. Potential roaddisruptions due to amplified ground shaking will affect access to SFO,but probably not to the extent that OAK is impacted. As with OAK,those problems may include road closures due to building damage,hazardous materials spills, broken pipelines, and other reasons.
Q Hayward Airport and Moffett Field, while not experiencing quite asmany closures as OAK and SFO, will probably still be affected byseveral road closures.
Q Livermore, Buchanan, and Half Moon Bay airports are only affectedby major numbers of road closures should faults immediately adjacentto these facilities rupture. Thus, problems are most severe when thepotential role of these airports for emergency response is mostcritical.
Q Roads in the vicinity of San Jose International are also potentiallyaffected, particularly from larger earthquakes on the Hayward andSan Andreas faults. However, the extent of these problems is muchless severe, and the nature of the road network in the vicinity of theairport makes using alternate routes more practical. Thus,particularly after the completion of the runway improvementsdiscussed on page 18, SJC should be considered a more likely to befunctional than either SFO or OAK after a major Bay Areaearthquake.
We need to identify alternate locations capable of handling largecommercial and cargo jets after an earthquake should roadtransportation system disruptions make access to some airportsdifficult. Travis AFB will have increased air and vehicle traffic duringthe post-earthquake emergency response phase because the federalgovernment plans on using Travis AFB as the primary mobilization centerfor their response to the disaster. With the normal operations that Travishas in addition to this major role, emergency planners should not believethat Travis has additional capacity for other commercial or cargo needs. Options include neighboring commercial airports (Sacramento, Stockton,Monterey, etc.), as well as larger general aviation airports.
source –J. Villarin

25
One major problem may be fuel. Both SFO and OAK have jet fueldelivered to their facilities via the same jet fuel pipeline. SJC, however,depends on fuel being trucked to the facility over roads which may bedamaged. General aviation airports also have fuel trucked to theirfacilities. Disruptions in truck-based refueling over damaged roads, aswell as with disruptions to fuel pipelines, should be considered inemergency planning. These plans should also discuss jet fuel supplyissues should refinery sources be disrupted. Again, implementing manyof the mitigation strategies on page 27 may be useful.
22
222
THE AIRPORT SYSTEM IN AN EMERGENCY –WHAT ARE OUR CURRENT PROCEDURES?
By definition, an earthquake, like any disaster, disrupts the normal way inwhich business is conducted. There are, however, plans by various airportsand airport users on how airports will and should be used after anearthquake. The current system contains plans, both formal and informal,of:Q the Federal Aviation Administration;Q the three major international airports;Q other airports (including general aviation, out-of-region, and
military/federal airports); andQ airport users (including passenger carriers, air cargo carriers, disaster
services providers, and businesses).This section summarizes the extent of those activities in 2000.
The Federal Aviation Administration (FAA) has responsibility for themanagement of the nation’s air traffic system. The Airports Division ofFAA works with the Air Traffic, Flight Standards, Airways Facilities andLogistics Divisions to provide for the installation and maintenance offederal navigational equipment and Air Traffic Control facilities. FAAworks with City and county governments to construct airport runways,taxiways, and airport terminal facilities, and provides for the managementof airport transportation on a daily basis (J. Rodriguez, FAA, personalcommunication, 2000).
The Airports Division of the FAA keeps a record of airport facilities andemergency services contacts. In the event of a serious earthquake, the SanFrancisco Airports District Office will conduct a survey of the airportfacilities to assess damages and the need for federal funding for repairs forrunways/taxiways, airport access roads, and terminal/cargo facilities. Thepublic agencies that own and operate airports will be requested to submitgrant applications for reconstruction projects. Funding priority will begiven to runway/taxiway repairs and terminal areas needed to movepassengers, airfreight, and the U.S. mail (J. Rodriguez, FAA, personalcommunication, 2000).
The three international airports are required by the Federal AviationAdministration to prepare emergency plans. These three plans includeearthquake procedures. The specificity of those procedures, and the exactnature of those procedures, varies from airport to airport. In one case, theplan contains extensive checklists for use by airport personnel. Thechecklists streamline the decisions of personnel as they confirm theoperational status of the FAA air traffic control tower, fire station, runwaysurfaces and lighting, taxiway surfaces and lighting, signage, utilities(power, gas, propane, communications, water, generators, and fuel farm),access routes, and medical support resources. In another case, the planfocuses on coordination with other agencies, administrative procedures,procedures for the care and sheltering of passengers and employees, andmedical issues. In the third case, the emphasis of the earthquake portion of
Bay AreaInternational Airports
Federal AviationAdministration (FAA)
23
the plan is on duck-cover-hold procedures, as well as on evacuationprocedures.
The difficulty in writing an emergency plan results, in part, from the fourroles of that planning in an earthquake disaster:Q to protect employee and public safety during an earthquake (such as by
the use of duck-cover-hold emergency procedures);Q to provide for employee and public safety in the immediate aftermath
of the earthquake (such as plans for the medical care, feeding andsheltering on site of airport employees and passengers);
Q to ensure the most rapid return of the airport to a status where theairport can be used for the dispatch and delivery of emergencypersonnel and materials; and
Q to ensure the most rapid return to full operational status by the airport.
The existing plans could all be improved and expanded with moreextensive coordination among the three Bay Area airports, as well as withairport users, general aviation airports, military and federal airports, andairports outside the Bay Area.
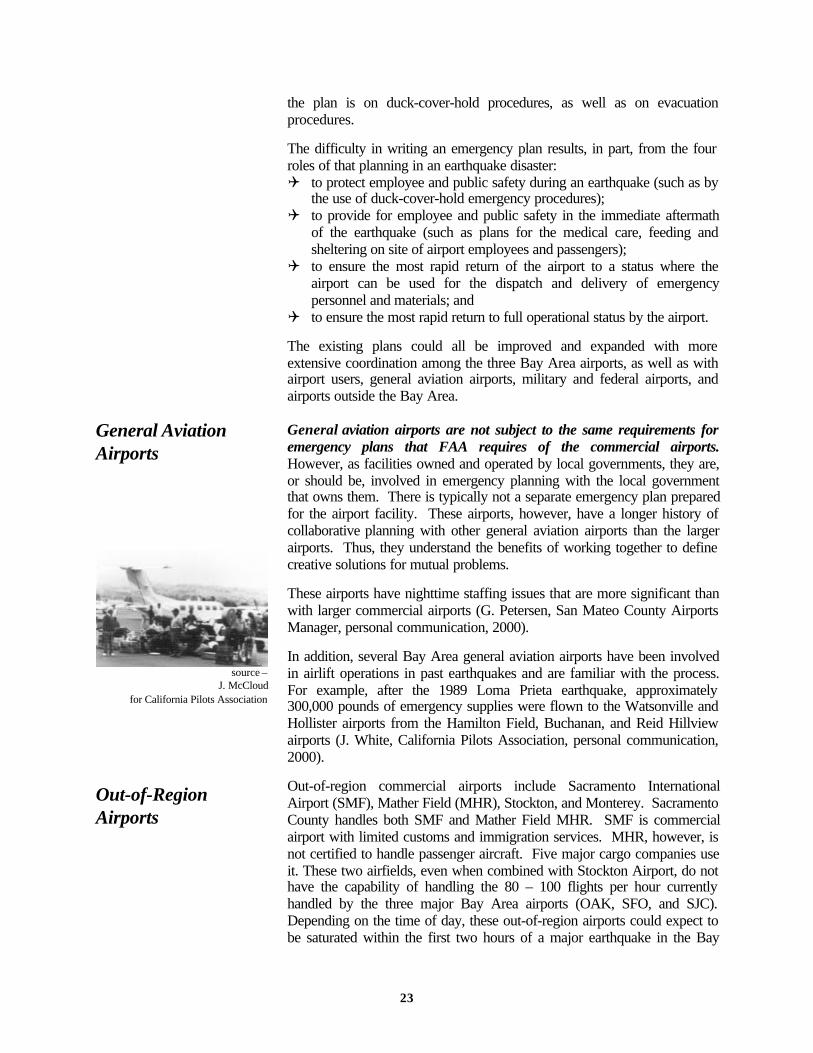
General aviation airports are not subject to the same requirements foremergency plans that FAA requires of the commercial airports.However, as facilities owned and operated by local governments, they are,or should be, involved in emergency planning with the local governmentthat owns them. There is typically not a separate emergency plan preparedfor the airport facility. These airports, however, have a longer history ofcollaborative planning with other general aviation airports than the largerairports. Thus, they understand the benefits of working together to definecreative solutions for mutual problems.
These airports have nighttime staffing issues that are more significant thanwith larger commercial airports (G. Petersen, San Mateo County AirportsManager, personal communication, 2000).
In addition, several Bay Area general aviation airports have been involvedin airlift operations in past earthquakes and are familiar with the process.For example, after the 1989 Loma Prieta earthquake, approximately300,000 pounds of emergency supplies were flown to the Watsonville andHollister airports from the Hamilton Field, Buchanan, and Reid Hillviewairports (J. White, California Pilots Association, personal communication,2000).
Out-of-region commercial airports include Sacramento InternationalAirport (SMF), Mather Field (MHR), Stockton, and Monterey. SacramentoCounty handles both SMF and Mather Field MHR. SMF is commercialairport with limited customs and immigration services. MHR, however, isnot certified to handle passenger aircraft. Five major cargo companies useit. These two airfields, even when combined with Stockton Airport, do nothave the capability of handling the 80 – 100 flights per hour currentlyhandled by the three major Bay Area airports (OAK, SFO, and SJC).Depending on the time of day, these out-of-region airports could expect tobe saturated within the first two hours of a major earthquake in the Bay
General AviationAirports
Out-of-RegionAirports
source –J. McCloud
for California Pilots Association
24
Area. Thus, major airport closures could expect to cause flight changesthroughout the western portions of the country (S. Soto, AirportFirefighting and Airports Operations, Sacramento County, personalcommunication, 2000).
In an emergency, the first actions of these airports will be to ensure thatthey can be safely operated. Thus, they plan to move emergency equipmentinto open areas, dispatch units to survey damage, and prepare foraftershocks. If damage occurs, priority will be given to lifesaving efforts,call for medical help as needed, and fire suppression action. As victims aresearched for, they anticipate that they may be involved in light rescueoperations and may need to call for heavy equipment to rescue trappedvictims. The airports will use mutual aid as needed, and use the airportpaging systems for self-help instructions. Finally, the airports plan toestablish access controls, organize multi-purpose staging areas, and set upfor cargo aircraft relief operations.
At Travis Air Force Base, the priority is their wartime mission to supportmilitary operations. However, a commercial aircraft declaring an in-flightemergency may land at Travis AFB. In addition, civil authorities maydesignate Travis AFB as a base support installation and FEMAMobilization Center. The rail lines servicing the base enhance theusefulness of the facility. In these instances, the facility will respond to atop-down request for support from FEMA. The AFB has begun toparticipate in disaster exercises. This has been a change in directive fromthe top air force command at the base (Lt. Col. R. Sandico, Travis AirForce Base, personal communication, 2000).
The cargo carriers are challenged even on a normal business day to getgoods delivered in the Bay Area due to the overstressed transportationnetwork. An earthquake would make many transit corridors unavailable.Given the “just-in-time” nature of business, companies now count on theircargo carriers to be a “mobile warehouse” for them. The package is not inthe back room, but in the back of a truck coming to them. Thus, it is thatmuch more important for cargo carriers to be in business after a disaster.Cargo carriers use the full transportation network, including airports, roads,and rail lines.
UPS has been a leader in developing a plan for earthquake response andrecovery. Their first priority is to protect employees and their familiesthrough drills, communications networks, meeting and evacuation points,and training for safety. The communications system includes radios forcommunications with employees at airports in and outside the region.Their second priority is to protect business assets, including securingcomputers to desktops, retrofitting hazardous older buildings, and workingwith customers to minimize their business disruption. Their third priority isto help the community they serve. In northern California, UPS plans toassist the Red Cross in logistics and with emergency support vehicles forthe first 7 – 10 days after a major earthquake. An unprepared business mayjoin the list of victims of the disaster. UPS plans to be a prepared businessand to be a resource for the community in time of need (D. Bullert, UPS,personal communication, 2000).
Travis Air Force Base
Air Cargo Carriers
25
The principal concern of a cargo carrier should an airport be shut down ishow that carrier can get to their equipment so that they can go to analternate airport. A secondary concern is setting up an alternate servicenetwork using a combination of alternate airports (such as Mather),alternative rail yards (such as Stockton rather than Richmond), and groundtransportation.
The passenger carriers have goals similar to the cargo carriers, for theywant to protect their employees and their assets, as well as to serve thecommunity. However, they have the additional concern that their “cargo”is people. The disaster created by an earthquake may be one of the moststressful, emotionally challenging, and physically exhausting events we willever experience. The stresses on carrier employees are particularly intenseas they struggle to meet the needs of the passengers. Thus, carriers such asSouthwest Airlines have developed guidelines for making the necessarydecisions in an emergency. These guidelines have been provided to allcarrier employees (C. Enriquez, Southwest Airlines, personalcommunication, 2000).
Some airlines view their responsibility to deliver passengers to an airport,not to care for and feed those passengers if they are stranded. This issueneeds to be addressed with collaborative planning among airports,passenger carriers, and disaster relief agencies.
To the extent that passenger flights are diverted to other airports, thesecarriers may be dependent on road-based transit to deliver passengers totheir destination.
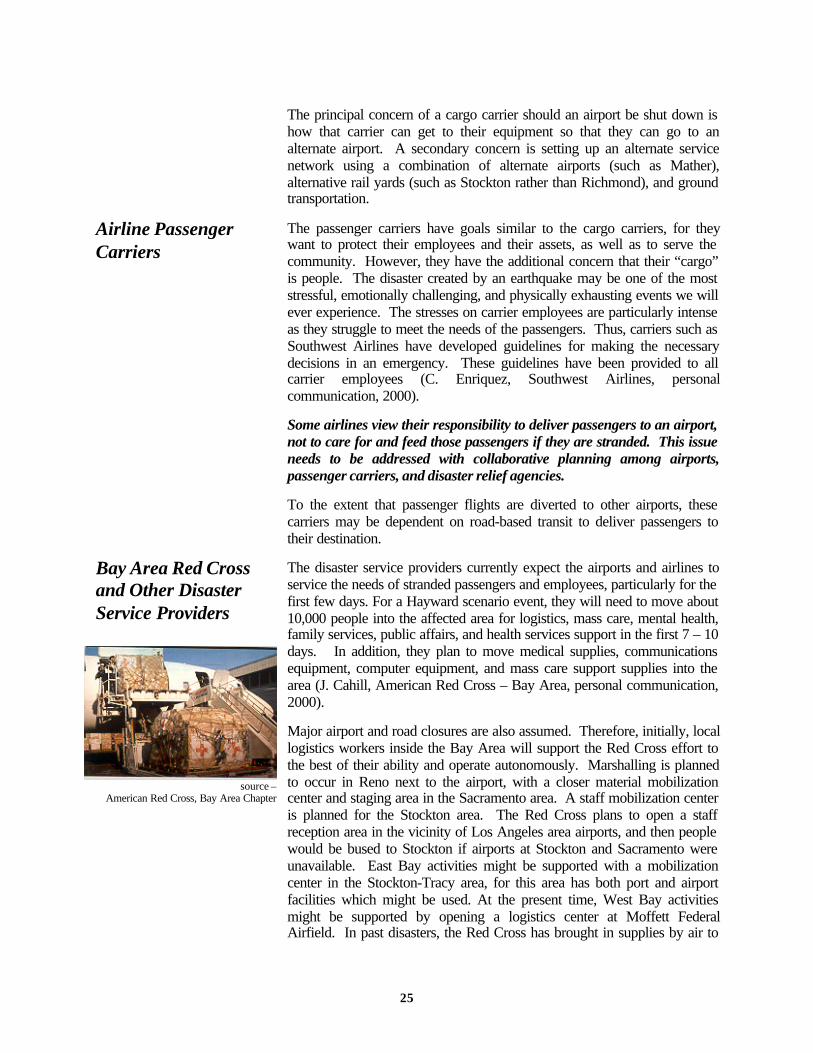
The disaster service providers currently expect the airports and airlines toservice the needs of stranded passengers and employees, particularly for thefirst few days. For a Hayward scenario event, they will need to move about10,000 people into the affected area for logistics, mass care, mental health,family services, public affairs, and health services support in the first 7 – 10days. In addition, they plan to move medical supplies, communicationsequipment, computer equipment, and mass care support supplies into thearea (J. Cahill, American Red Cross – Bay Area, personal communication,2000).
Major airport and road closures are also assumed. Therefore, initially, locallogistics workers inside the Bay Area will support the Red Cross effort tothe best of their ability and operate autonomously. Marshalling is plannedto occur in Reno next to the airport, with a closer material mobilizationcenter and staging area in the Sacramento area. A staff mobilization centeris planned for the Stockton area. The Red Cross plans to open a staffreception area in the vicinity of Los Angeles area airports, and then peoplewould be bused to Stockton if airports at Stockton and Sacramento wereunavailable. East Bay activities might be supported with a mobilizationcenter in the Stockton-Tracy area, for this area has both port and airportfacilities which might be used. At the present time, West Bay activitiesmight be supported by opening a logistics center at Moffett FederalAirfield. In past disasters, the Red Cross has brought in supplies by air to
Bay Area Red Crossand Other DisasterService Providers
Airline PassengerCarriers
source –American Red Cross, Bay Area Chapter
26
Moffett and stored them there until they can be separated and redistributed.However, as the air museum at Moffett expands, this space may not bereadily available. In addition, potential problems with runways discussedearlier may make use of this facility impractical. Travis AFB is beinglooked at as an alternate. The Red Cross is dependent on commercialshipping; food and other materials are typically trucked. The Red Crosshopes to continue to develop planning relationships with the airports,developing a liaison network which is useful to both the airports and theRed Cross, and integration of the American Red Cross needs into airportpriorities (J. Cahill, American Red Cross – Bay Area, personalcommunication, 2000).
As stated earlier when describing the role of cargo carriers, businesses haveconcerns about building and shipping and products. A typicalmanufacturing business relies on supplies from multiple companies that aretrucked to the manufacturing facility. In the high-tech businessenvironment of the San Francisco Bay Area, many of those parts aredelivered as airfreight. That facility then adds value by creating a morecomplex and complete product. Those products are then sent throughoutthe world for distribution. Thus, there is a highly complex “supply chain”network system just to build and distribute one product. Typicaldisruptions in this network include:Q problems with information (such as data inconsistencies);Q operational delays (such as a delay in delivery of parts similar to the
world-wide impact of the 1999 Taiwan earthquake on computercircuits); and
Q strategic issues (such as how to set up a design system to meetcustomer demands).
Information technology businesses in the Bay Area get supplies from allover the world, and distribute product throughout the world. Airport cargois an integral part of the logistical system. Companies such as AgilentTechnologies have a plan for what to do after a disaster, such as anearthquake, but realize that the success of that plan is highly dependent onthe particular affects of any earthquake (M. Ronstadt, AgilentTechnologies, personal communication, 2000). Back-up shipping systemsinclude use of barges to get product to and from airports, use of helicopters,and use of alternate airports outside of the region, such as Sacramento.Smaller businesses are typically not as sophisticated with their emergencyplanning as larger companies. They may easily experience disruptions incommunications that cause them to be unable to contact airports, theirsuppliers, and their distributors.
Businesses have several concerns after an earthquake related to productbeing shipped. Where is the product in the distribution channel? Can theproduct be expected to reach the customer? What kind of shape is theproduct in? If it is damaged, can you get it back to the manufacturer?Where will the product be held? Although there will be some delay that isexpected in the distribution system, it will not be long before cargocustomers will expect service to return to normal to allow the economy toreturn to normal.
Business Users
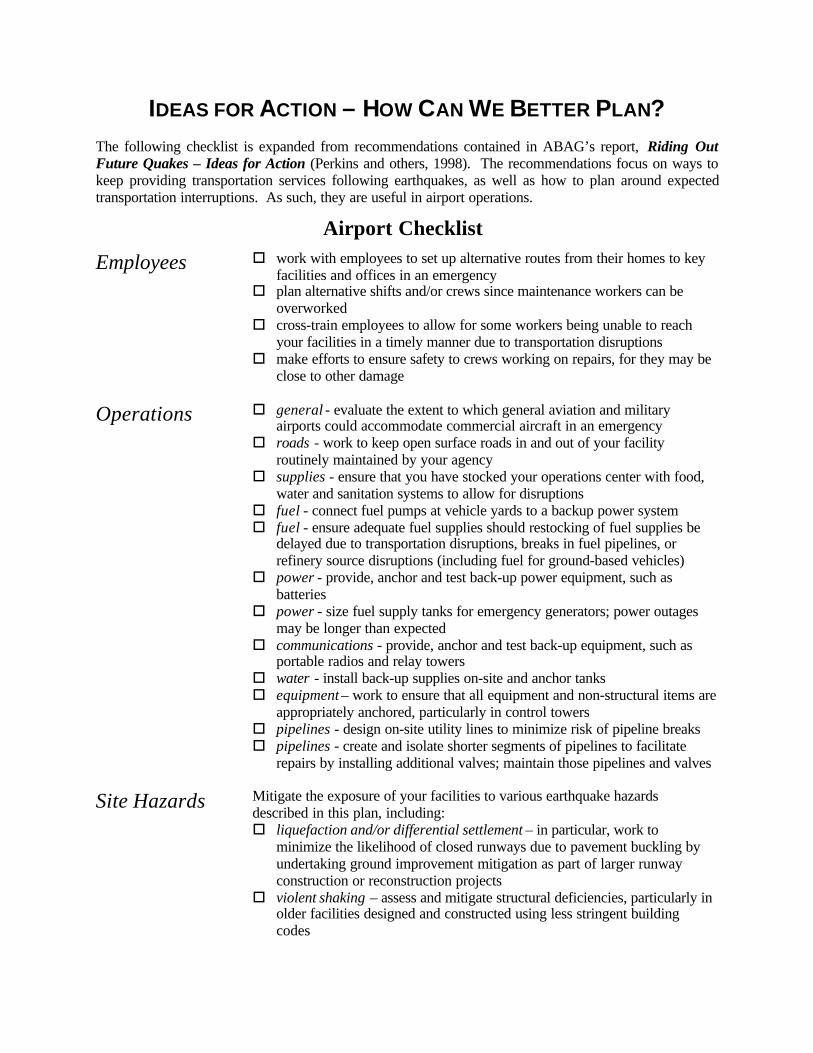
IDEAS FOR ACTION – HOW CAN WE BETTER PLAN?The following checklist is expanded from recommendations contained in ABAG’s report, Riding OutFuture Quakes – Ideas for Action (Perkins and others, 1998). The recommendations focus on ways tokeep providing transportation services following earthquakes, as well as how to plan around expectedtransportation interruptions. As such, they are useful in airport operations.
Airport Checklist
Employees o work with employees to set up alternative routes from their homes to keyfacilities and offices in an emergency
o plan alternative shifts and/or crews since maintenance workers can beoverworked
o cross-train employees to allow for some workers being unable to reachyour facilities in a timely manner due to transportation disruptions
o make efforts to ensure safety to crews working on repairs, for they may beclose to other damage
Operations o general - evaluate the extent to which general aviation and militaryairports could accommodate commercial aircraft in an emergency
o roads - work to keep open surface roads in and out of your facilityroutinely maintained by your agency
o supplies - ensure that you have stocked your operations center with food,water and sanitation systems to allow for disruptions
o fuel - connect fuel pumps at vehicle yards to a backup power systemo fuel - ensure adequate fuel supplies should restocking of fuel supplies be
delayed due to transportation disruptions, breaks in fuel pipelines, orrefinery source disruptions (including fuel for ground-based vehicles)
o power - provide, anchor and test back-up power equipment, such asbatteries
o power - size fuel supply tanks for emergency generators; power outagesmay be longer than expected
o communications - provide, anchor and test back-up equipment, such asportable radios and relay towers
o water - install back-up supplies on-site and anchor tankso equipment – work to ensure that all equipment and non-structural items are
appropriately anchored, particularly in control towerso pipelines - design on-site utility lines to minimize risk of pipeline breakso pipelines - create and isolate shorter segments of pipelines to facilitate
repairs by installing additional valves; maintain those pipelines and valves
Site Hazards Mitigate the exposure of your facilities to various earthquake hazardsdescribed in this plan, including:o liquefaction and/or differential settlement – in particular, work to
minimize the likelihood of closed runways due to pavement buckling byundertaking ground improvement mitigation as part of larger runwayconstruction or reconstruction projects
o violent shaking – assess and mitigate structural deficiencies, particularly inolder facilities designed and constructed using less stringent buildingcodes
EmergencyPlans
Ensure that the emergency plan for your facility covers the four roles of thatplanning process in an earthquake disaster:o to protect employee and public safety during an earthquake (such as by the
use of duck-cover-hold emergency procedures);o to provide for employee and public safety in the immediate aftermath of
the earthquake (such as plans for the medical care, feeding and shelteringon site of airport employees and passengers);
o to ensure the most rapid return of the airport to a status where the airportcan be used for the dispatch and delivery of emergency personnel andmaterials; and
o to ensure the most rapid return to full operational status by the airport.
Existing airport emergency plans could be improved and expanded withmore extensive coordination among the three Bay Area internationalairports, as well as with airport users, general aviation airports, military andfederal airports, and airports outside the Bay Area.
REFERENCES
Brady, Raymond J., and Perkins, Jeanne B., 1998. "Macroeconomic Effects of the Loma Prieta Earthquake" in TheLoma Prieta, California, Earthquake of October 17, 1989 - Recovery, Mitigation, and Reconstruction:U.S. Geological Survey Professional Paper 1553-D, Washington, DC, pp. D3-D16.
Earthquake Engineering Research Institute, 1995a. “Northridge Earthquake Reconnaissance Report, Vol. 1” inEarthquake Spectra : EERI Supplement C to v. 11 (April issue), Oakland, California, pp. 239.
Earthquake Engineering Research Institute, 1995b. The Kyogo-Ken Nanbu Earthquake – January 17, 1995 –Preliminary Reconnaissance Report: EERI, Oakland, California, pp. 1, 72.
Earthquake Engineering Research Institute, 1990. “Loma Prieta Reconnaissance Report” in Earthquake Spectra :EERI Supplement to v. 6 (May issue), Oakland, California, pp. 97, 274-283.
Editorial Committee on the Hanshin-Awaji Earthquake Disaster, 2000. “Chapter 5 – Airport and Air Transportation”in The Hanshin-Awaji Earthquake Disaster – Damage and Restoration of Transportation andAgriculture Facilities: Editorial Committee Report (in Japanese), pp. 257-266.
Engineering News Record, 2000. “Turkey’s Terminal Goes Seismic” in Engineering News Record : Article by Post,Nadine M., and Reina, Peter, Jan. 17, 2000. The McGraw-Hill Companies, Inc., Vol. 244 No. 2, pg. 12.
Knudsen, K.L., Sowers, J.M., Witter, R.C., and Helley, E.J., 2000. Map Showing Quaternary Geology andLiquefaction Susceptibility - San Francisco Bay Area, California: Final Technical Report to USGS–Award Number 1434-97-Gr-03121.
Metropolitan Transportation Commission, 2000a. Regional Airport System Plan (RASP) – Update 2000 – FinalReport: MTC, Oakland, California, pp. 23.
Metropolitan Transportation Commission, 2000b. Regional Airport System Plan (RASP) – Update 2000 – VolumeV – Environment and Traffic – “Airport Access”: MTC, Oakland, California, 9 pages + appendices.
Perkins, Jeanne B., 1998. On Shaky Ground – Supplement – A Guide to Assessing Impacts of Future EarthquakesUsing Ground Shaking Hazard Maps for the San Francisco Bay Area: ABAG, Oakland, CA, 28 pages.
Perkins, Jeanne B., and Boatwright, John, 1995. The San Francisco Bay Area -- On Shaky Ground: ABAG, Oakland,CA, 56 pages.
Perkins, Jeanne B., Chuaqui, Ben, and Wyatt, Edward, 1997. Riding Out Future Quakes: Pre-Earthquake Planningfor Post-Earthquake Transportation System Recovery in the San Francisco Bay Region: ABAG, Oakland,CA, 198 pages.
Perkins, Jeanne B., Mikulis, Kathleen, and Kirking, Brian, 1999a. Preventing the Nightmare – Designing a ModelProgram to Encourage Owners of Homes and Apartments to Do Earthquake Retrofits: ABAG:Oakland, 25 pp.
Perkins, Jeanne B., O’Donnell, Ian, Swierk, Rob, and Wyatt, Edward, 1999b. Riding Out Future Quakes – Ideas forAction – Improving Planning of Transportation Providers, Governments, Utilities and Businesses for Post-Earthquake Transportation Disruptions in the San Francisco Bay Region: ABAG, Oakland, CA, 52 pages.
Schiff, Anshel J., ed., 1995. Northridge Earthquake – Lifeline Performance and Post-Earthquake Response:Technical Council on Lifeline Earthquake Engineering Monograph No. 8, American Society of CivilEngineers, pp.227-235.
U.S. Geological Survey, 2000. Implications for Earthquake Risk Reduction in the United States from the Kocaeli,Turkey, Earthquake of August 17, 1999: USGS, Denver, 64 pages.
William Lettis & Associates (WLA), 1999. Evaluation of Earthquake-Induced Liquefaction Hazards at SanFrancisco Bay Area Commercial Airports: Prepared for ABAG, Walnut Creek, CA, 37 pages.
Working Group on California Earthquake Probabilities, 1999. Earthquake Probabilities in the San Francisco BayRegion: 2000 to 2030 – A Summary of Findings: U.S. Geological Survey Open-File Report 99-517, 55pages.
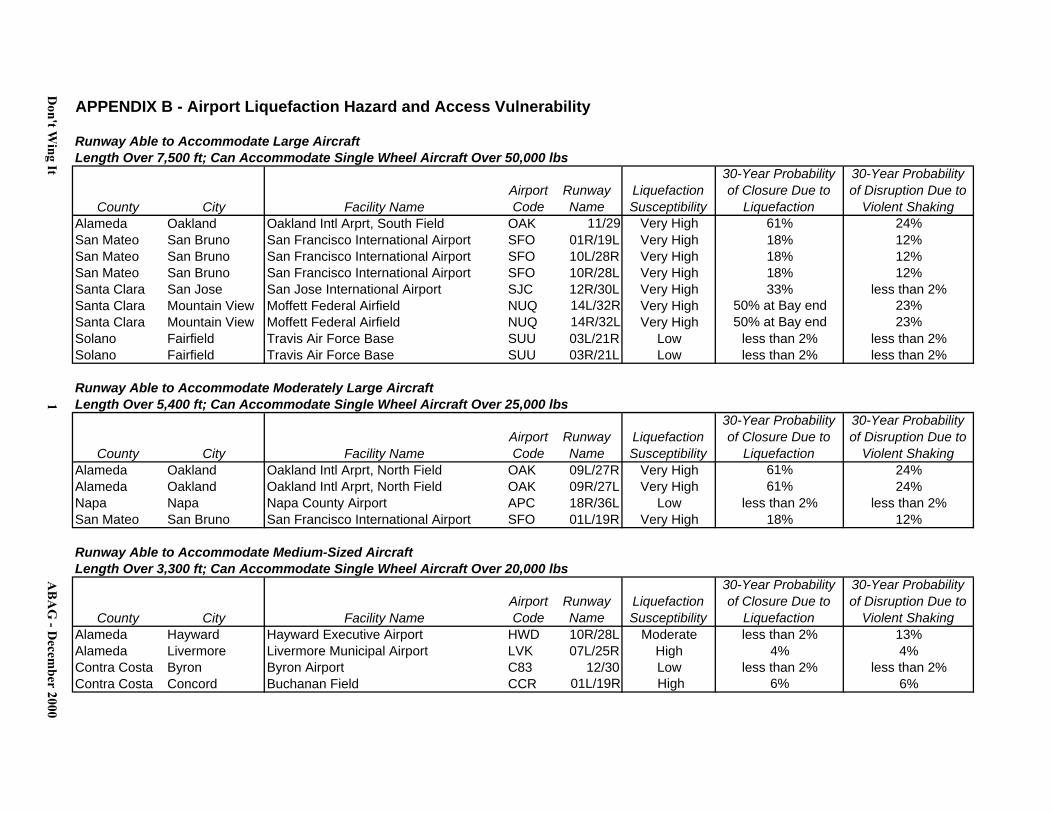
APPENDIX B - Airport Liquefaction Hazard and Access Vulnerability
Runway Able to Accommodate Large AircraftLength Over 7,500 ft; Can Accommodate Single Wheel Aircraft Over 50,000 lbs
County City Facility NameAirport Code
Runway Name
Liquefaction Susceptibility
30-Year Probability of Closure Due to
Liquefaction
30-Year Probability of Disruption Due to
Violent ShakingAlameda Oakland Oakland Intl Arprt, South Field OAK 11/29 Very High 61% 24%San Mateo San Bruno San Francisco International Airport SFO 01R/19L Very High 18% 12%San Mateo San Bruno San Francisco International Airport SFO 10L/28R Very High 18% 12%San Mateo San Bruno San Francisco International Airport SFO 10R/28L Very High 18% 12%Santa Clara San Jose San Jose International Airport SJC 12R/30L Very High 33% less than 2%Santa Clara Mountain View Moffett Federal Airfield NUQ 14L/32R Very High 50% at Bay end 23%Santa Clara Mountain View Moffett Federal Airfield NUQ 14R/32L Very High 50% at Bay end 23%Solano Fairfield Travis Air Force Base SUU 03L/21R Low less than 2% less than 2%Solano Fairfield Travis Air Force Base SUU 03R/21L Low less than 2% less than 2%
Runway Able to Accommodate Moderately Large AircraftLength Over 5,400 ft; Can Accommodate Single Wheel Aircraft Over 25,000 lbs
County City Facility NameAirport Code
Runway Name
Liquefaction Susceptibility
30-Year Probability of Closure Due to
Liquefaction
30-Year Probability of Disruption Due to
Violent ShakingAlameda Oakland Oakland Intl Arprt, North Field OAK 09L/27R Very High 61% 24%Alameda Oakland Oakland Intl Arprt, North Field OAK 09R/27L Very High 61% 24%Napa Napa Napa County Airport APC 18R/36L Low less than 2% less than 2%San Mateo San Bruno San Francisco International Airport SFO 01L/19R Very High 18% 12%
Runway Able to Accommodate Medium-Sized AircraftLength Over 3,300 ft; Can Accommodate Single Wheel Aircraft Over 20,000 lbs
County City Facility NameAirport Code
Runway Name
Liquefaction Susceptibility
30-Year Probability of Closure Due to
Liquefaction
30-Year Probability of Disruption Due to
Violent ShakingAlameda Hayward Hayward Executive Airport HWD 10R/28L Moderate less than 2% 13%Alameda Livermore Livermore Municipal Airport LVK 07L/25R High 4% 4%Contra Costa Byron Byron Airport C83 12/30 Low less than 2% less than 2%Contra Costa Concord Buchanan Field CCR 01L/19R High 6% 6%
Don't W
ing It1
AB
AG
- Decem
ber 2000
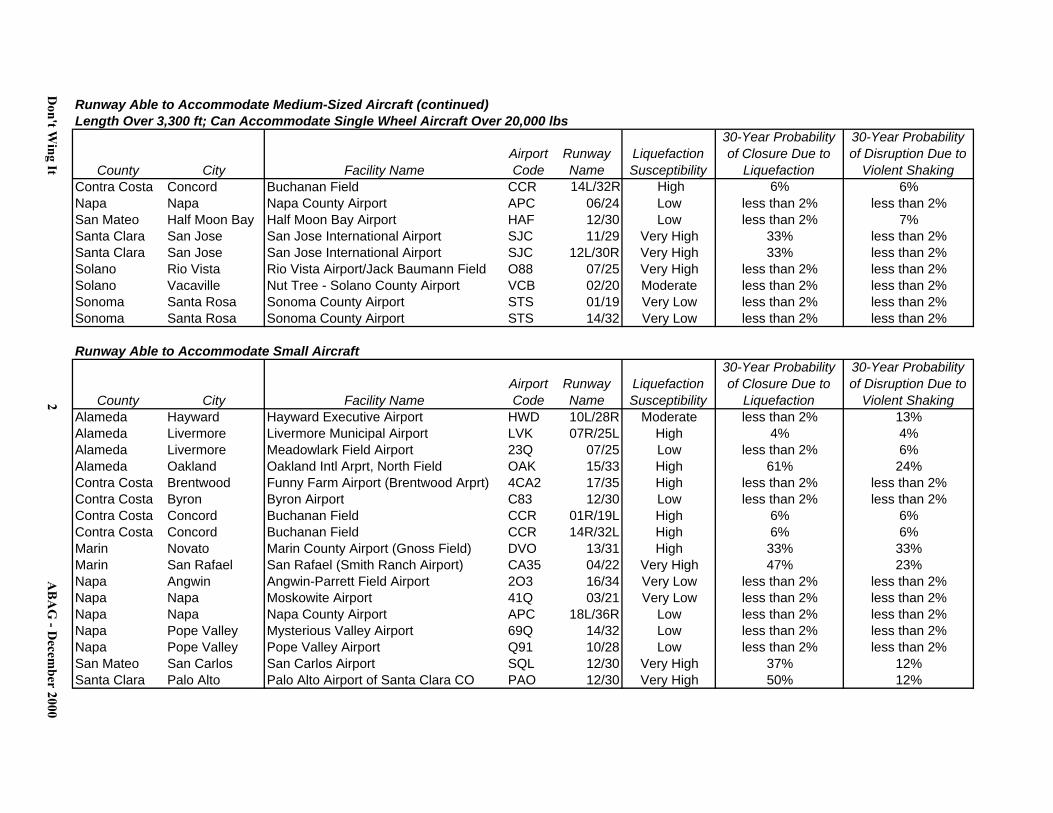
Runway Able to Accommodate Medium-Sized Aircraft (continued)Length Over 3,300 ft; Can Accommodate Single Wheel Aircraft Over 20,000 lbs
County City Facility NameAirport Code
Runway Name
Liquefaction Susceptibility
30-Year Probability of Closure Due to
Liquefaction
30-Year Probability of Disruption Due to
Violent ShakingContra Costa Concord Buchanan Field CCR 14L/32R High 6% 6%Napa Napa Napa County Airport APC 06/24 Low less than 2% less than 2%San Mateo Half Moon Bay Half Moon Bay Airport HAF 12/30 Low less than 2% 7%Santa Clara San Jose San Jose International Airport SJC 11/29 Very High 33% less than 2%Santa Clara San Jose San Jose International Airport SJC 12L/30R Very High 33% less than 2%Solano Rio Vista Rio Vista Airport/Jack Baumann Field O88 07/25 Very High less than 2% less than 2%Solano Vacaville Nut Tree - Solano County Airport VCB 02/20 Moderate less than 2% less than 2%Sonoma Santa Rosa Sonoma County Airport STS 01/19 Very Low less than 2% less than 2%Sonoma Santa Rosa Sonoma County Airport STS 14/32 Very Low less than 2% less than 2%
Runway Able to Accommodate Small Aircraft
County City Facility NameAirport Code
Runway Name
Liquefaction Susceptibility
30-Year Probability of Closure Due to
Liquefaction
30-Year Probability of Disruption Due to
Violent ShakingAlameda Hayward Hayward Executive Airport HWD 10L/28R Moderate less than 2% 13%Alameda Livermore Livermore Municipal Airport LVK 07R/25L High 4% 4%Alameda Livermore Meadowlark Field Airport 23Q 07/25 Low less than 2% 6%Alameda Oakland Oakland Intl Arprt, North Field OAK 15/33 High 61% 24%Contra Costa Brentwood Funny Farm Airport (Brentwood Arprt) 4CA2 17/35 High less than 2% less than 2%Contra Costa Byron Byron Airport C83 12/30 Low less than 2% less than 2%Contra Costa Concord Buchanan Field CCR 01R/19L High 6% 6%Contra Costa Concord Buchanan Field CCR 14R/32L High 6% 6%Marin Novato Marin County Airport (Gnoss Field) DVO 13/31 High 33% 33%Marin San Rafael San Rafael (Smith Ranch Airport) CA35 04/22 Very High 47% 23%Napa Angwin Angwin-Parrett Field Airport 2O3 16/34 Very Low less than 2% less than 2%Napa Napa Moskowite Airport 41Q 03/21 Very Low less than 2% less than 2%Napa Napa Napa County Airport APC 18L/36R Low less than 2% less than 2%Napa Pope Valley Mysterious Valley Airport 69Q 14/32 Low less than 2% less than 2%Napa Pope Valley Pope Valley Airport Q91 10/28 Low less than 2% less than 2%San Mateo San Carlos San Carlos Airport SQL 12/30 Very High 37% 12%Santa Clara Palo Alto Palo Alto Airport of Santa Clara CO PAO 12/30 Very High 50% 12%
Don't W
ing It2
AB
AG
- Decem
ber 2000
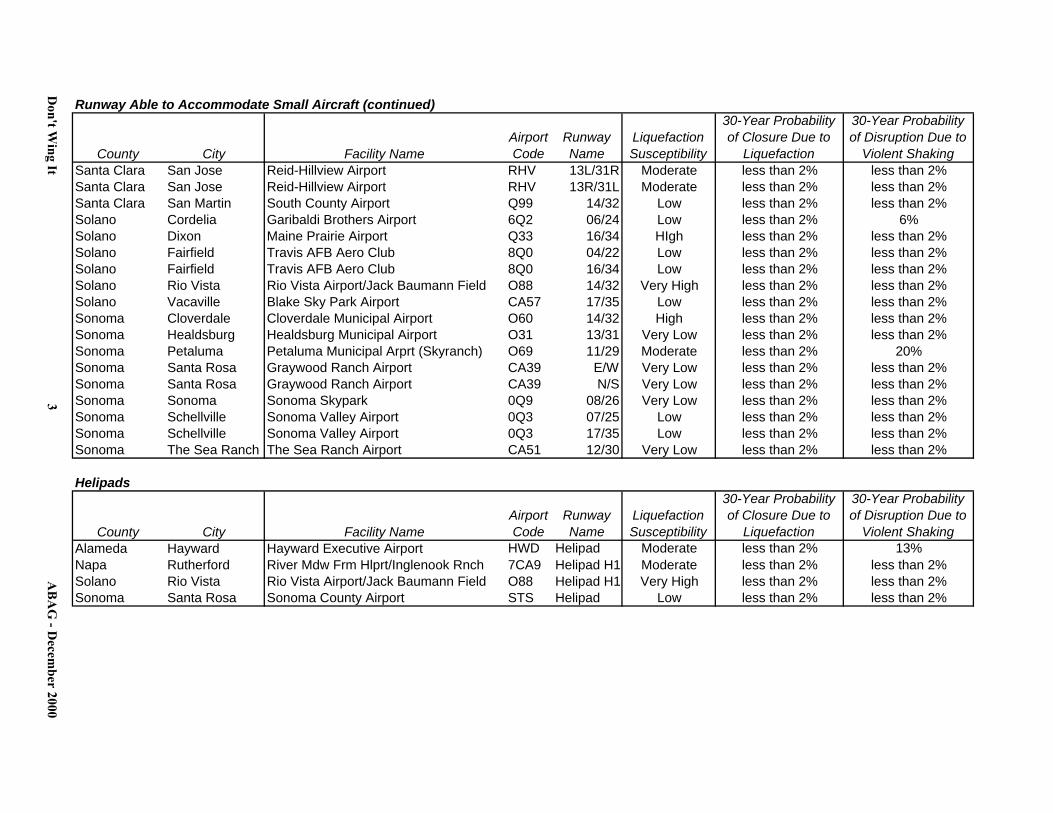
Runway Able to Accommodate Small Aircraft (continued)
County City Facility NameAirport Code
Runway Name
Liquefaction Susceptibility
30-Year Probability of Closure Due to
Liquefaction
30-Year Probability of Disruption Due to
Violent ShakingSanta Clara San Jose Reid-Hillview Airport RHV 13L/31R Moderate less than 2% less than 2%Santa Clara San Jose Reid-Hillview Airport RHV 13R/31L Moderate less than 2% less than 2%Santa Clara San Martin South County Airport Q99 14/32 Low less than 2% less than 2%Solano Cordelia Garibaldi Brothers Airport 6Q2 06/24 Low less than 2% 6%Solano Dixon Maine Prairie Airport Q33 16/34 HIgh less than 2% less than 2%Solano Fairfield Travis AFB Aero Club 8Q0 04/22 Low less than 2% less than 2%Solano Fairfield Travis AFB Aero Club 8Q0 16/34 Low less than 2% less than 2%Solano Rio Vista Rio Vista Airport/Jack Baumann Field O88 14/32 Very High less than 2% less than 2%Solano Vacaville Blake Sky Park Airport CA57 17/35 Low less than 2% less than 2%Sonoma Cloverdale Cloverdale Municipal Airport O60 14/32 High less than 2% less than 2%Sonoma Healdsburg Healdsburg Municipal Airport O31 13/31 Very Low less than 2% less than 2%Sonoma Petaluma Petaluma Municipal Arprt (Skyranch) O69 11/29 Moderate less than 2% 20%Sonoma Santa Rosa Graywood Ranch Airport CA39 E/W Very Low less than 2% less than 2%Sonoma Santa Rosa Graywood Ranch Airport CA39 N/S Very Low less than 2% less than 2%Sonoma Sonoma Sonoma Skypark 0Q9 08/26 Very Low less than 2% less than 2%Sonoma Schellville Sonoma Valley Airport 0Q3 07/25 Low less than 2% less than 2%Sonoma Schellville Sonoma Valley Airport 0Q3 17/35 Low less than 2% less than 2%Sonoma The Sea Ranch The Sea Ranch Airport CA51 12/30 Very Low less than 2% less than 2%
Helipads
County City Facility NameAirport Code
Runway Name
Liquefaction Susceptibility
30-Year Probability of Closure Due to
Liquefaction
30-Year Probability of Disruption Due to
Violent ShakingAlameda Hayward Hayward Executive Airport HWD Helipad Moderate less than 2% 13%Napa Rutherford River Mdw Frm Hlprt/Inglenook Rnch 7CA9 Helipad H1 Moderate less than 2% less than 2%Solano Rio Vista Rio Vista Airport/Jack Baumann Field O88 Helipad H1 Very High less than 2% less than 2%Sonoma Santa Rosa Sonoma County Airport STS Helipad Low less than 2% less than 2%
Don't W
ing It3
AB
AG
- Decem
ber 2000