Embed Size (px)
Citation preview
1
(Don’t) try this at home!
The effects of recording devices and software on phonetic analysis
Abstract
Because of restrictions on in-person research due to Covid-19, researchers are now relying on
remotely recorded data to a much greater extent than has been typical in previous work. Given
the change in methodology, it is important to know how remote recording might alter the
acoustic signal, either based on different recording devices used by participants and consultants
recording themselves or based on video-conferencing software used to make interactive
recordings. This study investigates audio signal fidelity across different in-person recording
equipment and remote recording software when compared to a solid-state digital recording
device that is representative of the standard used in-person for elicitation and fieldwork. We
show that the choice of equipment and software can have a large effect on acoustic
measurements, including measurements of frequency, duration, and noise. The issues do not just
reflect decreased reliability of measurements; some measurements are systematically shifted in
particular recording conditions. These results show the importance of carefully considering and
documenting equipment choices. In particular, any cross-linguistic or cross-speaker comparison
needs to account for possible effects of differences in which devices or software platforms were
used.
2
1 Introduction1
1.1 Overview: fieldwork in a pandemic
Human subjects compliance boards across various institutions restricted approval of protocols
for in-person research for much of 2020, and at the time of writing many of these restrictions are
still in place. For this reason, and also for the safety of research participants, many researchers
have decided to either postpone phonetic elicitation or turn to alternative methods involving the
use of remote recordings. This has led to a rapid and dramatic shift in the types of technologies
used for phonetic elicitation both in fieldwork and other linguistic research, as well as language
documentation more broadly. In order to use the data collected online, it is necessary to know
how the recording device and recording software might impact acoustic measurements.
While in-person linguistic fieldwork has primarily used digital recording equipment for 15 years
or more (cf. Bird and Simons 2003; Maddieson 2001; Podesva and Zsiga 2013), the use of video-
conferencing or social media software applications for primary fieldwork has not been
widespread until this year, a result of restrictions on travel and in-person interactions in response
to COVID-19 pandemic. Remote recording technology is readily accessible and there are many
different methods which can be used. Prior to the pandemic, the types of technology used for
linguistic documentation and archiving had already started to shift away from solid-state
recorders in favor of more easily accessible technologies, such as smartphones (cf. Bird et al
2014; Goldman et al 2014). It has long been noted that compression (van Son 2005), technical
differences (e.g. transmission over telephone lines; Künzel 2001; Rathcke et al 2017, and cell
phones; Gold 2009) all affect measurements of the speech signal (in more or less predictable
ways). However, to our knowledge, there is no study which systematically tests the acoustic
impact of recent internet-based video conferencing programs in order to establish new best
practices for language documentation and sociolinguistic research (cf. Leemann et al 2020).
Furthermore, though these considerations have been discussed in technical phonetics venues, it
appears that this knowledge is less commonly discussed among endangered language
researchers. Therefore, our aim is both to make these issues more transparent and to suggest
some best practices for researchers suddenly faced with the shift to online recording.
1 Acknowledgement footnote removed
3
Without testing of this type, we do not know how the data that we archive today encodes
artefacts from these different technologies, and how comparable contemporary datasets are to
materials digitized from analog collections. In particular, the rapid shift to online fieldwork
raises questions, including whether this remotely recorded data is comparable to data collected
in-person, as well as what differences are likely to be present. While some acoustic signals may
be less affected by differences in recording method (e.g. duration of consonants or vowels), other
types of measurements are likely to be more sensitive to differences between methods and
devices. For example, because the center of gravity (COG) in fricatives measures aperiodic
noise, background noise can influence these measurements, particularly in spectrally diffuse
fricatives like [f]. A high degree of background noise could thus substantially alter the COG of
[f], while fricatives with denser spectral peaks exhibit less of an influence from background
noise. Measurement issues that disproportionately impact certain sounds thus might not only
alter the raw measurements but also the evidence for contrasts.
In this paper, we report the results of a two-phase experimental data gathering study which tests
the impact of recording equipment and software applications on the recording output of linguistic
data. In the first phase, we gathered a single acoustic sample on six commonly available
technological devices. In the second phase, we recorded speech played over popular video
conferencing applications in order to test the effects of that software on the audio.2 These
methods were devised to highlight possible interactions between signal intake through a device,
signal transmission, and signal processing through different software. We compared these
recordings against a digitally recorded “gold standard” solid state recording. We found that some
remote recording methods produce acoustic signals that statistically resemble the solid-state
audio, whereas other remote recording methods produce audio that significantly differs from the
solid-state audio recordings. While identification of contrasts remains clear in the majority of
cases, the raw measurements are substantially altered for many characteristics, including
duration, intensity, and spectral measurements. This raises issues for work on comparative
2 There are several factors which fall beyond the scope of this study such as the effects of technology on inter-speaker, genre (see Hall-Lew and Boyd 2017), and formality differences (see Sneller 2021). As a result, we do not make any claims about these results in comparison to other studies.

4
phonetic typologies or sociolinguistic research which relies on the comparisons of acoustic data
from different sources.
We begin with an overview of digital speech recording (Section 1.2). The design for our tests is
described in Section 2. We briefly summarize the results of tests in Section 3. Finally, in Section
4 we discuss the implications of our results for remote fieldwork, both during the pandemic and
in the future. The supplementary materials provide fuller discussion and analysis of the statistical
results.
1.2 Digital speech recording
When speech is recorded digitally, the air vibrations that comprise the speech signal are encoded
as a set of binary data that can be read by the computer, reconverted to audio and played through
speakers, and otherwise manipulated.3 The raw acoustic signal can be frequently sampled,
producing accurate reproductions. However, doing so creates large files. There is a tradeoff
between high fidelity and bandwidth choking when sending large amounts of audio and video
traffic over the internet. Moreover, parts of the spectrum can be compressed without loss of
comprehensibility to the average user.
Turning to the effects on online recording on speech, there are several types of acoustic signal
manipulation which are likely to introduce variation: (1) different types of compression; (2)
different types of filters introduced by software programs; and (3) different sampling rates. We
describe each of these below.
Audio compression can be lossless (that is, encoded in such a way that recorded information is
fully recoverable) or lossy, where parts of the signal are irretrievably compressed. Both types of
codecs are in common use (cf. Drude et al 2011; Bowern 2015:18–36). Compression may be
vertical (compressing parts of the sound spectrum but not affecting timing), or horizontal, where,
for example, silence is compressed. Compression also occurs within the speech signal; of course,
any alterations in timing can cause issues in any frequency measurements, because frequency is
3 For more information about this process, see Zölzer (2008), Lyons (2011), and Lyons & Fugal (2014).
5
defined by timing. Compression can cause large jumps in frequency measurements like f0,
formants, and center of gravity, as well as smaller shifts in these measurements (van Son 2005;
de Decker & Nycz 2015; Nash 2001).
Compression is often not uniform across the entire signal, but identifies repeating wave patterns;
a repeating cycle is mostly redundant information that can be reconstructed from more reduced
information. Compression systems often include some assumptions about the signal, such as
using this type of frequency-based compression (Sun, Mkwawa, Jammeh, & Ifeachor 2013);
while this can improve perceptual clarity, it does not necessarily preserve all of the acoustic cues
that will be relevant for phonetic analysis. Variable bit demand between frames can exaggerate
or eliminate spectral valleys, altering formants, f0, and spectral tilt (Liu, Hsu, & Lee 2008).
Although codecs usually have anti-aliasing filters to prevent conversion of frequencies that are
higher than the sampling rate can measure, this does not prevent the system from misidentifying
the frequency and altering the signal based on the assumed frequency.
Some internet-based recordings filter out background noise and feedback (e.g. echos from the
microphone picking up signal from the device’s speakers4), which also decreases the amount of
information that needs to be sent and may improve the listening experience for individuals.
However, manipulations to reduce noise may also alter acoustic measurements depending on
how the algorithm identifies noise and what frequencies are attenuated or amplified. This kind of
audio manipulation may also come from the device itself. For example, some sound cards now
include audio manipulation (e.g. boosting or depressing certain frequencies).
Finally, digital audio can be sampled at different rates. The sampling rate may be constrained by
a variety of factors, such as the type of microphone that is used or the recording device itself.
Historically, different linguistic subfields have established different standards of recorded signal
fidelity. Within sociolinguistics, major documentation projects such as the Atlas of North
American English (Labov, Ash, & Boberg 2006) have made use of telephone-quality recordings
4 For example, https://support.zoom.us/hc/en-us/articles/360046244692-Background-noise-suppression describes some of Zoom’s background noise suppression techniques.
6
which have a sampling rate around 8kHz/s.5 It has long been considered best practice in language
documentation to use a sampling rate around 44.1 kHz/s, in order to create high-quality
recordings, even if lower quality would be adequate for the goals of the project. This is because
researchers cannot anticipate how future language records might be used; subsequent research
questions might require recordings with a high sampling rate. Projects which do not require the
higher sampling rate can always employ a technique called downsampling.
Downsampling is the audio equivalent of reducing resolution in an image file, and refers to how
frequently the audio spectrum is sampled. In addition to reducing the precision in temporal
measurements, lower sampling rates limit what frequencies can be measured, thus leading to loss
of information at higher frequencies (Johnson 2008). Most speech information, such as vowel
formant structure, is at lower frequencies (below 4000 Hz), and will not be obscured by lower
sampling rates. Other information, such as fricative frequency structure, is encoded in higher
frequencies and can be sensitive to sampling rate (Johnson 2008:22–23). In particular, fricatives
often make use of a measurement called the center of gravity (COG) (Gordon, Barthmaier, and
Sands 2002). To get a sense of how sampling rate can affect fricatives, we will revisit the point
made above about sampling rate standards used in different fields of linguistics. The standard
sampling rate over telephone lines, as sometimes used in sociolinguistic studies, is around
8kHz/s, whereas the standard audio recording sample rate from a solid-state recorder is usually
44.1kHz/s (cf. recommendations in field linguistics textbooks such as Bowern 2015). Fricatives
like [s] have spectral energy which exceeds 8kHz, meaning that some of the energy of the [s] is
cut off over the phone, but these frequencies are retained in a standard audio recording.
Sociolinguistic studies that use telephone recordings generally do not focus on fricative
contrasts, but rather on vowel contrasts (Labov, Ash, & Boberg 2006:4), which are not as
affected by the lower sampling rate. Even if a sound remains perceptually clear at lower
sampling rates, cutting off higher frequencies will result in lower COG measurements.
Variation in the quality of the online recording can arise either from the software program used
or from the device used. The variation may arise via (1) different types of compression,
5 See Leemann et al. (2020) for a discussion of cellphone data collection and best practices for online interviewing in a sociolinguistic context.

7
particularly variable rate compression that may preserve data optimized for human speech but at
the expense of manipulating the signal irrecoverably; (2) artefacts in the signal introduced
through equipment noise, poor shielding, or through the background filters introduced by
software programs; or (3) different sampling rates. This, of course, is in addition to all the issues
about audio recording that fieldworkers are familiar with based on the circumstances of
recording, such as background noise, microphone placement, and the recording environment
(see, for example, Barwick 2006; Bowern 2015; Seyfeddinipur and Rau 2020).
2 Methods
In this section we describe methods used to record and compare speech across multiple recording
devices and software programs. Given the proliferation of recording devices and software for
audio recording and sharing through social media, there are potentially limitless combinations of
apps, software, and devices to test. Our aim was not to produce a comprehensive set of
comparisons; that would not be feasible. Instead, we chose software applications and recording
equipment that are already commonly used, and we focused tests on those choices most likely to
impact the audio signal. For example, we made sure to test solid state recording equipment (the
“gold standard” of in-field recording) vs. cellular telephones, but we did not test different types
of solid state recorders. On the software side, we tested local recordings versus remote recording,
but did not additionally test files which were locally recorded through a device and then
uploaded remotely.
Language users cannot repeat language utterances identically from production event to
production event, and background noise may differ across production events. Therefore, we
could not simply record the same speakers sequentially on different devices, because each
recording could introduce new variation. Instead, we constructed a two-phase setup so that all
comparisons occur between multiple recordings of the same production event. In Phase 1, each
speaker produced a set of stimuli while all devices recorded simultaneously. In Phase 2, the
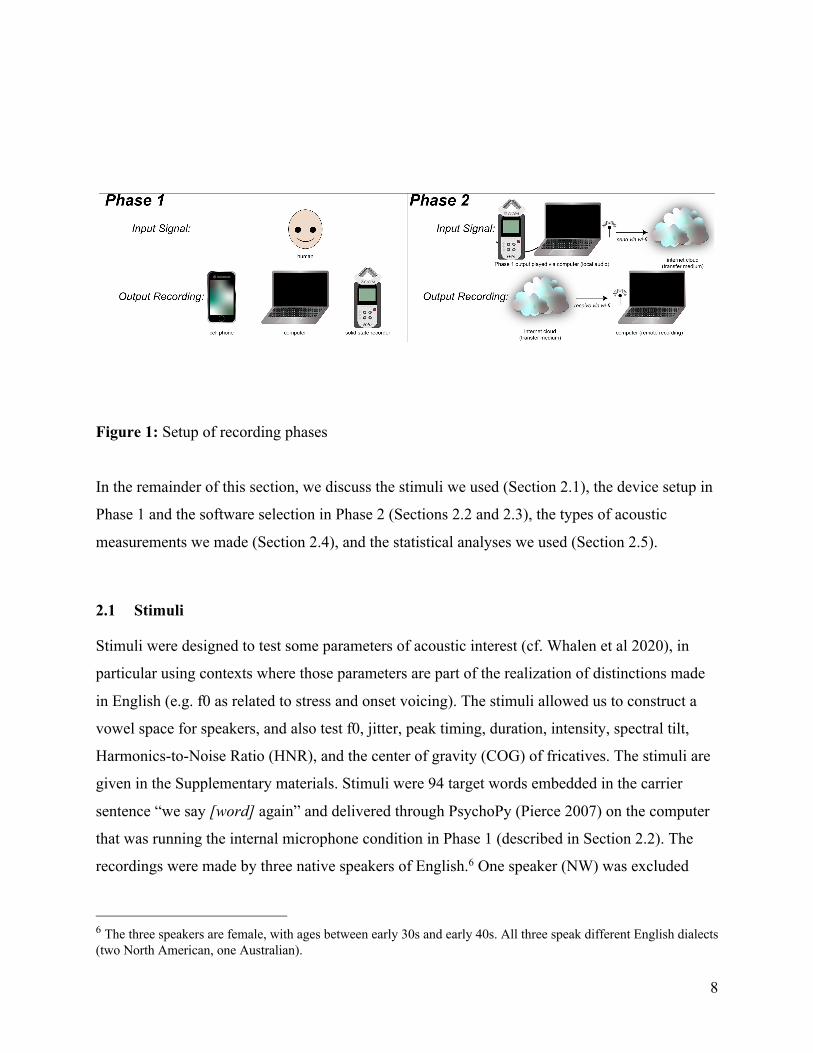
recording from the solid-state recorder was used as the input to each software. Figure 1
summarizes the different recording conditions and the setup is described in more detail in
Sections 2.2 and 2.3 below.
8
Figure 1: Setup of recording phases
In the remainder of this section, we discuss the stimuli we used (Section 2.1), the device setup in
Phase 1 and the software selection in Phase 2 (Sections 2.2 and 2.3), the types of acoustic
measurements we made (Section 2.4), and the statistical analyses we used (Section 2.5).
2.1 Stimuli
Stimuli were designed to test some parameters of acoustic interest (cf. Whalen et al 2020), in
particular using contexts where those parameters are part of the realization of distinctions made
in English (e.g. f0 as related to stress and onset voicing). The stimuli allowed us to construct a
vowel space for speakers, and also test f0, jitter, peak timing, duration, intensity, spectral tilt,
Harmonics-to-Noise Ratio (HNR), and the center of gravity (COG) of fricatives. The stimuli are
given in the Supplementary materials. Stimuli were 94 target words embedded in the carrier
sentence “we say [word] again” and delivered through PsychoPy (Pierce 2007) on the computer
that was running the internal microphone condition in Phase 1 (described in Section 2.2). The
recordings were made by three native speakers of English.6 One speaker (NW) was excluded
6 The three speakers are female, with ages between early 30s and early 40s. All three speak different English dialects (two North American, one Australian).
9
from the statistical tests of the by-device comparisons (Phase 1) due to a recording error with one
device.
2.2 Device setup (Phase 1)
As briefly discussed above, we used a sample of convenience for recording equipment, and did
not attempt to include all possible configurations of internal and external microphones and types
of devices. We tested an array of commonly used devices, such as Macs, PCs, tablets, cellular
phones, and handheld recorders. All devices were in airplane mode and running on battery
power. Table S1 in the supplementary materials gives the specifications of the items that were
tested. The recording took place in a quiet room in an otherwise empty building, but with some
street noise. Three speakers of English with different regional dialects recorded the stimuli
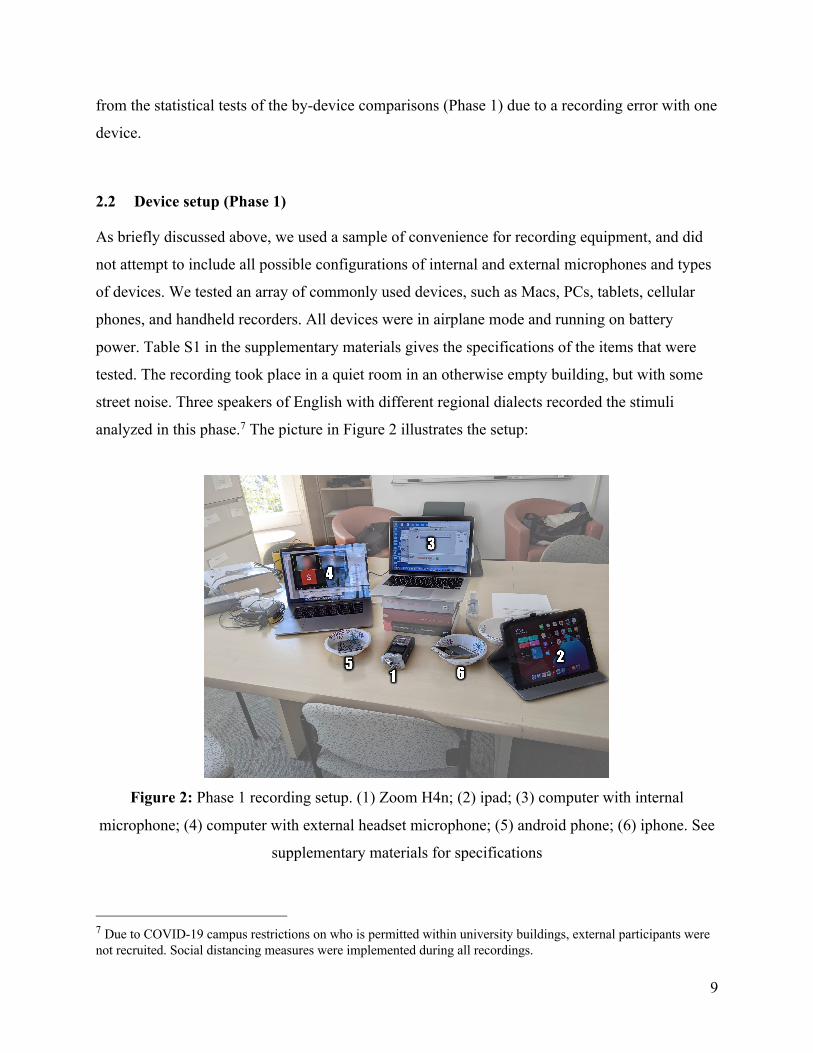
analyzed in this phase.7 The picture in Figure 2 illustrates the setup:
Figure 2: Phase 1 recording setup. (1) Zoom H4n; (2) ipad; (3) computer with internal
microphone; (4) computer with external headset microphone; (5) android phone; (6) iphone. See
supplementary materials for specifications
7 Due to COVID-19 campus restrictions on who is permitted within university buildings, external participants were not recruited. Social distancing measures were implemented during all recordings.
10
2.3 Software selection (Phase 2)
The second phase was carried out remotely to test recordings made over the internet. This
involved two researchers, mimicking the combination of the “local” and “remote” recordings of
a fieldwork consultant. In each case, the recordings made with the Handy Zoom H4n (“H4n”8)
solid state recorder in the first phase were played through the sound card of a 2012 Macbook Air
(where the H4n was recognized by the computer as an external microphone). The H4n was
connected to the computer using a TRRS connector cable attached to the headphone/line-out jack
of the H4n and the microphone/headphone combined jack in the Macbook Air. While this is not
equivalent to recording live speech, it does ensure that identical signals were transmitted across
each remote recording condition. The input from the H4n was recorded uncompressed at 44,100
Hz through the H4n’s internal microphones. The output was governed by the settings of the
software programs being used.
The software programs which were tested were: Zoom, Skype, Facebook Messenger (using the
free program Audacity to make the recording, since Messenger does not have built-in recording
capabilities), and Cleanfeed, a commonly used podcast interview platform.
2.4 Acoustic measurements
The software and devices used to make these recordings produce audio files in several different
formats. All audio files were converted to 16,000 Hz uncompressed mono wav files, because this
is the format required for forced alignment through p2fa. The audio files were then trimmed so
that only the speech of the experiment was kept. These recordings were force-aligned to the
segmental level using the p2fa forced alignment scripts described by Evanini et al (2009), which
aligns at a resolution of 10ms.9 These recordings were inspected for major alignment errors (of
which there were none) but were not further corrected. We only used the data from the target
words (not the carrier phrases) in these analyses.
8 While these devices are typically referred to as “Zoom” recorders, we call this the H4n recorder to distinguish it from the video conferencing software Zoom, which has no relationship to the solid state recorder. 9 Because all files used the same speech input, it would be, in theory, possible to manually correct a single set of “gold standard” alignments from the H4n recording and use the correctly aligned version in all experiment conditions. However, in practice this is impossible, because the different lossy compression algorithms introduced by different recorders leads in practice to non-identical file lengths. This is further discussed in Section 3.
11
The acoustic characteristics measured were: Duration, F1, F2, F3, Center of Gravity (COG),
jitter, f0 mean, f0 peak timing, spectral tilt (H1-H2), Harmonics-to-Noise ratio (HNR), and
intensity. Measurements were extracted using scripts in Praat (Boersma & Weenink 2017). All
measurements are means taken across the whole interval, except characteristics that are a single
point by definition (e.g. time of the f0 peak). Phonation measurements were calculated using
Voice Report with the following parameters: start, end, 65, 350, 1.3, 1.6, 0.03, 0.45. For COG,
fricatives were extracted with Hanning windows to create the spectral objects for analysis.
Formants were analyzed with a maximum frequency setting of 5500 Hz for 5 formants.
Signal to noise ratio was calculated across the intervals marked as “silence” in the forced
alignment versus those marked for the target words that were analyzed for the acoustic
characteristics described above. The signal to noise ratio calculations compared the intervals
labeled as silence by the alignment algorithm versus those in the carrier phrases. These were then
averaged across each recording condition.
2.5 Statistical analyses
All statistical results are from mixed effects models calculated with the lme4 package in R (Bates
et al 2015). The p-values were calculated by the lmerTest package (Kuznetsova et al 2015). The
reference condition, which the other conditions were compared against, was always the H4n
recorder.
3 Results
Here we summarize the main results. For reasons of space and legibility, only an overview is
presented, and more thorough discussion of each condition is provided in the supplementary
materials. Section 3.1 provides a general overview of the key findings about variation between
devices and software programs and presumes minimal familiarity with phonetic measures.
Section 3.2 discusses the results of individual acoustic measurements, while Section 3.3. presents
an overview of findings with respect to recovery of data for contrasts.
12
When reading the results, the size of the effects and the significance must be interpreted with
respect to the somewhat small amount of data. Lack of significance cannot be interpreted as
indicating that there is no real effect, and some of the estimates are large despite not being
significant, suggesting a high degree of variability. This overview should be read in conjunction
with the supplementary materials, which provides further discussion of all of these points
(Supplementary Materials). We concentrate here on a description of the results that will be
accessible to linguists who do not use quantitative methods extensively in their work but whose
work is affected by recording choices.
3.1 Summary of results
While our set of measurements is not exhaustive, we cover several types of measurements that
exhibit effects of recording condition. These can broadly be grouped into measurements of
duration, measurements of intensity in aperiodic noise, and measurements of frequency.
First, as seen in more detail in Section 3.2, duration measurements seem to be affected by the
compression algorithms used in m4a formats. The effects on duration are likely influenced both
directly by lossy compression effects on timing and also indirectly when boundary assignment is
obscured by noise and lowered intensity of the signal. While manual segmentation would likely
reduce the latter effects, they would not be fully eliminated, and the compression-based effects
could not be improved at all.
Second, there are also differences in levels of background noise, efficacy in capturing the speech
signal, and filtering meant to remove background noise or boost the speech signal. Lowered
signal-to-noise ratios, either due to higher intensity of noise or lowered intensity of the signal,
directly impacts measurements like the Harmonics-to-Noise ratio (HNR) and center of gravity
(COG). Changes in noise and intensity also have indirect effects in identification of segment
boundaries and measurement of other characteristics that depend on being able to isolate the
target characteristic of the speech signal.
13
Lastly, there are changes in measurements of frequency, observed in f0 and formants. These are
likely the result of lossy compression; depending on how the compression system handles
repeating waves, these could be over-regularized or obscured. Compression that alters the file’s
duration will also produce changes in spectral measurements. Some of the spectral issues may
also be caused by changes in intensity, as some recording conditions are less sensitive to certain
frequency ranges, which can subsequently change how formants and f0 are identified. Of course,
changes in intensity of different frequencies is also directly reflected in spectral tilt effects. Such
differences are also likely to affect perceptual clarity, making fieldwork using remote recordings
more difficult and making transcription less reliable.
There were a larger number of significant differences between software programs than between
devices. Intensity and signal to noise ratio measures differed significantly among devices, but
most other measures are not significantly different. As noted above, however, though the
differences were not all statistically significant, we did find measurement differences, that is, raw
differences in the measurements of variables beyond what one might expect. The software
choices also led to differences in intensity, signal to noise ratio, and duration measurements.
Finally, we found that we were, in almost all cases, able to recover evidence for the phonemic
distinctions which were tracked (such as stressed versus unstressed vowels, voicing differences,
and vowel space measurements to capture vowel differences). However, the raw measurements
of the distinctions varied, in some cases substantially.
3.2 Individual Acoustic Metrics
Table 2 below summarizes the different measures in the Phase 1 recordings, testing differences
based on recording device. Asterisks indicate significance levels at < 0.05 (*), < 0.01 (**), or <
0.001 (***). When a test was significant, then the direction of significance is also indicated in
that table cell.
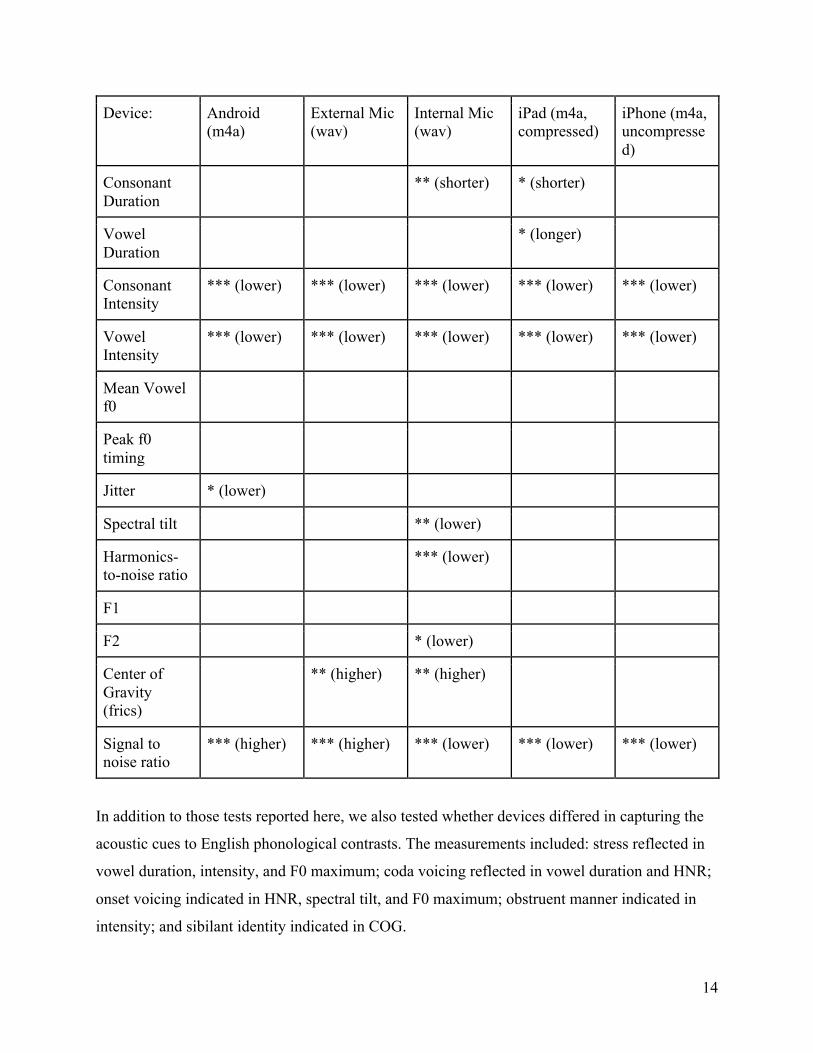
Table 2: Effects of device on acoustic measures. Empty cells indicate that the condition did not
differ significantly from the Zoom H4n solid state recording in the given characteristic.
14
Device: Android (m4a)
External Mic (wav)
Internal Mic (wav)
iPad (m4a, compressed)
iPhone (m4a, uncompressed)
Consonant Duration
** (shorter) * (shorter)
Vowel Duration
* (longer)
Consonant Intensity
*** (lower) *** (lower) *** (lower) *** (lower) *** (lower)
Vowel Intensity
*** (lower) *** (lower) *** (lower) *** (lower) *** (lower)
Mean Vowel f0
Peak f0 timing
Jitter * (lower)
Spectral tilt ** (lower)
Harmonics-to-noise ratio
*** (lower)
F1
F2 * (lower)
Center of Gravity (frics)
** (higher) ** (higher)
Signal to noise ratio
*** (higher) *** (higher) *** (lower) *** (lower) *** (lower)
In addition to those tests reported here, we also tested whether devices differed in capturing the
acoustic cues to English phonological contrasts. The measurements included: stress reflected in
vowel duration, intensity, and F0 maximum; coda voicing reflected in vowel duration and HNR;
onset voicing indicated in HNR, spectral tilt, and F0 maximum; obstruent manner indicated in
intensity; and sibilant identity indicated in COG.
15
Few measurements of these contrasts are significantly altered by device, though both the internal
computer mic and external computer mic conditions overestimated the difference between the
COG of /s/ and /ʃ/. However, most contrasts were maintained in the recordings, as further
discussed below.
Consonant duration was significantly shorter than the baseline standard in the
InternalComputerMic condition and the iPad condition. The existence of differences in duration
might suggest that other factors are impacting how the forced aligner determines boundaries;
most of the overall estimates as well as the estimates for individual segments are within about 10
ms, which is close to the margin of error of the forced aligner (Evanini et al 2009; see
supplementary materials). It is also possible that some effects on duration reflect actual
differences in duration measurements within the file, through lossy compression warping the
signal in different ways. This is, however, unlikely. The Android and iPad were recorded with
compressed audio, while the iPhone condition was not. However, the iPad results are almost
identical to the Internal Computer Microphone, which (like the external computer mic) used
Audacity to record the audio. Therefore it is unlikely that compression algorithms alone are
responsible for the differences. The differences in consonant duration seen in the table above
appear to be largely offset by the differences in vowel duration. That is, those conditions where
the vowels are shorter are the same ones where the consonants are longer. This implies that the
issue is a difference in boundary placement identification rather than compression. Note,
moreover, that the magnitude of the effects is overall quite small (as detailed in the
supplementary materials).
Our gold standard recording did not have a particularly high signal to noise ratio, compared to
some of the other recording devices used in the live recording condition. This is probably due in
part to the sensitivity of the H4n’s microphone and picking up background noise from the air
conditioning system and external traffic noise. The SNR can also be influenced by the distance
of each recording device from the speaker. SNR values varied by speaker in the gold standard
recording. They also varied by both device and software program, implying that software adjusts
internal volume levels.

16
Table 3 below summarizes the different measures in the Phase 2 recordings, testing differences
based on the software application used. The models comparing these conditions used only one of
the conditions that we recorded with Zoom software, because there were no significant
differences between using different settings in Zoom (compressed or ‘original’ sound, or audio
channel extracted from the video vs separate audio channel). The Zoom condition reported was
recorded locally with the default audio settings.
Table 3: Effects of device on acoustic measures. Empty cells indicate that the condition did not
differ significantly from the H4n solid state recording in the given characteristic.
Application Audacity (wav)
Cleanfeed (wav)
Messenger (wav)
Skype (.mp4) Zoom (.wav)
Consonant Duration
***(shorter) ***(shorter) ***(shorter)
Vowel Duration
***(longer) ***(longer) ***(longer)
Consonant Intensity
***(lower) ***(lower) ***(lower) ***(lower)
Vowel Intensity
***(lower) ***(lower) ***(lower) ***(lower)
Mean Vowel f0
Peak f0 timing
**(later)
Jitter
Spectral tilt **(underestimate)
**(underestimate)
***(overestimate)
**(underestimate)
***(underestimate)
Harmonics-to-noise ratio
***(higher)
F1 *(lower)
F2 *(higher)
17
Center of Gravity (frics)
**(lower) *(higher)
Signal to noise ratio
*** (higher) *** (higher) *** (higher) *** (higher)
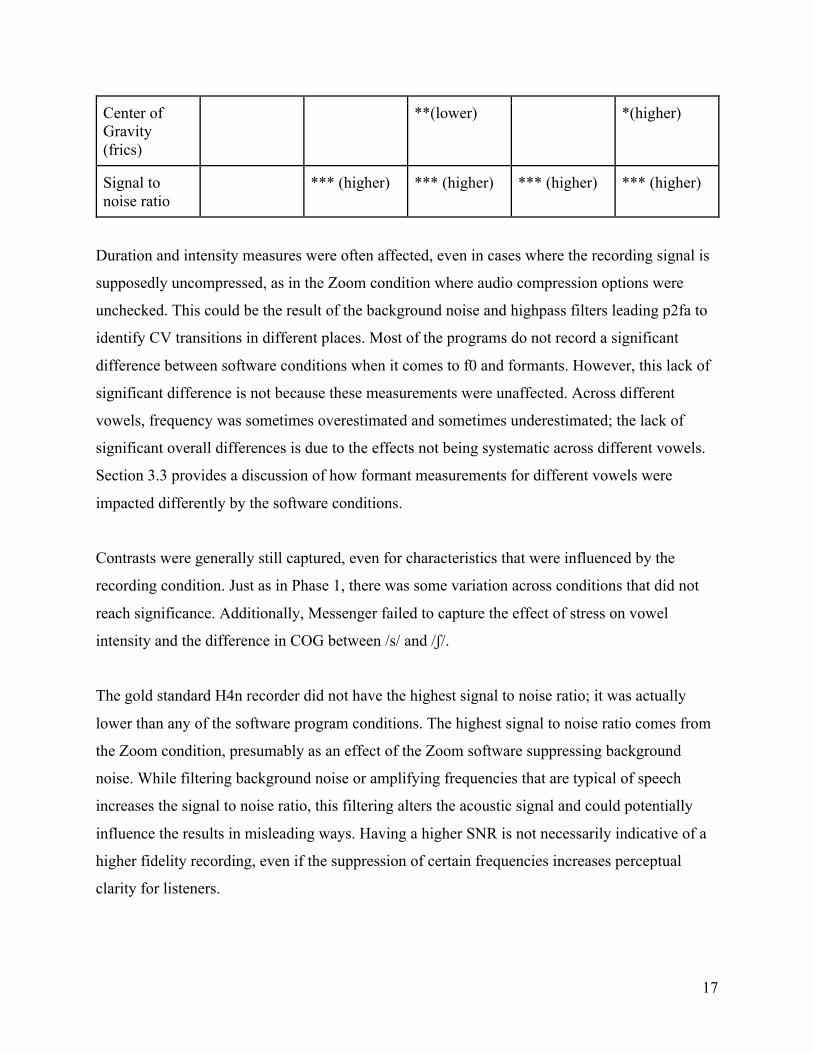
Duration and intensity measures were often affected, even in cases where the recording signal is
supposedly uncompressed, as in the Zoom condition where audio compression options were
unchecked. This could be the result of the background noise and highpass filters leading p2fa to
identify CV transitions in different places. Most of the programs do not record a significant
difference between software conditions when it comes to f0 and formants. However, this lack of
significant difference is not because these measurements were unaffected. Across different
vowels, frequency was sometimes overestimated and sometimes underestimated; the lack of
significant overall differences is due to the effects not being systematic across different vowels.
Section 3.3 provides a discussion of how formant measurements for different vowels were
impacted differently by the software conditions.
Contrasts were generally still captured, even for characteristics that were influenced by the
recording condition. Just as in Phase 1, there was some variation across conditions that did not
reach significance. Additionally, Messenger failed to capture the effect of stress on vowel
intensity and the difference in COG between /s/ and /ʃ/.
The gold standard H4n recorder did not have the highest signal to noise ratio; it was actually
lower than any of the software program conditions. The highest signal to noise ratio comes from
the Zoom condition, presumably as an effect of the Zoom software suppressing background
noise. While filtering background noise or amplifying frequencies that are typical of speech
increases the signal to noise ratio, this filtering alters the acoustic signal and could potentially
influence the results in misleading ways. Having a higher SNR is not necessarily indicative of a
higher fidelity recording, even if the suppression of certain frequencies increases perceptual
clarity for listeners.
18
3.3 Combined Acoustic Metrics
While the previous section discussed absolute measurements of a range of acoustic phenomena,
in this section we examine another facet of the data: how clearly phonetic cues to phonological
contrasts are separated in each condition. That is, are features of the speech signal that mark
phonological contrasts sufficiently recoverable to allow linguists to do phonological
documentation? A few contrasts are presented here as examples; the full results testing the
measurement of contrasts are given in the Supplementary Materials.10
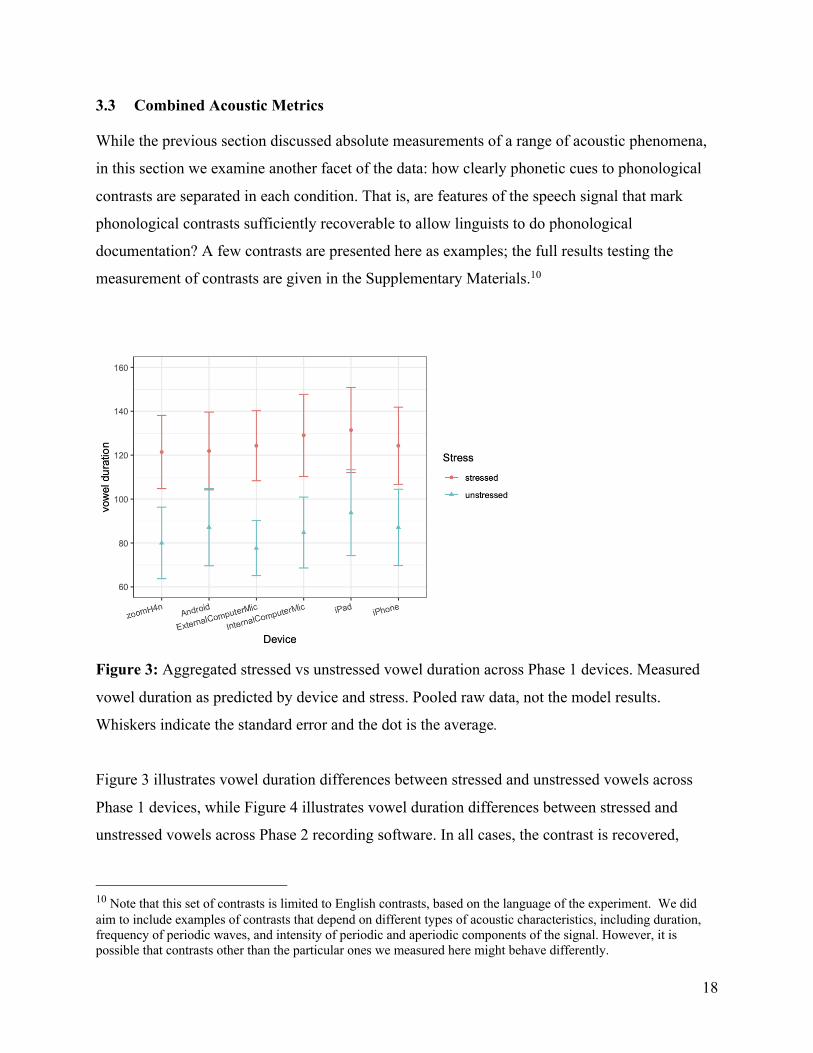
Figure 3: Aggregated stressed vs unstressed vowel duration across Phase 1 devices. Measured
vowel duration as predicted by device and stress. Pooled raw data, not the model results.
Whiskers indicate the standard error and the dot is the average.
Figure 3 illustrates vowel duration differences between stressed and unstressed vowels across
Phase 1 devices, while Figure 4 illustrates vowel duration differences between stressed and
unstressed vowels across Phase 2 recording software. In all cases, the contrast is recovered,
10 Note that this set of contrasts is limited to English contrasts, based on the language of the experiment. We did aim to include examples of contrasts that depend on different types of acoustic characteristics, including duration, frequency of periodic waves, and intensity of periodic and aperiodic components of the signal. However, it is possible that contrasts other than the particular ones we measured here might behave differently.
19
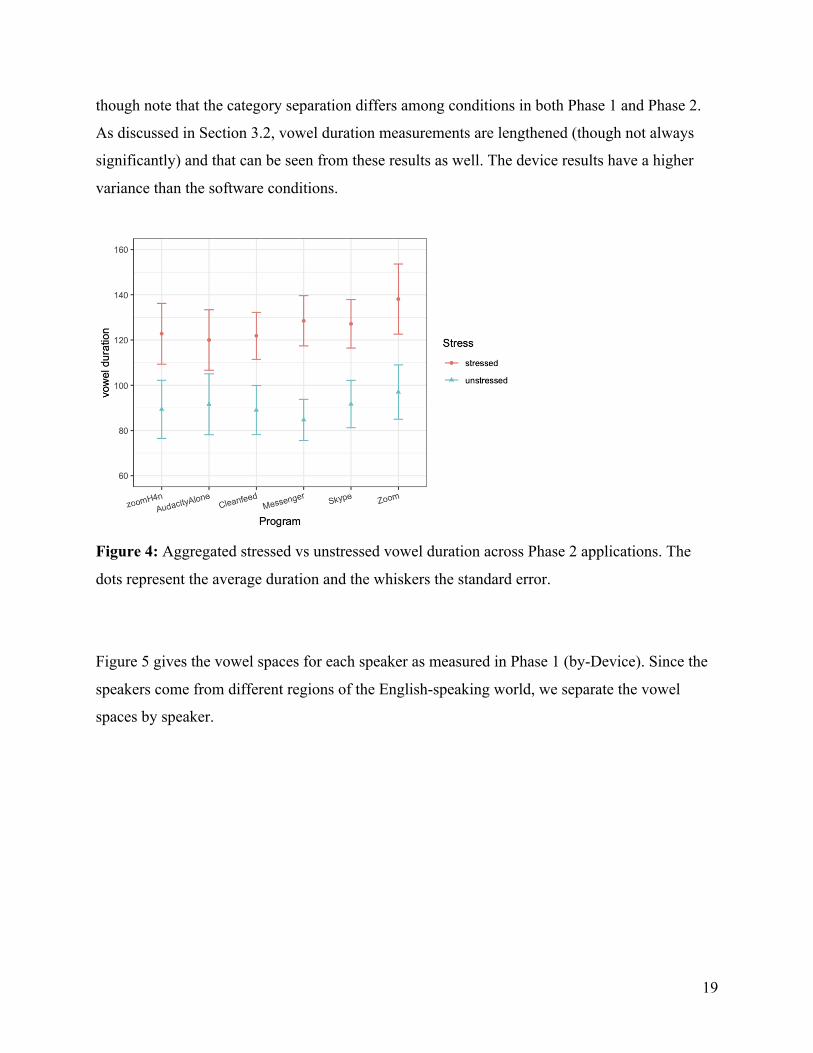
though note that the category separation differs among conditions in both Phase 1 and Phase 2.
As discussed in Section 3.2, vowel duration measurements are lengthened (though not always
significantly) and that can be seen from these results as well. The device results have a higher
variance than the software conditions.
Figure 4: Aggregated stressed vs unstressed vowel duration across Phase 2 applications. The
dots represent the average duration and the whiskers the standard error.
Figure 5 gives the vowel spaces for each speaker as measured in Phase 1 (by-Device). Since the
speakers come from different regions of the English-speaking world, we separate the vowel
spaces by speaker.
20
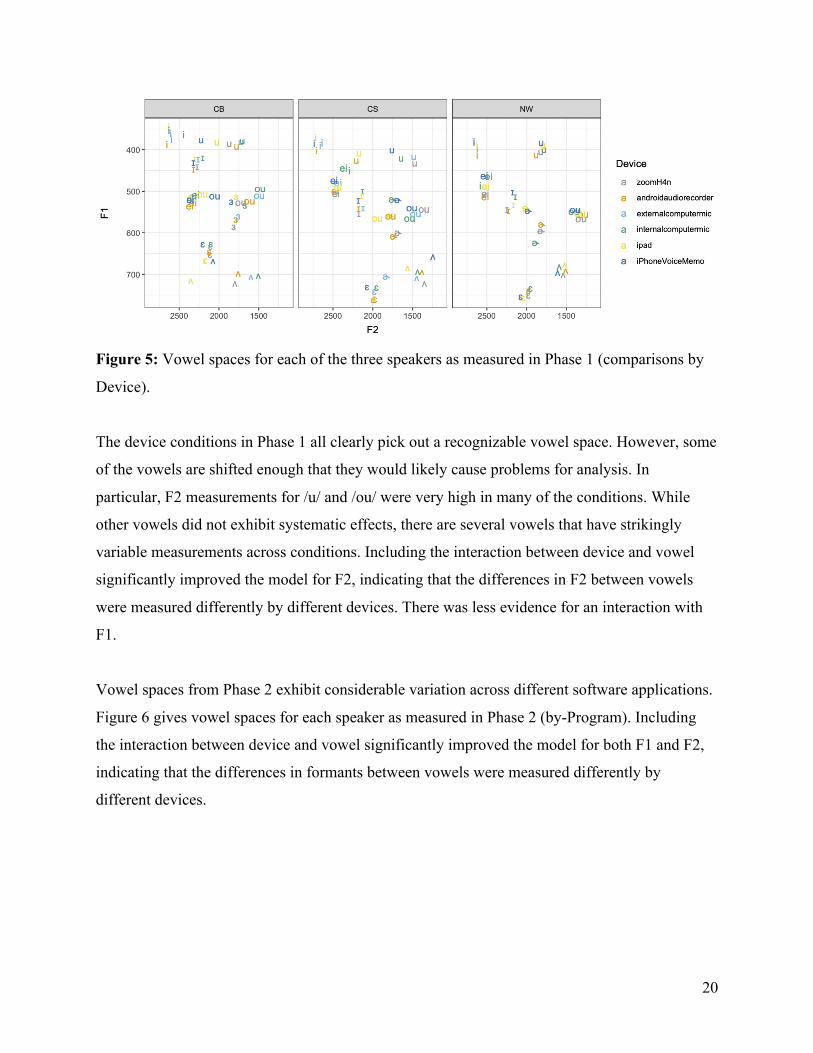
Figure 5: Vowel spaces for each of the three speakers as measured in Phase 1 (comparisons by
Device).
The device conditions in Phase 1 all clearly pick out a recognizable vowel space. However, some
of the vowels are shifted enough that they would likely cause problems for analysis. In
particular, F2 measurements for /u/ and /ou/ were very high in many of the conditions. While
other vowels did not exhibit systematic effects, there are several vowels that have strikingly
variable measurements across conditions. Including the interaction between device and vowel
significantly improved the model for F2, indicating that the differences in F2 between vowels
were measured differently by different devices. There was less evidence for an interaction with
F1.
Vowel spaces from Phase 2 exhibit considerable variation across different software applications.
Figure 6 gives vowel spaces for each speaker as measured in Phase 2 (by-Program). Including
the interaction between device and vowel significantly improved the model for both F1 and F2,
indicating that the differences in formants between vowels were measured differently by
different devices.
21
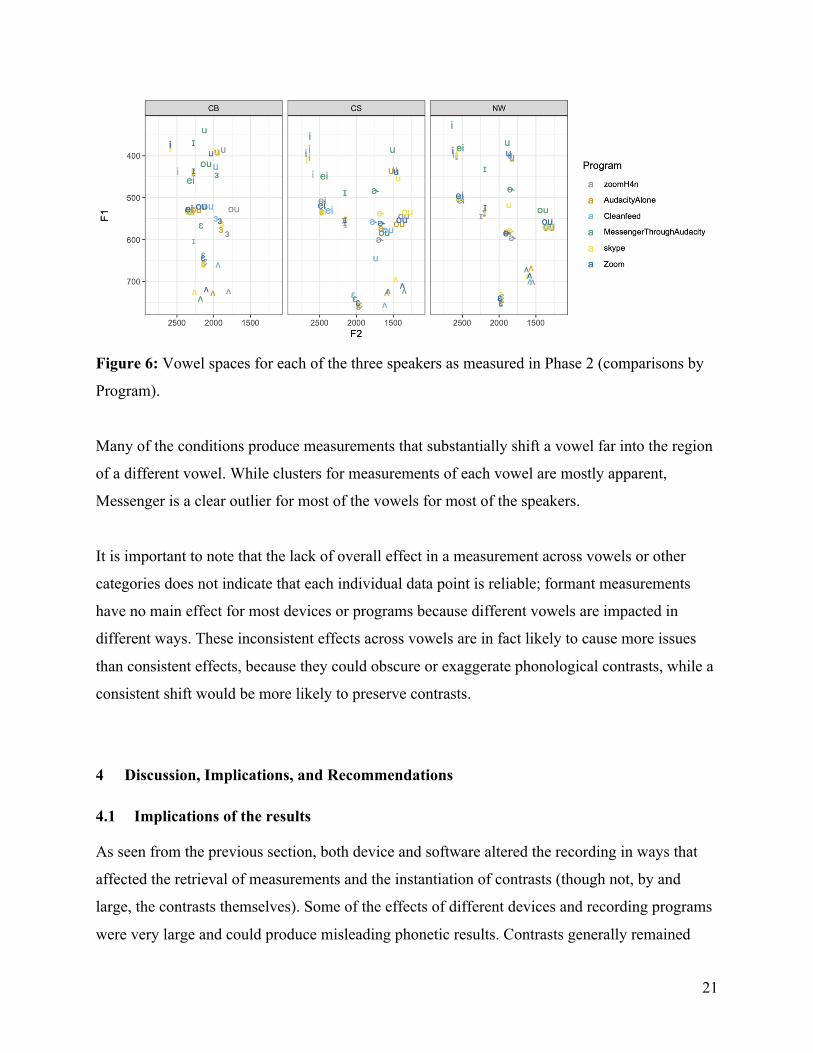
Figure 6: Vowel spaces for each of the three speakers as measured in Phase 2 (comparisons by
Program).
Many of the conditions produce measurements that substantially shift a vowel far into the region
of a different vowel. While clusters for measurements of each vowel are mostly apparent,
Messenger is a clear outlier for most of the vowels for most of the speakers.
It is important to note that the lack of overall effect in a measurement across vowels or other
categories does not indicate that each individual data point is reliable; formant measurements
have no main effect for most devices or programs because different vowels are impacted in
different ways. These inconsistent effects across vowels are in fact likely to cause more issues
than consistent effects, because they could obscure or exaggerate phonological contrasts, while a
consistent shift would be more likely to preserve contrasts.
4 Discussion, Implications, and Recommendations
4.1 Implications of the results
As seen from the previous section, both device and software altered the recording in ways that
affected the retrieval of measurements and the instantiation of contrasts (though not, by and
large, the contrasts themselves). Some of the effects of different devices and recording programs
were very large and could produce misleading phonetic results. Contrasts generally remained
22
clear, because effects were largely consistent across different items, but some contrasts were
exaggerated or underestimated. The main – and important – implication of the results is that it
will be difficult to directly combine or compare data gathered “in person” in the field with data
gathered remotely, even if recorded from the same speaker. Even the relatively reliable
conditions produced measurement differences that will need to be taken into account in any
analyses.
The variation across recording conditions problematizes research that, for example, asks
participants to record themselves and upload recordings, if that recording is done on different
devices. It also means that the findings of cross-linguistic phonetic comparisons, such as Salesky
et al (2020), should be evaluated in the context of possibly substantial interference from
differences in measurements resulting from the circumstances of recording. This is particularly
an issue for work on endangered languages, where a small number of speakers may be taken as
“representative” of the language, further confounding differences between speakers, languages,
and devices.
Secondly, fieldworkers should be wary about combining recordings from the same speaker that
were made in person and remotely at different times. That is, recordings made from the same
person but with different devices are likely to show differences that are not features of the
person’s speech.
Thirdly, this work raises questions for any work that requires stable identification of features
across devices or programs. While our discussion focuses on implications for fieldwork and
language documentation, these effects are similarly relevant for sociophonetics research, online
phonetic production experiments, and (perhaps most importantly) forensic phonetics, where the
variation identified here (based on device and software) should be taken into consideration in
voice comparisons.
In the following sections we make some recommendations for field linguists looking to minimize
the impact of device or software bias on their recordings.
23
4.2 Documenting recording set-up
Documenting the recording set-up is crucial: what microphone was used, what program was
used, and any settings for programs that allow multiple settings. Even if effects of these
conditions do not have a large impact on comparisons within a recording, documenting the
recording conditions will facilitate interpretation of results and comparisons across recordings,
both for fieldworkers themselves and for others using their data in the future. The recordings
being made now are the archival data for the future, so it is important to provide as much
information as possible to make these recordings interpretable. The more we know about the
effects of particular recording conditions, the better our ability to make comparisons across
different recordings.
One should always be cautious about comparing measurements from one set of recordings to
measurements from another set of recordings, particularly if there is no documentation of what
recording set-up was used to create a set of recordings. Our results suggest that the recording set-
up should generally not have a substantial impact on being able to identify contrasts; most of
these methods will recover most phonological contrasts, so comparisons within a recording are
likely to be usable. However, the magnitude of the effects may be estimated differently, and the
precise measurements will vary across devices and software programs. The raw measurements
are unreliable for a range of factors across many conditions.
For language documentation, online recording can be used to recover phonemic contrasts and for
broad description of linguistic processes, though the data might not reliably demonstrate the
specific acoustic phonetic realization of each category. Researchers making comparisons across
individual speakers (for example, in sociolinguistics or in comparative phonetics) or comparisons
across languages need to be particularly aware of these issues. It is important to consider
potential effects of the recording set-up, particularly if it varies across speakers. If information
about the recording set-up is not available, it will be very difficult to distinguish between effects
of the set-up and effects of the speaker or the speaker’s language.
24
4.3 General recommendations
Based on the conditions we tested, we have a few specific recommendations for fieldworkers,
sociolinguists, and anyone else conducting phonetic research.
Because of the substantial differences across different recording conditions, it is important to
make comparisons within the same recording whenever possible, and to use the same set-up
when making multiple recordings that will be compared with one another, e.g. when recording
multiple speakers in documentary and sociolinguistic tasks. When making long-distance
recordings, ensure that the setup is the same on both ends (their set-up and yours) for all speakers
being recorded.
If using different devices or programs is unavoidable, this will, most likely, limit possibilities for
making comparisons across different individuals, because individual differences will be
confounded with differences due to the recording conditions. It will nonetheless be particularly
important to include participant/recording as a factor in analyses. Given that linguistic fieldwork,
particularly for endangered languages, is often conducted with few individuals, “pandemic
recordings” from different speakers using different platforms may mean that in the future we will
be unable to distinguish between individual speaker differences and individual software
differences in much of this data. This risk is especially problematic for endangered languages,
which are already severely phonetically underdocumented (Whalen et al 2020).
Researchers doing virtual recordings should consider testing their own setup for which effects
are likely to be present, by comparing a field recorder to the setup the linguistic consultants are
using. The stimuli used here are available for download as part of the supplementary materials if
readers would like to directly compare their setup with the results here.
4.4 Recommendations about devices and local settings
For recording devices, an external computer microphone is preferable to the internal microphone,
even for a relatively new computer with a high quality microphone. Avoid compression if
possible, and use lossless formats; this difference is reflected by the difference between our iPad
25
and iPhone conditions. This will mean that recording file size may become an issue and external
storage may be necessary.
Our device recording tests suggest relatively little overall difference between devices, apart from
intensity measures, which could simply be due to the different distances each device had from
the speaker. This is good news for making recordings in the field, and suggests that if possible,
the best way to record remotely is to have research participants make recordings on their own
devices (including phones or tablets) and transfer those recording files via file upload. We
understand, however, that such a recommendation may not be feasible in many areas, given the
costs of data plans, or the technical knowledge needed to transfer recordings. Furthermore,
although most differences in recording devices were not significant, that does not mean that there
were no differences in measurements.
4.5 Recommendations about software programs
For online recording, Cleanfeed performed overall the closest to the gold standard solid state
recordings. However, this program does not make video recordings. We understand that using
audio recording alone is problematic for general language documentation, and that there are
many advantages to being able to see one’s interlocutor, as well as the screen-sharing and other
features that programs like Zoom and Skype bring. However, if the primary goal is comparable
acoustic phonetic measurements, Cleanfeed is preferable. Other video-based services (that we
did not test) may also be preferable to Zoom or Skype. Facebook Messenger should be avoided;
it consistently produced measurements that substantially differed from our solid state recorder
and which were often very different from the measurements produced by other programs and
devices. These issues seem to be traceable to Messenger and not to Audacity, given the more
limited effects of using Audacity alone.
If video is necessary, Skype and Zoom are similar to each other in reliability. Both produce
some artefacts, so it is very important to document what software was used. The two programs
handle noise differently, in a way that produces divergent COG effects and might also produce
differences in other measurements.
26
In order to facilitate comparisons across different recordings, it is important to use the same
software program across speakers and across recording sessions. While the absolute
measurements are altered to some degree by all of these applications, using the same application
for all recordings will at least ensure that artefacts do not produce apparent variability across
speakers, across tasks, or based on other factors that also vary between recordings.
One additional factor to consider that was not addressed within our study is the internet
connection. All of our virtual recordings were made over stable high-speed11 connections. When
the connection is weak, many issues are likely to arise from the speech signal cutting out, which
can cause major distortions or omit words entirely. Some programs include greater compression
to handle slower connections, so measurements that were reliable for recordings made over a fast
connection will not necessarily be reliable when made over a slower connection. Thus, it is
preferable to record locally whenever possible and subsequently share those recordings, rather
than making the recording over an internet connection.
5 Conclusions
The ubiquity and relative auditory fidelity of online voice platforms and portable devices have
led linguists to be more comfortable using such systems in field research. Covid-related
restrictions and lockdowns have made it difficult or impossible to conduct in-person field
research. We tested the feasibility of using these online solutions in a remote recording situation,
by comparing a recording made on a solid-state recorder against the same recording after being
fed through various software programs and recorded on different devices. We found that all
options distort the signal in some fashion, and give recommendations for best practices: local
recordings are best when possible, and the recording set-up should be consistent across recording
sessions. For all recordings, both in-person and remote, researchers should document all aspects
of the recording setup, including devices and software programs, in order to facilitate future
interpretation of the data.
11 Broad-band cable internet at one end, fiber-optic-to-curb at the other.
27
References
Barwick, L. (2006). A musicologist’s wishlist: some issues, practices and practicalities in
musical aspects of language documentation. Language documentation and description,
3(2005), 53–62.
Bates, Douglas, Martin Mächler, Ben Bolker & Steve Walker. 2015. Fitting linear mixed-effects
models using lme4. Journal of Statistical Software, 67(1), 1–48.
Bird, Steven, & Gary Simons. 2003. Seven dimensions of portability for language documentation
and description. Language, 79(3), 557–582.
Bird, Steven, Florian R. Hanke, Oliver Adams, & Haejoong Lee. 2014. Aikuma: A Mobile App
for Collaborative Language Documentation. Proceedings of the 2014 Workshop on the
Use of Computational Methods in the Study of Endangered Languages, 1–5. Association
for Computational Linguistics. (http://dx.doi.org/10.3115/v1/W14-2201)
Boersma, Paul & David Weenink. 2017. Praat: Doing phonetics by computer (Version 6.0.30)
[Computer program]. Retrieved September 29, 2017, from /http://www.praat.org/.
Bowern, Claire. 2015. Linguistic fieldwork: A practical guide. 2nd edition. Springer. de Decker, Paul & Jennifer Nycz. 2015. For the record: Which digital media can be used for
sociophonetic analysis? University of Pennsylvania Working Papers in Linguistics, 17(2),
Article 7.
Drude, Sebastian, Trilsbeek, Paul, & Broeder, Daan. (2011). The ‘Language Archiving
Technology’ solutions for sustainable data from digital research. Sustainable data from
digital research: Humanities perspectives on digital scholarship. Proceedings of the
conference held at the University of Melbourne, 12–14th December 2011.
(http://hdl.handle.net/2123/7935)
Evanini, Keelan, Stephen Isard and Mark Liberman. 2009. Automatic formant extraction for
sociolinguistic analysis of large corpora. Tenth Annual Conference of the International
Speech Communication Association. http://languagelog.ldc.upenn.edu/myl/
BayesianFormants.pdf.
Goldman, Jean-Philippe, Adrian Leemann, Marie-José Kolly, Ingrid Hove, Ibrahim Almajai, Volker Dellwo & Steven Moran. 2014. A Crowdsourcing Smartphone Application for Swiss German: Putting Language Documentation in the Hands of the Users. European
28
Language Resources Association (ELRA). https://doi.org/10.5167/UZH-103791. https://www.zora.uzh.ch/id/eprint/103791 (21 January, 2021).
Gordon, Matthew, Paul Barthmaier & Kathy Sands. 2002. A cross-linguistic acoustic study of
voiceless fricatives. Journal of the International Phonetic Association, 32(2), 141–174.
Hall-Lew, Lauren & Zac Boyd. 2017. Phonetic Variation and Self-Recorded Data. University of Pennsylvania Working Papers in Linguistics 23(2). https://repository.upenn.edu/pwpl/vol23/iss2/11.
Hou, Lynn, Ryan Lepic & Erin Wilkinson. 2020. Working with ASL Internet Data. Sign Language Studies. Gallaudet University Press, 21(1). 32–67. https://doi.org/10/ghmbkz.
Johnson, Keith. (2008). Quantitative methods in linguistics. Blackwell Publishing, Ltd.
Johnson, Lisa M., Marianna Di Paolo & Adrian Bell. 2018. Forced Alignment for Understudied
Language Varieties: Testing Prosodylab-Aligner with Tongan Data. Language
Documentation & Conservation, 12. 80–123.
Künzel, H. J. 2001. Beware of the ‘telephone effect’: The influence of telephone transmission on
the measurement of formant frequencies. Forensic Linguistics 8. 80–99.
Kuznetsova, Alexandra, Per Bruun Brockhoff & Rune Haubo Bojesen Christensen. 2015.
lmerTest: Tests in Linear Mixed Effects Models. https://CRAN.R-project.org/
package=lmerTest. R package version 2.0-29.
Labov, William, Sharon Ash, and Charles Boberg. 2006. The Atlas of North American English:
Phonetics, phonology and sound change. Berlin: Walter de Gruyter.
Leemann, Adrian, Péter Jeszenszky, Carina Steiner, Melanie Studerus & Jan Messerli. 2020. Linguistic fieldwork in a pandemic: Supervised data collection combining smartphone recordings and videoconferencing. Linguistics Vanguard. De Gruyter Mouton 6(s3). https://doi.org/10/ghk9xw. https://www.degruyter.com/view/journals/lingvan/6/s3/article-20200061.xml (21 January, 2021).
Liu, Chi-Min, Hsu, Han-Wen & Lee, Wen-Chieh. 2008. Compression artifacts in perceptual
audio coding. IEEE Transactions on Audio, Speech, and Language Processing, 16(4),
681–695.
Lucas, Ceil, Gene Mirus, Jeffrey L. Palmer, Nicholas J. Roessler & Adam Frost. 2013. The
effect of new technologies on sign language research. Sign Language Studies, 13(4),
541–564.
29
Lyons, Richard. 2011. Understanding digital signal processing, 3rd edn. Upper Saddle River,
NJ: Prentice Hall.
Lyons, Richard & D. Lee Fugal. 2014. The essential guide to digital signal processing. Upper
Saddle River, NJ: Prentice Hall.
Maddieson, Ian. 2001. Phonetic fieldwork. In Paul Newman and Martha Ratliff (eds.), Linguistic
Fieldwork, 211–229. Cambridge: Cambridge University Press.
Mihas, E. 2012. Subcontracting native speakers in linguistic fieldwork: A case study of the
Ashéninka Perené (Arawak) research community from the Peruvian Amazon. Language
Documentation and Conservation, 6, 1–21.
Nash, Carlos Marcelo. (2001) "Evaluating the use of adaptive transform acoustic coding
(ATRAC) data compression in acoustic phonetics." Master’s Thesis, Rice University.
https://hdl.handle.net/1911/17453.
Pierce, Jonathan W. 2007. PsychoPy – Psychophysics software in Python. Journal of Neuro-
science Methods, 162(1-2), 8–13.
Podesva, Robert & Elizabeth Zsiga. 2013. Sound recordings: Acoustic and articulatory data. In
Robert Podesva & Devyani Sharma (Eds.), Research methods in linguistics (169-194).
Cambridge: Cambridge University Press.
Purnell, Thomas, Eric Raimy & Joseph Salmons. 2013. Making linguistics matter: Building on
the public's interest in language. Language and Linguistics Compass, 7(7), 398–407.
Rathcke, Tamara, Jane Stuart-Smith, Bernard Torsney & Jonathan Harrington. 2017. The beauty
in a beast: Minimising the effects of diverse recording quality on vowel formant
measurements in sociophonetic real-time studies. Speech Communication, 86. 24-41.
Salesky, Elizabeth, Eleanor Chodroff, Tiago Pimentel, Matthew Wiesner, Ryan Cotterell, Alan W. Black & Jason Eisner. 2020. A Corpus for Large-Scale Phonetic Typology. arXiv:2005.13962 [cs]. http://arxiv.org/abs/2005.13962 (21 January, 2021).
Seyfeddinipur, Mandana, & Rau, Felix. 2020. Keeping it real: Video data in language
documentation and language archiving. Language Documentation & Conservation, 14,
503–519.
Sneller, Betsy. 2021. Workshop: Sociolinguistic research in the time of COVID: Methods,
Ethics, Theory Workshop at the Annual Meeting of the Linguistic Society of America.
30
van Son, R.J.J.H. 2005. A study of pitch, formant, and spectral estimation errors introduced by
three lossy speech compression algorithms. Acta Acustica United with Acustica, 91, 771–
778.
Sun Lingfen, Mkwawa, Is-Haka, Jammeh Emmanuel, & Ifeachor Emmanuel. 2013. Speech
Compression. In: Guide to Voice and Video over IP. Computer Communications and
Networks. Springer, London.
Whalen, Douglas H., Christian DiCanio & Rikker Dockum. 2020. Phonetic documentation in
three collections: Topics and evolution. Journal of the International Phonetic
Association. FirstView Online, 1–27.
Zölzer, Udo. 2008. Digital audio signal processing, 2nd edn. UK: Wiley.