Embed Size (px)
Citation preview

Don’t Throw in the Towel, Throw in Trade Credit!∗
Banu Demir†
Bilkent University and CEPR
Beata Javorcik‡
University of Oxford and CEPR
May 20, 2017
The literature has documented how firms adjust to increased competitive pressuresarising from globalization. This paper demonstrates a new margin of adjustment,namely, provision of trade credit. A simple model predicts that an increase incompetitive pressures will lead exporters to provide trade credit and lower prices.These predictions are tested in the context of an exogenous shock, the end of theMulti-Fiber Arrangement (MFA), a quota system governing trade in textiles andclothing until the end-2004. The analysis focuses on Turkey which was not subjectto quotas in the EU and thus faced an increase in competition after the quotas onChina had been removed. The results suggest that in the post-MFA period Turkishexports of products with binding MFA quotas prior to the shock saw an increase inthe provision of trade credit and a drop in prices relative to the other products. Thereis also some evidence of substitution between providing trade credit and lowering prices.
JEL Codes: F14; F15; F13.Keywords: trade credit, export financing, competition, Multi-Fiber Arrangement,Turkey.
∗The authors wish to thank Mary Amiti, Richard Baldwin, Andy Bernard, Carsten Eckel, Keith Head, KalinaManova, Peter Neary, Veronica Rappoport, Frederic Robert-Nicoud, Tim Schmidt-Eisenlohr and Steve Yeaple aswell as seminar participants at Stanford, Toronto, Penn State, Paris School of Economics, Munich, Tuck Schoolof Business at Dartmouth, ETH Zurich/KOF Swiss Economic Institute, Lausanne, New York Fed, Central Bankof Turkey, Banca d’Italia, Banque de France, National Bank of Poland, Barcelona GSE Summer Forum, CESifoArea Conference on the Global Economy, 5th Villars Research Workshop on International Trade, State ExportCredit Guarantees in a Globalized World Conference at the Ifo Institute, Spring 2014 Midwest International TradeConference, HEC Workshop on International Trade, Finance, and Real Economy, EITI conference 2016, Workshopon Trade and Institutions in Ferrara, and 86th Southern Economic Association meeting. Beata Javorcik wishes tothank the University of Oslo for support and the Central European University for hospitality. The empirical analysisin this paper was conducted at the Ankara Micro Data Center of the Turkish Statistical Institute (contract no. 690).The authors thank the British Academy for funding under the Newton Advanced Fellowship programme award no.AF 140056. This paper was previously circulated under the title “Grin and Bear It: Producer-Financed Exportsfrom an Emerging Market”.†Department of Economics, Bilkent University, 06800 Ankara Turkey. [email protected]‡Department of Economics, University of Oxford, Manor Road Building Manor Road, Oxford OX1 3UQ, UK.

1 Introduction
Liberalization of international trade has given rise to a spectacular growth in the world trade and
increased competitive pressures faced by firms. The literature has explored how firms have adjusted
to these developments. It has shown theoretically and empirically that the adjustment has taken
place through exit of the least productive firms and reallocation of market shares towards better
performers (Melitz (2003) and Pavcnik (2002), respectively). The adjustment has also taken the
form of dropping the least performing products from a firm’s portfolio and expanding the best
performing ones (Bernard, Redding, and Schott (2010, 2011); Eckel and Neary (2010); Mayer,
Melitz, and Ottaviano (2014)). This paper demonstrates another margin of adjustment—namely,
the choice of financing terms on which the trade transaction takes place. More specifically, it
postulates that firms respond to increases in competitive pressures by providing trade credit which
may partially substitute for lowering prices.1
Our analysis is motivated with a simple theoretical framework in the spirit of Schmidt-Eisenlohr
(2013) and Antras and Foley (2015) with heterogenous buyer valuations. In this framework, an
exporter of an intermediate product meets a randomly matched set of foreign buyers, each of which
has a unit demand for the product. The exporter chooses between offering trade credit and asking
for bank financing, which reflects a trade-off between a lower risk of non-payment and a higher cost
of financing (due to bank fees). The model predicts that an increase in the foreign buyer’s outside
option, which can be thought of as an increase in the level of competition, leads the exporter to:
(i) provide trade credit for a higher share of export sales, and (ii) lower the price of exports. The
model also implies some degree of substitution between the two margins of adjustment: the smaller
the size of the trade credit adjustment, the larger the price adjustment.
The theoretical predictions are tested in the context of an exogenous shock to competition
associated with dismantling of the Multi-Fiber Arrangement (MFA), a system of bilateral quotas
governing the global trade in textiles and clothing until the end of 2004. The analysis focuses on
Turkish exports to the European Union (EU) before and after the end of the MFA. Turkish exports
1Anecdotal evidence suggests that provision of trade credit may indeed be a response to competitive pressures. Forinstance, the Trade Finance Guide, published by the US Department of Commerce International Trade Administrationin November 2012 to assist American companies in conducting export transactions, suggests that providing exportfinancing “may help win customers in competitive markets” (p. 11). It also warns that insisting on the importerproviding financing “could, ultimately, cause exporters to lose customers to competitors who are willing offer morefavorable payment terms to foreign buyers” (p. 5).
1

of textiles and clothing were not subject to any quota restrictions in the EU market after Turkey
formed a customs union with the EU in 1996. Thus the removal of the MFA quotas on large textile
and clothing producers, China in particular, constituted a large shock to the competitive pressures
faced by Turkish suppliers of these products to the EU market.
Our identification strategy takes advantage of the fact that the MFA quotas were binding in
some, but not the other, products, which meant that the shock mattered more for the former
group. We use data on Turkish exports of MFA products to the EU, disaggregated at the level of
the exporting firm, product, destination country, year and financing terms. The data set covers the
period 2002-2007. To take into account pre-existing trends we compare the change in provision of
trade credit before the shock to the change after the shock for the affected (previously quota-bound)
and the remaining (control) products. We account for various sources of unobservable heterogeneity
by including product, country-year and firm-year fixed effects.
The results from this difference-in-differences approach suggest that in the post-MFA period the
share of Turkey’s exports sold on credit to the EU increased faster in products in which the MFA
quotas were binding in 2004 relative to products without binding quotas. The effect is statistically
significant as well as meaningful in economic terms. After the shock, the affected products saw a
3.75 percentage point larger increase in the trade credit provision relative to the products which
were not subject to the shock. Our results are robust to a placebo test, which exploits the timing
of the shock and assigns a placebo date (January 2004 instead of January 2005) as the date of
the MFA quota removal. As expected, the test returns a statistically insignificant estimate of our
parameter of interest.
We also investigate the impact of the shock on prices and the interplay between adjustment
through financing and prices. The results indicate that the exogenous shock to competition resulted
in a decline in prices (unit values) of the affected products exported by Turkish producers relative to
the control products. Again the effect is both statistically significant and economically meaningful.
The products in which the MFA quotas were binding saw a 0.07 log-points decline in prices relative
to the control products after the shock. We also find a larger adjustment through prices taking place
in exports of the affected products where only a limited adjustment through the credit channel was
possible (due to a large share of the flow already being sold on credit before the shock). This result
from a triple-difference specification is suggestive of substitution between offering trade financing
2

and lowering prices.
Our findings have two policy implications. First, they suggest that public policies facilitating ac-
cess to export credit are likely to boost exports, particularly exports destined for highly competitive
markets. Given that trade-related official development aid has recently reached about 25-30 billion
dollars a year and constituted around 30% of total official development aid flows, understanding
how to use such funds best is crucial.2 Second, studies considering the response of export prices
to competitive shocks abroad may be underestimating the effects unless they take into account
adjustments taking place through the trade credit channel.
Our paper is related to several strands of the existing literature. First, as explained earlier, it
contributes to the literature on firms’ adjustment to competitive pressures arising from globalization
by proposing a new margin of adjustment. A margin that has not been considered before in either
the theoretical or the empirical literature.
Second, it adds to the literature that documents the importance of access to financing for the
ability to export (Greenaway, Guariglia, and Kneller (2007); Manova (2008); Amiti and Weinstein
(2011); Chor and Manova (2012); Manova (2013); Paravisini, Rappoport, Schnabl, and Wolfenzon
(2014); Manova, Wei, and Zhang (2015); Chaney (2016)). While the literature focuses on the
broadly defined ability of firms to borrow, this paper studies a particular type of financing, namely
trade credit, which is the single most important source of short-term financing in domestic trade
(Petersen and Rajan (1997); Wilson and Summers (2002)). Our results suggest that the ability to
provide trade credit is particularly important in the case of exports destined for markets with a
high level of competition.
Third, by providing evidence that suggests a positive link between the level of competition and
provision of trade credit, our paper contributes to the literature that studies the workings of trade
credit in general. It has been postulated that firms resort to trade credit as a competitive strategy.
On the theoretical front, Wilner (2000) shows that a buyer that accounts for a large share of a
supplier’s revenues is more likely to be served on trade credit. On the empirical front, Fisman
and Raturi (2004) use survey data on trade relationships from five African countries and document
a negative relationship between monopoly power and trade credit provision. Fabbri and Klapper
(2016) also find evidence pointing to a similar relationship using survey data on Chinese firms. By
2See https://www.wto.org/english/tratop_e/devel_e/a4t_e/a4t_factsheet_e.htm
3

going beyond survey data, focusing on an exogenous shock and employing a difference-in-differences
approach we are able to provide convincing evidence pointing towards a positive effect of market
competition on trade credit provision.3
Fourth, by pointing out the role of competition, a factor that has not been considered before,
we extend the literature on determinants of financing terms in international trade transactions
(Schmidt-Eisenlohr (2013); Engemann, Eck, and Schnitzer (2014); Antras and Foley (2015); Eck,
Engemann, and Schnitzer (2015); Hoefele, Schmidt-Eisenlohr, and Yu (2016); Glady and Potin
(2011); Ahn (2014); Niepmann and Schmidt-Eisenlohr (2017)). Our study is also the first one
relying on direct measures of export financing for a large sample of exporters. This contrasts
with the existing literature that either tested the theories of export financing using information
for a single exporter, information on trade financing in general (which did not distinguish between
domestic and international trade credit) or relied on indirect tests. Our focus on an emerging
market is also an interesting question in itself as it sheds light on additional obstacles faced by
exporters from such countries in international markets.
Finally, we contribute to the literature examining the impact of abolishing the MFA. This liter-
ature has investigated the impact of the shock on the importing countries (Harrigan and Barrows
(2009)) and the exporting economies such as China (Khandelwal, Schott, and Wei (2013)). We
show the impact of the shock on third countries.
The rest of the paper is organized as follows. The next section discusses the institutional context
and the data. Section 3 presents a simple theoretical model and its main predictions for the impact
of competition on trade credit provision and prices. Section 4 outlines the empirical strategy and
reports the estimation results. Section 5 contains the concluding remarks.
3For a review of the literature on domestic trade credit see Petersen and Rajan (1997) and Fisman and Love(2003). The literature also provides alternative explanations for why firms extend trade credit to their customers.One possibility is that suppliers have a comparative advantage over banks in financing the short-term working capitalneeds of their customers. The source of comparative advantage could be their knowledge about the credit worthinessand business conditions of their customers (e.g. Smith (1987)); or their ability to resell the underlying good in caseof payment default (e.g. Mian and Smith (1992)). Another potential motive behind extending trade credit is that itmay allow suppliers to price discriminate their customers (Brennan, Maksimovic, and Zechner (1988)).
4

2 Institutional Context and Data
Between 1974 and 2004, exports of textiles and clothing (T&C) from developing countries to the
EU and other developed countries were subject to bilateral quotas under the global Agreement
on Textile and Clothing, previously known (and referred to in this article) as the Multi-Fiber Ar-
rangement. During the Uruguay Round conducted within the framework of the General Agreement
on Tariffs and Trade (GATT), spanning from 1986 to 1994 and embracing 123 countries, it was
decided that the MFA quotas would be removed by the 1st of January 2005.4
During the 1993-2003 period, Turkey and China were the leading exporters of T&C into the
EU market, together accounting for 30 percent of total EU imports. Turkish exporters had two
distinctive competitive advantages over Chinese exporters: geographical proximity and Turkey’s
Customs Union membership, which provided Turkish exporters with quota- and tariff-free access
to the EU market. Therefore, the elimination of the MFA quotas on Chinese imports constituted
a large negative shock to Turkish exporters, partly eroding their competitive advantage in the EU
market. Between 2004-2005, China’s exports of T&C products to the EU increased by 41.7 percent,
while Turkey’s exports increased by only 3.8 percent. Moreover, particularly useful for our analysis
is the fact that the competitive shock was not the same for all products, as the MFA quotas faced
by China in the EU market were not binding in all products prior to 2005. In particular, quota
fill rates—proportion of quotas used by the end of a given year—varied from below 10% to 100%
in 2004 (see Figure 1), higher rates indicating greater constraint on Chinese exporters and thus a
greater increase in competitive pressures after the quota removal. We will exploit this variation in
our empirical analysis in Section 4.
Our empirical analysis is based on detailed international trade data for Turkey provided by
the Turkish Statistical Institute. Given the nature of the shock we want to exploit, we focus on
Turkey’s exports of T&C disaggregated by the exporting firm, 6-digit Harmonized System (HS)
4The countries imposing quotas, including the EU, were required to remove textile and clothing quotas repre-senting 16, 17, 18, and the remaining 49 percent of their 1990 import volumes on the 1st of January 1995, 1998, 2002and 2005, respectively. The removal of quotas on the most sensitive T&C products was left the final phase (PhaseIV in 2005) to defer politically painful import competition as long as possible, which suggests that the Phase IVquotas were most binding. The fact that Phase IV goods were determined in 1995 implies that their choice was notinfluenced by demand or supply conditions in 2005 (Khandelwal, Schott, and Wei (2013)).
5

product code, destination country and year.5 At this level of aggregation, the data set reports (free-
on-board) value and quantity (measured in specified units, e.g. number, pair, etc.) of exports, and
importantly for our purposes, the breakdown of financing. We restrict our attention to 15 old
member states of the European Union. In the baseline estimation, we use data for 2003-2005.6
The data set includes information on four main financing terms: cash in advance, open account,
letter of credit, and documentary collection.
An open account (OA) transaction in international trade is a sale where the goods are shipped
and delivered before payment is due, which is typically in 30, 60 or 90 days after delivery. This
option is advantageous to the foreign buyer in terms of cash flow and cost, but it is consequently
a risky option for the exporter. This is the closest category to what is defined as trade credit in
domestic transactions, and thus it will be the main focus of our analysis.
The cash-in-advance (CIA) payment method is a situation when the exporter receives payment
prior to shipping the goods to the destination. This method eliminates the payment risk on the
part of the exporter. All the risk is borne by the importer.
A letter of credit (LC) is a commitment by a bank on behalf of the foreign buyer that payment
will be made to the exporter provided that some stipulated terms and conditions have been met, as
evidenced by the presentation of specified documents. The buyer pays his/her bank a fee to render
this service. It is one of the most secure instruments available to international traders.
Under documentary collection (DC) the exporter entrusts the collection of the payment to its
bank (remitting bank), which sends the documents to the buyer’s bank (collecting bank) together
with payment instructions. Funds are received from the buyer and remitted to the exporter through
the banks in exchange for those documents. This instrument is much cheaper than the letter of
credit because the banks do not provide a payment guarantee. However, “if structured properly, the
exporter retains control over the goods until the importer either pays the draft amount at sight or
accepts the draft to incur a legal obligation to pay at a specified later date.” (p. 9, U.S. Department
of Commerce International Trade Administration (2012)). Therefore, it is a more secure payment
5We exclude products under the 2-digit HS codes 61 and 62 as they were subject to the so-called “Bras War”between the EU and China. As discussed by Dai (2009), as a result of temporary quotas imposed by the EU in theearly 2005, these products got stuck in European warehouses until September and only some of them were let intothe EU market towards the end of the year.
6We also use 2002 data in a placebo test, and data for 2006-2007 in a robustness check.
6

method than OA and CIA.7.
In 2002, around 60 percent (in terms of value) of Turkey’s T&C exports to the EU were sold
on trade credit (OA) terms (see Table 1). As buyer financing (CIA) was almost non-existent, the
rest was accounted for by bank-intermediated financing (LC and DC terms). The distribution of
Turkey’s T&C exports to other destination countries by financing term was similar.8
Figure 2 plots, for the 2003-2005 period, the annual share of exports to the EU on OA terms
against the 2004 quota fill rates. The data on quota fill rates comes from Systeme Integre de
Gestion de Licenses which publishes quota levels for EU imports of all T&C categories by source
country.9 Each marker represents the average share of exports on OA terms over firms, products
and destination countries for a given quota-fill rate and year. The figure shows that for high quota
fill rates, the 2005 averages lie significantly above the 2003 and 2004 averages. While the fitted lines
for 2003 and 2004 are almost flat, the one plotted for 2005 has a positive slope. To the extent that
quota fill rates before the end of the MFA are indicative of the size of the competition shock, these
patterns are consistent with our hypothesis that increased competition from China forced Turkish
exporters of T&C products with binding MFA quotas to provide more trade credit to their buyers
in the EU market.
3 Model
To motivate our empirical analysis and understand the potential mechanisms behind our results,
we consider a model of payment choices in international trade. Our modelling approach is dictated
by the characteristics of the data set available to us. While it has the unique feature of informing
us about the use of financing terms, it is aggregated at the level of exporting firm, product, and
destination country. This implies, first, that we do not observe individual transactions; and second,
that we do not have information about Turkish exporters’ foreign buyers. Because of these two
shortcomings, we can only study the effect of market competition on the share of firm-product-
7The definitions are based on description provided by U.S. Department of Commerce International Trade Ad-ministration (2012)
8In overall Turkish exports, the CIA-based exports account for less than 5 percent of the total export value. Suchrare use of the CIA terms is also reported by Mateut (2011) who uses data on domestic transactions by French firms.In her dataset, the CIA-based transactions account for less than 1 percent of the total value of all the transactions.
9We thank Amit Khandelwal, Peter Schott, and Shang-Jin Wei for sharing additional data they used in Khan-delwal, Schott, and Wei (2013).
7

destination-level exports accompanied by trade credit and on average prices at the same level of
aggregation.
3.1 Setup
We present a partial-equilibrium model of choice of financing terms, which builds on Schmidt-
Eisenlohr (2013) and Antras and Foley (2015). We consider the behavior of a Turkish exporter
of intermediate product j, who meets a randomly matched set of foreign buyers, indexed by k,
located in a destination country d: k ∈ Ωd. We denote exporter and buyer-specific variables by
subscripts e and b, respectively. Each foreign buyer has a unit demand for the intermediate input,
which s/he values at sk. These values are drawn from a common and known distribution g(sk)
with positive support on the interval (s,∞) and a continuous cumulative distribution G(sk). The
exporter incurs a constant marginal cost that is normalized to zero.10 All agents are risk neutral
and have complete information about each others’ costs and preferences.11
We assume that the exporter has the full bargaining power and makes take-it-or-leave-it offers to
independent buyers.12 When a transaction takes place between the exporter and a foreign buyer k,
their payoffs are equal to their expected profits as they bargain before the transaction takes place.
If the offer is rejected, both traders revert to their outside options, yielding a payoff of u0,e > 0 to
the Turkish exporter13 and u0,b ∈ (0, s) to a foreign buyer.14
In the case where both parties fulfil their contractual obligations, the timing of the events under
different financing terms is as follows. Under CIA terms, the foreign buyer makes the payment
before the exporter ships the good to the destination. Alternatively, under OA terms, the exporter
can extend trade credit to the buyer. In this situation, the exporter first produces and ships
the good, and the buyer makes the payment upon the good’s arrival. Finally, under LC terms,
the foreign buyer’s bank guarantees payment to the exporter after the arrival of the good at the
10Under the assumption of non-zero marginal costs, one can also add an iceberg-type trade cost to the model.Such extension would not change any of the results.
11Our assumptions—that agents have full information about their preferences/costs and that buyers differ in theirvaluations—are not uncommon in the literature. See for instance Mortensen and Wright (2002).
12The implications of assuming that foreign buyer has the full bargaining power are discussed in Section 3.4.13Since the exporter’s outside option does not matter for choosing among different financing terms, we drop u0,e
from the equations below.14To simplify the model, we assume that the value of the outside option does not vary across foreign buyers. The
assumption can be justified if the minimum price offered in the market is an increasing function of buyer valuationsuch that the expected surplus does not vary across buyers.
8

destination. Regardless of the financing choice, there is a one-period time lag between the time the
good is produced/shipped and its arrival at the destination.
We assume contractual frictions. Following Antras and Foley (2015), these frictions are captured
by imperfect contracting due to limited commitment. A contract negotiated at time t = 0 is enforced
with some probability λ, which captures the strength of rule of law enforcement in the relevant
country: λd for the destination country d, and λTUR for Turkey.15
When the transaction is on CIA terms, with probability 1 − λTUR, rule of law within Turkey
breaks down, and the foreign buyer can recover only a fraction δ ∈ (0, 1) of the shipment value.16
Therefore, the participation constraint of a foreign buyer k is given by:17
E[ΠCIAb,k ] =
λTUR + (1− λTUR)δ
1 + rdsk − pCIAk ≥ u0,b,
where pCIAk is the price offered by the Turkish exporter under CIA terms, and rd is the cost of
financing in the destination country d. As the exporter receives the payment with certainty, the
expected profit of the exporter does not depend on the strength of rule of law in the destination
country:
E[ΠCIAe,k ] = pCIAk .
For transactions on OA terms, the foreign buyer does not make the payment until goods are
delivered. While there is no uncertainty on the part of buyers, the Turkish exporter faces payment
uncertainty. With probability 1− λd, rule of law within the destination country breaks down, and
the Turkish exporter can recover only a fraction γ ∈ (0, 1) of the agreed payment. The participation
constraint of the foreign buyer k and the expected profit of the exporter are given by:
E[ΠOAb,k ] =
sk − pOAk1 + rd
≥ u0,b,
E[ΠOAe,k ] =
λd + (1− λd)γ1 + r
pOAk ,
15Berkowitz, Moenius, and Pistor (2006) empirically investigate the importance of rule of law for internationaltrade.
16The loss could arise, for instance, from administrative costs of the recovery process.17To simplify the notation, we drop the product subscript j.
9

where r denotes the financing cost faced by the Turkish exporter and pOAk is the agreed price under
OA terms.
It is worth noting some differences between the two payment options. Under CIA terms, one
dollar paid by the foreign buyer translates into one dollar received by the exporter. However, such
equivalence does not hold for a one-dollar transfer between the two parties under the OA terms.
There are two reasons for this. First, there is uncertainty regarding the payment under OA terms
but not under CIA terms. Second, the two parties discount their payoffs using different discount
factors. This is immaterial under CIA terms as the payment is made at t = 0. The wedge between
the value of a dollar transferred between the two parties under the OA terms implies that any
factor that affects the transfer will also affect the choice between the different contract types.
Under LC terms, the payment is under the bank guarantee. The exporter receives the payment
with certainty provided that the shipment has been delivered in accordance with the initial con-
tract.18 While bank financing eliminates the contract enforcement risk, it is costly. In particular,
following Niepmann and Schmidt-Eisenlohr (2017), the foreign buyer’s bank charges an ad-valorem
fee f ∈ (0, 1) to cover the expected loss from providing payment guarantee, and a fixed fee F > 0
to cover document handling and monitoring costs. Therefore, the participation constraint of buyer
k and the expected profits of the exporter are given by:
E[ΠLCb,k ] =
sk − pLCk1 + rd
− fpLCk − F ≥ u0,b,
E[ΠLCe,k ] =
pLCk1 + r
.
Since the exporter makes a take-it-or-leave it offer to the foreign buyer k, it sets price under
each financing term such that the buyer’s participation constraint binds. This implies that the
transaction price is determined by setting the buyer’s participation constraint to zero under each
18The foreign buyer’s bank is assumed to fulfil its contractual obligations. The reason is, since banks provideguarantees for multiple foreign buyers, it is more costly for them to renege on their contractual obligations. Thisassumption is consistent with the theoretical findings of Olsen (2016), who develops a dynamic general equilibriummodel of matching and repeated interaction to show that reputation concerns can serve as a substitute for formallaw enforcement.
10
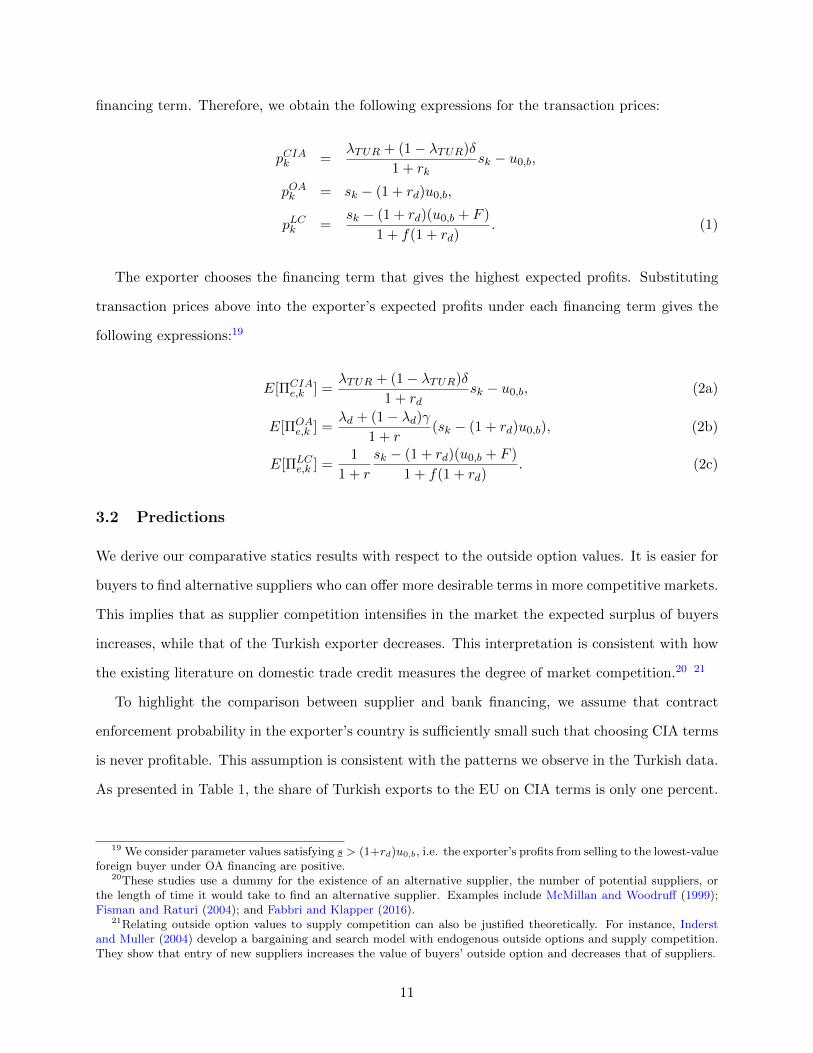
financing term. Therefore, we obtain the following expressions for the transaction prices:
pCIAk =λTUR + (1− λTUR)δ
1 + rksk − u0,b,
pOAk = sk − (1 + rd)u0,b,
pLCk =sk − (1 + rd)(u0,b + F )
1 + f(1 + rd). (1)
The exporter chooses the financing term that gives the highest expected profits. Substituting
transaction prices above into the exporter’s expected profits under each financing term gives the
following expressions:19
E[ΠCIAe,k ] =
λTUR + (1− λTUR)δ
1 + rdsk − u0,b, (2a)
E[ΠOAe,k ] =
λd + (1− λd)γ1 + r
(sk − (1 + rd)u0,b), (2b)
E[ΠLCe,k ] =
1
1 + r
sk − (1 + rd)(u0,b + F )
1 + f(1 + rd). (2c)
3.2 Predictions
We derive our comparative statics results with respect to the outside option values. It is easier for
buyers to find alternative suppliers who can offer more desirable terms in more competitive markets.
This implies that as supplier competition intensifies in the market the expected surplus of buyers
increases, while that of the Turkish exporter decreases. This interpretation is consistent with how
the existing literature on domestic trade credit measures the degree of market competition.20 21
To highlight the comparison between supplier and bank financing, we assume that contract
enforcement probability in the exporter’s country is sufficiently small such that choosing CIA terms
is never profitable. This assumption is consistent with the patterns we observe in the Turkish data.
As presented in Table 1, the share of Turkish exports to the EU on CIA terms is only one percent.
19 We consider parameter values satisfying s > (1+rd)u0,b, i.e. the exporter’s profits from selling to the lowest-valueforeign buyer under OA financing are positive.
20These studies use a dummy for the existence of an alternative supplier, the number of potential suppliers, orthe length of time it would take to find an alternative supplier. Examples include McMillan and Woodruff (1999);Fisman and Raturi (2004); and Fabbri and Klapper (2016).
21Relating outside option values to supply competition can also be justified theoretically. For instance, Inderstand Muller (2004) develop a bargaining and search model with endogenous outside options and supply competition.They show that entry of new suppliers increases the value of buyers’ outside option and decreases that of suppliers.
11

It is also consistent with the fact that quality of institutions is weaker in Turkey than in the EU.22
This leaves us with a comparison between OA financing and LC financing, which account for almost
60 percent and 40 percent of Turkish exports to the EU, respectively.23
Let s∗ denote the marginal buyer, to which the Turkish exporter is indifferent between offering
trade credit (OA financing) and asking for bank financing (LC financing):
E[ΠOAe (s∗)] = E[ΠLC
e (s∗)]
Using the expressions for expected profits in (2b) and (2c) the valuation of the marginal buyer
should satisfy:
s∗ = (1 + rd)u0,b +(1 + rd)F
1− λd(1 + f(1 + rd)), (3)
where λd = λd + (1 − λd)γ ∈ (0, 1). For any sk such that sk < s∗, offering trade credit is
more profitable than asking for bank financing.24 Not surprisingly, the incidence of trade credit
financing is increasing in LC-related fees (f and F ) and the strength of rule of law enforcement in
the destination country.
The intuition behind the result that trade credit is more likely to be offered to low-value foreign
buyers can be seen by inspecting equations (2b) and (2c). The exporter sets the price under
each financing term such that the foreign buyer breaks even. Given that asking for an LC is
associated with additional costs for the buyer, the exporter offers a discount to persuade the buyer
to participate under bank financing. By doing so, the exporter loses a fixed amount of profits
(independent of buyer valuation) arising from the fixed LC-fee (F ). The exporter’s expected gain
under bank financing is increasing in the buyer’s valuation, albeit subject to additional discounting
that increases with the ad-valorem LC-fee (f) and λd. The expected gain compensates for the fixed
loss only for buyers with sufficiently high valuation of the product. Therefore, the exporter chooses
22According to the Worldwide Governance Indicators, published by the World Bank, every EU15 country out-performs Turkey in all six areas of governance, namely voice and accountability, political stability, governmenteffectiveness, regulatory quality, rule of law, and control of corruption.
23We group letter of credit and documentary collection terms together under bank-intermediated financing.24The underlying assumption behind this statement is that the denominator of the second term in (3) is positive,
i.e. 1/λd ≥ 1 + f(1 + rd). Otherwise, offering trade credit would be chosen by the exporter for any feasible valueof sk ≥ s given the parameter restriction in Footnote 19. Therefore, the financing choice problem would be a trivialone.
12

to offer trade credit to low-value foreign buyers.25
How does an increase in competitive pressures affect the provision of trade credit?
Since the exporter offers trade credit to buyers with sk ∈ (s, s∗), the share of export sales on trade
credit can be written as:
µ(s∗) =
∫ s∗
sdG(sk) (4)
To derive the main prediction of the model, we need to derive the sign of dµ/du0,b. Using the
chain rule, it is equal to ∂µ∂s∗
ds∗
du0,b. Using Leibniz integral rule, the first term is equal to ∂µ/∂s∗ =
g(s∗) > 0. The second term is ds∗/du0,b = 1 + rd > 0. So, we obtain dµ/du0,b > 0.
Result 1 The share of export sales on trade credit increases with the outside option of foreign
buyers, u0,b.
The result implies that as the value of the buyer’s outside option increases—which may arise,
for instance, from entry of lower-cost sellers to the market—the Turkish exporter is forced to offer
more favourable terms to remain competitive in the market. An increase in buyer’s outside option
decreases the expected net gain (E[Πb,k]− u0,b) from purchasing from the Turkish exporter. Since
the exporter’s profits under LC terms relative to OA terms depends positively on the expected net
gain of the buyer, asking for bank financing becomes unprofitable for some buyers after the market
is flooded by low-cost suppliers. In other words, the Turkish exporter is forced to offer trade credit
even to buyers with high valuation of the product, who would otherwise be expected to provide
financing for the transaction. As a result, the share of sales on trade credit increases.
Changes in the competitive environment also affect the average price charged by the
Turkish exporter for its product in a given destination country. Using the equations for prices in
(1), we define the average price as follows:
pd =
∫ s∗
s[sk − (1 + rd)u0,b]dG(sk) +
∫ ∞s∗
[sk − (1 + rd)(u0,b + F )
1 + f(1 + rd)
]dG(sk) (5)
It is easy to see, using the expressions for optimal prices in (1), that an increase in the value
25This result is consistent with the empirical evidence that larger shipments, proxied by high buyer valuation inthe model as buyers have unit demand, are more likely to use LC financing (Niepmann and Schmidt-Eisenlohr (2017);Crozet, Demir, and Javorcik (2017)). The literature refers to fixed LC-related fees to explain this empirical pattern.
13

of the outside option leads to a fall in the optimal price under each financing term. The result
is intuitive: when u0,b increases, the exporter is forced to offer a lower price to persuade the
importer to participate. Nevertheless, the effect of u0,b on the average price, as defined in (5), is
less straightforward. There is an obvious direct effect arising from a fall in the optimal price under
each financing term. However, there is also an indirect effect through the change in the extensive
margin of foreign buyers, to which the Turkish exporter extends trade credit:26
dpedu0,b
= −(1 + rd)
[∫ s∗
sdG(sk) +
1
1 + f(1 + rd)
∫ ∞s∗
dG(sk)
]︸ ︷︷ ︸
Direct effect
+[pOA(s∗)− pLC(s∗)
]g(s∗)
ds∗
du0,b︸ ︷︷ ︸Indirect effect
(6)
While the direct effect of u0,b on the average price is negative, the indirect effect is positive as
pOA(s∗) > pLC(s∗) and ds∗/du0,b > 0. The overall effect is negative if there is no adjustment on
the extensive margin, i.e. ds∗/du0,b = 0. In general, the smaller is the size of the extensive margin
adjustment, the larger the fall in the average price will be.
Result 2 The effect of a change in the outside option of foreign buyers on the average price of the
exporter, as defined in (5) is twofold. It has a negative direct effect, which arises from a fall in the
optimal price under each financing term. It also has a positive indirect effect through an increase
in the fraction of buyers sold on trade credit. The overall effect depends on the relative magnitudes
of the two effects.
3.3 Numerical exercise
What is the implication of ignoring the trade credit channel when considering price responses
to competitive shocks? We provide a simple numerical exercise to illustrate the importance of
the direct and indirect channels, through which changes in the level of market competition affect
average prices. Figure 3 plots changes in average prices and sales on trade credit terms against the
values of buyer’s outside option. The top panel of the figure illustrates the model’s prediction with
respect to an increase in the value of buyer’s outside option: the share of sales on trade credit terms
26The expression is derived using the Leibniz integral rule.
14

increases and average prices fall. As visible in the bottom panel, the effect on prices is partly offset
by the trade credit adjustment: the fall in average prices is larger in the absence of the trade credit
adjustment. As the initial share of sales on trade credit increases, leaving less room for further
adjustment, the wedge between price fall with and without trade credit adjustment narrows.
3.4 Alternative assumptions
Before proceeding to the empirical analysis, we briefly discuss the model’s predictions under the
alternative assumption of the foreign buyer having the full bargaining power. In this case, the
expected profits of the exporter from providing trade credit relative to asking for bank financing
do not depend on the buyer’s valuation sk. This implies that the exporter either extends trade
credit to all buyers or asks them to arrange for bank financing. In other words, the alternative
assumption about the relative bargaining power suppresses the buyer heterogeneity in terms of
product valuation and reduces the problem to a discrete choice between offering trade credit and
asking for bank financing. Nevertheless, the main message of the model remains unaffected. When
the value of the exporter’s outside option decreases due to an increase in the degree of market
competition, the model predicts that (i) offering trade credit becomes more likely, and (ii) price
under each financing term decreases.
4 Empirical Strategy and Results
4.1 Estimation strategy
The purpose of our empirical analysis is to examine the response of Turkish exporters to an ex-
ogenous shock to competition in the export market. Based on the model’s predictions, we test
the following hypotheses: (i) Turkish exporters increased provision trade credit for quota-bound
T&C products (relative to the control products) sold to the EU after the end of the MFA (Result
1); (ii) quota-bound T&C products saw a greater downward adjustment in prices than the control
products after the shock (Result 2); (iii) the price adjustment was larger for flows where trade
credit expansion was less feasible (Result 2).
Our analysis follows a difference-in-differences strategy. Starting with hypothesis (i), we test
whether Turkey experienced a greater shift towards exporter-financed exports in the post-MFA
15

period in products that were subject to binding MFA quotas in 2004 (the treated products) relative
to the products where the MFA quotas were not binding (the control products). Therefore, in our
analysis we compare changes in trade patterns in 2004 (the last year under the MFA rules) to
changes in trade patterns in 2005 (the first year when the MFA formally ended).27
Our analysis relies on the data at the firm, product, destination and year level.28 To take into
account the pre-shock trends in export financing, we estimate a model with the dependent variable
defined in terms of a first difference. In particular, the dependent variable in our estimating
equation, ∆ShOAijdt, denotes the annual change in the share of firm i’s exports on the OA terms,
measured in physical units, of a 6-digit HS product j destined for country d at time t. We use
quantities rather than values as the latter could suffer from potential confounding effects of changes
in prices taking place in response to a shock to competition (Result 2). As our baseline specification,
we estimate the following equation:
∆ShOAijdt = β0 + β1Postt ∗ Treatj + αdt + αj + αit + εijdt, (7)
where Treatj and Postt are indicator variables. Treatj is a binary variable identifying the treated
products (defined at the 6-digit HS level), and Postt is a binary variable that is equal to one for
t = 2005, and zero otherwise. Estimation in first differences eliminates any time-invariant firm-
product-destination level factors. The equation includes country-year fixed effects to capture all
shocks affecting equally all exports to the same market in a given year, and product fixed effects
to capture unobserved heterogeneity in secular trends across product groups. We also include
firm-year fixed effects to control for potential productivity or financial shocks.29 Our parameter
of interest is β1 which measures the effect of the shock on treated products in the post-treatment
period. A positive estimate of β1 would be consistent with Result 1. We cluster standard errors at
the 6-digit HS product level.
To test hypothesis (ii) (Result 2) we investigate the response of prices to the removal of the
MFA quotas in the EU market by estimating a model analogous to equation (7) with the change
27Even though the MFA formally ended in 2005, China continued to face quotas for some products in the EUmarket until 2007. As mentioned earlier, we drop these products from the empirical analysis.
28Table 2 presents the summary statistics for the sample used in the empirical analysis.29Recall that firms export multiple products to multiple countries so we have multiple observations for each
firm-year combination.
16

in unit values as the dependent variable:
∆ lnUVijdt = θ0 + θ1Postt ∗ Treatj + ηdt + ηj + ηit + εijdt, (8)
∆ lnUVijdt denotes the annual change in the logarithm of the unit value (value divided by specified
quantity) of product j exported by firm i to destination country d at time t.30 A negative estimate
of θ1 would be consistent with the hypothesis that the removal of the MFA quotas forced Turkish
exporters of quota-bound T&C products to lower their prices in the EU market.
Our model also implies that those who provide more trade credit to their trading partners adjust
their prices to a smaller extent. Testing this prediction is challenging as pricing and financing
decisions are made simultaneously. Therefore, we take an indirect approach. In particular, we test
whether flows with a high initial share of OA-financing (sales on trade credit) experienced a larger
fall in prices. The intuition is simple: a high initial share of OA-financing implies there is less room
for adjustment on the financing front and thus there should be a larger adjustment in prices. We
estimate the following triple-differenced equation:
∆ lnUVijdt = φ0 + φ1ShQOAijd,t=0 ∗ Postt ∗ Treatj + φ2Postt ∗ Treatj (9)
+ φ3ShQOAijd,t=0 ∗ Postt + φ4ShQ
OAijd,t=0 ∗ Treatj + φ5ShQ
OAijd,t=0
+ αdt + αj + αit + eijdt,
where ShQOAijd,t=0 is the average share of exports on OA terms in a flow specific to a given exporter
i product j and destination d over the 2002-2003 period. A negative estimate of φ1 would be con-
sistent with Result 2 and support the view that providing trade credit and offering price discounts
can be substitutes.
We use two measures of treatment. First, we define quota-bound products as those in which the
quota fill rate exceeded 50 percent in 2004. More precisely, we define a treated product as a 6-digit
30Since price distributions are known to be skewed, we follow the literature (e.g. Khandelwal, Schott, and Wei(2013)) and use logarithmic transformation to reduce the influence of outliers.
17

HS product in which the quota faced by China was binding in 2004:
Treatj = 1 , if Quota fill ratej,t=2004 > 0.5
Treatj = 0 , Otherwise
The choice of this cutoff level is driven by the distribution of quota fill rates as shown in Figure 1.
In particular, the figure shows that non-zero quota fill rates are clustered above 0.5. Second, we
use a continuous measure of treatment, namely the product-specific quota fill rate in 2004.
The key identifying assumption behind the differences-in-differences approach is that the treated
group would have followed a similar trend as the control group in the absence of treatment. In the
upper panel of Figure 4, we plot the change in the share of exports financed on OA terms in the
pre-shock period (2004 relative to 2003) against the quota fill rate in 2004. We show separate linear
predictions for treated and the control group (i.e., those with the quota fill rate above and below
the 50% threshold, respectively). We note two patterns. First, the slope coefficients estimated for
the treated and the control products are not significantly different from each other in the pre-shock
period.31 This tells us that between 2003 and 2004 the treated and the control group followed the
same trend. Second, the estimated slope coefficients are not significantly different from zero. It
indicates that in the pre-shock period, there was no systematic relationship between changes in
provision of trade financing and the quota fill rate.
In the lower panel of Figure 4, we add the corresponding scatter plot for the change in the share
of exports financed on OA terms in the post-shock period (2005 relative to 2004). As illustrated by
the solid line, changes in the provision of trade credit for the control products stayed close to zero
in the post-shock period. This is in line with the view that the control products did not experience
a competitive shock in 2005. When we consider the treated products, we clearly see that that post-
shock (solid) line has a positive slope and lies above the pre-shock (dashed) line.32 This suggests
that the treated products, i.e., those with relatively higher quota fill rates, experienced a shift
towards exporter-financed exports in the post-MFA period. And this shift was more pronounced
31The estimated slope coefficients are -0.054 and 0.004, respectively. A test of equality of slope coefficients yieldsa Chi-squared test statistic of 0.43 (p-value=0.51).
32A test of equality of slope coefficients for the control and treated products in the post-shock period yields aChi-squared test statistic of 5.35 (p-value=0.02). A similar test for equality of slope coefficients before and after theshock for treated products yields a Chi-squared test statistic of 5.48 (p-value=0.02).
18

the higher the fill rate. This pattern is consistent with our first hypothesis.
We observe similar patterns for changes in unit values. Figure 5 shows that the relationship
between changes in unit values and quota fill rates is almost flat in 2004. While the relationship
remains flat for the control products in 2005, it becomes negative for the treated group.33
4.2 Results
The results from estimating equation (7) provide support for the first theoretical prediction. In
Table 3, we present specifications with two sets of fixed effects (i.e., with and without firm-year
fixed effects) and with two measures of treatment (indicator variable and continuous measure). We
find that the MFA products with the binding quotas experienced a disproportionate increase in
the share of exporter-financed exports in the post-shock period relative to the control products.
The coefficient of interest is positive and statistically significant in all specifications. Its magnitude
changes relatively little between the specifications including different sets of fixed effects, thus
suggesting that various sources of identifying variation give us the same answer. The estimate in
the more stringent specification in the second column suggests that Turkish exporters of products
affected by the MFA shock increased their reliance on the OA financing by 3.75 percentage points
more than exporters of other products. We obtain similar estimates using the continuous measure:
moving from the 25th percentile to the 75th percentile of the distribution of the 2004 quota fill
rates, i.e. from the fill rate of 30% to 87%, is associated with an additional 2.66 percentage points
increase in reliance on the OA financing after the end of the MFA. In sum, the evidence suggests
that Turkish exporters who experienced an increase in competitive pressures were pushed to provide
more export financing relative to exporters of products where no change in the level of competition
was registered.
Moving on to the second hypothesis, we also find support for the prediction that Turkish ex-
porters responded to increases in competitive pressures by lowering prices. This is evident from
Table 4 where coefficient on the variable of interest is (as expected) negative and statistically sig-
nificant in all specifications. As in the case of adjustment to financing, specifications with different
33A test of equality of slope coefficients for the control and treated products in the pre- and post-shock periodsyields a Chi-squared test statistic of 1.21 (p-value=0.27) and 7.57 (p-value=0.01), respectively. We also reject theequality of slope coefficients for treated products before and after the end of the MFA (Chi-squared test statistic=16.9(p-value=0.00)).
19

sets of fixed effects and alternative definitions of treatment lead to the same conclusions. We find
that on average the quota-bound flows saw a 0.07 log-points decline in prices relative to the control
products. Put differently, moving from the 25th percentile to the 75th percentile of the distribution
of quota fill rates as of 2004, is associated with a 0.048 log-points decrease in prices after the end
of the MFA.
Finally, we test the third hypothesis pertaining to the substitution between adjusting prices and
adjusting financing. More specifically, we examine whether flows with a high initial share of OA
financing experienced a larger fall in prices. The intuition is simple: a high initial share of OA
financing implies there is less room for adjustment on the financing front and thus there should be
a larger adjustment in prices.
The results are presented in Table 5. In the first two columns, we test the premise of this exercise.
Is it the case that a higher initial share of OA financing is associated with a lower adjustment to
financing after the shock? We do so by relating the change in the share of OA-financed exports to
its pre-shock share and allowing for a differential effect for quota-bound products after the end of
the MFA. As in Table 3, we find that the treated products saw an increase in OA financing after
the shock relative to the control products. Importantly, we also see that this increase was lower for
flows with a high pre-shock share of OA-financed exports, thus confirming our priors.
More interestingly, the results presented in the last two columns suggest that flows with a
higher initial reliance on OA financing experienced a larger fall in prices. This is consistent with
our hypothesis that having less room for adjustment of financing forced exporters to adjust prices
to a larger extent. The difference is noticeable. Consider two treated flows with extreme use of
OA financing before the shock: one has ShQOAt=0 = 0 and the other ShQOAt=0 = 1. The estimates
presented in the last column of Table 5 imply that the latter experienced a 0.12 log-points additional
fall in prices compared to the former after the end of the MFA.
4.3 Robustness checks
Placebo test
To provide further support for our identification strategy, we conduct a placebo test. We assign
January 2004 as the placebo date of the MFA quota removal (as opposed to the actual date of
20

January 2005) and restrict the sample to the 2002-2004 period. In other words, we compare
changes in 2003-4 to those 2002-3, both of which pertain to the pre-shock period. The estimation
results are presented in the first two columns of Table 6. The coefficient on our variable of interest
D2004t ∗ Treatp, where D2004t is a dummy variable denoting the year 2004, is not statistically
significant, thus indicating that there was no difference in the price and financing adjustment
between the treated and the control products prior to the quota removal. This boosts our confidence
in the baseline findings.
Longer time period
Next, we extend the time period considered to cover 2002-2007 and allow for a differential adjust-
ment between the treated and the control products in each year. As can been seen in columns 3-4,
while the interaction terms of interest bear the expected signs for 2005-2007, only the interaction
for 2005 is statistically different from zero. This suggests that Turkish exporters increased provision
of trade financing and lowered prices of the treated products relative to the control products imme-
diately after the quota removal. The adjustment in subsequent years does not exhibit a statistically
significant difference between the two groups of products.
Survival bias
One may be concerned that the export flows where the OA financing was already offered in 2004
were more likely to survive in the post-MFA period. To address this possibility, we follow Paravisini,
Rappoport, Schnabl, and Wolfenzon (2014) who employ the methodology suggested by Mulligan
and Rubinstein (2008).
In the first step, we estimate the probability that exports of product j to country d by firm
i taking place in 2004 will continue in 2005. The explanatory variables include the value of the
export flow in 2003 (logged), the share of exports financed on the OA terms in 2003, a dummy for
the treated products, country fixed effects and exporter fixed effects. As anticipated, the results
presented in the first column of Table 7 indicate that larger export flows were more likely to survive.
Although the coefficient on the indicator for the treated products bears a negative sign, it is not
statistically significant. The share of OA exports is not significantly associated with survival either.
In the second step, we focus on the subsample of flows with the estimated continuation proba-
21

bility above the 50th percentile and examine the impact of the MFA shock on financing and price
adjustment in the treated and control products. In column (2), we estimate the baseline model on
the full sample as in Table 3. In column (3), we restrict the sample to flows with a higher proba-
bility of survival. The estimated coefficient of interest is positive and also similar in magnitude to
the estimate obtained using the full sample. In particular, we cannot reject the hypothesis of equal
estimates obtained from the two samples. Nevertheless, the coefficient of interest is less precisely
estimated in column (3) due to the smaller sample size. In the next two columns, we repeat the
same exercise for the adjustment in prices. Again, we find that restricting the sample to flows with
a higher probability of survival has little impact on the estimates of interest.
5 Conclusions
Our simple theoretical framework makes three predictions which we take to the data. We expect to
see that (i) Turkish exporters increased provision of trade credit for quota-bound products (relative
to the control products) sold to the EU after the end of the MFA; (ii) quota-bound products saw
a greater downward adjustment in prices than the control products after the shock; (iii) the price
adjustment was larger for flows where trade credit expansion was less feasible.
The results of our analysis provide support for all three predictions. We find that the increase
in competition pushed Turkish exporters of the affected products to provide trade credit to their
trading partners. The share of exporter-financed exports increased by about 4 percentage points in
the affected products relative to the control products after the shock. The shock also forced Turkish
exporters to lower prices by about 0.07 log points relative to the control products. Finally, we find
some evidence of substitution between adjustment through extending trade credit and lowering
prices.
Our results suggest that studies examining the response of export prices to competitive shocks
abroad may be underestimating the effects unless they take into account adjustments taking place
through the trade credit channel. On the policy front, our findings have implications for how the
large sums of money allocated to trade-related development assistance could be spent efficiently:
the ability to provide financing can give producers a competitive edge in foreign markets.
22

References
Ahn, J. B. (2014): “Understanding Trade Finance: Theory and Evidence from Transaction-level
Data.,” Working paper, IMF mimeo.
Amiti, M., and D. E. Weinstein (2011): “Exports and Financial Shocks,” The Quarterly Journal
of Economics, 126(4), 1841–1877.
Antras, P., and C. F. Foley (2015): “Poultry in Motion: A Study of International Trade
Finance Practices,” Journal of Political Economy, 123(4), 809–852.
Berkowitz, D., J. Moenius, and K. Pistor (2006): “Trade, Law, and Product Complexity,”
The Review of Economics and Statistics, 88(2), 363–373.
Bernard, A. B., S. J. Redding, and P. K. Schott (2010): “Multiple-Product Firms and
Product Switching,” American Economic Review, 100(1), 70–97.
(2011): “Multiproduct Firms and Trade Liberalization,” The Quarterly Journal of Eco-
nomics, 126(3), 1271–1318.
Brennan, M. J., V. Maksimovic, and J. Zechner (1988): “Vendor Financing,” The Journal
of Finance, 43(5), 1127–1141.
Chaney, T. (2016): “Liquidity Constrained Exporters,” Journal of Economic Dynamics and Con-
trol, 72.
Chor, D., and K. Manova (2012): “Off the cliff and back? Credit conditions and international
trade during the global financial crisis,” Journal of International Economics, 87(1), 117–133.
Crozet, M., B. Demir, and B. Javorcik (2017): “Trade, Risk, and the Great Trade Collapse,”
Unpublished manuscript.
Dai, X. (2009): “Understanding EU-China Relations: An Uncertain Partnership in the Making,”
in China : The Rising Power, ed. by G. Hauser, and F. Kernic, pp. 63–86. Peter Lang.
Eck, K., M. Engemann, and M. Schnitzer (2015): “How Trade Credits Foster Exporting,”
Review of World Economics, 151, 73101.
23

Eckel, C., and J. P. Neary (2010): “Multi-Product Firms and Flexible Manufacturing in the
Global Economy,” Review of Economic Studies, 77(1), 188–217.
Engemann, M., K. Eck, and M. Schnitzer (2014): “Trade Credits and Bank Credits in
International Trade: Substitutes or Complements?,” The World Economy, 37(11), 1507–1540.
Fabbri, D., and L. Klapper (2016): “Bargaining Power and Trade Credit,” Journal of Corporate
Finance.
Fisman, R., and I. Love (2003): “Trade Credit, Financial Intermediary Development, and In-
dustry Growth,” Journal of Finance, 58(1), 353–374.
Fisman, R., and M. Raturi (2004): “Does Competition Encourage Credit Provision? Evidence
from African Trade Credit Relationships,” Review of Economics and Statistics, 86(1), 345352.
Glady, N., and J. Potin (2011): “Bank Intermediation and Default Risk in International Trade-
Theory and Evidence,” Mimeo, ESSEC Business School.
Greenaway, D., A. Guariglia, and R. Kneller (2007): “Financial factors and exporting
decisions,” Journal of International Economics, 73(2), 377–395.
Harrigan, J., and G. Barrows (2009): “Testing the Theory of Trade Policy: Evidence from
the Abrupt End of the Multifiber Arrangement,” The Review of Economics and Statistics, 91(2),
282–294.
Hoefele, A., T. Schmidt-Eisenlohr, and Z. Yu (2016): “Payment Choice in International
Trade: Theory and Evidence from Cross-country Firm Level Data,” Canadian Journal of Eco-
nomics, 49(1).
Inderst, R., and H. M. Muller (2004): “The effect of capital market characteristics on the
value of start-up firms,” Journal of Financial Economics, 72(2), 319–356.
Khandelwal, A. K., P. K. Schott, and S.-J. Wei (2013): “Trade Liberalization and Em-
bedded Institutional Reform: Evidence from Chinese Exporters,” American Economic Review,
103(6), 2169–95.
24

Manova, K. (2008): “Credit constraints, equity market liberalizations and international trade,”
Journal of International Economics, 76(1), 33–47.
(2013): “Credit Constraints, Heterogeneous Firms, and International Trade,” Review of
Economic Studies, 80, 711–744.
Manova, K., S.-J. Wei, and Z. Zhang (2015): “Firm Exports and Multinational Activity Under
Credit Constraints,” The Review of Economics and Statistics, 97(3), 574–588.
Mateut, S. (2011): “Reverse trade credit - the use of prepayments by French firms.,” Working
Paper 12, CFCM.
Mayer, T., M. J. Melitz, and G. I. P. Ottaviano (2014): “Market Size, Competition, and
the Product Mix of Exporters,” American Economic Review, 104(2), 495–536.
McMillan, J., and C. Woodruff (1999): “Interfirm Relationships and Informal Credit in
Vietnam,” Quarterly Journal of Economics, 114, 1285–1320.
Melitz, M. J. (2003): “The Impact of Trade on Intra-Industry Reallocations and Aggregate
Industry Productivity,” Econometrica, 71(6), 1695–1725.
Mian, S. L., and C. W. Smith (1992): “Accounts Receivable Management Policy: Theory and
Evidence,” The Journal of Finance, 47(1), 169–200.
Mortensen, D. T., and R. Wright (2002): “Competitive Pricing and Efficiency in Search
Equilibrium,” International Economic Review, 43(1), 1–20.
Mulligan, C. B., and Y. Rubinstein (2008): “Selection, Investment, and Women’s Relative
Wages Over Time,” The Quarterly Journal of Economics, 123(3), 1061–1110.
Niepmann, F., and T. Schmidt-Eisenlohr (2017): “International trade, risk and the role of
banks,” Journal of International Economics, 107, 111 – 126.
Olsen, M. (2016): “How Firms Overcome Weak International Contract Enforcement: Repeated
Interaction, Collective Punishment, and Trade Finance,” Unpublished manuscript.
25

Paravisini, D., V. Rappoport, P. Schnabl, and D. Wolfenzon (2014): “Dissecting the
Effect of Credit Supply on Trade: Evidence from Matched Credit-Export Data,” The Review of
Economic Studies, 01.
Pavcnik, N. (2002): “Trade Liberalization, Exit, and Productivity Improvements: Evidence from
Chilean Plants,” Review of Economic Studies, 69(1), 245–276.
Petersen, M., and R. Rajan (1997): “Trade Credit: Theories and Evidence,” The Review of
Financial Studies, 10(3), 661691.
Schmidt-Eisenlohr, T. (2013): “Towards a theory of trade finance.,” Journal of International
Economics, 91, 96–112.
Smith, J. K. (1987): “Trade Credit and Informational Asymmetry,” The Journal of Finance,
42(4), 863–872.
U.S. Department of Commerce International Trade Administration (2012): “Trade
Finance Guide. A Quick Reference for U.S. Exporters,” .
Wilner, B. (2000): “The Exploitation of Relationships in Financial Distress: The Case of Trade
Credit,” Journal of Finance, 55(1), 15378.
Wilson, N., and B. Summers (2002): “Trade credit terms offered by small firms: Survey evidence
and empirical analysis,” Journal of Business Finance and Accounting, 29(3/4), 317351.
26

Tables
Table 1: Aggregate Exports of MFA Products by Method of Payment (2002)
Share of OA exports Share of CIA exports Share of LC exports Share of DC exports
EU 0.60 0.01 0.07 0.32
Non-EU 0.58 0.03 0.21 0.18
Notes: This table shows distribution of Turkey’s aggregate exports of MFA products to the EU and other countries
by method of payment in the year 2002.
Table 2: Summary Statistics
2004 2005
Avg product per firm 8.620 8.940
(10.548) (11.223)
Avg destination per firm 5.755 5.748
(4.093) (4.046)
Avg product per firm-destination 4.520 4.682
(5.109) (5.302)
Avg value per firm-product-dest (USD) 279,866 262,621
(1,226,811) (1,153,157)
Treat Untreat Treat Untreat
Number of firms 338 1652 372 1780
Number of products 95 313 95 316
Share of OA exports 0.697 0.658 0.771 0.691
(0.422) (0.437) (0.388) (0.426)
Log of unit value 1.171 1.810 1.108 1.829
(0.542) (1.163) (0.535) (1.168)
Log of value 10.324 10.322 10.226 10.281
(2.007) (2.296) (1.961) (2.262)
Notes: This table shows the summary statistics for the baseline sample. Treat is equal to one for quota-
bound HS6 products, for which the MFA quota fill rates exceed 50 percent in 2004, and is equal to zero
otherwise. Standard deviations in parentheses.
27

Table 3: End of the MFA and Provision of Trade Credit
(1) (2) (3) (4)
Postt ∗ Treatj 0.0489∗∗∗ 0.0375∗
(0.0149) (0.0195)
Postt∗ Quota fill ratej,t=2004 0.0631∗∗∗ 0.0467∗
(0.0174) (0.0239)
N 17852 17852 17852 17852
R2 0.0258 0.234 0.0259 0.234
Country-year FE + + + +
Product FE + + + +
Firm-year FE + +
Notes: The dependent variable is the annual change in the share of exports on OA terms of HS6
product j exported by firm i to country d at time t, where t = 2004, 2005. Treatj is defined as
Treatj = 1 , if Quota fill ratej,t=2004 > 0.5
Treatj = 0 , Otherwise
Postt is a dummy variable that takes on the value one for t = 2005, zero for t = 2004. *, **, ***
represent significance at the 10, 5, and 1 percent levels, respectively. Robust standard errors are
clustered at the product level.
28

Table 4: End of the MFA and Unit Values
(1) (2) (3) (4)
Postt ∗ Treatj -0.0669∗∗∗ -0.0745∗∗∗
(0.0236) (0.0284)
Postt∗ Quota fill ratej,t=2004 -0.0985∗∗∗ -0.0839∗∗
(0.0279) (0.0370)
N 17852 17852 17852 17852
R2 0.0511 0.271 0.0513 0.271
Country-year FE + + + +
Product FE + + + +
Firm-year FE + +
Notes: The dependent variable is the annual change in the logarithm of unit values (value di-
vided by reported quantities) of HS6 product j exported by firm i to country d at time t, where
t = 2004, 2005.Treatj is defined as
Treatj = 1 , if Quota fill ratej,t=2004 > 0.5
Treatj = 0 , Otherwise
Postt is a dummy variable that takes on the value one for t = 2005, zero for t = 2004. *, **, ***
represent significance at the 10, 5, and 1 percent levels, respectively. Robust standard errors are
clustered at the product level.
29

Table 5: End of the MFA and Unit Values: Interactions with Initial Level of TradeCredit
Dependent variable: ∆ShOAijdt ∆ShOAijdt ∆ lnUVijdt ∆ lnUVijdt
(1) (2) (3) (4)
ShQOAijd,t=0 ∗ Postt ∗ Treatj -0.0688∗ -0.119∗∗∗ -0.111∗ -0.122∗
(0.0408) (0.0442) (0.0589) (0.0730)
Postt ∗ Treatj 0.0778∗ 0.0921∗∗ 0.00275 -0.0301
(0.0405) (0.0432) (0.0470) (0.0518)
ShQOAijd,t=0 ∗ Postt 0.178∗∗∗ 0.359∗∗∗ 0.0458 0.00157
(0.0151) (0.0323) (0.0325) (0.0436)
ShQOAijd,t=0 ∗ Treatt -0.0193 0.0403 0.0205 -0.00206
(0.0208) (0.0246) (0.0328) (0.0438)
ShQOAijd,t=0 -0.289∗∗∗ -0.474∗∗∗ 0.00848 0.0226
(0.0114) (0.0190) (0.0178) (0.0253)
N 13790 13790 13790 13790
R2 0.121 0.341 0.0538 0.276
Country-year FE + + + +
Product FE + + + +
Firm-year FE + +
Notes: ∆ShOAijdt (∆ lnUVijdt) the annual change in the share of exports on OA terms (logarithm of unit values) of
HS6 product j exported by firm i to country d at time t, where t = 2004, 2005. ShQOAijd,t=0 is the average share of
OA exports for a flow ijd over 2002-2003. Treatj is defined as
Treatj = 1 , if Quota fill ratej,t=2004 > 0.5
Treatj = 0 , Otherwise
Postt is a dummy variable that takes on the value one for t = 2005, zero for t = 2004. *, **, *** represent significance
at the 10, 5, and 1 percent levels, respectively. Robust standard errors are clustered at the product level.
30

Table 6: Robustness Checks
Dependent variable: ∆ShOAijdt ∆ lnUVijdt ∆ShOAijdt ∆ lnUVijdt
(1) (2) (3) (4)
D2004t ∗ Treatj 0.0242 0.00837 0.0209 -0.0128
(0.0293) (0.0618) (0.0319) (0.0577)
D2005t ∗ Treatj 0.0491∗ -0.0837∗
(0.0297) (0.0444)
D2006t ∗ Treatj 0.0124 -0.0849
(0.0341) (0.0528)
D2007t ∗ Treatj 0.0187 -0.0577
(0.0282) (0.0511)
N 7717 7717 25062 25062
R2 0.251 0.281 0.236 0.268
Country-year FE + + + +
Product FE + + + +
Firm-year FE + + + +
Notes: ∆ShOAijdt (∆ lnUVijdt) the annual change in the share of exports on OA terms (logarithm
of unit values) of HS6 product j exported by firm i to country d at time t. Treatj is defined as
Treatj = 1 , if Quota fill ratej,t=2004 > 0.5
Treatj = 0 , Otherwise
DY eart is a dummy variable that takes on the value one for t = Y ear, and zero otherwise.
*, **, *** represent significance at the 10, 5, and 1 percent levels, respectively. Robust standard
errors are clustered at the product-level.
31

Table 7: Controlling for Survival
Probit OLS
Dependent variable: Survival probability ∆ShOAijdt ∆ShOAijdt ∆ lnUVijdt ∆ lnUVijdt
(1) (2) (3) (4) (5)
All All > 50th pctl All > 50th pctl
Postt ∗ Treatj 0.0380∗∗ 0.0333 -0.0654∗∗ -0.0926∗∗∗
(0.0158) (0.0223) (0.0266) (0.0358)
lnXicp,2003 0.194∗∗∗
(0.0104)
ShQOAijd,t=0 -0.00001
(0.0590)
Treat -0.0261
(0.0614)
N 8454 17852 7909 17852 7909
R2 0.156 0.147 0.175 0.178
Country FE +
Firm FE + + + + +
Country-year FE + + + +
Product FE + + + +
Notes: In the first column, the dependent variable is a binary variable that represents survival of an ijd export flow in 2004
after the end of the MFA. ∆ShOAijdt (∆ lnUVijdt) the annual change in the share of exports on OA terms (logarithm of unit
values) of HS6 product j exported by firm i to country d at time t. Treatj is defined as
Treatj = 1 , if Quota fill ratej,t=2004 > 0.5
Treatj = 0 , Otherwise
Postt is a dummy variable that takes on the value one for t = 2005, zero for t = 2004. *, **, *** represent significance at the 10,
5, and 1 percent levels, respectively. Robust standard errors are clustered at the product-level. Results presented in columns
(3) and (5) are based on the flows above the 50th percentile of the estimated continuation probability from the first column.
The number of observations in the first column is smaller as there is only one observation per ijd flow.
32

Figures
Figure 1: Distribution of Quota Fill Rates as of 20040
.1.2
.3.4
.5
Fra
ctio
n
0 .2 .4 .6 .8 1
Quota fill rate
Notes: The figure shows the distribution of quota fill rates (as of 2004) in our data. Observations where quota fill
rates are equal to zero are excluded for visibility as they account for about 70% of the sample.
33

Figure 2: Share of Exports on Open Account Terms before and after the End of the MFA
.2.4
.6.8
1S
ha
re o
f O
A E
xp
ort
s
0 .2 .4 .6 .8 1Quota fill rate
Year=2003 Year=2004 Year=2005
Year=2003 Year=2004 Year=2005
Notes: A marker represents the average share of exports on OA terms over firms, products and destination countries
for a given quota-fill rate and year. Lines represent fitted values of (unconditional) linear predictions.
34

Figure 3: Price and Trade Credit Adjustment Using Simulated Data
.2.4
.6.8
11
.2A
ve
rag
e p
rice
s
0.2
.4.6
.8S
ha
re o
f sa
les o
n tra
de
cre
dit (μ
)
.8 1 1.2 1.4 1.6u
0,b
Share of sales on trade credit (left)
Average prices p (right)
11
.01
1.0
21
.03
1.0
4Δ
p w
/o fi
na
ncin
g a
dju
stm
en
t / to
tal Δ
p
0 .2 .4 .6 .8Initial share of sales on trade credit (μ
0)
Notes: This figure illustrates the importance of the trade credit channel for price responses to increases in the degree of market
competition. The numerical example assumes that buyer valuations follow a Pareto distribution with shape parameter equal
to two: G(sk) = 1 − (1/s)2, and sets λd = 0.9, f = 0.05, F = 0.01, and rd = 0.05. Starting from an initial value of
u0,b = 1, the figure in the upper panel plots the average prices and the share of sales on trade credit against increasing values
of u0,b ∈ [0.8, 1.6]. The lower panel illustrates the importance of the financing channel for resulting price changes using the
expression in (6). It plots the ratio of the change in average prices without the trade credit (indirect) channel to total price
change against the initial share of sales on trade credit.
35

Figure 4: Change in Share of Exports on Open Account Terms before and after the End of the MFA
−.3
−.2
−.1
0.1
.2.3
∆S
hO
A
0 .2 .4 .6 .8 1
Quota fill rate
Panel A: Before the end of the MFA (t = 2004)
−.3
−.2
−.1
0.1
.2.3
∆S
hO
A
0 .2 .4 .6 .8 1
Quota fill rate
Year=2004 Year=2005 Year=2004 Year=2005
Panel B: Before and after the end of the MFA (t = 2004, 2005)
Notes: ∆ShOA denotes annual change in the share of exports on OA terms. A marker represents average ∆ShOA over firms,
products and destination countries for a given quota-fill rate and year. Lines represent fitted values of (unconditional) linear
predictions. The vertical line represents the quota fill rate of 0.5 as of 2004.
36

Figure 5: Change in Prices before and after the End of the MFA
−.2
0.2
.4.6
∆ln
UV
0 .2 .4 .6 .8 1
Quota fill rate
Panel A: Before the end of the MFA (t = 2004)
−.2
0.2
.4.6
∆ln
UV
0 .2 .4 .6 .8 1
Quota fill rate
Year=2004 Year=2005 Year=2004 Year=2005
Panel B: Before and after the end of the MFA (t = 2004, 2005)
Notes: ∆ lnUV denotes annual change in the logarithm of unit values. A marker represents average ∆ lnUV over firms,
products and destination countries for a given quota-fill rate and year. Lines represent fitted values of (unconditional) linear
predictions. The vertical line represents the quota fill rate of 0.5 as of 2004.
37