Embed Size (px)
Citation preview

Donation and Transplantation Canadian Eye and Tissue Banking Statistics 2016
A Report from the Canadian Eye and Tissue Data Committee

2016 Canadian Eye and Tissue Banking Statistics 2
Extracts of the information in this report may be reviewed, reproduced or translated for educational purposes, research or private study but not for sale or for use in conjunction with commercial purposes. Any use of the information should be accompanied by an acknowledgement of Canadian Blood Services and the Eye and Tissue Data Committee as the source. Any other use of this publication is strictly prohibited without prior permission from Canadian Blood Services. Canadian Blood Services assumes no responsibility or liability for any consequences, losses or injuries, foreseen or unforeseen, whatsoever or howsoever occurring, which might result from the implementation, use or misuse of any information or recommendations in this report. This report contains recommendations that must be assessed in the context of a full review of applicable medical, legal and ethical requirements in any individual case.
Production of this report has been made possible through a financial contribution from Health Canada, and the Provincial and Territorial governments. The views expressed herein do not necessarily represent the views of the Federal, Provincial or Territorial governments. Canadian Blood Services 1800 Alta Vista Drive Ottawa, Ontario K1G 4J5 Canada 613-739-2300 Email: [email protected]

2016 Canadian Eye and Tissue Banking Statistics 3
Executive Summary
Data Collection Initiative
Beginning in 2012, Canadian Blood Services, on
behalf of the Eye and Tissue Data Committee (ETDC),
has received data submissions from all Canadian eye
and tissue programs. Data definitions have been
established and data training delivered to the
Canadian eye and tissue community.
Canadian Blood Services maintains and collates data
for review by the ETDC. Each year a summary report
is generated. The purpose of this report is to provide
information and insights into the Canadian recovery,
production and distribution of ocular and tissue
allografts across Canada.
Prospective data collection was initiated in 2012. The
ETDC implemented improvements to the processes
and requirements involved in annual data collection
initiatives and as of 2016, has resulted in a more
comprehensive and robust data set on which to
report. 2016 data was submitted from 16 eye and
tissue banks and 1 recovery program representing a
census of all Canadian eye and tissue banking activity
(results were not available for select metrics for
certain programs, as indicated). Data on allografts
imported by Canadian tissue banks from the United
States is available for the first time in 2016; however,
data on allografts imported directly by Canadian
hospitals from the United States is not readily
available. 2016 also represents the first year in which
provincial results are presented.
National Results on Key Metrics
In 2016 Canadian Eye and Tissue Banks received
45,609 deceased donor referrals for potential tissue
donation, which represents a 1.7% decrease relative
to 2015, with an estimated 54% of those approached
consenting to tissue donation. Based on available
data, consent rates have continued to rise steadily
from 2013.
Although 97% of deceased donor referrals have
consistently come from hospitals, with the new data
collected in 2016 we see that hospitals are the
referring agency for approximately 81% of referrals
for actual deceased donors; the second largest
source (accounting for 8%) comes from extended
care facilities such as nursing homes and hospices.
In 2016, tissue was recovered from 4,418 deceased
donors (1.2% fewer than in 2015) and 467 living
donors (16% fewer than in 2015). Despite reduced
distribution for keratoplasty (cornea transplantation)
in 2015, 2016 activity appears to have returned to
2014 levels.
Ocular tissue production and distribution results in
2016 indicated that 4,835 corneas were produced
for transplantation, with 4,135 domestically-sourced
corneas being distributed for surgical use and an
additional 367 corneas sourced from the United
States being distributed in Alberta, Quebec and
Manitoba.
The demand for DMEK (Descemet Membrane
Endothelial Keratoplasty) continues to increase, with
the total corneas used for DMEK procedures in 2016
being 72% greater than in 2015.
With respect to non-ocular tissue production and
distribution, there were 10,781 non-ocular tissue
grafts produced and released to inventory nationally
in 2016, with 11,952 being distributed for transplant
in total. Non-ocular tissue production increased by
1% relative to 2015, while the total number of
deceased donor grafts distributed for transplant
decreased by 1.6% from 2015.
0
500
1000
1500
2000
2500
3000
3500
4000
4500
2013 2014 2015 2016
Intermediate-Term Preserved Cornea Distribution
Distributed for non-keratoplasty surgicalproceduresDistributed, procedureunknown
Distribution for PK/AK/DSEK/DSAEK/otherkeratoplastyDistribution forDMEK/DMAEK

2016 Canadian Eye and Tissue Banking Statistics 4
Alberta and Quebec lead Canadian production and
distribution of non-ocular tissue grafts.
Saskatchewan and Alberta are the primary producers
and distributors of surgical bone grafts from living
donors.
The total of all ocular and tissue grafts distributed by
Canadian Eye and Tissue Banks in 2016 was 17,970
grafts, an increase of 8.3% above the decreased
activity in 2015. This returns distribution activity to
2013 levels.
Acknowledgements and Future Directions
This prospective data collection provides all jurisdictions
with insight into tissue donation activity as well as to
the Canadian production and distribution of ocular and
tissue grafts. Canadian eye and tissue programs are to
be commended on their leadership and their
contributions to this data analysis.
This report provides valued information documenting
changes in system performance from 2013 to 2016 and
provides insight into the current tissue environment.
Moving forward, Canadian Blood Services will continue
to work with the Eye and Tissue communities to
advance and improve data collection and collation of
performance data to support all programs and
stakeholders in their valuable efforts to provide the
donation and allograft services Canadians require.
0
2,000
4,000
6,000
8,000
10,000
12,000
14,000
2013 2014 2015 2016
Tota
l gra
fts
fro
m li
vin
g o
r d
ecea
sed
do
no
rs
Tissue distribution (non-ocular)
Tissue production (non-ocular)
2016 Canadian Eye and Tissue Banking Statistics 5
Table of Contents
Executive Summary ....................................................................................................................................... 3
Data Collection Initiative ........................................................................................................................... 3
National Results on Key Metrics ............................................................................................................... 3
Acknowledgements and Future Directions ............................................................................................... 4
1.0 Introduction ............................................................................................................................................ 6
1.1 Canadian Eye and Tissue Banks.......................................................................................................... 7
2.0 2016 Canadian View of Tissue Donation and Transplantation ............................................................... 8
3.0 Comparative Analysis .............................................................................................................................. 9
3.1 Canadian Eye and Tissue Banks .......................................................................................................... 9
3.2 Canadian Eye and Tissue Banking Activity .......................................................................................... 9
3.3 Cornea Processing and Distribution, 2016 ........................................................................................ 10
4.0 2016 Canadian Eye & Tissue Banking Deceased Donation Activity ...................................................... 11
4.1 Total Donor Referrals ........................................................................................................................ 11
4.2 Consent Rate ..................................................................................................................................... 11
4.3 Deceased Donor: National Analysis .................................................................................................. 12
4.4 Deceased Donor: 2016 Provincial Analysis ....................................................................................... 13
5.0 2016 Canadian Eye & Tissue Banking Living Donation Activity ............................................................ 15
5.1 Surgical Bone Donation ..................................................................................................................... 15
5.2 Amnion Donation .............................................................................................................................. 16
5.3 Living Donation: 2016 Provincial Analysis ......................................................................................... 16
6.0 2016 Canadian Eye & Tissue Production and Distribution Activity ...................................................... 18
6.1 Total Corneas Distributed for Transplant ......................................................................................... 18
6.2 Type of Endothelial Keratoplasty ...................................................................................................... 19
6.3 Ocular Tissue Production and Distribution: 2016 Provincial Analysis .............................................. 20
6.4 Non-Ocular Tissue Grafts Processed and Released to Inventory ..................................................... 22
6.5 Non-Ocular Tissue Grafts Distributed to Transplant ......................................................................... 23
6.6 Deceased Donor Non-Ocular Tissue: 2016 Provincial Analysis ......................................................... 24
Conclusion ................................................................................................................................................... 27
Appendix A: Definitions .............................................................................................................................. 28
Appendix B: Eye and Tissue Data Committee Membership ....................................................................... 31
Appendix C: List of Contributing Programs ................................................................................................. 32
Appendix D: List of Products Programs Produce† ....................................................................................... 33

2016 Canadian Eye and Tissue Banking Statistics 6
1.0 Introduction
Canadian Blood Services received a mandate from Canadian federal, provincial, and territorial governments in 2008 for organ and tissue donation and transplantation. This mandate encompasses activities that contribute to the development of leading practices, professional education, public awareness, system performance and data and analytics. Aligning with its roles relating to managing the national supply of blood, blood products, stem cells, as well as a cord blood bank and related services for all provinces and territories (excluding Quebec), Canadian Blood Services leads and provides support for an integrated, interprovincial system for donation and transplantation for all of Canada.
In 2012 the Canadian tissue community directed Canadian Blood Services to facilitate the development and implementation of national data collection, analysis, and reporting on national tissue donation, production, and distribution activity. This represents a milestone in the development of systematic monitoring of Canadian tissue banking activity. To oversee the collection, management and release of national data, an Eye and Tissue Data Committee (ETDC) was established in 2012; this committee is chaired by members of the tissue community and composed of representatives from each provincial tissue program as well as Canadian Blood Services representatives (see Appendix B). The ETDC encompasses two working groups who provide insight and recommendations to the larger committee in relation to data elements, data definitions (see Appendix A), data collection, data submission, quality assurance and training, collation, analysis and release and publication.
Canadian Blood Services acts as the repository for the collected data and provides support for data management, analytics, and publication/reporting of results, in addition to providing secretariat and administrative services for the ETDC.
Through the ETDC, Canadian eye and tissue banks, in collaboration with Canadian Blood Services, support the collection and analysis of national data on tissue donation, allograft production and distribution activity. Prospective data collection was initiated in 2012 from all eye and tissue banks operating in Canada (see Appendix C for a list of contributing programs). This cooperative effort has enabled the development of multiple published products and stakeholder presentations. Results are provided by all Canadian eye and tissue banks operating in eight out of the thirteen provinces and territories and constitute a comprehensive census of tissue banking activity, with limited exceptions. A summary of products produced and or distributed by each eye and tissue banks is detailed. (see Appendix D).
The value of this data to the community was recognized and validated with the 2017 publication “Development of national system performance metrics for tissue donation, production, and distribution activity” in the international Journal of Cell and Tissue Banking.
In an effort to increase the quality and scope of data collected by the ETDC while improving the efficiency of the data collection process, the ETDC implemented revisions to the processes and requirements involved in their annual data collection initiatives as of 2016, resulting in a more robust and conceptually accurate national data set that is both thorough and concise. Through this initiative, the ETDC now has access to data relating to tissue banking metrics which were previously unavailable, including enriched data relating to the donation process, details relating to production

2016 Canadian Eye and Tissue Banking Statistics 7
and release, and international and interprovincial distribution1; in addition, 2016 represents the first year in which results by province are presented.
The results presented report on Canadian eye and tissue banking donation, production, and distribution statistics for Canadian eye and tissue banks for January 1 to December 31, 2016 as well as Canadian system activity for 2013 through 2016. In 2010 Canadian Blood Services published two reports, Supply of Human Allograft Tissue in Canada2 and Demand for Ocular Tissue in Canada3, which detail the 2008 system performance activity of Canadian eye and tissue banks excluding Quebec. Héma-Québec published a 2008/2009 annual report detailing system performance activity for Quebec.4 These reports allow for an estimation of 2008 Canadian system performance activity which is presented in some instances for comparison.
Canadian Blood Services and the Eye and Tissue Data Committee would like to express our sincere
appreciation to the members of the Canadian tissue community who participate in this data collection
or the time and expertise they provide to the collection and collation of national activity data.
1.1 Canadian Eye and Tissue Banks
1 Many hospitals import allografts directly from the United States; specifically advanced highly processed products such as demineralized
bone not currently produced by Canadian Banks. Data on allografts imported by hospitals directly from American banks is not readily available. However, data on allografts imported by Canadian eye and tissue banks from the United States is available as of 2016. 2 Canadian Blood Services (2010). Supply of Human Allograft Tissue in Canada - Final Report 2010, www.organsandtissues.ca 3 Canadian Blood Services (2010). Demand for Ocular Tissue in Canada - Final Report January 2010 www.organsandtissues.ca 4 Héma-Québec (2009). 2008-2009 Annual Report – March 2009 www.hema-quebec.ca
2016 Canadian Eye and Tissue Banking Statistics 8
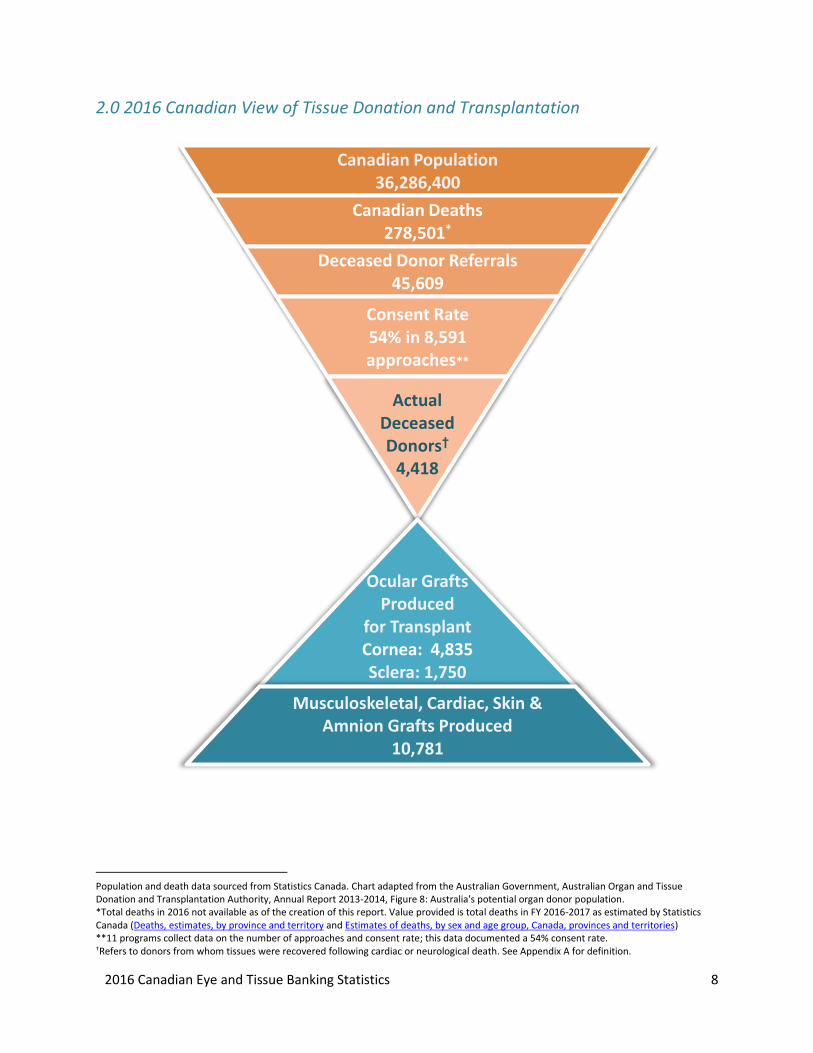
2.0 2016 Canadian View of Tissue Donation and Transplantation
5
Population and death data sourced from Statistics Canada. Chart adapted from the Australian Government, Australian Organ and Tissue Donation and Transplantation Authority, Annual Report 2013-2014, Figure 8: Australia's potential organ donor population. *Total deaths in 2016 not available as of the creation of this report. Value provided is total deaths in FY 2016-2017 as estimated by Statistics Canada (Deaths, estimates, by province and territory and Estimates of deaths, by sex and age group, Canada, provinces and territories) **11 programs collect data on the number of approaches and consent rate; this data documented a 54% consent rate. †Refers to donors from whom tissues were recovered following cardiac or neurological death. See Appendix A for definition.
Canadian Population36,286,400
Canadian Deaths278,501*
Deceased Donor Referrals45,609
Consent Rate54% in 8,591 approaches**
Actual Deceased Donors†
4,418
Ocular Grafts Produced
for TransplantCornea: 4,835Sclera: 1,750
Musculoskeletal, Cardiac, Skin & Amnion Grafts Produced
10,781

2016 Canadian Eye and Tissue Banking Statistics 9
3.0 Comparative Analysis
3.1 Canadian Eye and Tissue Banks
Type of Bank 2008 2013 2014 2015 2016
Comprehensive Tissue Banks* 5 6 6 6 6 Eye Banks 7 4 4 4 4 Musculoskeletal Banks 4 3 3 3 3 Skin Banks 1 1 1 1 1 Cardiac Banks 1 1 1 1 1 Surgical Bone Banks* 7 2 1 1 1 Recovery 1 1 1 1 1 Total 26 18 17 17 17 *“Comprehensive” is defined as recovering and processing more than one tissue type and reporting to a common administration. A “surgical
bone bank” is defined as a bank which recovers only surgical bone. Some musculoskeletal and comprehensive banks recover surgical bone. A
recovery organization provides tissue recovery services but does not process or distribute tissue.
3.2 Canadian Eye and Tissue Banking Activity
Total Canadian Activity* 2013 2014 2015 2016 % Change
(2015-2016)
Deceased donor referrals 41,594 45,154 46,381 45,609 -1.7%
Total deceased donors from whom tissue was recovered 4,383 4,510 4,473 4,418 -1.2%
Donors where ocular tissue was recovered: includes for transplant and for research and training
4,146 4,248 4,292 4,283 -0.2%
Deceased donors where bone, cardiac and or skin was recovered
772 627 590 597 +1.1%
Surgical bone donors 700 669 549 456 -16.9%
Total intermediate-term preserved corneas distributed to transplant – keratoplasty and unknown procedure**
3,504 3,891 3,162 3,969 +25.5%
Non-ocular grafts processed and released into inventory from deceased donors
11,297 9,709 9,856 9,731 -1.3%
Non-ocular grafts processed and released into inventory from living donors
718 1024 822 1,050 +27.7%
All non-ocular grafts processed and released into inventory (living and deceased donors)
12,105 10,733 10,678 10,781 +1.0%
Total non-ocular grafts distributed to transplantation (living and deceased)
12,605 11,740 12,119 11,952 -1.6%
Total: All eye and tissue grafts produced and released into inventory (deceased & living donors)
17,602 16,570 16,241 17,366 +6.9%
Total: All eye and tissue grafts distributed to transplantation (deceased & living donors)
17,820 17,131 16,595 17,970 +8.3%
*Some minor variation of totals from previous reports due to additional quality assurance reviews and data reconciliation
** Data limitation: In 2016 intermediate-term 555 corneas were distributed with the end use identified as “unknown “ compared to 64
distributed for unknown end use in 2015, 632 distributed for unknown end use in 2014, and 220 with unknown end use in 2013. Since the
majority of corneas are used for keratoplasty, cases where the end use was unknown have been included in the totals.
2016 Canadian Eye and Tissue Banking Statistics 10
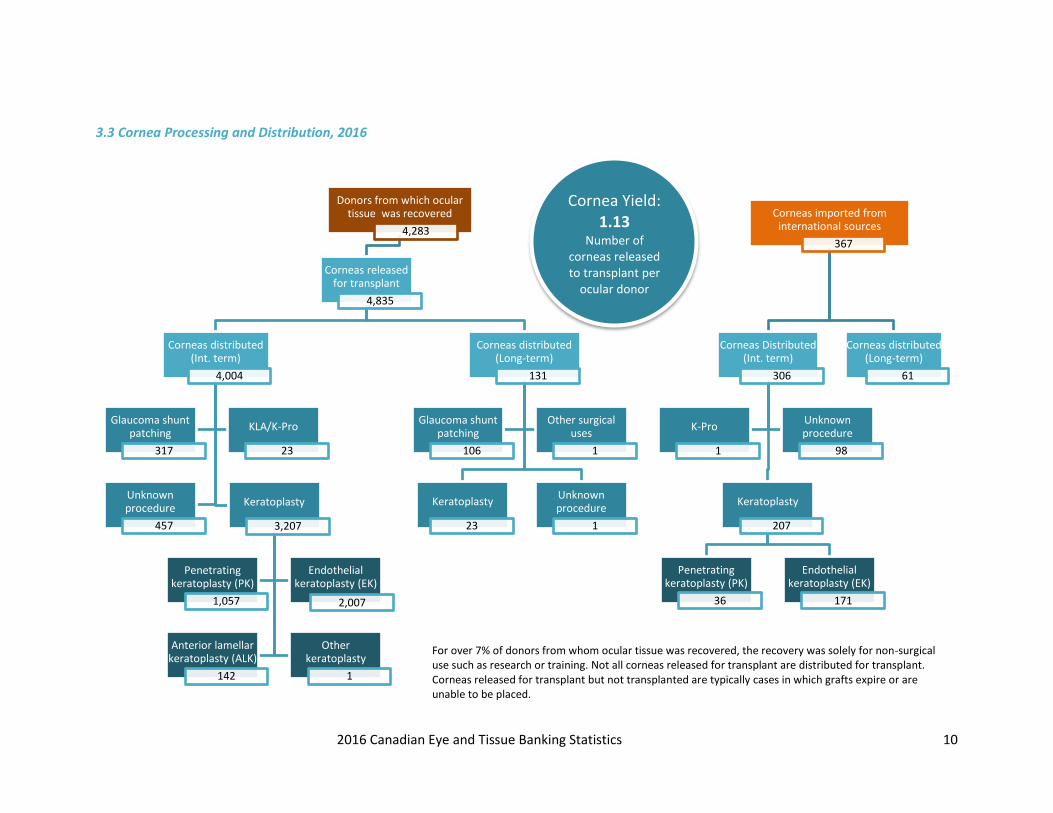
3.3 Cornea Processing and Distribution, 2016
Donors from which ocular tissue was recovered
4,283
Corneas released for transplant
4,835
Corneas distributed (Int. term)
4,004
Glaucoma shunt patching
317
KLA/K-Pro
23
Unknown procedure
457
Keratoplasty
3,207
Penetrating keratoplasty (PK)
1,057
Endothelial keratoplasty (EK)
2,007
Anterior lamellar keratoplasty (ALK)
142
Other keratoplasty
1
Corneas distributed (Long-term)
131
Keratoplasty
23
Unknown procedure
1
Glaucoma shunt patching
106
Other surgical uses
1
Corneas imported from international sources
367
Corneas Distributed (Int. term)
306
Keratoplasty
207
Penetrating keratoplasty (PK)
36
Endothelial keratoplasty (EK)
171
K-Pro
1
Unknown procedure
98
Corneas distributed (Long-term)
61
Cornea Yield: 1.13
Number of corneas released to transplant per
ocular donor
For over 7% of donors from whom ocular tissue was recovered, the recovery was solely for non-surgical use such as research or training. Not all corneas released for transplant are distributed for transplant. Corneas released for transplant but not transplanted are typically cases in which grafts expire or are unable to be placed.

2016 Canadian Eye and Tissue Banking Statistics 11
4.0 2016 Canadian Eye & Tissue Banking Deceased Donation Activity
4.1 Total Donor Referrals
A total of 45,609 deaths were identified and referred for initial screening/consideration of tissue
donation potential in 2016, a decrease of 1.7% below 2015 referrals. (n=46,381). The vast majority
(approximately 97%) of donors have been referred by hospitals. However, up to 20% of realized donors
were non-hospital referrals.
4.2 Consent Rate
In 2016, 11 programs were able to provide data on 8,591 approaches for deceased tissue donation. A
consent rate of 54% was identified; incremental increases in consent rates have continued.
Hospitals (80%)
Actual Donors by Source n=4,418
First Responders (1%)
Extended Care (8%)
OPO (3%)
Funeral Home (0.1%)
Tissue Bank (2%)
Med Examiners/Coroners (1%)
Other/Unknown (5%)Non-Hospital Death
Referrals (19%)
3,408 3,966 3,250 3933
2,8833,620
3,531
4658
0
2,000
4,000
6,000
8,000
10,000
2013 2014 2015 2016
Consent Rate for Tissue Donation 2013: 46% 2014: 48% 2015: 52% 2016: 54%
Consent
No Consent

2016 Canadian Eye and Tissue Banking Statistics 12
4.3 Deceased Donor: National Analysis
In 2016 there were 4,418 consented deceased donors from whom tissue was recovered in Canada, a
decrease of 1.2% from the 4,473 donors recorded in 2015. The vast majority of these donors (86%)
continue to be ocular-only donors, as was the case in 2015.
The total number of consented deceased donors in 2016 represents a three-year low; however, it
remains within 1% of the average number of donors over the past three years, with the 2016 total being
comparable to the total in 2013, and deceased donors from whom non-ocular tissue was recovered in
2016 showing little change from 2015. While there has been an increase in ocular donation non-ocular
tissue donation remains at 2008 levels.
*2008 data on tissue donors was estimated from best available data.
3,611 3,883 3,883 3,821
535 365 409 462237 262 181 135
0%
20%
40%
60%
80%
100%
2013 2014 2015 2016
Deceased Donors by Tissue Type 2013 (n=4,383) 2014 (n=4,510) 2015 (n=4,473) 2016 (n=4,418)
Only non-ocular tissuerecovered
Both ocular and non-ocular tissue recovered
Only ocular tissuerecovered
565 772 627 590 597
2,779
3,611 3,883 3,883 3,821
3,344
4,383 4,510 4,473 4,418
0
1000
2000
3000
4000
5000
2008* 2013 2014 2015 2016
Deceased Donors by Year
Ocular Only Donors
Musc, Skin and or Cardiac*
*Results include donors where ocular tissue was also recovered.

2016 Canadian Eye and Tissue Banking Statistics 13
Deceased Donor Age Distribution, 2016
Donors from whom Ocular Tissue was Recovered
Deceased Donors from whom Non-Ocular Tissue was Recovered
Age data available for 4,325 deceased donors (98% of total)
4.4 Deceased Donor: 2016 Provincial Analysis
Deceased Donors by Tissue Type Recovered
PEI results reflect PEI donors whose recoveries were performed by the Nova Scotia program; New Brunswick donors whose recoveries were
performed by the Nova Scotia program are included in New Brunswick results.
0
200
400
600
800
1000
1200
1400
1600
0 to 10 11 to 20 21 to 40 41 to 60 61 to 70 Over 70
Donor Age Group
0
50
100
150
200
250
0 to 12 13 to 20 21 to 40 41 to 60 61 to 70 Over 70
Donor Age Group
0%
20%
40%
60%
80%
100%
BC AB SK MB ON QC NB PE NS Canada
Only non-ocular tissuerecovered
Both ocular and non-ocular tissue recovered
Only ocular tissuerecovered

2016 Canadian Eye and Tissue Banking Statistics 14
Total Deceased Donors with Tissue Type Recovered Results per Million Population (PMP)
PEI results reflect PEI donors whose recoveries were performed by the Nova Scotia program; New Brunswick donors whose recoveries were
performed by the Nova Scotia program are included in New Brunswick results. Per million population rates based on Statistics Canada estimates
by population as of year-end 2016 (CANSIM Table 051-0005 Estimates of population, Canada, provinces and territories). NL donors were at one
time processed by the NB program; however, as of the time of this report, NL donor recoveries were not being processed. As such, the NL
population is not included in the NB recovery rate. National rate is based on the entire national population, including NL, YT, NT, and NU.
Deceased Donors by Tissue Type Recovered Results per Million Population (PMP)
Donors from whom Ocular Tissue was Recovered
Donors from whom Non-Ocular Tissue was Recovered
Non-ocular tissue is not recovered in BC. PEI results reflect PEI donors whose recoveries were performed by the Nova Scotia program; New
Brunswick donors whose recoveries were performed by the Nova Scotia program are included in New Brunswick results. Per million population
rates based on Statistics Canada estimates by population as of year-end 2016 (CANSIM Table 051-0005 Estimates of population, Canada,
provinces and territories). NL donors were at one time processed by the NB program; however, as of the time of this report, NL donor
recoveries were not being processed. As such, the NL population is not included in the NB recovery rate. National rates are based on the entire
national population, including NL, YT, NT, and NU.
108.3
71.8
38.9
105.4
170.0
96.7
125.3
39.9
110.4121.1
0
50
100
150
200
BC AB SK MB ON QC NB PE NS Canada
Only non-ocular tissuerecovered
Both ocular and non-oculartissue recovered
Only ocular tissuerecovered
108.3
68.1
36.3
85.9
168.3
91.0
117.4
33.3
98.8117.4
0
40
80
120
160
200
BC AB SK MB ON QC NB PE NS Can
Both ocular and non-ocular tissue recovered
Only ocular tissue recovered
27.0
5.2
32.4
8.9
27.421.1
33.3
59.9
16.4
0
10
20
30
40
50
60
70
AB SK MB ON QC NB PE NS Can
Only non-ocular tissue recovered
Both ocular and non-ocular tissue recovered

2016 Canadian Eye and Tissue Banking Statistics 15
5.0 2016 Canadian Eye & Tissue Banking Living Donation Activity
5.1 Surgical Bone Donation
In 2016, five programs reported recovering bone from living donors; this involves recovering femoral heads during
total hip replacement surgery. There has been a 74% decrease in surgical bone donation between 2008 and 2016
(n=1,292), with 2016 results representing a 17% decrease (n=93) from the 2015 total. Surgical bone grafts into
usable inventory evidenced a similar pattern of decrease, with a 13% decrease (n=71) from 2015. Conversely, the
number of surgical bone grafts distributed for transplant increased in 2016 relative to recent years, with 78 more
grafts distributed in 2016 than in 2015, amounting to an increase of 16% from the previous year.
1748
700 669549 456
0
500
1000
1500
2000
2008 2013 2014 2015 2016
Surgical Bone Recoveries by Year
1181
515 530 551 480
0
500
1000
1500
2008 2013 2014 2015 2016
Surgical Bone Released to Inventory
820
612 569492
570
0
200
400
600
800
1000
2008 2013 2014 2015 2016
Surgical Bone Distributed to Transplant

2016 Canadian Eye and Tissue Banking Statistics 16
5.2 Amnion Donation
In 2013, three programs reported recovering amnion from 9 living donors and produced 203 grafts. In 2014 and 2015 there were four programs recovering amnion producing 598 grafts from 12 donors in 2014 and 271 grafts from 8 donors in 2015.6 In 2016, three programs reported recovering amnion from a combined total of 13 donors and produced 570 grafts.
5.3 Living Donation: 2016 Provincial Analysis
6 In 2016 a data omission was identified; in previous reports a program producing amnion was omitted. Data was revised to 2008 to
incorporate this activity.
9 9
12
8
13
0
3
6
9
12
15
2008 2013 2014 2015 2016
Amnion Donors by Year
183 203
598
271
570
0
200
400
600
800
2008 2013 2014 2015 2016
Amnion Grafts Released to Inventory
140 153
502
367408
0
200
400
600
2008 2013 2014 2015 2016
Amnion Grafts Distributed to Transplant
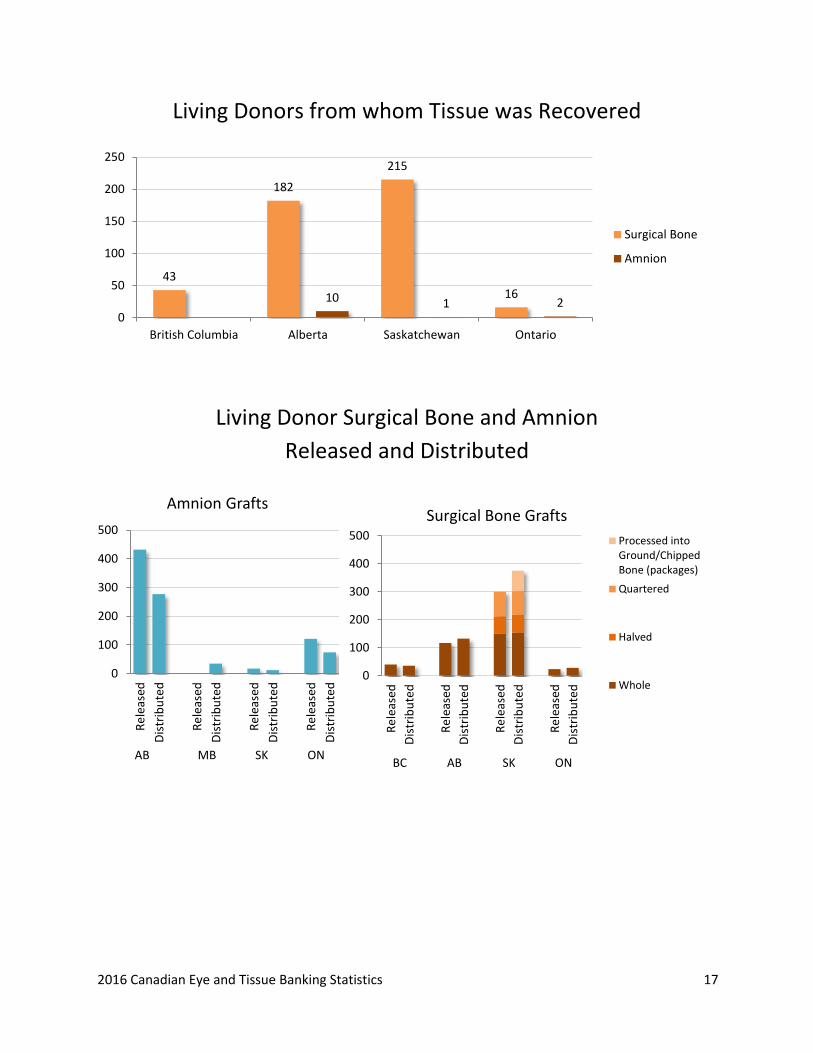
2016 Canadian Eye and Tissue Banking Statistics 17
Living Donors from whom Tissue was Recovered
Living Donor Surgical Bone and Amnion
Released and Distributed
43
182
215
1610 1 20
50
100
150
200
250
British Columbia Alberta Saskatchewan Ontario
Surgical Bone
Amnion
0
100
200
300
400
500
Re
leas
ed
Dis
trib
ute
d
Re
leas
ed
Dis
trib
ute
d
Re
leas
ed
Dis
trib
ute
d
Re
leas
ed
Dis
trib
ute
d
Amnion Grafts
AB MB SK ON
0
100
200
300
400
500
Re
leas
ed
Dis
trib
ute
d
Re
leas
ed
Dis
trib
ute
d
Re
leas
ed
Dis
trib
ute
d
Re
leas
ed
Dis
trib
ute
d
BC AB SK ON
Surgical Bone Grafts
Processed intoGround/ChippedBone (packages)
Quartered
Halved
Whole

2016 Canadian Eye and Tissue Banking Statistics 18
6.0 2016 Canadian Eye & Tissue Production and Distribution Activity
6.1 Total Corneas Distributed for Transplant
In 2016, Canadian eye banks distributed 4,502 corneas for surgical use, including 4,310 intermediate-term preserved corneas of which 3,413 were known to have been utilized for penetrating, endothelial, or anterior lamellar cornea transplant (keratoplasty). This represents a 10% increase from the 3,097 corneas distributed for these types of keratoplasty in 2015. One cornea was distributed for a keratoplasty procedure other than PK, EK, or ALK in 2016, as was the case in 2015 as well. In addition, 23 long-term preserved corneas sourced in Canada were also distributed for keratoplasty, although the keratoplasty type was not available in these cases. The final use could not be determined for an additional 617 corneas in 2016 (approximately 15% of the total), 555 of which were intermediate-term preserved. It is assumed that these were used for keratoplasty, but the procedure type was not recorded. This represents a higher proportion of unknown cases than in 2015 (2%), suggesting that intermediate-term cornea distribution for keratoplasty may have been as high as 3,968 in 2016, which is on par with 2014 total distribution levels for keratoplasty. An additional 341 intermediate-term preserved corneas were utilized in non-keratoplasty procedures including K-Pro, keratolimbal allografts, and glaucoma shunt patching.
Not shown: 1 cornea distributed for keratoplasty other than PK, EK, or ALK in 2016 and 1 equivalent case in 2015; 1 cornea distributed for EK for which specific procedure type could not be determined (2013); long-term preserved corneas. *Unknown cases reflect cornea distributions for which the keratoplasty type was not available, and may include non-keratoplasty procedures.
Of all cornea transplants performed in Canada in 2016 for which the keratoplasty type could be
determined, 64% were endothelial keratoplasty (EK) which represents a substantial increase from 51%
EK in 2015.
In 2016, five of the nine Canadian eye banks provided processing service (precutting/pre-stripping). In
remaining regions the processing is completed by the surgeon in the operating room.
0
500
1000
1500
2000
2500
3000
3500
4000
2013 2014 2015 2016
Cornea Distribution for Keratoplasty
Unknown procedure*
ALK
DMEK/DMAEK
DSAEK / DSEK
PK

2016 Canadian Eye and Tissue Banking Statistics 19
Long-term preserved corneas are not included in results presented. One intermediate-term preserved cornea was distributed for a keratoplasty procedure other than PK, EK, or ALK in 2015, as well as one in 2016 (not shown). In 2016 the type of surgery was listed as unknown for 555 intermediate-term preserved corneas distributed for transplantation, this compares with 64 unknown in 2015, 632 unknown in 2014 and 220 unknown in 2013. The high number of unknowns impacts the acuity of this data.
6.2 Type of Endothelial Keratoplasty
In Endothelial Keratoplasty the eye bank prepares the corneal tissue, or the surgeon prepares the
corneal tissue in the operating room, removing specific layers of the cornea. Preparation or pre-cutting
can be done manually (peel) or with a microtome (automated). There are two common methodologies;
in Descemets Stripping (automated) Endothelial Keratoplasty (DSAEK) the prepared (cut) graft is
comprised of the donor tissue endothelium, Descemet’s membrane and a thin, partial layer of the donor
tissue’s stroma. Descemet’s Membrane Endothelial Keratoplasty (DMEK) involves the transplantation of
only the Descemet’s membrane and endothelial layer of the cornea. The DMEK peel has been described
as a more technically challenging procedure than DSAEK but also has been reported to provide better,
post-transplant patient visual acuity, lower rejection rates and faster visual recovery.
The demand for DMEK continues to increase, with the total corneas used for DMEK procedures in 2016
being 72% greater than in 2015. In 2016, 30% of corneas known to have been used for EK procedures
were used for DMEK, which is up from 24% in 2015. A number of Canadian eye banks are in the process
of implementing DMEK processing services.
1,682
1,484
118
1,536 1,600
123
1,382
1,586
129
1,093
2,178
142
0
600
1,200
1,800
2,400
PK Penetrating Keratoplasty EK Endothelial ALK Anterior Lamellar
Cornea Transplants by Procedure Type 2013 (n=3,284) 2014 (n=3,259) 2015 (n=3,098) 2016 (n=3,414)
2013 2014 2015 2016

2016 Canadian Eye and Tissue Banking Statistics 20
Not shown: 1 cornea distributed for EK for which specific procedure type could not be determined (2013). In 2016 the type of surgery was listed as unknown for 555 intermediate-term preserved corneas distributed for transplantation, this compares with 64 unknown in 2015, 632 unknown in 2014 and 220 unknown in 2013. The high number of unknowns impacts the acuity of this data.
6.3 Ocular Tissue Production and Distribution: 2016 Provincial Analysis
Corneas/Whole Globes Recovered with the Intention for
Transplant, Results per Million Population (PMP)
*Note: Ontario does not determine intention for transplant prior to recovery; results for Ontario reflect all cornea/whole globe recoveries.
NL donors were at one time processed by the NB program; however, as of the time of this report, NL donor recoveries were not being
processed. As such, the NL population is not included in the NB recovery rate. PEI results reflect PEI donors whose recoveries were performed
by the Nova Scotia program; New Brunswick donors whose recoveries were performed by the Nova Scotia program are included in New
Brunswick results. Per million population rates based on Statistics Canada estimates by population as of year-end 2016 (CANSIM Table 051-
0005 Estimates of population, Canada, provinces and territories). National rate is based on the entire national population, including NL, YT, NT,
and NU.
1,3961,378
1,200 1,515
87222
386 663
0%
10%
20%
30%
40%
50%
60%
70%
80%
90%
100%
2013 2014 2015 2016
Type of Endothelial Keratoplasty
DMEK/DMAEK DSAEK / DSEK
123.0
39.9
114.7
79.7
169.6
78.3
57.1
75.8
128.4
119.9
0 50 100 150 200 250 300 350
NS
PE
NB
QC
ON*
MB
SK
AB
BC
Canada
Corneas/Whole Eyes Recovered for Transplant by Disposition (PMP)
Released and utilized fortransplant (with value)
Released for transplantbut not utilized fortransplant
Recovered for transplantbut not released totransplant
Final Disposition:

2016 Canadian Eye and Tissue Banking Statistics 21
Total Corneas Distributed for Keratoplasty Results per Million Population (PMP)
* Atlantic patients are transplanted in Nova Scotia; rate calculation includes populations of all Atlantic provinces (NS, NB,
PE, and NL).
**Unknown cases reflect cornea distributions for which the keratoplasty type was not available, and may include non-
keratoplasty procedures.
Results presented do not include long-term preserved cornea distribution.
Per million population rates based on Statistics Canada estimates by population as of year-end 2016 (CANSIM Table 051-
0005 Estimates of population, Canada, provinces and territories). National rate is based on the entire national population,
including NL, YT, NT, and NU.
Source of Corneas Distributed for Surgical Use
* Atlantic patients are transplanted in Nova Scotia (corneas are transferred from NB to NS programs).
Corneas sourced from another Canadian eye bank in Alberta include corneas transferred between Alberta eye banks.
Results presented do not include long-term preserved cornea distribution.
88.3
91.7
124.2
74.6
45.8
118.0
122.7
108.8
0 30 60 90 120 150
Atl.*
QC
ON
MB
SK
AB
BC
Canada
Corneas/Whole Eyes Distributed for Keratoplasty (PMP)
Distributed for keratoplasty:Locally produced
Distributed for keratoplasty:Interprovincially/internationallysourced
Unknown procedure**
0%
20%
40%
60%
80%
100%
BC AB SK MB ON QC Atl.* Canada
Imported from AnotherCountry
Sourced from AnotherCanadian Eye Bank
Local
2016 Canadian Eye and Tissue Banking Statistics 22
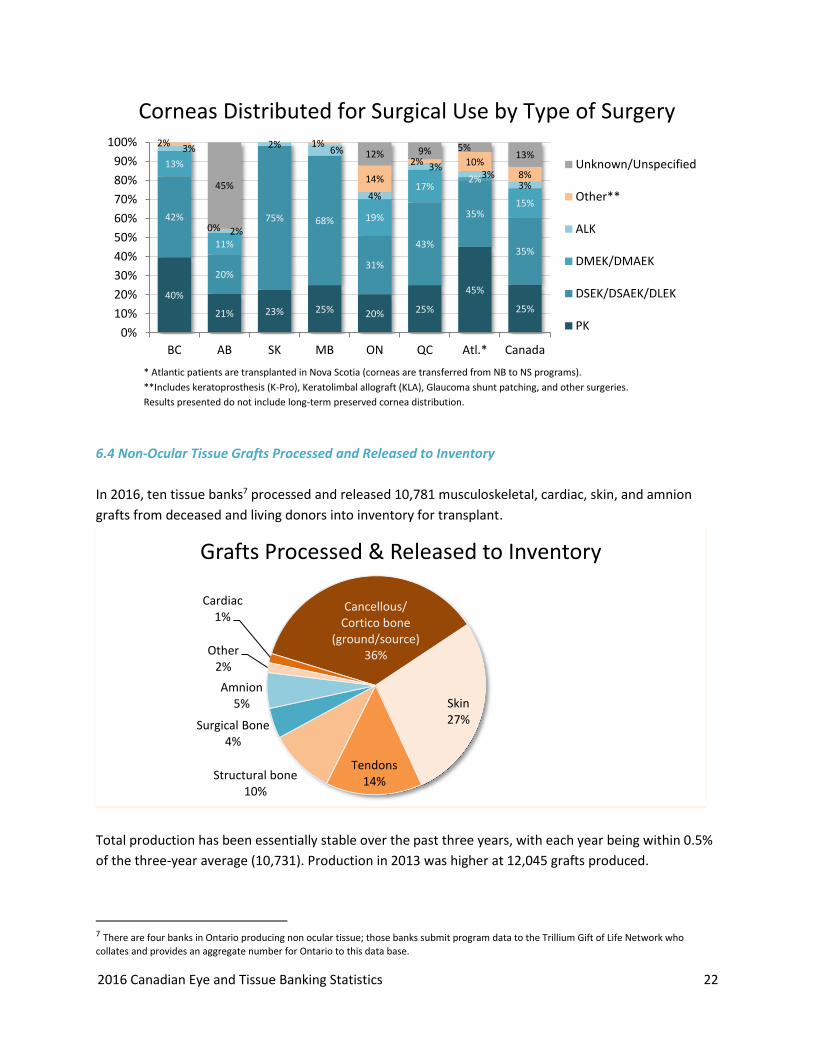
Corneas Distributed for Surgical Use by Type of Surgery
* Atlantic patients are transplanted in Nova Scotia (corneas are transferred from NB to NS programs).
**Includes keratoprosthesis (K-Pro), Keratolimbal allograft (KLA), Glaucoma shunt patching, and other surgeries.
Results presented do not include long-term preserved cornea distribution.
6.4 Non-Ocular Tissue Grafts Processed and Released to Inventory
In 2016, ten tissue banks7 processed and released 10,781 musculoskeletal, cardiac, skin, and amnion
grafts from deceased and living donors into inventory for transplant.
Total production has been essentially stable over the past three years, with each year being within 0.5%
of the three-year average (10,731). Production in 2013 was higher at 12,045 grafts produced.
7 There are four banks in Ontario producing non ocular tissue; those banks submit program data to the Trillium Gift of Life Network who
collates and provides an aggregate number for Ontario to this data base.
40%
21% 23% 25% 20% 25%
45%
25%
42%
20%
75% 68%
31%
43%
35%
35%
13%
11%
19%
17%2%
15%
3%
2%
2%6%
4%
3%3%
3%
2%
0%
1%
14%
2% 10%8%
45%
12% 9% 5%13%
0%
10%
20%
30%
40%
50%
60%
70%
80%
90%
100%
BC AB SK MB ON QC Atl.* Canada
Unknown/Unspecified
Other**
ALK
DMEK/DMAEK
DSEK/DSAEK/DLEK
PK
Cancellous/Cortico bone
(ground/source)36%
Skin 27%
Tendons14%Structural bone
10%
Surgical Bone4%
Amnion5%
Other2%
Cardiac1%
Grafts Processed & Released to Inventory

2016 Canadian Eye and Tissue Banking Statistics 23
In 2016 there has been a 13% decrease in cancellous production (n=524), a 10% decrease in tendon
production (n=177), a 12% increase in structural graft production (n=110), and a 25% increase in skin
graft production (n=592). Amnion production in 2016 showed a 110% increase relative to 2015 (n=299),
bringing it to within 5% of 2014 production levels.
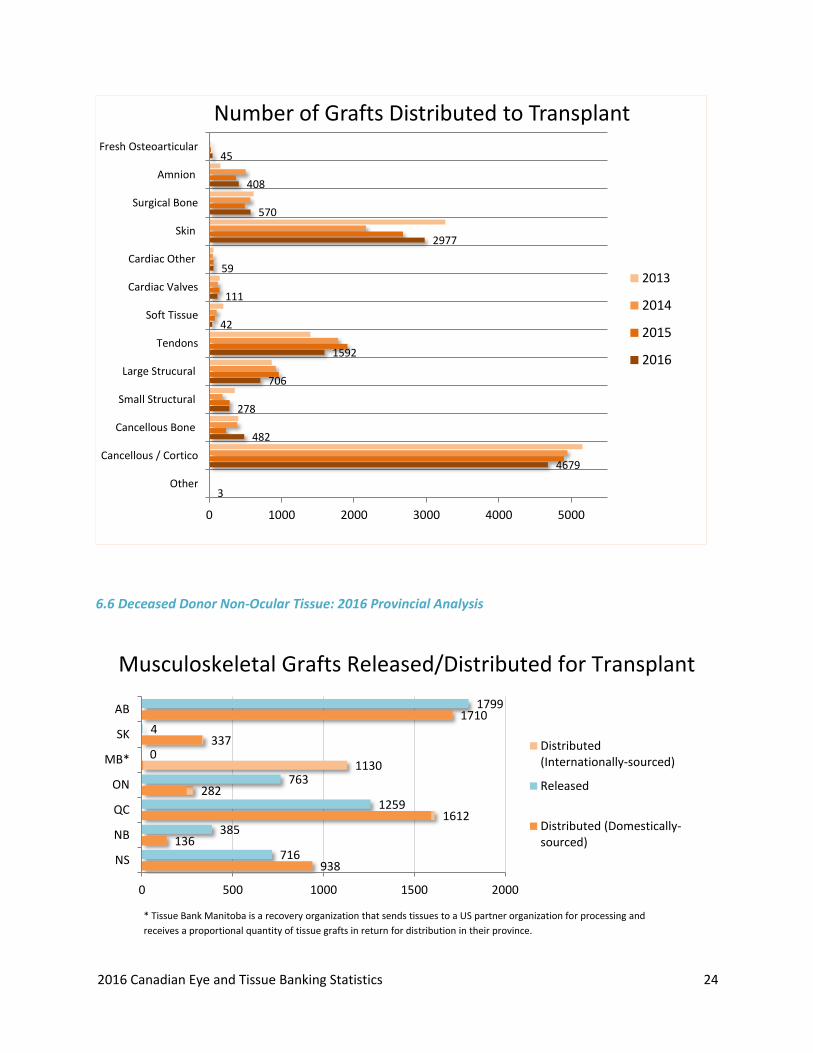
6.5 Non-Ocular Tissue Grafts Distributed to Transplant
In 2016, eleven tissue banks distributed 11,952 non-ocular grafts to transplantation, reflecting very little
change from the 12,119 grafts distributed in 2015 and 11,740 grafts distributed in 2014. Total non-
ocular tissue graft distribution in 2016 amounted to 95% of the total in 2013 (n=12,605). While ten
banks produce allografts, an eleventh has a relationship with American processors who produce
allografts from donors recovered by that bank and return them for distribution.
Fresh osteoarticular distribution reached a four-year high in 2016. Ontario produced and distributed 42
fresh osteoarticular grafts for transplant in 2016, while Alberta produced and distributed an additional
three fresh osteoarticular grafts for transplant. In addition, 2016 also represented a four-year high for
cancellous bone graft distribution, with 2016 results more than doubling cancellous bone distribution in
2015. Conversely, soft tissue graft, cardiac valve, and large structural graft distribution decreased by
45%, 21%, and 26%, respectively, relative to 2015 to reach four-year lows in 2016. Tissue distribution in
2016 for the remaining seven tissue categories was within 17% of 2015 distribution levels.
36
3649
231
116
930
1530
87
86
58
2963
480
570
45
0 1000 2000 3000 4000 5000
Other
Cancellous / Cortico
Cancellous Bone
Small Structural
Large Strucural
Tendons
Soft Tissue
Cardiac Valves
Cardiac Other
Skin
Surgical Bone
Amnion
Fresh Osteoarticular
Number of Grafts Processed & Released to Inventory
2013
2014
2015
2016
2016 Canadian Eye and Tissue Banking Statistics 24
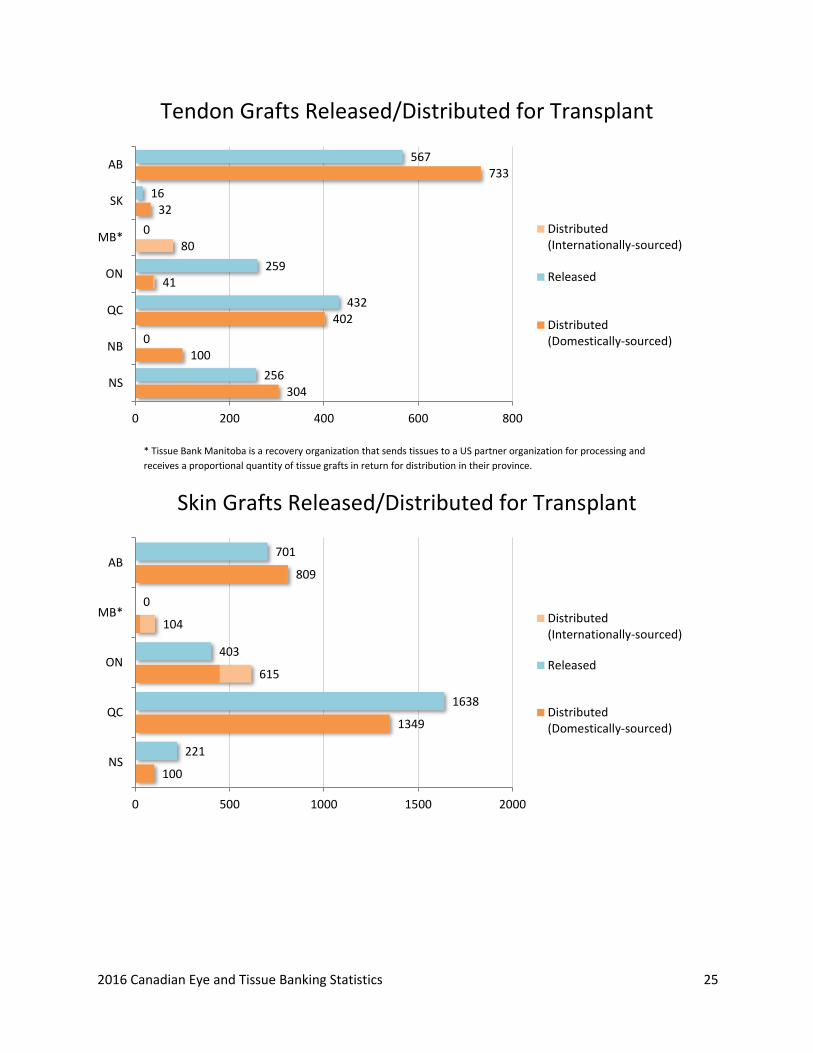
6.6 Deceased Donor Non-Ocular Tissue: 2016 Provincial Analysis
Musculoskeletal Grafts Released/Distributed for Transplant
* Tissue Bank Manitoba is a recovery organization that sends tissues to a US partner organization for processing and
receives a proportional quantity of tissue grafts in return for distribution in their province.
3
4679
482
278
706
1592
42
111
59
2977
570
408
45
0 1000 2000 3000 4000 5000
Other
Cancellous / Cortico
Cancellous Bone
Small Structural
Large Strucural
Tendons
Soft Tissue
Cardiac Valves
Cardiac Other
Skin
Surgical Bone
Amnion
Fresh Osteoarticular
Number of Grafts Distributed to Transplant
2013
2014
2015
2016
938
136
1612
282
1130
337
1710
716
385
1259
763
0
4
1799
0 500 1000 1500 2000
NS
NB
QC
ON
MB*
SK
AB
Distributed(Internationally-sourced)
Released
Distributed (Domestically-sourced)
2016 Canadian Eye and Tissue Banking Statistics 25
Tendon Grafts Released/Distributed for Transplant
* Tissue Bank Manitoba is a recovery organization that sends tissues to a US partner organization for processing and
receives a proportional quantity of tissue grafts in return for distribution in their province.
Skin Grafts Released/Distributed for Transplant
304
100
402
41
80
32
733
256
0
432
259
0
16
567
0 200 400 600 800
NS
NB
QC
ON
MB*
SK
AB
Distributed(Internationally-sourced)
Released
Distributed(Domestically-sourced)
100
1349
615
104
809
221
1638
403
0
701
0 500 1000 1500 2000
NS
QC
ON
MB*
AB
Distributed(Internationally-sourced)
Released
Distributed(Domestically-sourced)

2016 Canadian Eye and Tissue Banking Statistics 26
Cardiac Grafts Processed and Released for Transplant
Cardiac Grafts Distributed for Transplant
26
80
19
19
0 30 60 90
NS
QC
ON
ABAortic Heart Valve
Pulmonary Heart Valve
Non Valve Conduit(Aortic/Pulmonary)
Descending Aorta (QC) /Pericardium (ON)
Other cardiovasculartissue products
10
49
85
24
0 30 60 90
NS
QC
ON
AB
Not shown: 1 Aortic Heart valve distributed in MB; 1 cardiac graft (other category) distributed in NB
Aortic Heart Valve
Pulmonary Heart Valve
Non Valve Conduit(Aortic/Pulmonary)
Pericardium
Other cardiovasculartissue products

2016 Canadian Eye and Tissue Banking Statistics 27
Conclusion With the support of eye and tissue banks in Canada, and in collaboration with Canadian Blood Services,
a census of Canadian tissue recovery, allograft production and distribution activity provides data to
inform individual banks operational strategy as well as providing insight and trend analysis to inform
national policy development. A data committee with representation of the majority of Canadian eye and
tissue banks continues to evolve minimal data sets, data definitions, data processes and quality
assurance and undertakes analysis to identify trends in activities to inform strategy.
Data collected has formed a baseline to begin informing national trends and individual tissue bank
operations. Recent insights identified for consideration in operational planning and policy development
include the identification of stagnant and potentially decreasing activity in tissue donation.
The decrease in musculoskeletal, cardiac and skin donors has continued. Its correlative impact has
demonstrated unchanged or decreasing allograft production and distribution. In an environment where
an aging population projects increasing allograft demand the stagnant production and distribution
activity requires consideration. Further analysis is required to determine if there are actual shifts in
demand or if surgeons are relying on US tissue banks for a greater portion of their allograft needs. Of
interest, one area of growth has been the demand for fresh osteochondral grafts. While representing a
small number, the production nearly doubled in 2016.
In 2016 a concerning downward trend in the number corneas distributed to transplant appeared to have
reversed with a significant increase in production, returning activity to 2014 levels. This requires
continued monitoring. A number of jurisdictions continue to import corneas from the United States to
supplement local supply.
The continued increases in demand for corneal processing (endothelial keratoplasty) have significant
impacts to operational planning. Of particular interest is the escalating demand for Descemet’s
Membrane Endothelial Keratoplasty (DMEK) corneas. This trend has shifted the production
methodology for ocular tissue requiring more technical expertise and training from both the surgeons
and eye bank technicians.
The prospective collection and collation of national eye and tissue bank activity provides insight into the
Canadian supply and demand. As data accumulates, more sophisticated trend analysis will help inform
recovery and production targets and methodologies. Strategies to better align supply with demand
nationwide can be developed using the collected data as a guide. The data collected also has the
potential to inform further research in the ocular and tissue transplantation world, as a significant
starting point for most research requires a broad tablet of basic data. Similarly, interprovincial
comparisons offer insight into areas of potential resource and knowledge sharing, while providing a
more nuanced understanding of provincial demand and reliance on internationally-sourced grafts.

2016 Canadian Eye and Tissue Banking Statistics 28
Appendix A: Definitions Amniotic Membrane: Amniotic membrane is the innermost layer of the placenta consisting of a thick
basement membrane and an avascular stromal matrix. It is used as a graft and as a dressing to facilitate
ocular surface reconstruction and to promote healing. Its’ use in plastic surgery (burns, wound care),
orthopedic, dental and general surgery is increasing.
Cancellous / Cortical Bone: There are two types of osseous tissue that form bones; cancellous “spongy” bone and cortical “compact” bone. Tissue banks mill/grind bone into cancellous cortical particles or powder which is used to pack bone voids in surgical repairs.
Chipped Bone: Bone that has been processed into morsels; chipped bone is used to pack bone voids in
surgical repairs.
Consent (Rate): Consent refers to signed documentation of approval to proceed with donation from the
donor or legal next of kin; the consent rate is the ratio of donors where consent for donation is obtained
to the number of donor families approached for consent.
Deceased Donor: Refers to a donor where tissue is recovered following cardiac or neurological death.
Fresh Osteoarticular: Osteoarticular refers to a bone graft that contains a joint surface; such as a knee.
Fresh refers to the fact that in order to preserve viability of joint tissue the graft is not frozen or
cryopreserved. These grafts are refrigerated and usually transplanted within weeks of recovery.
Keratoplasty: Keratoplasty is a surgical procedure also known as corneal transplantation where the
procedure is described as a replacement of abnormal host tissue with healthy corneal tissue from a
donor. The replacement of the corneal tissue can either be partial or full depending on the severity of
damage in the cornea.
Penetrating Keratoplasty: Corneal transplant with replacement of all layers of the cornea, but retaining
the peripheral cornea.
Endothelial Keratoplasty (EK): Endothelial keratoplasty is a corneal transplant procedure where only a
patient’s compromised posterior layers of the cornea are removed and replaced by similar posterior
corneal layers of a donor cornea. The advent of this procedure occurred in the early to mid-2000s after
fifty years of performing penetrating keratoplasty in nearly all corneal transplant surgeries. EK has
clearly established itself as the standard of care for patients with endothelial dysfunction. There are a
number of types of EK procedures including DSAEK and DMEK. They can be performed manually (peel)
or automated (microtome).
Descemet’s Stripping (Automated) Endothelial Keratoplasty (DSAEK). The vast majority of EK today is
DSAEK where the eye bank precuts the corneal tissue, or the surgeon precuts the corneal tissue in the
operating room. The prepared (cut) graft is comprised of the donor tissue endothelium, Descemet’s
membrane and a thin, partial layer of the donor tissue’s stroma.

2016 Canadian Eye and Tissue Banking Statistics 29
Descemet’s Membrane Endothelial Keratoplasty (DMEK): DMEK involves the transplantation of only
the Descemet’s membrane and endothelial layer of the cornea. DMEK has been described as a more
technically challenging surgical procedure than DSAEK but also has been reported to provide better,
post-transplant patient visual acuity, lower rejection rates and faster visual recovery.
Deep Anterior Lamellar Keratoplasty (DALK or ALK): Is a partial thickness corneal transplant procedure
used to treat disease or injury confined to anterior layers of the cornea: the epithelium, Bowman's layer
and stroma. DALK is most often used to treat keratoconus and corneal scarring.
Distribution: A process that includes the receipt of a request for tissue, selection and inspection of the appropriate tissue and subsequent shipment and delivery of the tissue to the end user (surgeon) for utilization.
Living Donor: A donor where tissue is recovered from a live person; such as femoral heads which are recovered during total hip replacements or amnion which is recovered from the placenta in live births.
Ocular: A general term which refers to the tissues of the eye which include the cornea and the sclera.
Preservation, Intermediate-Term: Cornea or corneal section preserved in a solution that maintains cellular and/or ultrastructure viability for 14 days. Intermediate term preservation is currently utilized at 2-8°C storage temperatures. Examples of intermediate term storage media are: Life4°C, Optisol GS, and Eusol.
Preservation, Long-Term: Cornea or corneal section stored in a solution that is designed to maintain tissue ultrastructure for greater than 14 days and up to five years depending on the technique. Viability is not maintained. Examples are ethanol and glycerin preservation. Other media, such as albumin, may be used in conjunction with ionizing radiation to preserve the tissue ultrastructure.
Processing: The steps taken following recovery to prepare tissue for transplantation. This is essentially a manufacturing process where tissue is manipulated, treated and packaged into forms required by surgeons for interventions and through which quality control and quality assurance processes determine safety and the product release to transplantation. Packaging is considered a type of processing.
Recovery: Obtaining tissue from a donor that is intended for use in human transplantation, therapy, research or education. The surgical removal of donated tissue for future processing; recovery generally occurs in an operating room or dedicated recovery suite.
Referral: A referral is when a death is referred to a donation organization or tissue bank for consideration or evaluation of donation potential. In some jurisdictions all deaths are referred and in others frontline health professionals may do a pre-screening and only refer deaths which have no obvious contraindications to donation.
Released to Inventory: Refers to grafts that has been evaluated, and deemed safe and suitable for transplantation, by a medical director, through the appropriate quality review and made available for transplantation. Prior to release grafts in the production process are considered quarantined.

2016 Canadian Eye and Tissue Banking Statistics 30
Sclera: The sclera is the part of the eye commonly known as the “white”. It forms the supporting wall of the eyeball, and is continuous with the clear cornea. Scleral grafts are widely used in ophthalmologic surgery.
Soft Tissue: A generic term for muscle, fat, fibrous tissue or other supporting tissue matrix. In tissue banking it often refers to fascia lata; the sheets of fibrous tissue enveloping, separating or binding together muscles and organs. Fascia lata is processed into grafts for use in surgical repairs.
Surgical Bone: Femoral heads can be recovered from total hip replacements and evaluated for suitability to transplant. These femoral heads are referred to as surgical bone. Surgeons grind the femoral head in the operating room to produce cancellous powder or particles. With the advent of bank produced pre-packaged cancellous and the increasing regulatory requirements the demand for surgical bone has declined. Surgical bone grafts are intended to support weight, and are classified into large or small. Large grafts include femurs, fibulas and humerus. Small grafts include sized grafts such as cortical dowels, wedges and rings.
Tendon: Is a band of tough, inelastic fibrous tissue that connects a muscle with its boney attachment. Tendons commonly banked for use in sports medicine surgery include Achilles, Patellar and Tibialis.
Tissue: Tissue is a general term which refers to musculoskeletal (bone), cardiac and skin tissue (non-ocular tissues)
Yield: Yield refers to the number of grafts which are recovered and released (deemed suitable) for transplant per donor. Yield can be affected by contamination, recovery technique, processing technique and donor factors such as age and comorbid diseases.

2016 Canadian Eye and Tissue Banking Statistics 31
Appendix B: Eye and Tissue Data Committee Membership
Member Title Program
Cynthia Johnston (Chair)
Quality Leader Regional Tissue Bank, Halifax, NS
Mike Bentley Manager, Transplant Services Comprehensive Tissue Centre, Edmonton, AB
Mary Gatien Director NB Organ Donor Program, Director NB Eye and Tissue Bank
New Brunswick Eye and Tissue Bank, Saint John and Moncton, NB
Mazen Dakkak Business Development Officer Héma-Québec, Québec City, QC
Alison Halliday Senior Technologist Ontario Professional Firefighters’ Skin Bank, Toronto, ON
Christine Humphreys Manager Eye Bank of Canada (Ontario Division), Toronto, ON
Mijana Ridic Unit Manager, Lions Eye Bank Southern Alberta Organ and Tissue Program, Calgary, AB
Gary Rockl Senior Tissue Specialist Southern Alberta Tissue Program Calgary, AB
Erin Schimpf Provincial Program Manager Saskatchewan Transplant Program, Saskatoon, SK
Natalie Smigielski Manager - PRC - Tissue Program Trillium Gift of Life Network, Toronto, ON
Chris Snow Director Tissue Bank Manitoba, Winnipeg, MB
Balram Sukhu Director Mount Sinai Allograft Technologies, Toronto, ON
Brenda Weiss Patient Care Manager Ophthalmology Clinic
Misericordia Health Centre, Winnipeg, MB
Ivan Yan
Head Technologist
Eye Bank of British Columbia, Vancouver, BC

2016 Canadian Eye and Tissue Banking Statistics 32
Appendix C: List of Contributing Programs
British Columbia
• Eye Bank of British Columbia, Vancouver
• Island Health Bone Bank, Victoria
Alberta
• Southern Alberta Tissue Program, Calgary
• Lions Eye Bank of Calgary, Calgary
• Comprehensive Tissue Centre, Edmonton
Saskatchewan
• Saskatchewan Transplant Program, Saskatoon
Manitoba
• Tissue Bank Manitoba, Winnipeg
• Misericordia Eye Bank, Winnipeg
Ontario
Trillium Gift of Life Network manages the collation and submission of data from Ontario eye and tissue
banks including:
• Eye Bank of Canada (Ontario Division), Toronto, Ontario
• The Hospital for Sick Children Tissue Laboratory, Toronto, Ontario
• Ontario Professional Fire Fighters Skin Bank, Toronto, Ontario
• Mount Sinai Allograft Technologies, Toronto, Ontario
• Lake Superior Centre for Regenerative Medicine, Thunder Bay, Ontario
Trillium Gift of Life Network supports tissue recovery and therefore qualifies as a recovery organization.
Quebec
• Héma-Québec, Saint Laurent
New Brunswick
• New Brunswick Organ and Tissue Program; Ocular and Tissue Division, Saint John and Moncton
Nova Scotia
• Regional Tissue Bank, Halifax

2016 Canadian Eye and Tissue Banking Statistics 33
Appendix D: List of Products Programs Produce†8
Canadian Eye Banks PK Corneas
DSAEK Corneas
DMEAK Corneas
Sclera Amnion
Eye Bank of British Columbia Y Y N Y N
Lions Eye Bank of Calgary Y Y N Y N
Comprehensive Tissue Centre (AB) Y N N Y Y
Saskatchewan Transplant Y N N Y Y
Misericordia Eye Bank Y N N Y Y
Eye Bank of Ontario Y Y N Y Y
Héma-Québec Y Y Y Y N
New Brunswick Organ and Tissue Program
Y N N Y N
Regional Tissue Bank (NS) Y Y Y Y N
Canadian
Tissue Banks
Cancellous
Bone
Structural
Bone
Rib or
Cartilage
Tendon Fresh
Osteo
Soft
Tissue
Cardiac Skin
Island Health Bone Bank (BC) (Surgical Bone)
Y N N N N N N N
Southern Alberta Tissue Program
Y Y Y Y Y Y N Y
Comprehensive Tissue Centre (AB)
Y Y Y Y N Y Y Y
Saskatchewan Transplant Y Y N Y N N N N
Tissue Bank Manitoba* Y Y Y Y N Y Y Y
RegenMed (ON) Y Y N Y N N N N
Mount Sinai Allograft Technologies (ON)
Y Y N Y Y N N N
Hospital for Sick Children, Tissue (ON)
N N N N N N Y N
Ontario Professional Firefighters Skin Bank
N N N N N N N Y
Héma-Québec Y Y N Y N N Y Y
New Brunswick Organ and Tissue
Y Y N Y N N N N
Regional Tissue Bank (NS) Y Y N Y Y Y Y Y
*Amnion production is being pursued
8 †as of publication (January 2018)