Embed Size (px)
Citation preview
Donald Trump and the 2018 Midterm Elections
Gary C. Jacobson
University of California, San Diego
Abstract
Long-term political trends and the public’s reaction to Donald Trump’s surreal presidency are converging to make the 2018 midterm elections the most sweeping and divisive national referendum on any administration at least since the Great Depression. These same factors leave the ultimate outcome—party control of the House and Senate—very much in doubt. In this paper, I review the major trends that have gradually transformed midterm elections in to highly nationalized, president-centered events, present data locating the Trump presidency in these currents, document Trump’s dominance of the Republican Party base, review the present state of electoral play, and consider some implications of alternative outcomes for the future of American politics and the Republican and Democratic parties.
Prepared for delivery at the Annual Meeting of the American Political Science Association, Boston, August 30-September 2, 2018.

Long-term political trends and the public’s reaction to Donald Trump’s surreal
presidency are converging to make the 2018 midterm elections the most sweeping and
divisive national referendum on any administration at least since the Great Depression.
These same factors leave the ultimate outcome—party control of the House and Senate—
very much in doubt. Like each new midterm, 2018 will provide an out-of-sample test of
standard theories of midterm voting. It will also tell us whether Trump can disrupt
midterm electoral politics as he has so many other aspects of American political life. In
this paper, I review the major trends that have gradually transformed midterm elections in
to highly nationalized, president-centered events, present data locating the Trump
presidency in these currents, document Trump’s dominance of the Republican Party base,
review the present state of electoral play, and consider some implications of alternative
outcomes for the future of American politics and the Republican and Democratic parties.
I. Trends Shaping Electoral Politics in 2018
1. A Deeply Divided Electorate
It is no secret that partisan divisions in the U.S. have been widening for decades,
most notably within the political class (McCarty, Poole and Rosenthal 2006; Theriault
2008) but also, albeit to a lesser extent, among ordinary citizens. As partisan identities,
ideological leanings, and issues preferences have moved into closer alignment,
individuals’ political attitudes have become more internally consistent and more distinct
from those of partisans on the other side (Abramowitz 2010; Fiorina and Adams 2009;
Levendusky 2009; Fiorina, Adams, and Pope 2006; Abrams and Fiorina 2015; Campbell
2016; Jacobson 2000, 2012; Bartels 2002; Pew 2017.). Affective reactions to parties and
candidates have diverged, largely because of partisans’ growing antipathy toward the
other party’s adherents and leaders (Abramowitz and Webster 2016, Pew 2014, 2016;
Iyengar and Westwood 2015). Widening demographic differences between the parties’
identifiers—differences of race, age, sex, religiosity, education, and marital status—have
also contributed to partisan “tribalism” (Shea 2013, Jacobson 2017a), as has the
increasing partisan homogeneity of the states and districts (Bishop 2008; Stonecash,
Brewer, and Mariani 2003).
1

Presidential job performance ratings provide one familiar gauge of the widening
party divide (Jacobson 2019, Figure 9.1). Table 1 displays the partisan trends in Gallup’s
presidential approval series, focused apropos this paper on midterm election years. The
partisan gap has varied over time, but the long-term trend is clearly upward. It reached a
then-record level of around 70 percentage points in the 2006-2010-2014 midterm years
but is up another eight points in 2018. The gap derives from opinions offered by both the
president’s and rival partisans, but the latter have contributed more to its recent growth.
Opposition partisans have rated the president much lower since 2006, with Trump’s
ratings among Democrats so far in 2018 the lowest ever for a president in a midterm year.
Republicans, in stark contrast, approve of Trump’s performance at a very high rate,
exceeded among a president’s partisans only by Eisenhower (1954), Reagan (1986),
Clinton (1998), and Bush (2002). By this measure, the 2018 midterm will feature the
most polarized electorate on record.
Table 1. Presidential Approval in Midterm Election Years, 1946-2018 ___________________________________________________________________________________ President’s Partisans Rival Partisans Difference Number of Polls 1946 46.7 24.1 22.6 3
1950 57.7 17.6 40.1 13
1954 88.1 55.7 32.4 16
1958 82.1 36.7 45.4 16
1962 86.0 48.7 37.3 13
1966 66.5 32.2 34.3 17
1970 82.1 41.3 40.8 18
1974 70.5 46.0 24.5 8
1978 57.1 28.3 28.8 25
1982 79.2 23.3 55.9 19
1986 86.8 41.6 45.2 13
1990 85.4 54.2 31.2 29
1994 74.3 19.5 54.8 37
1998 87.8 36.3 51.5 41
2002 94.9 53.1 41.8 45
2006 79.9 9.4 70.5 30
2010 81.7 12.4 69.3 50
2014 79.0 9.1 69.9 38
2018 86.4 8.1 78.3 32 ___________________________________________________________________________________ Note: The data for 1974 include only Ford’s presidency. Source: Gallup Polls
2
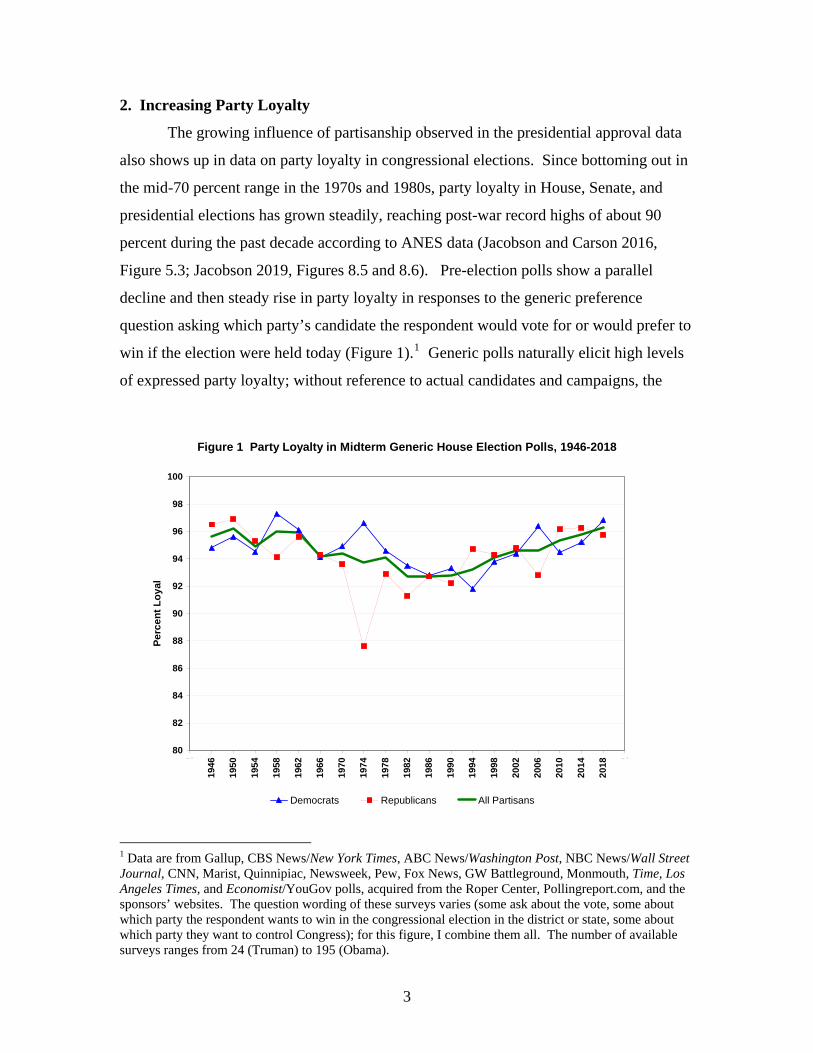
2. Increasing Party Loyalty
The growing influence of partisanship observed in the presidential approval data
also shows up in data on party loyalty in congressional elections. Since bottoming out in
the mid-70 percent range in the 1970s and 1980s, party loyalty in House, Senate, and
presidential elections has grown steadily, reaching post-war record highs of about 90
percent during the past decade according to ANES data (Jacobson and Carson 2016,
Figure 5.3; Jacobson 2019, Figures 8.5 and 8.6). Pre-election polls show a parallel
decline and then steady rise in party loyalty in responses to the generic preference
question asking which party’s candidate the respondent would vote for or would prefer to
win if the election were held today (Figure 1).1 Generic polls naturally elicit high levels
of expressed party loyalty; without reference to actual candidates and campaigns, the
Figure 1 Party Loyalty in Midterm Generic House Election Polls, 1946-2018
80
82
84
86
88
90
92
94
96
98
100
194
2
194
6
195
0
195
4
195
8
196
2
196
6
197
0
197
4
197
8
198
2
198
6
199
0
199
4
199
8
200
2
200
6
201
0
201
4
201
8
202
2
Pe
rce
nt
Lo
yal
Democrats Republicans All Partisans
1 Data are from Gallup, CBS News/New York Times, ABC News/Washington Post, NBC News/Wall Street Journal, CNN, Marist, Quinnipiac, Newsweek, Pew, Fox News, GW Battleground, Monmouth, Time, Los Angeles Times, and Economist/YouGov polls, acquired from the Roper Center, Pollingreport.com, and the sponsors’ websites. The question wording of these surveys varies (some ask about the vote, some about which party the respondent wants to win in the congressional election in the district or state, some about which party they want to control Congress); for this figure, I combine them all. The number of available surveys ranges from 24 (Truman) to 195 (Obama).
3

default option is one’s own declared side.2 Generic polls therefore always report higher
rates of party loyalty than the ANES studies, but they show the same pattern of a decline
and then revival of party loyalty over the postwar period.
The differing rates of loyalty among partisans in the generic polls anticipate party
fortunes in November quite accurately. Democrats enjoyed a substantial loyalty
advantage in their best post-war midterms—1958, 1974, and 2006 (when they gained 48,
48, and 30 seats, respectively), while Republicans held the advantage in 1946, 1950,
1994, and 2010 (gaining 55, 28, 54, and 63 seats, respectively).3 The numbers for 2018
so far show only a small Democratic advantage, with more than 96 percent of all
partisans who state a choice favoring their own party’s candidate. This average exceeds
(by a tiny margin) the high levels of party loyalty expressed in the 1950s and early 1960s,
but the earlier levels are almost certainly inflated by the survey instrument; all of the data
from this period are from Gallup Polls, which at the time routinely asked the party
identification and congressional preference questions in very close proximity,
maximizing the influence of one response on the other.4 In any case, the level of party
loyalty exhibited in generic polls in 2018 is by historical standards extraordinarily high,
reflecting the reluctance of voters to consider crossing party lines at a time of deep
partisan division. Democrats display the very high level of party loyalty we would
expect in a Democratic “wave” year, but Republicans are nearly as loyal in generic polls
as there were in 2010 and 2014, much more so than in earlier Democratic “wave” years.
3. The Growing Congruence of Presidential Approval with the Vote Choice
In conjunction with widening partisan differences in both presidential approval
and generic House vote, the congruence between evaluations of the president and the
generic vote—for the president’s party’s candidate if approving, for the other party’s if
disapproving—has also been growing (Figure 2). Congruence in pre-election polls
averaged about 70 percent from the ‘40s through the 1970s, 74 percent in the 1980s and 2 The data in Figure 1 are for respondents who express a choice; omitting the undecideds provides a cleaner comparison because of the substantial house effects in their treatment and proportions in the samples. 3 The only midterm with a large partisan swing not anticipated by the generic polls was 1966, when Republicans were recovering from their disastrous 1964 performance. 4 The order of the two questions varied; during this period, Gallup also usually asked who the respondent wanted to win in their state or district rather than who they planned to support; the pattern of responses indicates that variations in question wording made no significant difference.
4

1990s, and 82 percent in the first four midterms of this century (86 percent of the
anomalous 2002 case is omitted). So far in 2018, the average stands at an all-time high
of 93 percent.
Figure 2 Congruence between Presidential Approval and the House Vote Preference in Generic Midterm Election Polls, 1946-2018
0
10
20
30
40
50
60
70
80
90
100
1942 1946 1950 1954 1958 1962 1966 1970 1974 1978 1982 1986 1990 1994 1998 2002 2006 2010 2014 2018 2022
Pe
rce
nt
Co
ng
rue
nt
Pre-Election Polls Post-Election Polls
The level of congruence in the pre-election generic polls usually predicts the level
of congruence reported by voters in post election surveys very accurately. The two
obvious exceptions, 1974 and 2002, also have obvious explanations. In 1974, Gerald
Ford enjoyed very high approval ratings among Democrats (and everyone else) after
becoming president following Richard Nixon’s August resignation, but most Democrats
who approved of Ford had no intention of forgetting Nixon and Watergate on election
day (see the entry for 1974 in Figure 1). By November Ford, having pardoned Nixon,
was down more than 30 points from his early peak among Democrats, so congruity in
post-election polls was considerably higher than in pre-election polls. In the first half of
2002, George W. Bush continued to enjoy the huge rally in popular approval that
followed 9/11 and his forceful response the crisis, with Democrats giving him very high
marks early in the year without necessarily transferring that affection to other
Republicans; as Democrats’ approval of Bush fell from about 71 percent in January to
5
about 40 percent in November, congruence increased. Omitting these two exceptions, the
relationship between pre- and post-election congruence has been very strong (r=.96). A
regression equation estimating the latter from the former predicts a record level of
congruence—93.1 percent—among voters in 2018.5
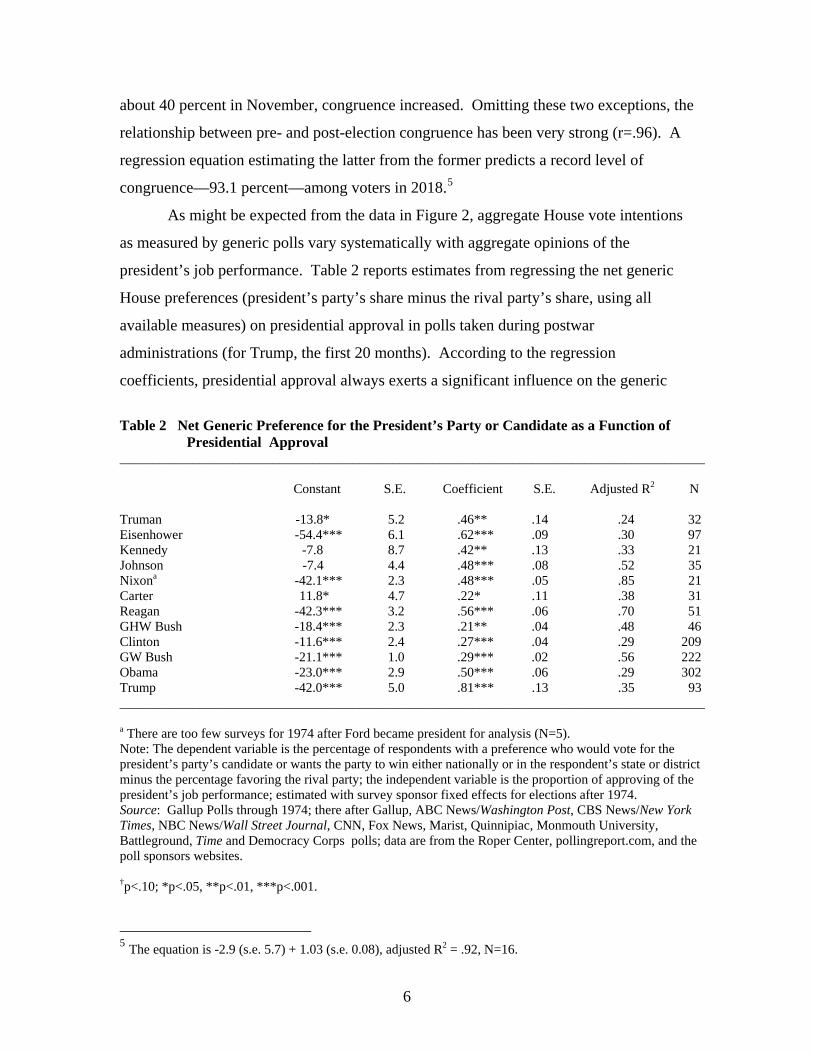
As might be expected from the data in Figure 2, aggregate House vote intentions
as measured by generic polls vary systematically with aggregate opinions of the
president’s job performance. Table 2 reports estimates from regressing the net generic
House preferences (president’s party’s share minus the rival party’s share, using all
available measures) on presidential approval in polls taken during postwar
administrations (for Trump, the first 20 months). According to the regression
coefficients, presidential approval always exerts a significant influence on the generic
Table 2 Net Generic Preference for the President’s Party or Candidate as a Function of
Presidential Approval ________________________________________________________________________________________ Constant S.E. Coefficient S.E. Adjusted R2 N Truman -13.8* 5.2 .46** .14 .24 32 Eisenhower -54.4*** 6.1 .62*** .09 .30 97 Kennedy -7.8 8.7 .42** .13 .33 21 Johnson -7.4 4.4 .48*** .08 .52 35 Nixona -42.1*** 2.3 .48*** .05 .85 21 Carter 11.8* 4.7 .22* .11 .38 31 Reagan -42.3*** 3.2 .56*** .06 .70 51 GHW Bush -18.4*** 2.3 .21** .04 .48 46 Clinton -11.6*** 2.4 .27*** .04 .29 209 GW Bush -21.1*** 1.0 .29*** .02 .56 222 Obama -23.0*** 2.9 .50*** .06 .29 302 Trump -42.0*** 5.0 .81*** .13 .35 93 ________________________________________________________________________________________ a There are too few surveys for 1974 after Ford became president for analysis (N=5). Note: The dependent variable is the percentage of respondents with a preference who would vote for the president’s party’s candidate or wants the party to win either nationally or in the respondent’s state or district minus the percentage favoring the rival party; the independent variable is the proportion of approving of the president’s job performance; estimated with survey sponsor fixed effects for elections after 1974. Source: Gallup Polls through 1974; there after Gallup, ABC News/Washington Post, CBS News/New York Times, NBC News/Wall Street Journal, CNN, Fox News, Marist, Quinnipiac, Monmouth University, Battleground, Time and Democracy Corps polls; data are from the Roper Center, pollingreport.com, and the poll sponsors websites. †p<.10; *p<.05, **p<.01, ***p<.001.
5 The equation is -2.9 (s.e. 5.7) + 1.03 (s.e. 0.08), adjusted R2 = .92, N=16.
6
vote, but variations in Trump’s ratings have so far had a stronger influence than those of
any predecessor, with Eisenhower as a rather surprising runner-up. More precise
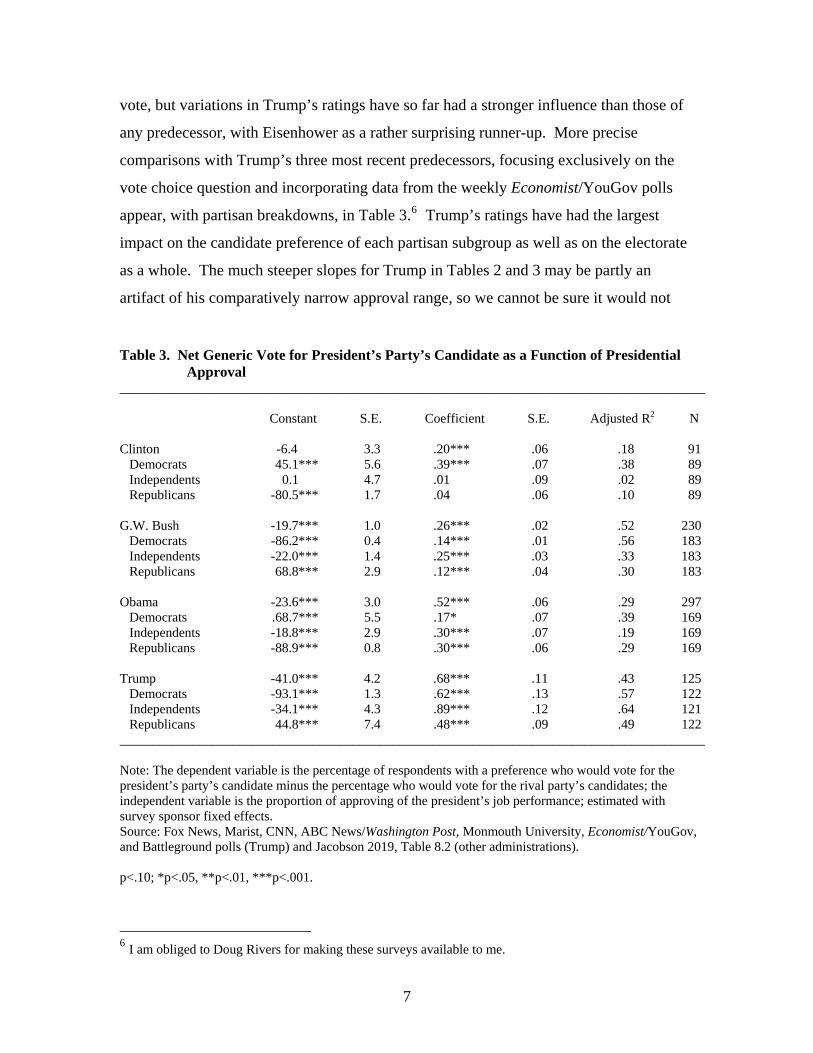
comparisons with Trump’s three most recent predecessors, focusing exclusively on the
vote choice question and incorporating data from the weekly Economist/YouGov polls
appear, with partisan breakdowns, in Table 3.6 Trump’s ratings have had the largest
impact on the candidate preference of each partisan subgroup as well as on the electorate
as a whole. The much steeper slopes for Trump in Tables 2 and 3 may be partly an
artifact of his comparatively narrow approval range, so we cannot be sure it would not
Table 3. Net Generic Vote for President’s Party’s Candidate as a Function of Presidential
Approval ________________________________________________________________________________________ Constant S.E. Coefficient S.E. Adjusted R2 N Clinton -6.4 3.3 .20*** .06 .18 91
Democrats 45.1*** 5.6 .39*** .07 .38 89 Independents 0.1 4.7 .01 .09 .02 89 Republicans -80.5*** 1.7 .04 .06 .10 89
G.W. Bush -19.7*** 1.0 .26*** .02 .52 230 Democrats -86.2*** 0.4 .14*** .01 .56 183 Independents -22.0*** 1.4 .25*** .03 .33 183 Republicans 68.8*** 2.9 .12*** .04 .30 183
Obama -23.6*** 3.0 .52*** .06 .29 297 Democrats .68.7*** 5.5 .17* .07 .39 169 Independents -18.8*** 2.9 .30*** .07 .19 169 Republicans -88.9*** 0.8 .30*** .06 .29 169
Trump -41.0*** 4.2 .68*** .11 .43 125 Democrats -93.1*** 1.3 .62*** .13 .57 122 Independents -34.1*** 4.3 .89*** .12 .64 121 Republicans 44.8*** 7.4 .48*** .09 .49 122
________________________________________________________________________________________ Note: The dependent variable is the percentage of respondents with a preference who would vote for the president’s party’s candidate minus the percentage who would vote for the rival party’s candidates; the independent variable is the proportion of approving of the president’s job performance; estimated with survey sponsor fixed effects. Source: Fox News, Marist, CNN, ABC News/Washington Post, Monmouth University, Economist/YouGov, and Battleground polls (Trump) and Jacobson 2019, Table 8.2 (other administrations).
p<.10; *p<.05, **p<.01, ***p<.001.
6 I am obliged to Doug Rivers for making these surveys available to me.
7

flatten out were that range to broaden.7 Still, the results suggest that reactions to Trump
will have a stronger effect on the midterm House vote than have reactions to previous
presidents.
The generic Senate preference is asked much less frequently than the generic
House preference, but when it is, partisan responses are virtually identical to those
regarding House elections, and Senate data match the House data in Figure 2 quite
closely (Jacobson 2019, Figure 8.10). During the current midterm cycle, the Quinnipiac
Poll has asked voters about their preferences for party control of the House and Senate
separately in 21 of their surveys. The mean net Republican preference (percent
Republican minus percent Democrat) is -10.7 points for the Senate, -10.8 points for the
House. The two are correlated across the surveys at .98, and the coefficients from
regressing them on Trump approval are similar, 1.04 (s.e., .21, p<.001) for the House and
1.15 (s.e., .23, p<.001) for the Senate.
4. Nationalized Elections
As midterm elections have become more cohesively partisan and president-
centered, the balance of local and national influences on voting has naturally shifted
toward the national. One way to gauge electoral nationalization is to compute the
standard deviation of the major-party vote swing from the previous election across stable,
contested districts; the smaller the standard deviation, the more uniform the swing across
districts, and thus the more nationalized the election. The 2014 midterm swing was the
most uniform for the entire postwar period, with at standard deviation (4.3 points) less
than half the size of its average for the 1970s and 1980s (Jacobson 2015, 10). The
swing’s standard deviation was also at a postwar low for a presidential election year in
2016 (4.5 points). A second indicator of increasing nationalization, which also points to
the growing centrality of the president to this trend, is the correlation between the state or
district presidential vote two years prior and the midterm vote. This correlation has
increased steeply since the 1970s, reaching record levels of .94 and .88, respectively, in
the 2014 House and Senate elections (Jacobson and Carson 2016, 217).
7 Trump’s approval rating has so far varied over a range of only 14 points, with a standard deviation of 2.6 points; the comparable numbers for Clinton were 26 and 6.2, for Bush 67 and 16.3, and for Obama, 30 and 4.8.
8

II. The Trump Effect
The data presented so far suggest that 2018 will see a further extension of
polarized, nationalized, and president-centered midterm electoral politics. The prime
reason is of course Donald Trump, whose command of the national stage, combined with
the public’s sharply divergent responses to his words and actions, has reinforced all of
these trends. As documented in Table 1, Trump is easily the most polarizing president
yet observed in a midterm year, maintaining the pattern of responses to his performance
that has prevailed since he took office. Trump began his presidency with a record
partisan gap in approval ratings, a product of record lows among rival partisans; he also
received the lowest initial ratings from independents and from all respondents combined
of any newly elected president (Jacobson 2018). Opinions of his performance since then
have remained unusually stable, with modest declines in approval and then equally
modest increases among partisans of all stripes (Figure 3). As of August 2018, Trump’s
popular standing was about where it was during his first few months in the White House,
comparatively low and extremely polarized.
Figure 3 Approval of Trump's Job Performance, January 2017- August 2018
0
10
20
30
40
50
60
70
80
90
100
Jan-17 Mar-17 May-17 Jul-17 Sep-17 Nov-17 Jan-18 Mar-18 May-18 Jul-18 Sep-18
Per
cen
t A
pp
rovi
ng
All Democrats Republicans Independents
Source : 211 ABC News/Washington Post , CBS News/New York Times , CNN, Gallup, IBD-TIPP, Marist, Monmouth, NBC News/Wall Street Journal, Pew, Democracy Corps and Quinnipiac polls.
9
The stability in popular opinions of Trump is no mystery, for his conduct as
president has given most people no reason to revise what they thought of him as a
candidate. Democrats and others appalled by his character and objectives before the
election have seen their worst expectations confirmed. Trump has mounted a root and
branch assault on Obama’s entire legacy (on health care, environmental protection,
financial regulation, taxes, fiscal policy, immigration, and foreign trade). The trafficking
in white identity politics, xenophobia, racism, and misogyny that characterized Trump’s
campaign has continued unabated. He continues to launch crude tirades against his
opponents and critics in politics and the media and to target Hillary Clinton as if the
election were not history (Bump 2017, Schallhorn 2018). Trolling Democrats by blaming
them for his own policy disasters (e.g, splitting young children from immigrant parents at
the border) is standard practice. Any institution that declines to do Trump’s bidding—the
judiciary, the FBI, the Department of Justice, the intelligence services, at times the
congressional Republican Party, and always the news media—finds its legitimacy under
attack. Crowning it all is Trump’s unending stream of transparent, self-serving lies.8 It
is no mystery, then, why Democrats not only disapprove of Trump’s job performance i
overwhelming numbers, but do so “strongly” when given the option. For example, in the
13 Quinnipiac Polls of registered voters taken so far in 2018, an average of 93 percent of
Democrats say they disapprove of Trump’s performance, 86 percent strongly.
n
9
Trump has also generally met the expectations of the Republicans who voted for
him, and they, like Democrats, also regard him pretty much as they did before he was
elected. Almost everything has said or done as president has catered exclusively to the
coalition that elected him, its white populist component in particular but also to small
government and religious conservatives, (Jacobson 2017a, 2017b, 2018). Most of his
supporters evidently share his opinions and sensibilities, enjoy his in-your-face responses
to critics and disdain for “political correctness,” and cheer his anti-Muslim and anti-
immigrant projects and “America First” rhetoric and policy initiatives. Conservative
Christians celebrate his Supreme Court nominations and defense of “religious freedom”
8 By August 1, 2018, the count of Trump’s false or misleading statements compiled by the Washington Post had risen above 4,200, an average of 7.6 per day (Kessler, Rizzo, and Kelley 2018) 9 The Quinnipiac data may be found at https://poll.qu.edu/; data are through mid August poll.
10

as well as the transfer of the American embassy in Israel to Jerusalem. Conventional
small-government and corporate Republicans, if less comfortable with Trump’s rhetoric
and style than his blue-collar enthusiasts and more doubtful about his protectionist
moves, nonetheless appreciate his assaults on Obama’s regulatory legacy and success in
cutting taxes on corporations and the wealthy. Just as doubts about Trump’s suitability
for the office did not prevent them from voting for him in 2016 (Jacobson 2017b), many
ordinary Republicans, like most of their elected leaders, have so far accepted Trump’s
sometimes cringe-worthy behavior as a tolerable price for his support of their policy
goals. Republicans are not quite as unanimous as Democrats in their opinions of Trump
(an average of 84 percent in the Quinnipiac polls approve of his performance), but large
majorities of them approve strongly (an average of 69 percent), contributing to an
unprecedented level of polarization on this dimension, with more than three quarters of
respondents expressing strong opinions, pro or con, of the president.
In short, Trump’s conduct of his presidency so far has entrenched and deepened
the political fault lines exposed by the 2016 election (Sides, Tesler, and Vavreck 2018)
while changing remarkably few minds. The weekly Economist/YouGov surveys ask
respondents how they voted in 2016; self-professed Trump and Hillary Clinton voters
remain almost as divided in their opinions of Trump as the were on election day. In the
31 surveys taken in the first eight months of 2018, 91 percent of Trump’s voters approved
of his performance (62 percent strongly), while 7 percent disapproved; 4 percent of
Clinton’s voters approved, while 93 disapproved (84 percent strongly).10 The extreme
data points for 2018 in Table 1 and Figures 1 and 2 thus reflect Trump’s singular flair for
provoking unusually intense and sustained reactions from both opponents and supporters.
The Republican Party Becomes Trump’s Party
Trump’s words and deeds easily explain why ordinary Democrats condemn his
job performance, although their attitudes also echo the overwhelmingly anti-Trump
consensus expressed by Democratic leaders and the mainstream or left-leaning
commentariat. Ordinary Republicans, in contrast, have stuck with Trump despite earnest
criticism from prominent figures in their own camp who have variously denounced him
10 YouGov data are at https://today.yougov.com/topics/overview/survey-results.
11
for dishonesty, incompetence, instability, ignorance, bigotry, scorn for allies, and affinity
for dictators.11 Just as the denunciations of Trump by Republican leaders and
conservative pundits before the 2016 election did nothing to deter Republicans from
voting for him, post-election criticism from the same quarters has done nothing to
dampen Trump’s popularity among ordinary Republicans—who in any case can readily
find reassurance, if needed, in the unfailing support for Trump delivered by his admirers
on their preferred media outlet, Fox News. If asked to chose, most Republicans put
Trump ahead of his party. They invariably rate his favorability higher than that of the
Republican Party generally or of its congressional wing and its leaders in particular, and a
solid majority side with Trump when conflicts with other Republican politicians arise
(Jacobson 2018). Asked in the July, 2018, NBC News/Wall Street Journal survey, “Do
you consider yourself to be more of a supporter of Donald Trump or more of a supporter
of the Republican Party?” 55 percent of Republicans chose Trump, 35 percent, the party;
these results are typical.12
Insofar as Trump has been vying with more conventional Republicans and
conservatives for the hearts and minds of Republican voters, he is the hands-down
winner. Congressional Republicans have implicitly acknowledged that victory by their
reluctance to criticize even his most flagrant assaults on American institutions, norms,
and allies. The handful of exceptions is telling. Senators John McCain, Bob Corker, and
Jeff Flake, expressing sentiments thought to be fairly widespread among congressional
Republicans (Mascaro 2017), have on occasion loudly and sometimes eloquently
denounced Trump’s character, behavior, and governance. But they could be candid only
because they were not seeking reelection. McCain’s health precluded any future run, but
Corker and Flake chose to end their careers rather than face almost certain defeat in
primaries as the price of speaking out against Trump. They read their party accurately.
11 His detractors have included such conservative luminaries as Erick Erickson, George Will, Jonah Goldberg, the late Charles Krauthammer, Jennifer Rubin, Ross Douthat, David Brooks, John Podhoretz, Peggy Noonan, William Kristol, and Max Boot. 12 This survey had asked the question seven times previously, with an average of 55 percent choosing Trump, 40 percent the Republican Party; see https://www.wsj.com/public/resources/documents/NBCWSJJulyPoll.pdf?mod=article_inline, accessed July 23, 2018.
12

Among Republicans the October 29-31, 2017 Economist/YouGov survey, Trump’s net
favorability rating was +65, while McCain’s was -36, Corker’s, -32, and Flake’s, -37.13
The danger of breaking with Trump while facing a Republican primary electorate
was underlined by the defeat of incumbent Republican representative Mark Sanford (SC
1), who had opposed Trump’s tariffs on steel and aluminum, wanted to see his tax
returns, and accused him of “fanning the flames of intolerance” (Hohmann 2018).
Sanford lost to enthusiastic Trump supporter Katie Arrington, who received the last-
minute endorsement from Trump in district he had carried with 57 percent of the vote.
“We are the party of President Donald J. Trump,” Arrington declared in her victory
speech (Hohmann 2018). Indeed. A striking sign of Trump’s ability to shape ordinary
Republicans’ thinking was their responses to questions about his administration’s callous
policy, since rescinded if not yet fully rectified, of separating even very young children
from parents arrested at the border for crossing illegally. In precisely the same time
frame (June 14-17, 2018), the CBS News and CNN polls asked opinions about the policy.
The CBS question did not mention Trump, and only 36 percent of Republicans said such
a policy was acceptable, 39 percent said it was not. The CNN question specified it as
Trump’s policy, and 58 percent of Republicans said they approved of it, 38 percent did
not.14 Later, in the June 27-July 1 Quinnipiac poll, 71 percent of Republicans said they
did not consider separating young children from their parents at the border a violation of
13 Net favorability is the proportion expressing a favorable opinion minus the proportion expressing an unfavorable opinion; Democrats, in contrast, expressed net favorable opinions of all three; see https://today.yougov.com/news/2017/11/01/flake-corker-mccain-losing-ground-republicans/, accessed November 1, 2017. Eight months later, McCain and Flake were even more unpopular among Republicans in their home state of Arizona; in the June, 2018, CBS News tracking poll of the state, McCain’s net favorability among Republicans stood at -48, Flake’s, -55. In the same survey, 86 percent of Republicans said approved of Trump’s performance, And again, McCain and Flake were viewed much more favorably by Democrats than Republicans; see https://www.cbsnews.com/news/cbs-news-battleground-tracker-arizona-florida-texas-immigration-and-key-senate-races/, accessed June 29, 2018. 14 The CBS wording was, “As you may know, when some families trying to enter the U.S. illegally at the southern border have been caught and detained, U.S. officials have separated parents from their children. Do you think this separation of parents and children is acceptable, or unacceptable, or haven't you heard enough about it to say?" The CNN wording was, "As you may know, the Trump administration has changed its policy toward immigrants who are detained at the U.S. border for coming into the country illegally. More of them are being criminally charged and sent to jail even if their children are with them and, as a result, there has been a significant increase in the number of young children who have been separated from their parents at the border and placed in government facilities. In general, do you approve or disapprove of this?” See http://www.pollingreport.com/immigration.htm.
13

human rights. On all of these questions 90 percent or more of Democrats took the
opposite position, as did 60 to 68 percent of independents.
In this and in other matters, Trump’s command of the Republican base is truly
impressive. Not only do majorities of Republicans agree with him on most issues, but
they also take his side on virtually every major question about his performance and
character, accepting even the most dubious propositions. To a considerable extent this
reflects Trump’s success in destroying the credibility and legitimacy of standard news
sources in the eyes of ordinary Republicans, for it enables them to reject or ignore any
negative information that may be reported. Republican beliefs regarding Trump, his
performance, and the news media are detailed in four tables in the Appendix that report
results from various Quinnipiac Polls taken in 2018.15 They are worth a look because
they underline how impervious Trump’s support has been to negative information and
therefore how difficult it will be for Democrats to attract crossover votes in the midterm.
To summarize the findings:
1. Character. Substantial Republican majorities say Trump is a good role model
for children (63 percent), provides moral leadership (80 percent), is more honest (57
percent) and works harder (57 percent) than previous presidents (Table A1). This for a
president who lies incessantly and shamelessly, who vacations far more frequently than
his predecessors (Goeres 2018) and reportedly spends hours daily watching TV
(Haberman, Thrush and Baker 2017), and who revels in taunting critics and bullying
subordinates and allies (e.g. Atkins 2018). By large margins, Republicans also accept
Trump’s denial of racism (86 percent), say he respects people of color (83 percent), and
approve of his handling of race relations (74 percent)—this despite his long history of
racial animus, continuing indulgence in race-baiting rhetoric, and an upsurge in hate
crimes under his watch.16 Most (67 percent) also say that he respects women, again
15 Survey results in these tables are posted at https://poll.qu.edu/national/. 16 The “highlights” include his dealing with minority tenants in New York, his propagation of the birther lie regarding Obama origins, his attack on an American judge of Mexican heritage, his defense of white supremacist marchers as including “very fine people,” his denigration Haitian and Central America immigrants as people from “shithole countries,” his demand that black athletes kneeling during the national anthem to protest police killings be fired, and his dehumanizing illegal immigrants as “animals” “infesting” the country; for other examples, see also Rubin (2018) and O’Brien (2018). For hate crimes, see Hauslohner (2018).
14

despite abundant evidence to the contrary.17 What almost everyone else sees as an
autocratic bent, Republicans see as normal for a president (76 percent).
2. The Media and other institutions. The capacity of so many ordinary
Republicans to deny, ignore or rationalize what other Americans perceive in Trump’s
character and behavior reflects (highly) motivated reasoning, to be sure (Kunda 1990;
Taber and Lodge 2013), but it also reflects Trump’s success in raising skepticism about
the mainstream news media, fairly widespread to begin with, to unprecedented heights
among Republican partisans (Table A2). His depiction of any negative stories about him
as “fake news” has found a ready audience in the Republican base.18 A large majority of
Republicans trust Trump more than the news media (75 percent), believe mainstream
news organizations make up negative stories about him (80 percent), dislike their
coverage of Trump (87 percent), and back his attacks on them (67 percent). Most
Republicans (51 percent) even accept his menacing characterization of the news media as
“the enemy of the people” rather than an important part of democracy (36 percent).19
Beyond the news media, Republicans also say they trust Trump more than U.S.
intelligence agencies (60 percent to 27 percent), and they largely buy his claim that the
FBI is biased against him and is performing poorly. They take his word over former FBI
director James Comey’s by a 63 point margin.
3. The Russia Investigation. Trump’s sustained effort to delegitimize the news
media and the FBI is aimed, among other things, at insulating him from the threat posed
by Robert Mueller’s investigation into Russian interference in the 2016 election that U.S.
intelligence agencies uniformly concluded was aimed at helping him win. Again, the
survey evidence indicates that he is succeeding with the Republican base (Table A3). A
large majority of Republicans now accept Trump’s characterization of the investigation
as a ‘witch hunt” (80 percent) and most consider it unfair (61 percent). A plurality does
17 The evidence includes the notorious tape of Trump bragging about grabbing women by their private parts, but also a pattern of particular nastiness to women who dare to criticize him, including Carly Fioriana during the primaries, Hillary Clinton, female reporters, Elizabeth Warren (a two-fer with the racist “Pochohontas” label), and African-American U.S, Representative Maxine Waters. He also seems especially critical of national leaders who are women—Angela Merkel and Theresa May (Jaffe, Jordan, and Dawsey 2018). 18 One survey found that 40 percent of Republicans think that even accurate but negative stories qualify as “fake news” (Knight Foundation, 2018). 19 In three earlier Quinnipiac polls asking this question in 2018, the Republicans split 51-37 (April 14-17 poll), 42-35 (June 20-24 poll), and 45-44 (July 18-23) in favor of “enemy of the people.”
15
accept that Russia tried to interfere, but few think it affected the outcome. Despite
Trump’s firing of Comey, attacks on Mueller, and repeated demands that the
investigation be ended, few Republicans think he is trying to “derail or obstruct” the
investigation (12 percent). Most accept his denial of collusion by him or his campaign
(89 percent and 87 percent, respectively) and don’t believe the Russian government has
compromising information on him (70 percent).
4. Effects. Finally, an astonishing three quarters of Republicans say Trump is
doing more to unite than divide the country (Table A4), while all the evidence, survey
and otherwise, attests to the opposite.20 Eighty percent think that Trump “has
strengthened the United States’ position as leader of the free world,” while his alienation
of NATO allies, praise of authoritarian leaders (not least Vladimir Putin), initiation of
trade wars, and indifference to human rights has actually made foreign nations sharply
more skeptical of U.S. leadership.21 And two-thirds agree with Trump that “a trade war
would be good for the United States, and could be easily won,” a position backed by no
reputable economist22 and currently undergoing a reality test, with unpromising results so
far.
The Republican respondents’ consistently pro-Trump opinions on almost all of
the questions in these tables are starkly at odds with the strong anti-Trump consensus on
the same questions among respondents who are not Republicans. Such attitudes illustrate
a reality that is profoundly consequential for the 2018 election and beyond: a large
majority of ordinary Republicans have cast their lot with Trump and remain deaf to any
information that might undermine their faith. It is not necessary to believe that most
Republicans really want their kids modeling their behavior on Trump’s or to take their
responses to other questions as expressions of sincerely held views rather than reflexive
support for a leader who, whatever his faults, they believe is on their side, for these data
20 This is a question answered by its own results, with 96 percent of Democrats saying “divide” compared to the 75 percent of Republicans saying “unite”; the average partisan difference on the questions listed in the Appendix is 66 points; see also, for examples, Table 1 and Figure 3 in this paper and Pew (2017) and Newport and Dugan (2017). 21 For example, among NATO allies, the average proportion approving of U.S. leadership across all members dropped from 47 percent to 28 percent between 2016 and 2017; among the four most important members—United Kingdom, Germany, France, and Canada—it fell even further, from 54 percent to 25 percent (Ray 2018). Across all countries, average approval of U.S. leadership was down about 30 percentage points, with the largest drops among the best educated citizens of these countries (Ritter 2018). 22 Even the Heritage Foundation deserts Trump on this one (Roberts 2018).
16

to be meaningful. The very fact that this is how they choose to present themselves to
strangers probing their political opinions over the phone shows just how committed most
rank-and-file Republicans are to Trump—if only out of hostility to his detractors.
III. The Referendum
The extraordinarily polarized reactions to his presidency have put Trump at the
center of electoral politics in 2018 (where he will no doubt contrive, successfully, to
stay). Both Trump’s opponents and supporters have come to believe, not always without
trepidation, that the election will be a sweeping national referendum on the president and
his agenda. All indications are that they are right. The proportion of voters saying that
their vote would be a signal of support or opposition to the president so far in 2018
slightly exceeds that of the recent “wave” years of 2006 and 2010 (Figure 4). A Pew
survey taken in August 2018 found a record high proportion of respondents saying
control of Congress would be a factor in their vote, including 78 percent who planned to
support the Democratic candidate and 75 percent who would support the Republican.
Both figures were the highest since Pew began asking this question in 1998 (Pew 2018a,
2018b).
Figure 11 Is Your Vote For Congress a Vote For or Against the President?
12
21
14
15
22
18
15
36
29
29
33
15
23
19
17
20
31
18
27
19
24
26
0 10 20 30 40 50 60
Carter 1978 (1)
Reagan 1982 (1)
Reagan 1986 (2)
GHW Bush 1990 (2)
Clinton 1994 (3)
Clinton 1998 (7)
GW Bush 2002 (4)
GW Bush 2006 (10)
Obama 2010 (13)
Obama 2014 (16)
Trump 2018 (4)
Percent
Against the President For the President
Source : Pew, Gallup, CBS News/New York Times , NBC News/Wall Street Journal , AP-GfK, and ABC News/Washington Post Polls.
Note : the number of surveys averaged is in parentheses.
17

Democrats, energized by and united against Trump since his inauguration, are
looking to the midterm as their first chance to mitigate the catastrophe they experienced
in 2016. Regarding Trump as someone who disrespects women and threatens their
rights,23 Democratic women have led the way. Both his rhetoric and actions on health
care, immigration, reproductive rights, and the environment have provoked not only a
steady stream of protests, frequently organized and led by women (Putnam and Skocpol
2018), but also a remarkable upsurge in their electoral involvement. Of the 226
nonincumbent Democrats nominated as House candidates through August 14, 108 (48
percent) have been women; counting incumbent Democrats, 151 of the party’s 373
nominees to date (40 percent) are women. Similarly, it is likely that 15 of the 35
Democratic Senate candidates (43 percent) will be women. These are historically very
high numbers; the comparable figures for Republican House nominees are 13 percent and
11 percent, respectively, for Republican Senate nominees, 23 percent. Democratic men
are not as uniformly hostile to Trump as are Democratic women, but they are nearly as
united in planning to vote for Democratic candidates in 2018.24
Trump unites Republicans as well as Democrats, but an election shaping up as a
referendum on him and his administration poses problems for a pivotal subset of
Republican candidates. His overwhelming popularity among core Republican voters is
more than offset by his wider unpopularity elsewhere, decisively among Democrats but
also generally among independents (Figure 3). Moreover, his policies on health care,
taxes, immigration, and deregulation get majority support only among Republicans and
are opposed by majorities of the overall public.25 In the states and districts where the
competitive balance is relatively even, Republican candidates have to go easy on Trump
to avoid turning off their base while also appealing to voters they will need to win who
are not at all Trump fans. Trump himself has made this balancing act more difficult by
reverting to full campaign mode, most notably in his mendacious scapegoating of illegal
immigrants, reiterating the thinly veiled appeals to white nationalism featured in his 2016 23 In the June 2018 Pew survey, only 16 percent of Democratic women said that Trump respected women; 79 percent of Republicans said he did, as did 43 percent of all respondents; in the 24YouGov surveys taken during the first half of 2018, 81 percent of Democratic women disapproved of how Trump was handling “women’s rights,” 9 percent approved; 70 percent disapproved “strongly.” 24 In the 31 YouGov polls taken in 2018 through mid-August, 97.6 percent of Democratic women planned to vote for their party’s House candidate, as did 96.4 percent of the Democratic men. 25 See the data on such questions at pollingreport.com.
18

campaign (Griffiths 2018, Oppenheimer 2018). Republican candidates in states and
districts where association with Trump is not an asset will naturally try to carve out
independent political identities, but even without Trump dominating the news cycle and
resurrecting his most divisive campaign themes, separating themselves from their party’s
leader will be close to impossible in the current polarized environment.
Standard Midterm Referendum Theories
All of the data available to date suggest that 2018 will produce a classic midterm
referendum on the administration’s performance, but given Trump’s capacity for
disruption, it remains to be seen how closely it will conform to the patterns of past
referendums. Since Tufte’s (1975) pioneering work, the idea that voters in aggregate
treat the midterm election as a referendum, rewarding or punishing the administration’s
party’s congressional candidates for its perceived successes or failures, has been well
documented and widely accepted in the literature.26 In standard models from this
literature, the president’s current approval ratings and economic conditions are the prime
movers, although of size the president’s party’s congressional contingent also matters (all
else equal, the more seats the president’s party holds, the more it has to lose). If the 2018
election follows suit, Trump’s current low public standing threatens Republican control
of one or both houses of Congress, while the solid economic growth occurring in 2018
will serve as a counterforce. Table 4 presents a typical model based on midterms from
1946 through 2014 in which the independent variables predicting the midterm losses are
percent approving of the presidents performance in the Gallup Poll closest to election
day, the change in real disposable income per capita over the election year, and the deficit
or surplus of House seats currently held by the president’s party compared to its eight-
election moving average (its “exposure”; for details, see Jacobson and Carson 2016 and
Jacobson 2019, chapter 8). The table also displays the Democratic House seat gains
(Republican losses) predicted by various combinations of approval and income change.
Democrats would have to win 24 more seats than they won in 2016 to win control of the
House, hence the numbers in blue indicate a Democratic majority, in red italics a
Republican majority after the 2018 election.
26 For a discussion and citations for this extensive literature, see Jacobson and Carson (2016, 184-189).
19

Table 4 House Seat Swing to Democrats Predicted by Presidential Approval and Real Income Change in 2018 _______________________________________________________________________________________
Constant Presidential
Approval Real Income
Change
Exposure Adjusted
R2
N Coefficient -100.23*** 1.52** 3.32* -.51** .65 18 Standard Error 15.40 .32 1.53 .17 *p<.05; **p<.01; ***p<.001 _______________________________________________________________________________________ Presidential Approval
Change in Real Disposable Income per Capita __________________________________________________________________________
-0.5 0.0 0.5 1.0 1.5 2.0 2.5 3.0
30 56 55 53 51 50 48 46 45 32 53 52 50 48 47 45 43 42 34 50 49 47 45 44 42 40 39 36 47 46 44 42 41 39 37 36 38 44 42 41 39 37 36 34 33 40 41 39 38 36 34 33 31 29 42 38 36 35 33 31 30 28 26 44 35 33 32 30 28 27 25 23 46 32 30 29 27 25 24 22
2048 29 27 26 24 22 21 19 1750 26 24 23 21 19 18 16 1452 23 21 20 18 16 15 13 1154 20 18 16 15 13 12 10 856 17 15 13 12 10 8 7 558 14 12 10 9 7 5 4 260 11 9 7 6 4 2 1 -1
_______________________________________________________________________________________
According to these estimates, if Trump’s approval rating in the Gallup Polls stays
at his April-August 2018 average, 41.2 percent, Republicans are predicted to lose their
House majority at any plausible level of real income growth. Over the year prior to June,
2018, real income grew by about 2 percent.27 At this rate Trump’s approval ratings
would have to rise above the mid 40s—higher than in any Gallup Poll to date—for
Republicans to be favored to keep their majority. These are point predictions from an
equation with a large standard error of the estimate (about 13 seats), so they are more
27 Data are from the U.S. Bureau of Economic Affairs at https://www.bea.gov/iTable/iTable.cfm?reqid=19&step=2#reqid=19&step=3&isuri=1&1921=survey&1903=76, accessed July 20, 2018.
20

illustrative than precise. But the do suggest that present conditions favor a Democratic
House majority if 2018 turns out to be a typical midterm referendum and the conditions
obtaining in the summer persist through election day.
A peculiarity in the data for 2018 is the disjunction between the approval and
economy figures. Ordinarily, we would expect a president enjoying very good economic
numbers (solid economic growth, very low unemployment, low inflation, a strong stock
market, and the rosiest public views of the economy in more than a decade28) to have
much higher overall approval ratings than Trump has enjoyed so far (Saad 2018). His
low approval ratings are thus eloquent testimony to how off-putting the rest of his
performance has been to people outside his base. They also underline how essential a
strong economy is to the Republicans’ chances of retaining full control of Congress.
Strategic Politicians in 2018
In addition to directly influencing the vote choice (Jacobson and Carson 2016;
Jacobson 2019), presidents also affect midterm elections by helping to shape the strategic
environment, which affects the relative quality and resources of the congressional
candidates that take the field and thereby the share of votes and seats won by each side,
because the party with superior candidates and more resources tends to win more votes
and seats. Potential candidates and contributors in the opposing party regard an
unpopular president as an opportunity to take seats from the president’s party, and the
enhanced recruitment, finances, and motivation that results helps shift the competitive
balance in the out-party’s favor. So, too, does the strategic exit of incumbents in the
president’s party who, sensing an incipient wave against their side, retire preemptively,
thereby forfeiting the local incumbency advantage (Jacobson and Kernell 1983; Jacobson
1989; Jacobson and Carson 2016).
On all of these counts, the action suggests widespread anticipation of a pro-
Democratic wave in 2018. In late 2017, Democrats held a huge advantage in fundraising
and candidate recruitment (Schneider 2017; Malbin 2018), and their candidates continued
to out raise their Republican opponents in competitive races during the first half of 2018
28 In the July 2018 CBS News poll, 67 percent of respondents rated the economy as “very” or “fairly” good, near the highest proportion since 2001.
21

(Wright 2018; Wasserman 2018a). By June 2018, 42 House Republicans had said they
would not seek reelection, 28 of whom were not pursuing higher office. Seven of the 42
represented districts won by Clinton in 2016, and several more were from districts Trump
won only narrowly. Overall, House Republicans were twice as likely to retire from one
of their 25 districts won by Clinton29 than from one of the 215 districts won by Trump
(32 percent compared to 15 percent, p=.036), clear evidence of strategic exit in the face
of a difficult reelection environment. At the same juncture, only 19 Democrats had
announced retirements, nine of them to pursue higher office. By the end of July, after
retirements, three incumbent defeats in primaries, one death, and a redrawing of district
lines in Pennsylvania, Republicans were defending 43 open seats, Democrats, 22. In
mid-August, with about 85 percent of the nominations decided, Democrats also held a
wide lead in the proportion of experienced and well-financed challengers fielded against
incumbents. Insofar as strategic politicians contribute to the creation of a national tide,
both Democrats and Republicans seem to be doing their assigned parts in 2018.
Balancing
A variation on the standard referendum model, inspired by the fact that the
president’s party almost always loses House seats in midterm elections no matter how
favorable national conditions, proposes that the electorate in aggregate uses the midterm
to elect a Congress that “balances” the president ideologically. The logic here is that
voters near the ideological median prefer more centrist policies than either party pursues.
The presidential winner tends to push policy too far in one ideological direction, so the
centrist voters respond at the midterm by switching their support to candidates of the rival
congressional party to strengthen its numbers and thereby induce policy compromises
closer to the center (Alesina and Rosenthal 1995; Fiorina 2003; Bafumi, Erikson, and
Wlezien 2010; Mebane 2000; Scheve and Tomz 1999). Some versions of this argument
have implied that balancing is the sole explanation for midterm swings (Erikson 1990;
Alesina and Rosenthal 1989).
The 2018 midterm will provide a clean test the balancing model. Trump and his
allies in Congress have certainly sought to move policy sharply to the right, with 29 The presidential vote has been recomputed for the new Pennsylvania districts drawn in early 2018; this boosted the number of Republican-held seats where Clinton won the plurality from 23 to 25.
22

considerable success in many if not all policy domains. Very few of these initiatives
have commanded anything like majority support among the public. More Americans
have consistently opposed than favored Trump’s proposals and policies regarding health
care, taxes, immigration (including building a wall, cutting legal immigration, and
banning Muslims), the environment (withdrawing from the Paris Accords, expanding
coal production, building the Keystone pipeline), and banning transgendered people from
the military.30 Only on trade issues has support and opposition been relative balanced,
although opinion has evidently shifted against protectionism as the consequences have
become clearer.31 Even the Republicans’ greatest legislative success, the major tax cut
legislation enacted in December 2017, wins approval from less than 40 percent of the
public.32
If ever an administration has invited balancing, then, it would seem to be
Trump’s. And when the June 27-July 1 Quinnipiac poll asked voters if they would “like
to see Congress be a check on President Trump,” a surprising 51 percent of Republican
identifiers said yes (as did 88 percent of Democrats, 74 percent of independents, and 71
percent overall).33 Yet this sentiment did not appear to motivate a balancing vote; in the
same survey, 93 percent of the Republicans reported they would vote for the Republican
House candidate, only 3 percent for the Democrat, if the election were being held that
day. Proponents of the balancing hypothesis acknowledge that “only a small subset of
voters decide by strategic balancing based on policy considerations” but argue that this
subset is large enough to account for the national swings that constitute the referendum
(Bufumi, Erikson, and Wliezen 2010, 707). Polarized partisanship has probably rendered
the subset even smaller than when they envisioned it, however. A balancing referendum
would surely produce a Democratic takeover of at least the House, so the theory is about
to undergo an incisive test.
30 For public opinion data on these issues, see pollingreport.com. 31 Majorities support tariffs on China but no on American allies in Canada and Europe; most oppose the tariffs on steel and think they will hurt American industries; for public opinion data on these issues, see pollingreport.com. 32 In the fourteen surveys taken during the first half of 2018 that asked about it, an average of 39 percent approved of the legislation, 47 percent disapproved; see www.pollingreport.com/budget.htm. 33 See https://poll.qu.edu/national/release-detail?ReleaseID=2553, accessed July 2, 2018.
23
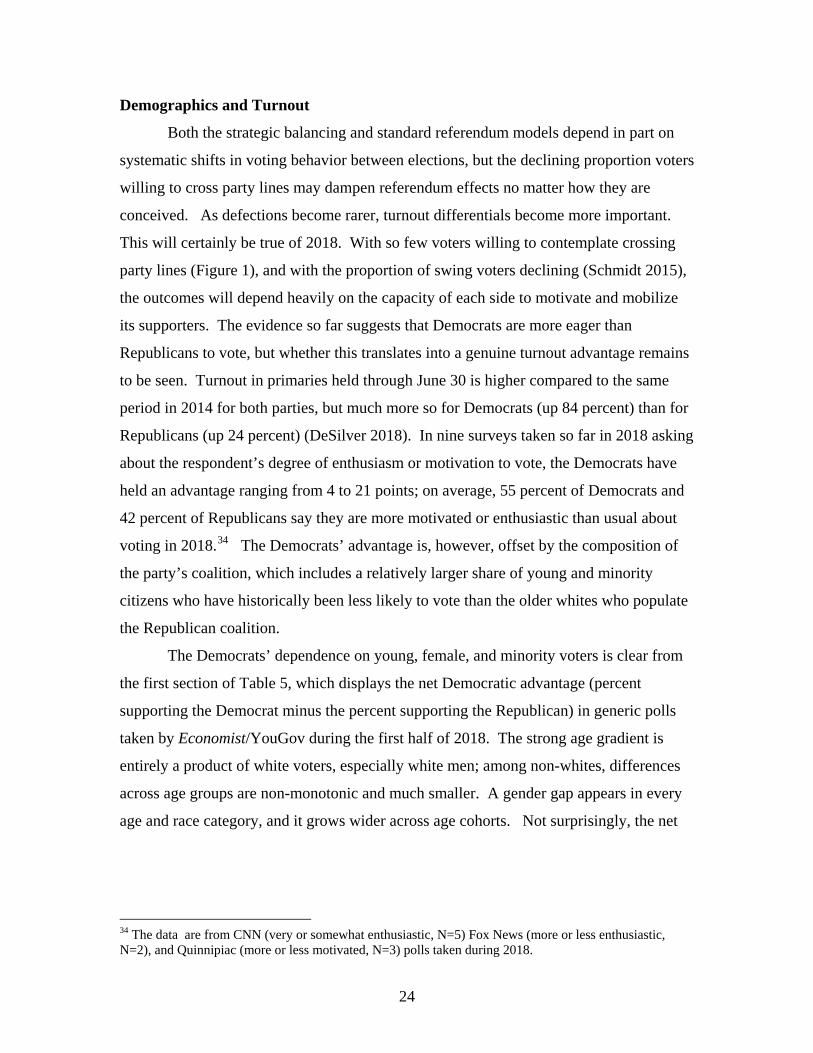
Demographics and Turnout
Both the strategic balancing and standard referendum models depend in part on
systematic shifts in voting behavior between elections, but the declining proportion voters
willing to cross party lines may dampen referendum effects no matter how they are
conceived. As defections become rarer, turnout differentials become more important.
This will certainly be true of 2018. With so few voters willing to contemplate crossing
party lines (Figure 1), and with the proportion of swing voters declining (Schmidt 2015),
the outcomes will depend heavily on the capacity of each side to motivate and mobilize
its supporters. The evidence so far suggests that Democrats are more eager than
Republicans to vote, but whether this translates into a genuine turnout advantage remains
to be seen. Turnout in primaries held through June 30 is higher compared to the same
period in 2014 for both parties, but much more so for Democrats (up 84 percent) than for
Republicans (up 24 percent) (DeSilver 2018). In nine surveys taken so far in 2018 asking
about the respondent’s degree of enthusiasm or motivation to vote, the Democrats have
held an advantage ranging from 4 to 21 points; on average, 55 percent of Democrats and
42 percent of Republicans say they are more motivated or enthusiastic than usual about
voting in 2018.34 The Democrats’ advantage is, however, offset by the composition of
the party’s coalition, which includes a relatively larger share of young and minority
citizens who have historically been less likely to vote than the older whites who populate
the Republican coalition.
The Democrats’ dependence on young, female, and minority voters is clear from
the first section of Table 5, which displays the net Democratic advantage (percent
supporting the Democrat minus the percent supporting the Republican) in generic polls
taken by Economist/YouGov during the first half of 2018. The strong age gradient is
entirely a product of white voters, especially white men; among non-whites, differences
across age groups are non-monotonic and much smaller. A gender gap appears in every
age and race category, and it grows wider across age cohorts. Not surprisingly, the net
34 The data are from CNN (very or somewhat enthusiastic, N=5) Fox News (more or less enthusiastic, N=2), and Quinnipiac (more or less motivated, N=3) polls taken during 2018.
24

voting intentions among the 16 combinations of age, race, and gender map almost
perfectly onto net opinions of Trump’ performance.35
Table 5 Midterm Generic Vote 2018, by Age, Race and Gender (Percent) ________________________________________________________________________________ Under 30 30-44 45-64 65+ All A. Democratic Margin All 27 21 2 -12 5.5
Men 22 17 -8 -24 -2.4 Women 31 24 11 -2 12.6
White 18 8 -13 -21 -8.0 Men 15 6 -23 -33 -15.6 Women 22 10 -3 -11 -1.0
Non White 38 45 42 38 41.6 Men 33 39 35 26 34.3 Women 43 51 49 47 47.8
B. Registered, with a Vote Choice White 36 47 62 76 58.0 Non White 27 38 56 77 43.8 __________________________________________________________________________ Source: 24 Economist/YouGov polls, January-August 2018 (N=46,500, including 39,627 registered voters)
Democrats have an overall lead in these polls of about 5.5 percentage points, but
the lead would be much larger were it not for the much lower projected participation—
defined here as reporting to be registered and expressing a vote preference for one of the
major party candidates—among Democratic-leaning demographic groups (Section B of
Table 5). Young and non-white voters have much lower projected participation rates
than older and white voters. The Democrats’ capacity to turn out voters from
demographic groups with historically low participation rates will be crucial to their
prospects of taking over one or both chambers, and doing so will require countering
stepped-up voter suppression efforts targeting these groups in many Republican states
(Michaelson 2017).
35 Net disapproval of Trump in the 16 cells correlates with net Democratic vote preference at .97.
25

The Republican’s Structural Advantage
In all generic polls combined for 2018 through mid August, Democrats had an
average lead of 7.3 percentage points. This puts them in much better shape than they had
been in previous midterms in this century other than 2006, as is evident in Figure 5,
which shows smoothed trends in the Democrats’ share of major party preferences in
generic polls over the two years leading up to each midterm election. The patterns from
previous elections show that the generic vote can change during the final three months of
the campaign, so nothing is cut in stone at this point. But based on past patterns,
Figure 5 Generic Midterm Ballots, 2002-2018
30
35
40
45
50
55
60
65
70
-600 -540 -480 -420 -360 -300 -240 -180 -120 -60 0
Days from Election
Pe
rce
nt
Dem
oc
rati
c
2002 2006 2010 2014 2018
Democrats will need a national vote margin at least as large as they have at this point to
overcome their severe structural disadvantage, which stems from the concentration of
their regular voters in urban areas, which “wastes” a disproportionate share their votes in
very safe districts (Jacobson and Carson 2016). Their problem is illustrated by the
distribution of 2016 presidential vote across House districts. Hillary Clinton won 2.86
million more votes than Trump, but Trump won the most votes in 228 districts, Clinton,
in 207 districts. There are currently 219 districts where Trump ran at least 2 percentage
points ahead of his national share, only 186 where Clinton ran more than 2 points ahead
of her national share; the 30 remaining districts fall in between. This means that if
26
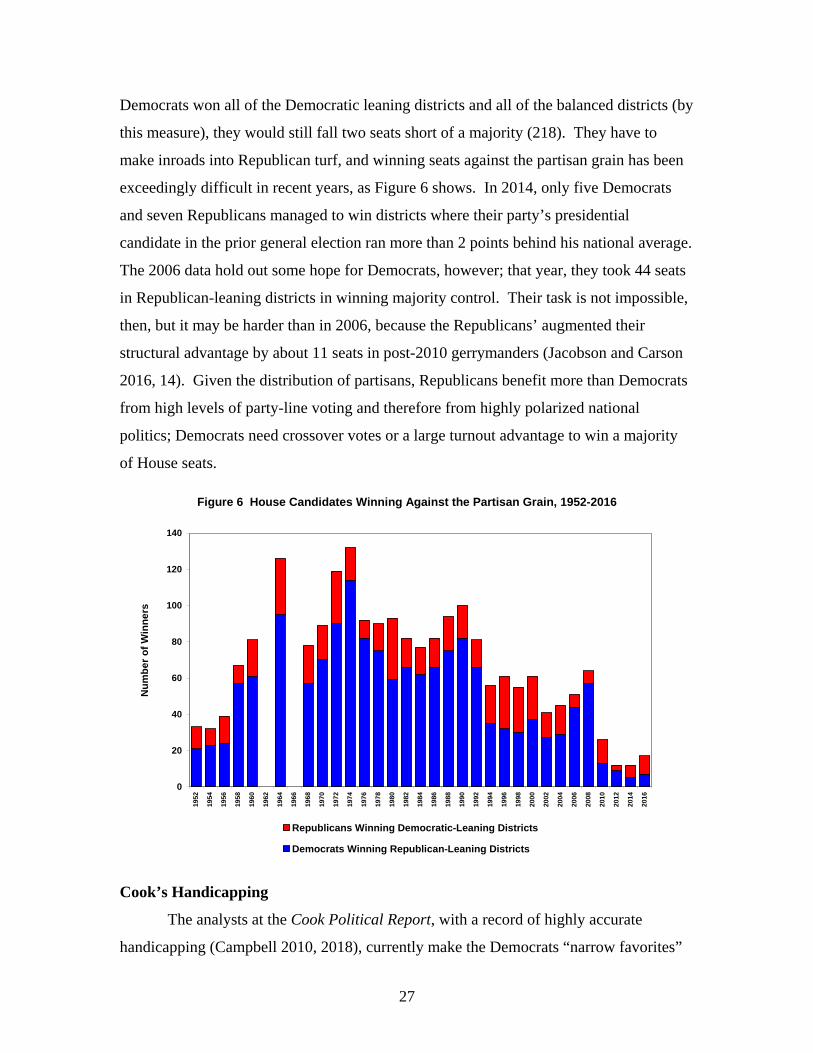
Democrats won all of the Democratic leaning districts and all of the balanced districts (by
this measure), they would still fall two seats short of a majority (218). They have to
make inroads into Republican turf, and winning seats against the partisan grain has been
exceedingly difficult in recent years, as Figure 6 shows. In 2014, only five Democrats
and seven Republicans managed to win districts where their party’s presidential
candidate in the prior general election ran more than 2 points behind his national average.
The 2006 data hold out some hope for Democrats, however; that year, they took 44 seats
in Republican-leaning districts in winning majority control. Their task is not impossible,
then, but it may be harder than in 2006, because the Republicans’ augmented their
structural advantage by about 11 seats in post-2010 gerrymanders (Jacobson and Carson
2016, 14). Given the distribution of partisans, Republicans benefit more than Democrats
from high levels of party-line voting and therefore from highly polarized national
politics; Democrats need crossover votes or a large turnout advantage to win a majority
of House seats.
Figure 6 House Candidates Winning Against the Partisan Grain, 1952-2016
0
20
40
60
80
100
120
140
1952
1954
1956
1958
1960
1962
1964
1966
1968
1970
1972
1974
1976
1978
1980
1982
1984
1986
1988
1990
1992
1994
1996
1998
2000
2002
2004
2006
2008
2010
2012
2014
2016
Nu
mb
er
of
Win
ne
rs
Republicans Winning Democratic-Leaning Districts
Democrats Winning Republican-Leaning Districts
Cook’s Handicapping
The analysts at the Cook Political Report, with a record of highly accurate
handicapping (Campbell 2010, 2018), currently make the Democrats “narrow favorites”
27

to win a House majority based largely on the “intensity gap” (Wasserman 2018b), but the
Cook data make it clear that Democrats will have to win the lion’s share of the most
competitive districts to succeed. If Democrats win all of the districts where Cook deems
their party favored (202), they have to win 16 of the 29 seats listed as tossup (or, failing
that, additional “leaning Republican” districts) to reach a majority (Table 6). This is
certainly possible, and the number of Republican seats rated in play (lean Republican or
greater risk) has been growing over the election year, from 39 in January to 63 in August,
while the number of Democratic seats in play dropped from 11 to five. According to
James Cambell’s (2018) “seats in trouble” model, based on Cook data going back to
1984, the net difference in the parties’ seats rated toss up or worse in August of the
election year predicts a 34 seat gain for the Democrats.36 The Democrats’ chances of
winning two net seats they would need for a Senate majority are much bleaker. Of the 35
Senate seats contested in 2018, Democrats hold 26, 10 of them in states won by Trump in
2016, five with more than 59 percent of the major party vote.37 Republicans are
defending only nine seats and only one in a state won by Clinton (Nevada). With the
greater number of seats at risk, Democrats would do well to avoid net losses, and only a
Table 6. Cook Political Report Ratings, August 2018 _____________________________________________________________________________________ Solid D Likely D Lean D Tossup Lean R Likely R Solid R House: Total 181 12 9 29 25 26 153 Current Party:
Republican 3 7 27 26 24 153 Democrat 181 9 2 2 1
Senate: Total 14 6 1 8 1 2 3 Current Party:
Republican 3 1 2 3 Democrat 14 6 1 5
_____________________________________________________________________________________ Source: Cook Political Report, August 17, at https://www.cookpolitical.com/.
36 Using the party difference in seats rated leaning or worse, Campbell’s estimate is a 58-seat Democratic gain. 37 Included with the Democrats are the two independents who vote to organize with them, Bernie Sanders (VT) and Angus King (ME), both considered safe.
28

blue wave considerably larger than the one currently in prospect could give them control
of the Senate.38
IV. Implications
The forces shaping the 2018 midterm elections are largely in place, although
events between now and the election will continue to tweak them and bear the potential
for more dramatic changes. The hearings over Trump’s nomination of Brett Kavanaugh,
an expected vote to overturn Roe v. Wade, to replace the retiring justice Arthur Kennedy
on the Supreme Court, will put the abortion issue will be front and center, mobilizing
important factions of both parties. Donald Trump’s penchant for inciting controversy,
exemplified by his widely-condemned deference to Putin and implicit denigration of U.S.
intelligence agencies during the press conference following their private meeting in
Helsinki in July, is another wild card. Ordinary Republicans backed Trump’s handling of
the Helsinki summit, but with a bit less unity than usual.39 It would be no surprise if
Trumps words or actions provoked fresh controversies that, while not necessarily shaking
his core supporters, eroded his standing among other Republicans and independents. And
of course looming over all is Mueller’s dogged and meticulous investigation of Trump’s
and his campaign’s possible collusion with Russia during the 2016 campaign. The
biggest surprise between now (mid August) and the election might be no surprise.
Although both the current state of play and possible shocks leave the outcome of
the 2018 midterm election very much in doubt, its potential consequences are not.
However it goes, the election will have profound effects on both the short- and long-term
evolution of American politics. If the Democrats win control of the House, it will be
read, accurately, as a clear repudiation of Trump’s presidency, for they can only do by
winning large enough majority of votes cast nationwide to overcome the Republican’s
formidable structural advantage.40 It will put Democrats in a position to challenge,
38 Wasserman (2018c) provides a cogent geographical analysis of why the party prospects differ so much between chambers. 39 In the July 17-18 CBS News poll, 68 percent of Republicans approved of his handling of the summit, while 21 percent disapproved (among Democrats, 8 percent approved, 83 percent disapproved; the comparable figures for independents were 29 percent and 53 percent). 40 If, against expectations, they win the Senate as well, the repudiation will be overwhelming.
29

check, and investigate the Trump administration for at least the next two years,
precipitating disputes between Congress and the White House at least as fierce as during
the Obama presidency after 2010. It will also shake the grip Trump has on the (public)
loyalties of those Republicans who remain in Congress by pegging him as a liability, a
leader so offensive to most Americans that even the best economy in at least a decade
could not preserve their majority. And it will encourage those Republican leaders and
conservative intellectuals who have resisted Trump’s takeover of their party to persevere.
If, on the other hand, Republicans retain their majorities (even if, as is most likely
in the case, they lose the national vote), it will confirm once and for all that the
Republican Party is now Trump’s party. Congressional Republicans will read it as
confirmation of their strategy of tolerating Trump’s outré behavior in furtherance of their
party’s conservative agenda and, out of respect for the power of his supporters, they will
continue to ignore, downplay, or excuse behavior that by a Democratic president would
provoke torrents of outrage and demands for impeachment. Insofar as this outcome is
attributable to Trump’s success in whipping up xenophobic fears about immigrants,
appealing to white nationalist sentiments, and rallying Christian conservatives behind a
Supreme Court nominee expected to overturn Roe, it will advance the party makeover
sought by Trump’s erstwhile advisor Steve Bannon, who envisions a white populist
Republican Party devoted to cultural conservatism, patriarchy, economic nationalism,
anti-Muslim and anti-immigrant xenophobia, and dismantling the regulatory state
(Thorsson 2017).
To the degree that Trump and his allies adopt and promote this vision, it seems a
sure recipe for splitting and shrinking the Republican Party in the long run. Even a
partial adoption bears risks, because the elements of Trump’s agenda in accord with it are
almost uniformly unpopular outside the Republican core of older white voters. This
includes reducing legal immigration, restricting family reunification, and building a wall
on the Mexican border41; exiting NAFTA and disengaging from the global economy42;
41 See the polling results reported at http://www.pollingreport.com/immigration.htm; large majorities reject Trump’s rationales for these policies; in the February 2-5, 2018 Quinnipiac Poll, only 17 percent agreed that undocumented immigrants committed more crimes than natives, while 72 percent disagreed; in the September 15-18, 2017 Monmouth University Poll, 23 percent said they took jobs from citizens, 56 percent said they did not. 42 See the polling results reported at http://www.pollingreport.com/trade.htm.
30

scrapping regulations designed to protect consumers and the environment43; “America
First” isolationism44; and adopting the conservative Christian wish list (overturning Roe
v. Wade, curbing LBGTQ rights, and defunding Planned Parenthood).45 The long-term
danger to a Republican Party defined by this set of broadly unpopular objectives and
commitments is aggravated by the fact that they are least popular among younger
Americans.46 Some of these policies and goals are also unpopular among prominent
Republican leaders and conservative pundits, a few of whom have already formally
abandoned the party and called for a Democratic victory in 2018, among them George
Will, Max Boot, Joe Scarborough, and Peter Wehner. Their numbers will probably grow
if that effort fails and the party is seen as irretrievably Trump’s. Boot posed the question
to Republican conservatives this way: “You used to belong to a conservative party with a
white-nationalist fringe. Now it’s a white-nationalist party with a conservative fringe. If
you’re part of that fringe, what should you do?” (Boot 2018). His advice: bail. Trump
loyalists would no doubt cheer the departures of his establishment critics, but building a
political coalition by subtraction is usually ill-advised. Among other things, then, the
future of the Republican Party is at stake in 2018.
So is the future of the Democratic Party. A victory would show the potency of an
anti-Trump coalition, but putting that coalition to work in Congress will be a daunting
task. United against Trump, the party is divided on how it should address the voters who
supported him, what policies it should pursue or emphasize, and who should lead it. A
failure to retake the House would only intensify these divisions. In the long run, though,
Democrats will be favored by demographics as Trump’s older, white supporters shrink as
a share of the population and his extreme unpopularity among young and minority voters
43 Trump’s withdrawal from the Paris climate accords was supported by no more than a third of the public in any of the five major polls that posed the question, and the idea of removing “specific regulations intended to combat climate change” was even less popular (28 percent vs. 65 percent in the May,9, 2017 Quinnipiac Poll); see http://www.pollingreport.com/enviro.htm. 44 See http://news.gallup.com/poll/116350/Position-World.aspx. 45 See the polling results for 2017-2018 reported at http://www.pollingreport.com/lgbt.htm and http://www.pollingreport.com/abortion.htm. 46For example, only 36 percent of the public wants to encourage the use of coal despite its environmental costs, but among people under 30, the share falls to 23 percent (Quinnipiac Poll, March 30-April 3, 2017, at https://poll.qu.edu/national/release-detail?ReleaseID=2449); the comparable numbers for defunding Planned Parenthood are 35 percent and 23 percent, respectively (Quinnipiac Poll, June 20-27, 2017 at https://poll.qu.edu/national/release-detail?ReleaseID=2470); Only 33 percent say NAFTA has been bad for the United States; among the under 30s, its 15 percent (Tyson 2017).
31

leaves the Democrats as their only real option (Jacobson 2018). Although imaginable
with Republicans in control of all three branches of government, a reactionary project to
undo advances in civil rights of racial and sexual minorities, women’s rights,
environmental protection, labor rights, and health care, carried out against the preferences
of majorities of citizens, is unlikely to succeed in the long run, but it will certainly make
for some ferocious political battles in the mean time.
Whatever the 2018 election achieves, it will not diminish Trump’s polarizing
effect on the citizenry. Partisan Democrats who see Trump as an incompetent, mean-
spirited, lying, ignorant, racist, misogynist, authoritarian narcissist pursuing policies
threatening national and global health and welfare find it hard to resist feeling contempt
for Trump supporters simply for being such: How could any sentient being not be
appalled by what they see? Trump’s Republican supporters, in return, view his detractors
as elitist liberal snobs, sore losers who disdain as “deplorables” hard-working, God-
fearing, patriotic Americans like them, people who appreciate a pugnacious president
who promises to put America first and who will at least try to reverse the economic and
social trends that have frayed their communities and made them feel like losers. As long
as Trump is on the scene the nation is bound to remain deeply divided, and to the extent
that he reshapes the Republican Party in his white nationalist image, these divisions will
deepen further and every election, like the 2018 midterm, will be fought with both sides
convinced that nothing less than the future of American democracy is at stake.
References
Abramowitz, Alan I. 2010. The Disappearing Center: Engaged Citizens, Polarization, and American Democracy. New Haven: Yale University Press.
Abramowitz, Alan I., and Steven Webster. 2016. “The Rise of Negative Partisanship and the Nationalization of U.S. House Elections.” Electoral Studies 41(1):12-22.
Abrams, Samuel J., and Morris P. Fiorina. 2015. “Party Sorting: The Foundation of Polarized Politics.” In American Gridlock: The Sources, Character, and Impact of Polarization, eds. James A. Thurber and Antoine Yoshinaka, 113-129. New York: Cambridge University Press.
Alesina, Albert, and Howard Rosenthal. 1995. Partisan Politics, Divided Government, and the Economy. New York: Cambridge University Press.
Alesina, Alberto, and Howard Rosenthal. 1989. “Partisan Cycles in Congressional Elections and the Macroeconomy.” American Political Science Review 83 (2): 373–398.
Atkins, David. 2018. “Trump is a Simple-Minded Bully Who Only Knows One Tactic.” Washington Monthly, March 17.
32

Bafumi, Joseph, Robert S. Erikson, and Christopher Wlezien. 2010. “Balancing, Generic Polls, and Midterm Congressional Elections.” Journal of Politics 72(3):705-19.
Bartels, Larry M. 2002. “Beyond the Running Tally: Partisan Bias in Political Perceptions.” Political Behavior 24(1):117-150.
Bishop, Bill. 2008. The Big Sort: Why the Clustering of Like-Minded America Is Tearing Us Apart. New York: Houghton Mifflin.
Boot, Max. 2018. “These Long Time Republicans Have Left the GOP.” Washington Post, July 4.
Bump, Philip. 2017. “Trump Can Usually Make It about a Third of the Way Through an Interview Without Mentioning Hillary Clinton.” Washington Post, July 21.
Campbell, James E. 2010. “The Accuracy of the Cook Report’s Pre-Labor Day Ratings of Elections to the U.S. House of Representatives.” Manuscript, SUNY Buffalo, August 24.
Campbell, James E. 2016. Polarized: Making Sense of a Divide America. Princeton: Princeton University Press.
Campbell, James E. 2018. “The Seats-in-Trouble Forecasts of the 2018 Midterm Congressional Elections.” PS: Political Science and Politics, forthcoming.
DeSilver, Drew. 2018. Turnout in this year’s U.S. House Primaries is Up, Especially on the Democratic Side.” Pew Research Center Report, July 27.
Erikson, Robert S. 1990. “Economic Conditions and the Congressional Vote: A Review of the Macrolevel Evidence.” American Journal of Political Science 34(2):373-399).
Fiorina, Morris P. 2003. Divided Government, 2nd ed. New York: Longman.
Fiorina, Morris P., Samuel J. Adams, and Jeremy C. Pope. 2006. Culture War? The Myth of a Polarized America. New York: Longman.
Fiorina, Morris P., with Samuel Adams. 2009. Disconnect: The Breakdown of Representation in American Politics. Norman, OK: University of Oklahoma Press.
Goeres, Kelsey. 2018. “Which President Takes More Vacation Days, Barack Obama or Donald Trump?” Cheatsheet, April 23, at https://www.cheatsheet.com/culture/which-president-takes-more-vacation-days-barack-obama-or-donald-trump.html/.
Griffiths, Brent D. 2018. “Trump: ‘We Cannot Allow All of These People to Invade Our Country.’” Politico, June 24.
Haberman, Maggie, Glenn Thrush, and Peter Baker. 2017. “Inside Trump’s Hour-by-Hour Struggle for Self-Preservation.” New York Times, December 9.
Hauslohner, Abigail. 2018. “Hate Crimes Jump for Fourth Straight Year in Largest U.S. Cities, Study Shows.” Washington Post, May 11.
Hohmann, James. 2018. “Mark Sanford’s Primary Loss Shows the Peril of Crossing Trump.” Washington Post, June 13.
Iyengar, Shanto, and Sean J. Westwood. 2015. “Fear and Loathing Across Party Lines: New Evidence on Group Polarization.” American Journal of Political Science 59(3):690-707.
Jacobson, Gary C. 1989. “Strategic Politicians and the Dynamics of House Elections, 1946-86,” American Political Science Review 83 (3):773-93.
Jacobson, Gary C. 2000. “Party Polarization in National Politics: The Electoral Connection,” Polarized Politics: Congress and the President in a Partisan Era, ed. Jon R. Bond and Richard Fleisher. Washington, D.C.: Congressional Quarterly Press, 2000, pp. 9-30.
Jacobson, Gary C. 2012. “The Electoral Origins of Polarized Politics: Evidence from the 2010 Cooperative Congressional Election Study.” American Behavioral Scientist 56(4):1612-1630.
33

Jacobson, Gary C. 2015. “Obama and Nationalized Electoral Politics in the 2014 Midterm,” Political Science Quarterly 130 (Spring 2015):1-26.
Jacobson, Gary C. 2017a. “The Triumph of Polarized Partisanship: Donald Trump’s Improbable Victory in 2016.” Political Science Quarterly 132 (1): 1-34.
Jacobson, Gary C. 2017b “Donald Trump, the Public, and Congress: The First Seven Months.” The Forum 15:3 (October):525-545.
Jacobson, Gary C. 2018. “The Effects of the Early Trump Presidency on Public Attitudes toward the Republican Party. “ Presidential Studies Quarterly (September): 1-32.
Jacobson, Gary C. 2019. Presidents and Parties in the Public Mind. University of Chicago Press.
Jacobson, Gary C., and Jamie L. Carson. 2016. The Politics of Congressional Elections. 9th ed. New York: Rowman & Littlefield.
Jacobson, Gary C., and Samuel Kernell. 1983. Strategy and Choice in Congressional Elections. New Haven: Yale University Press.
Jaffe, Greg, Mary Jordan, and Josh Dawsey. 2018. “Trump’s Tough Words for Merkel and May Raise Questions about his Relationships with Female Leaders.” Washington Post, July 13.
Kessler, Glenn, Salvador Rizzo, and Meg Kelly. 2018. “President Trump has Made 4,229 False and Misleading Claims in 558 Days.” Washington Post, August 1.
Knight Foundation. 2018. “American Views: Trust, Media and Democracy.” Report, January 15, at https://knightfoundation.org/reports/american-views-trust-media-and-democracy.
Kunda, Ziva. 1990. “The Case for Motivated Reasoning.” Psychological Bulletin 108 (3):480-498.
Levendusky, Matthew. 2009. The Partisan Sort: How Liberals Became Democrats and Conservatives Became Republicans. Chicago: University of Chicago Press.
Lodge, Milton, and Charles S. Taber. 2013. The Rationalizing Voter. New York: Cambridge University Press.
Malbin, Michael J. 2018. “Is a Wave Rolling for House Democrats? Potentially Competitive Districts and Candidates Build Strength.” Brookings, February 26, at https://www.brookings.edu/blog/fixgov/2018/02/26/is-a-wave-rolling-in-for-house-democrats/.
Mascaro, Lisa, and Noah Bierman. 2017. “Sen. Bob Corker is Saying What Other Republicans Will Only Whisper about President Trump.” Los Angeles Times, October 9,
McCarty, Nolan, Keith T. Poole, and Howard Rosenthal. 2006. Polarized American: The Dance of Ideology and Unequal Riches. Cambridge, MA: MIT Press.
Mebane, Walter R. Jr. 2000. “Coordination, Moderation, and Institutional Balancing in American Presidential and House Elections.” American Political Science Review 94(1):37-57.
Michaelson, Jay. 2017. “GOP Voter Suppression Is the Country’s Greatest Scandal.” Daily Beast, November 8, at https://www.thedailybeast.com/gop-voter-suppression-is-the-countrys-greatest-scandal.
Newport, Frank, and Andrew Dugan. 2018. “Partisan Differences Growing on a Number of Issues.” Gallup Report, August 3..
O’Brien, Timothy. 2018. “Trump’s Race-Baiting has Infested the GOP.” Bloomberg, June 25, at https://www.bloomberg.com/view/articles/2018-06-25/huckabee-tweet-shows-trump-s-race-baiting-has-infested-the-gop.
Oppenheimer, Andres. 2018. “Immigrant Families Don’t ‘Infest” America—but Trump’s Racist Rhetoric Does.” Miami Herald, June 23.
Pew Research Center. 2014. “Political Polarization in the American Public.” Research Report, June 12.
34

Pew Research Center. 2016. “Partisanship and Political Animosity in 2016.” Research Report, June 22.
Pew Research Center. 2017. “The Partisan Divide on Political Values Grows Even Wider.” Research Report, October 5.
Pew Research Center. 2018a. “Voters More Focused on Control of Congress—and the President—Than in Past Midterms.” Research Report, June 20.
Pew Research Center. 2018b “As Midterms Near, Democrats are More Politically Active than Republicans.” Research Report, August 16.
Putnam, Lara and Theda Skocpol. 2018. “Middle America Reboots Democracy.” Democracy: A Journal of Ideas, August 20, at https://democracyjournal.org/arguments/middle-america-reboots-democracy/.
Ray, Julie. 2018. “World’s Approval of U.S. Leadership Drops to New Low.” Gallup Report, January 18.
Roberts, James M. 2018. “A Trade War with China is Not in America’s Interest.” Heritage Foundation, May 28, at https://www.heritage.org/trade/commentary/trade-war-china-not-americas-interest.
Rubin, Jennifer. 2018. “Trump’s Racist Views Have Not Gone Unnoticed.” Washington Post, July 5.
Saad, Lydia. 2018. “Trump Approval Lower Than U.S. Mood Might Predict.” Gallup Report, January 16.
Schallhorn, Kaitlyn. 2018. “Trump vs. Clinton: The Feud Continues Even After the Election. Fox News, March 5 at http://www.foxnews.com/politics/2018/03/05/trump-vs-clinton-feud-continues-even-after-election.html.
Scheve, Kenneth, and Michael Tomz. 1999. “Electoral Surprise and the Midterm Loss in U.S. Congressional Elections.” British Journal of Political Science 29(3):507-21.
Schmidt., Corwin. 2017. “Polarization and the Decline of the American Floating Voter.” American Journal of Political Science 61 (4): 365-381.
Schneider, Elena. 2017. “Democrats’ Early Money Haul Stuns GOP.” Politico, October 23, at https://www.politico.com/story/2017/10/23/2018-fundraising-democrats-house-races-244044.
Shea, Daniel M. 2013. “Our Tribal Nature and the Rise of Nasty Politics.” Can We Talk? The Rise of Rude, Nasty, Stubborn Politics, ed., Daniel Shea and Morris Fiorina. New York: Pearson, pp. 82–98.
Sides, John, Michael Tesler, and Lynn Vavreck. 2018. Identity Crisis: The 2016 Campaign and the Battle for the Meaning of America. Princeton University Press.
Stonecash, Jeffrey M., Mark D. Brewer, and Mack D. Mariani. 2003. Diverging Parties: Social Change, Realignment, and Party Polarization. Boulder CO: Westview Press.
Theriault, Sean. 2008. Party Polarization in Congress. New York: Cambridge University Press
Thorsson, John. 2017. “The Essentials of Bannonism.” Eat, Pray, Vote, October 21, at https://www.eatprayvote.org/2017/10/21/the-essential-tenets-of-bannonism/.
Tufte, Edward R. 1975. “Determinants of the Outcomes of Midterm Congressional Elections.” American Political Science Review 69 (3):812-826.
Wasserman, David. 2018a. “ New FEC Data Points to Severe Risk for House GOP.” Cook Political Report, July 18,
Wasserman, David. 2018b. “July House Overview: Democrats Remain Slight Favorites for a Majority.” Cook Political Report, July 10.
Wasserman, David. 2018c . “Why Even Blue Wave Could Have Limited Gains.” New York Times, August 20.
35

Wright, David. 2018. “Democratic House Candidates Dominate Second Quarter Fundraising.” CNN, July 17, at https://www.cnn.com/2018/07/17/politics/house-candidates-second-quarter-fundraising-totals/index.html.
36

Appendix
Table A1. Opinions of Trump’s Character and Attitudes All Rep. Ind. Dem. 1. Do you think that President Trump is a good role model for children, or not? (6/5/18)
Yes 27 63 21 4 No 69 30 74 95
2. Do you think that President Trump provides the United States with moral leadership, or not? (1/23/18)
Yes 33 80 30 3 No 63 16 67 96
3. Do you believe that Donald Trump is more honest than most of the previous presidents, less honest than most previous presidents, or that Donald Trump is just about as honest as most previous presidents? 93/16/18)
More honest 27 57 23 5 Less honest 44 7 42 82 Just about as honest 26 34 33 11
4. Do you think that President Trump works harder than most of the previous presidents, works less hard than most previous presidents, or do you think he works about as hard as most previous presidents? (1/16/18)
Works harder 25 57 22 4 Works less hard 50 10 49 84 About as hard 21 30 26 8
5. Do you think President Trump is racist, or don't you think so? (7/1/18)
Yes 49 11 50 86 No 47 86 44 10
6. Do you think that President Trump treats people of color with the same amount of respect as he treats white people, or don't you think so? (8/13/18)
Yes 39 83 33 7 No 54 11 56 89
7. Do you approve or disapprove of the way Donald Trump is handling race relations? (6/5/18)
Approve 33 74 27 4 Disapprove 61 16 68 93
8. Do you think that President Trump treats women with the same amount of respect as he treats men, or don't you think so? (4/9/18)
Yes 32 67 29 3 No 60 22 60 95
9. As you may know, the definition of an autocrat is a ruler with absolute power. Do you think that President Trump behaves more like an autocrat or do you think President Trump behaves more like a typical U.S. president? (2/19/18)
Autocrat 56 9 58 88 Typical president 36 76 35 7
Source: Quinnipiac Polls (last day of survey is in parentheses)
37
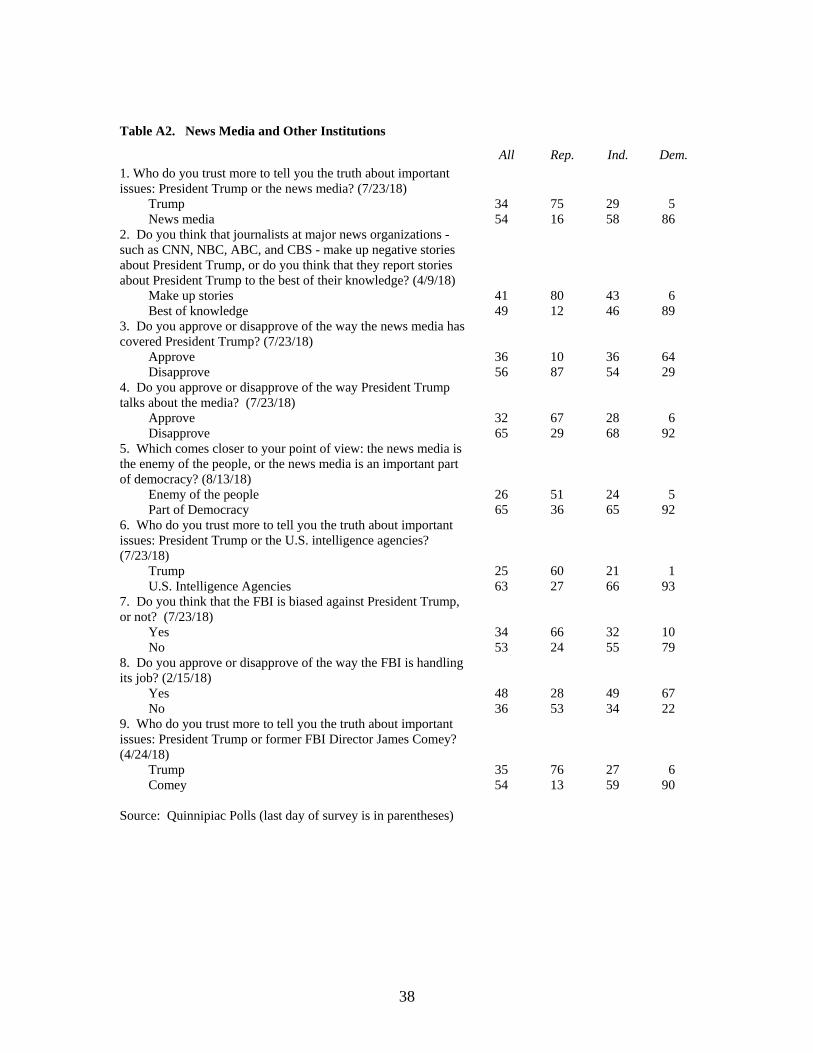
Table A2. News Media and Other Institutions
All Rep. Ind. Dem. 1. Who do you trust more to tell you the truth about important issues: President Trump or the news media? (7/23/18)
Trump 34 75 29 5 News media 54 16 58 86
2. Do you think that journalists at major news organizations - such as CNN, NBC, ABC, and CBS - make up negative stories about President Trump, or do you think that they report stories about President Trump to the best of their knowledge? (4/9/18)
Make up stories 41 80 43 6 Best of knowledge 49 12 46 89
3. Do you approve or disapprove of the way the news media has covered President Trump? (7/23/18)
Approve 36 10 36 64 Disapprove 56 87 54 29
4. Do you approve or disapprove of the way President Trump talks about the media? (7/23/18)
Approve 32 67 28 6 Disapprove 65 29 68 92
5. Which comes closer to your point of view: the news media is the enemy of the people, or the news media is an important part of democracy? (8/13/18)
Enemy of the people 26 51 24 5 Part of Democracy 65 36 65 92
6. Who do you trust more to tell you the truth about important issues: President Trump or the U.S. intelligence agencies? (7/23/18)
Trump 25 60 21 1 U.S. Intelligence Agencies 63 27 66 93
7. Do you think that the FBI is biased against President Trump, or not? (7/23/18)
Yes 34 66 32 10 No 53 24 55 79
8. Do you approve or disapprove of the way the FBI is handling its job? (2/15/18)
Yes 48 28 49 67 No 36 53 34 22
9. Who do you trust more to tell you the truth about important issues: President Trump or former FBI Director James Comey? (4/24/18)
Trump 35 76 27 6 Comey 54 13 59 90
Source: Quinnipiac Polls (last day of survey is in parentheses)
38
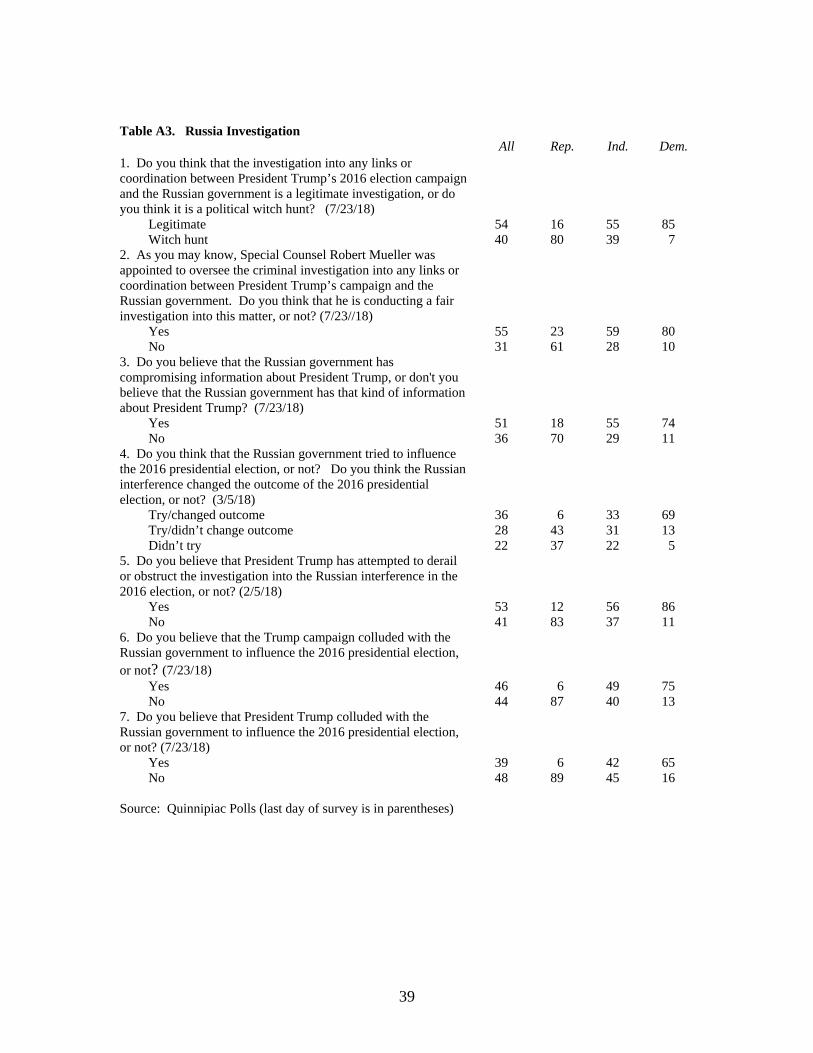
Table A3. Russia Investigation All Rep. Ind. Dem. 1. Do you think that the investigation into any links or coordination between President Trump’s 2016 election campaign and the Russian government is a legitimate investigation, or do you think it is a political witch hunt? (7/23/18)
Legitimate 54 16 55 85 Witch hunt 40 80 39 7
2. As you may know, Special Counsel Robert Mueller was appointed to oversee the criminal investigation into any links or coordination between President Trump’s campaign and the Russian government. Do you think that he is conducting a fair investigation into this matter, or not? (7/23//18)
Yes 55 23 59 80 No 31 61 28 10
3. Do you believe that the Russian government has compromising information about President Trump, or don't you believe that the Russian government has that kind of information about President Trump? (7/23/18)
Yes 51 18 55 74 No 36 70 29 11
4. Do you think that the Russian government tried to influence the 2016 presidential election, or not? Do you think the Russian interference changed the outcome of the 2016 presidential election, or not? (3/5/18)
Try/changed outcome 36 6 33 69 Try/didn’t change outcome 28 43 31 13 Didn’t try 22 37 22 5
5. Do you believe that President Trump has attempted to derail or obstruct the investigation into the Russian interference in the 2016 election, or not? (2/5/18)
Yes 53 12 56 86 No 41 83 37 11
6. Do you believe that the Trump campaign colluded with the Russian government to influence the 2016 presidential election, or not? (7/23/18)
Yes 46 6 49 75 No 44 87 40 13
7. Do you believe that President Trump colluded with the Russian government to influence the 2016 presidential election, or not? (7/23/18)
Yes 39 6 42 65 No 48 89 45 16
Source: Quinnipiac Polls (last day of survey is in parentheses)
39

40
Table A4. Effects All Rep. Ind. Dem. Do you feel that Donald Trump is doing more to unite the country as president, or doing more to divide the country as president? (7/1/18)
Unite 36 75 33 3 Divide 58 18 61 96
Do you think that President Trump has strengthened the United States' position as the leader of the free world, weakened the United States' position, or do you think that President Trump has had no impact on the United States' position as the leader of the free world? (7/1/18)
Strengthened 40 80 37 8 Weakened 47 8 48 83 No Impact 11 10 14 7
Do you think that President Trump has improved the United States' reputation around the world or damaged the United States' reputation around the world? (3/16/18)
Improved 34 75 30 1 Damaged 57 15 57 96 Neither 4 3 8 1
As you may know, President Trump has said that a trade war would be good for the United States, and could be easily won. Do you agree or disagree with this statement? (3/5/18)
Agree 28 67 19 7 Disagree 64 23 71 90
Source: Quinnipiac Polls (last day of survey is in parentheses)