Embed Size (px)
DESCRIPTION
Â
Citation preview

SouthBayMarket Insight
2014_June
market insight

Manhattan Beach Manhattan Beach Manhattan Beach 917 Manhattan Beach Blvd. 3300 Highland Avenue 916 Manhattan Avenue 310.545.8401 310.546.7661 310.549.5000
www.Shorewood.com
Hermosa Beach Redondo Beach El Segundo Palos Verdes Estates 950 Artesia Blvd. 1009 Torrance Blvd. 431 Main Street 16 Malaga Cove Plaza 310.376.8871 310.516.8464 310.522.4900 310.698.1555

InsIght guIdanceDesigned to give you a quick, complete overview of both current and past market conditions, this South Bay Market Insight report covers Manhattan Beach, Hermosa Beach, Redondo Beach, El Segundo, Torrance, Hawthorne, Gardena, Lawndale and Lomita.
First, we examine Year Over Year statistics, compiled from carefully collected sales data. Percent change—which was calculated by subtracting past value from current value, and dividing that product by past value—gives you a quick snapshot of how each micro-market has improved or worsened over the past year for that particular metric.
Next, the Yearly Median Price graph tracks the median price of properties for each month over the past year. The median price is not the same as average price; it is the price of the property that falls in the middle of the total number of properties for sale in that particular micro-market.
Finally, the Key Stats section illustrates Median Sales Price, Average Sales Price of Closed Sales, Listings for Sale, Listings Under Contract, and Properties Sold.
On the next page you will find an explanation of how each value was determined.

MEDIAN PRICE:Not to be confused with Average Price, Median Price is the price of the property that falls in the middle of the total number of properties for sale in that particular micro-market. Extremely high and extremely low prices do not affect the median the way they do the average.
AVERAGE PRICE PER SQUARE FOOT:Found by taking the price of each property and dividing that by its square footage, then finding the average for all properties sold in the area that month.
PROPERTIES SOLD:The number of properties that closed escrow and changed ownership during the month.
PROPERTIES UNDER CONTRACT:The number of properties that are in escrow.
PROPERTIES FOR SALE:The number of properties that are for sale on the market.
DAYS ON MARKET (CLOSED SALES):The average number of days that properties were on the market, from date of initial listing to date they entered escrow.
MONTHS SUPPLY OF INVENTORY:The number of months it would take for all the current homes for sale in that micro-market to sell if no new listings
were added. This is calculated by dividing the total number of homes for sale in a particular month by the number of homes that sold in that month. Four to five months’ supply is average. A smaller number means there are more buyers than sellers; a larger number means more sellers than buyers.
ABSORPTION RATE (CLOSED SALES):This is the rate at which properties sell. It is found by taking the number of properties sold and dividing it by the total number of properties for sale. This measures the inverse of Monthly Supply of Inventory and represents how much of the current active listings (as a percentage) are being absorbed (sold or pended) each month. The Absorption Rate is presented as a percentage (%) of the current inventory.
PERCENT UNDER CONTRACT:The ratio of properties for sale to properties pending sale.
AVERAGE MEDIAN PRICE:The Average Median Price for the Last 12 Months is sales data from 12 months ending in the identified month
LEGALAll reports are published July 2014, based on data available at the end of June 2014. All reports presented are based on data supplied by the CARETS. Neither the Association nor its MLS guarantees or is in anyway responsible for its accuracy. Data maintained by the Association or its MLS may not reflect all real estate activities in the market. Information deemed reliable but not guaranteed.

Year Over Year June 2013 June 2014 % Change
June 2013 to June 2014 Yearly Median Price Tracking (in $,000)
Median Price $1,610,000 $1,890,000 17%
Average Price Per Sq. Foot $688 $805 17%
Properties Sold 41 43 5%
Properties Pending Sales 44 42 -5%
Properties for Sale 72 61 -15%
Days on Market (Sold Homes) 34 37 9%
Monthly Supply of Inventory 1.8 1.4 -22%
Absorption Rate (closed sales) 56.9% 70.5% 24%
Manhattan Beach
13-Jun 13-Jul 13-Aug 13-Sep 13-Oct 11/13 13-Dec 14-Jan 14-Feb 14-Mar 14-Apr 14-May 14-Jun
$1,610 $1,540 $1,685 $1,705
$1,520
$1,987
$1,395
$2,152 $1,953
$1,717 $1,850
$1,995 $1,890
13-Jun 13-Jul 13-Aug 13-Sep 13-Oct 11/13 13-Dec 14-Jan 14-Feb 14-Mar 14-Apr 14-May 14-Jun
$1,610 $1,540 $1,685 $1,705
$1,520
$1,987
$1,395
$2,152 $1,953
$1,717 $1,850
$1,995 $1,890
13-Jun 13-Jul 13-Aug 13-Sep 13-Oct 11/13 13-Dec 14-Jan 14-Feb 14-Mar 14-Apr 14-May 14-Jun
$1,610 $1,540 $1,685 $1,705
$1,520
$1,987
$1,395
$2,152 $1,953
$1,717 $1,850
$1,995 $1,890

Key June Stats
Median Sales Price*
Average Sales Price (Closed)*
Listings for Sale
Under Contract
Sold
market insight
*12 month average
$1,916,580
$2,206,170
61
42
43
Active, 61
Pending, 42
Sold, 43

Year Over Year June 2013 June 2014 % Change
June 2013 to June 2014 Yearly Median Price Tracking (in $,000)
Median Price $1,250,000 $1,113,000 -11%
Average Price Per Sq. Foot $608 $705 16%
Properties Sold 19 22 16%
Properties Pending Sales 31 22 -29%
Properties for Sale 37 37 --
Days on Market (Sold Homes) 94 39 -59%
Monthly Supply of Inventory 1.9 1.7 -11%
Absorption Rate (closed sales) 51.4% 59.5% 16%
herMosa Beach
13-Jun 13-Jul 13-Aug 13-Sep 13-Oct 11/13 13-Dec 14-Jan 14-Feb 14-Mar 14-Apr 14-May 14-Jun
$1,250 $1,160 $1,208
$1,065
$1,300
$1,114 $1,023
$878
$1,345
$1,101
$1,460
$1,230 $1,113

Key June Stats
Median Sales Price*
Average Sales Price (Closed)*
Listings for Sale
Under Contract
Sold
market insight
*12 month average
$1,270,580
$1,471,080
37
22
22
Active, 37
Pending, 22
Sold, 22

Year Over Year June 2013 June 2014 % Change
June 2013 to June 2014 Yearly Median Price Tracking (in $,000)
Median Price $795,000 $818,000 3%
Average Price Per Sq. Foot $457 $466 2%
Properties Sold 103 81 -21%
Properties Pending Sales 103 94 -9%
Properties for Sale 93 137 47%
Days on Market (Sold Homes) 37 52 41%
Monthly Supply of Inventory 0.9 1.7 89%
Absorption Rate (closed sales) 110.8% 59.1% -47%
redondo Beach
13-Jun 13-Jul 13-Aug 13-Sep 13-Oct 11/13 13-Dec 14-Jan 14-Feb 14-Mar 14-Apr 14-May 14-Jun
$795
$778
$795
$763
$750
$715
$780 $770
$756
$788
$730 $719
$818

Key June Stats
Median Sales Price*
Average Sales Price (Closed)*
Listings for Sale
Under Contract
Sold
market insight
*12 month average
$829,750
$888,580
137
94
81
Active, 137
Pending, 94
Sold, 81
Year Over Year June 2013 June 2014 % Change
June 2013 to June 2014 Yearly Median Price Tracking (in $,000)
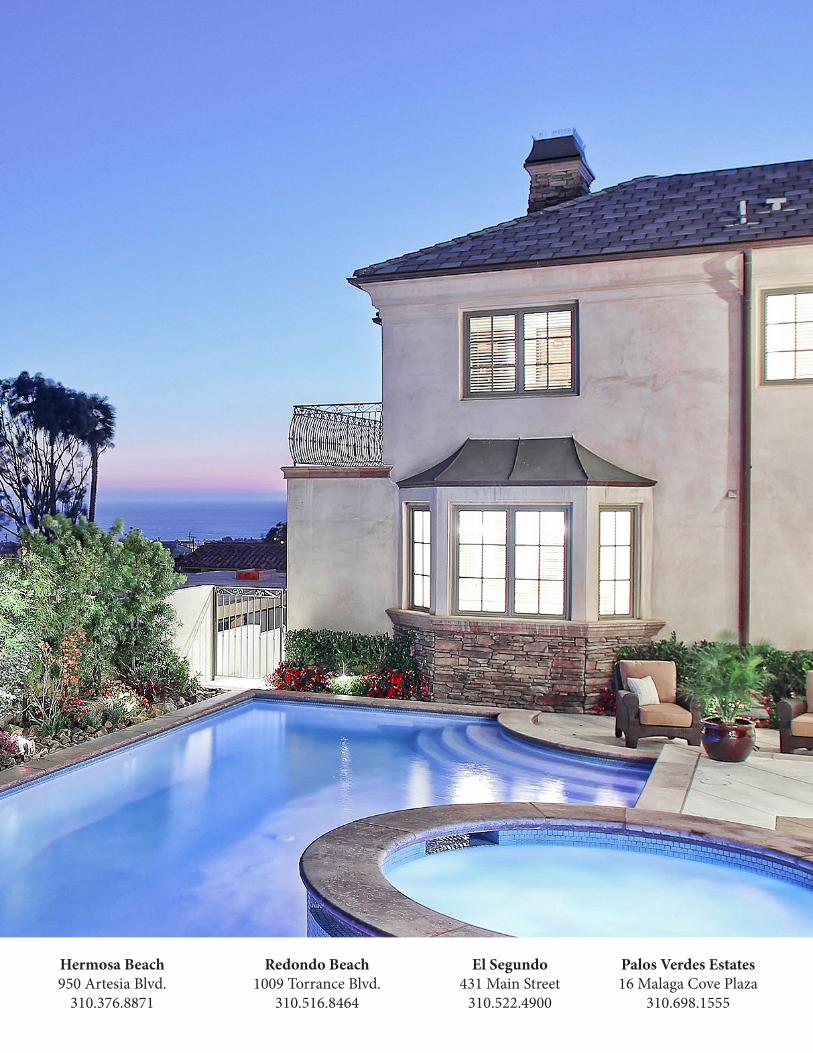
Median Price $775,000 $694,000 -10%
Average Price Per Sq. Foot $395 $486 23%
Properties Sold 17 12 -29%
Properties Pending Sales 12 9 -25%
Properties for Sale 16 22 38%
Days on Market (Sold Homes) 40 61 53%
Monthly Supply of Inventory 0.9 1.8 100%
Absorption Rate (closed sales) 106.3% 54.5% -49%
el segundo
13-Jun 13-Jul 13-Aug 13-Sep 13-Oct 11/13 13-Dec 14-Jan 14-Feb 14-Mar 14-Apr 14-May 14-Jun
$775 $773 $719
$755 $803
$719 $743 $800
$854
$723
$845
$775
$694

Key June Stats
Median Sales Price*
Average Sales Price (Closed)*
Listings for Sale
Under Contract
Sold
market insight
*12 month average
$831,500
$845,920
22
9
12
Active 22
Pending 9
Sold 12

Year Over Year June 2013 June 2014 % Change
June 2013 to June 2014 Yearly Median Price Tracking (in $,000)
Median Price $562,000 $574,000 2%
Average Price Per Sq. Foot $382 $406 6%
Properties Sold 108 88 -19%
Properties Pending Sales 111 123 11%
Properties for Sale 145 227 57%
Days on Market (Sold Homes) 39 41 5%
Monthly Supply of Inventory 1.3 2.6 100%
Absorption Rate (closed sales) 74.5% 38.8% -48%
torrance
13-Jun 13-Jul 13-Aug 13-Sep 13-Oct 11/13 13-Dec 14-Jan 14-Feb 14-Mar 14-Apr 14-May 14-Jun
$562
$608
$551 $539
$550
$515
$555
$523 $512
$545
$530
$550
$574

Key June Stats
Median Sales Price*
Average Sales Price (Closed)*
Listings for Sale
Under Contract
Sold
market insight
*12 month average
$592,830
$619,330
227
123
88
Active 227
Pending 123
Sold 88

Year Over Year June 2013 June 2014 % Change
June 2013 to June 2014 Yearly Median Price Tracking (in $,000)
Median Price $395,000 $465,000 18%
Average Price Per Sq. Foot $306 $361 18%
Properties Sold 38 29 -24%
Properties Pending Sales 31 38 23%
Properties for Sale 28 66 136%
Days on Market (Sold Homes) 58 62 7%
Monthly Supply of Inventory 0.7 2.3 229%
Absorption Rate (closed sales) 135.7% 43.9% -68%
hawthorne
13-Jun 13-Jul 13-Aug 13-Sep 13-Oct 11/13 13-Dec 14-Jan 14-Feb 14-Mar 14-Apr 14-May 14-Jun
$395 $372
$459 $445
$349
$428 $399
$459
$400
$444 $473
$435 $465

Key June Stats
Median Sales Price*
Average Sales Price (Closed)*
Listings for Sale
Under Contract
Sold
market insight
*12 month average
$460,250
$478,420
66
38
29
Active 66
Pending 38
Sold 29

Year Over Year June 2013 June 2014 % Change
June 2013 to June 2014 Yearly Median Price Tracking (in $,000)
Median Price $402,000 $415,000 3%
Average Price Per Sq. Foot $278 $274 -1%
Properties Sold 15 9 -40%
Properties Pending Sales 13 9 -31%
Properties for Sale 18 19 6%
Days on Market (Sold Homes) 41 65 59%
Monthly Supply of Inventory 1.2 2.1 75%
Absorption Rate (closed sales) 83.3% 47.4% -43%
lawndale
13-Jun 13-Jul 13-Aug 13-Sep 13-Oct 11/13 13-Dec 14-Jan 14-Feb 14-Mar 14-Apr 14-May 14-Jun
$402
$320
$365
$435
$388
$350 $365 $366
$422
$335
$395
$488
$415

Key June Stats
Median Sales Price*
Average Sales Price (Closed)*
Listings for Sale
Under Contract
Sold
market insight
*12 month average
$420,500
$412,750
19
9
9
Active 19
Pending 9
Sold 9

Year Over Year June 2013 June 2014 % Change
June 2013 to June 2014 Yearly Median Price Tracking (in $,000)
Median Price $423,000 $478,000 13%
Average Price Per Sq. Foot $309 $344 11%
Properties Sold 10 14 40%
Properties Pending Sales 10 8 -20%
Properties for Sale 10 34 240%
Days on Market (Sold Homes) 40 73 83%
Monthly Supply of Inventory 1 2.4 140%
Absorption Rate (closed sales) 100% 41.2% -59%
loMIta
13-Jun 13-Jul 13-Aug 13-Sep 13-Oct 11/13 13-Dec 14-Jan 14-Feb 14-Mar 14-Apr 14-May 14-Jun
$423
$479 $440 $430
$560
$430
$502
$400
$475 $447
$517
$381
$478

Key June Stats
Median Sales Price*
Average Sales Price (Closed)*
Listings for Sale
Under Contract
Sold
market insight
*12 month average
$496,830
$499,750
34
8
14
Active 34Pending 8
Sold 14

Year Over Year June 2013 June 2014 % Change
June 2013 to June 2014 Yearly Median Price Tracking (in $,000)
Median Price $358,000 $375,000 5%
Average Price Per Sq. Foot $276 $263 -5%
Properties Sold 39 28 -28%
Properties Pending Sales 34 41 21%
Properties for Sale 38 77 103%
Days on Market (Sold Homes) 49 45 -8%
Monthly Supply of Inventory 1 2.8 180%
Absorption Rate (closed sales) 102.6% 36.4% -65%
gardena
13-Jun 13-Jul 13-Aug 13-Sep 13-Oct 11/13 13-Dec 14-Jan 14-Feb 14-Mar 14-Apr 14-May 14-Jun
$358
$340
$354 $355 $360
$371
$356
$365
$375
$395
$382
$405
$375

Key June Stats
Median Sales Price*
Average Sales Price (Closed)*
Listings for Sale
Under Contract
Sold
market insight
*12 month average
$399,250
$393,330
77
41
28
Active 77
Pending 41
Sold 28


copyright 2014 Shorewood Realtors
Manhattan Beach917 Manhattan Beach Blvd.
310.545.8401
Manhattan Beach3300 Highland Avenue
310.546.7661
Manhattan Beach916 Manhattan Avenue
310.549.5000
Hermosa Beach950 Artesia Blvd.
310.376.8871
Redondo Beach1009 Torrance Blvd.
310.516.8464
El Segundo431 Main Street
310.522.4900
Palos Verdes Estates16 Malaga Cove Plaza
310.698.1555
www.Shorewood.com
market insight