Embed Size (px)
Citation preview
Tomographic Imaging of the Blind Test Dataset
Don Zhao
Geogiga Technology Corp.
SAGEEP 2011
Outline
Forward Modeling
Inversion Approach
Results
Comparison with Different Parameters
Conclusion
SAGEEP 2011
Outline
Forward Modeling
Inversion Approach
Results
Comparison with Different Parameters
Conclusion

SAGEEP 2011
Forward Modeling
Graph Method (Shortest Path): based on network theory to calculate the shortest
connections from a node to all other nodes in a network

SAGEEP 2011
Forward Modeling (Cont’d)
Advantages of Graph Method Robust to handle any complex velocity structure Complete convergence Accuracy is quadratically dependent upon the number of nodes and
order of forward star Calculate the seismic ray paths from a shot to all receivers
simultaneously A good implementation can be very efficient
Moser (1991)
SAGEEP 2011
Outline
Forward Modeling
Inversion Approach
Results
Comparison with Different Parameters
Conclusion
SAGEEP 2011
Inversion Approach
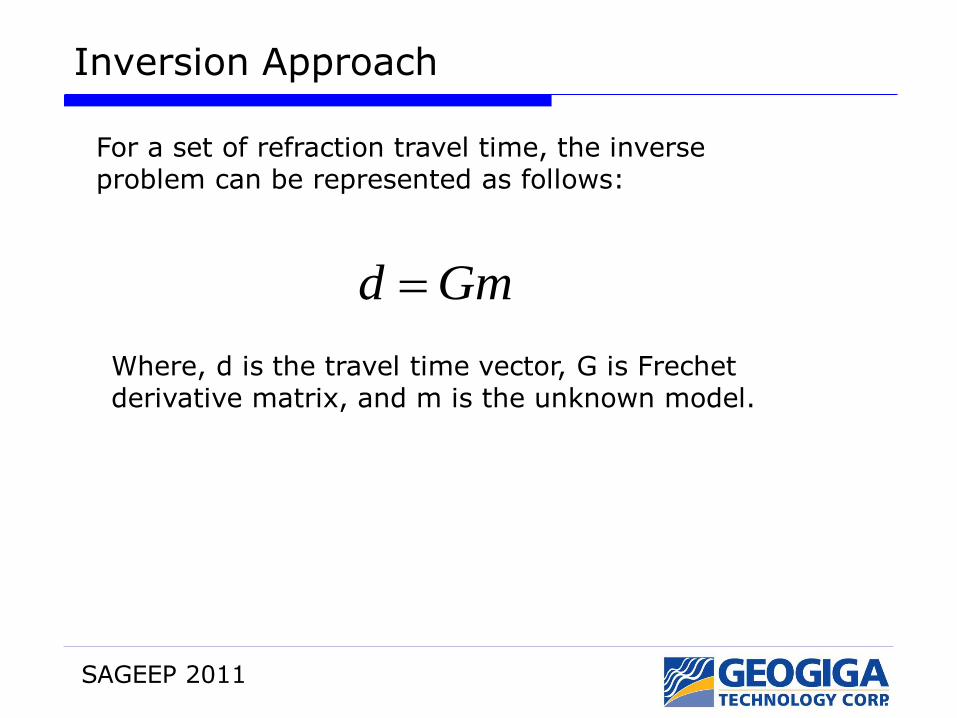
Gmd
For a set of refraction travel time, the inverse problem can be represented as follows:
Where, d is the travel time vector, G is Frechet derivative matrix, and m is the unknown model.
SAGEEP 2011
Inverse Approach (Cont’d)
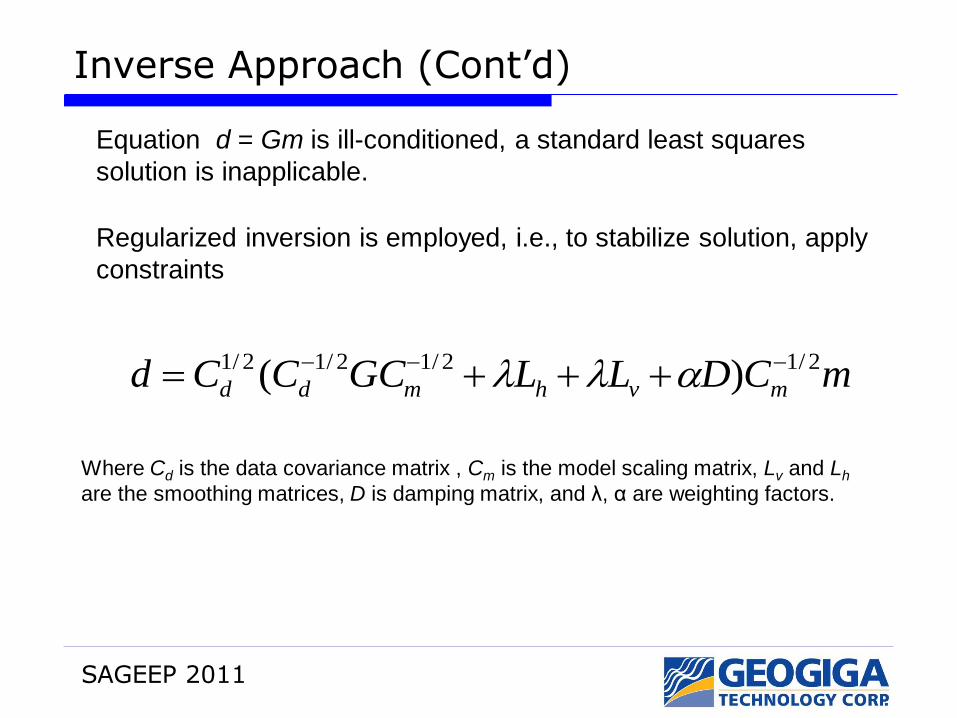
mCDLLGCCCd mvhmdd
2/12/12/12/1 )(
Regularized inversion is employed, i.e., to stabilize solution, apply
constraints
Equation d = Gm is ill-conditioned, a standard least squares
solution is inapplicable.
Where Cd is the data covariance matrix , Cm is the model scaling matrix, Lv and Lh
are the smoothing matrices, D is damping matrix, and λ, α are weighting factors.
SAGEEP 2011
Outline
Forward Modeling
Inversion Approach
Results
Comparison with Different Parameters
Conclusion
SAGEEP 2011
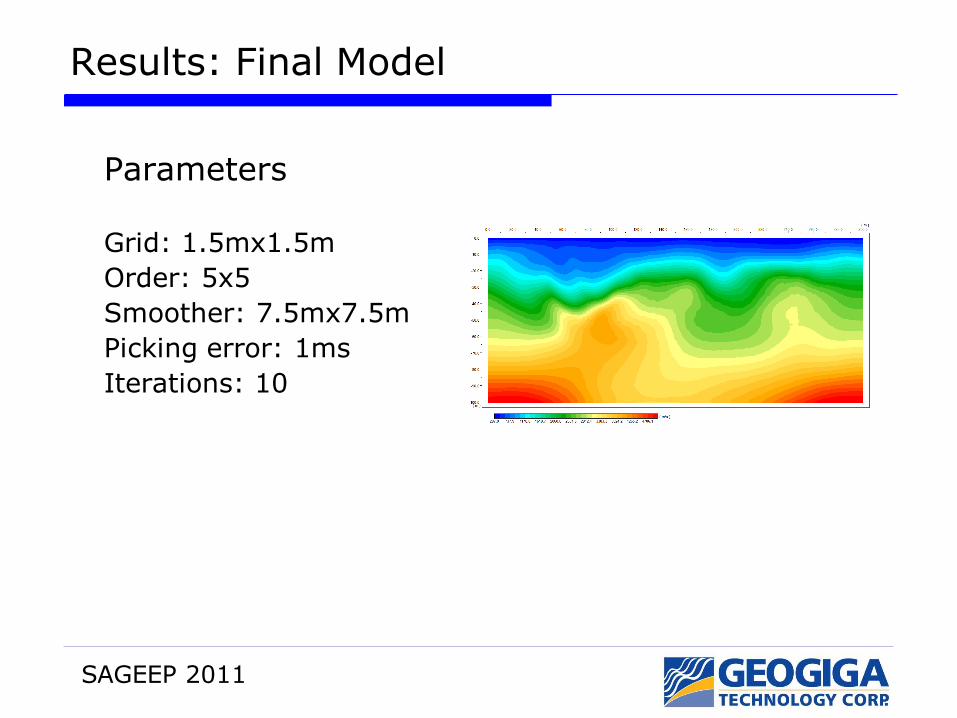
Results: Final Model
Parameters
Grid: 1.5mx1.5m
Order: 5x5
Smoother: 7.5mx7.5m
Picking error: 1ms
Iterations: 10
SAGEEP 2011
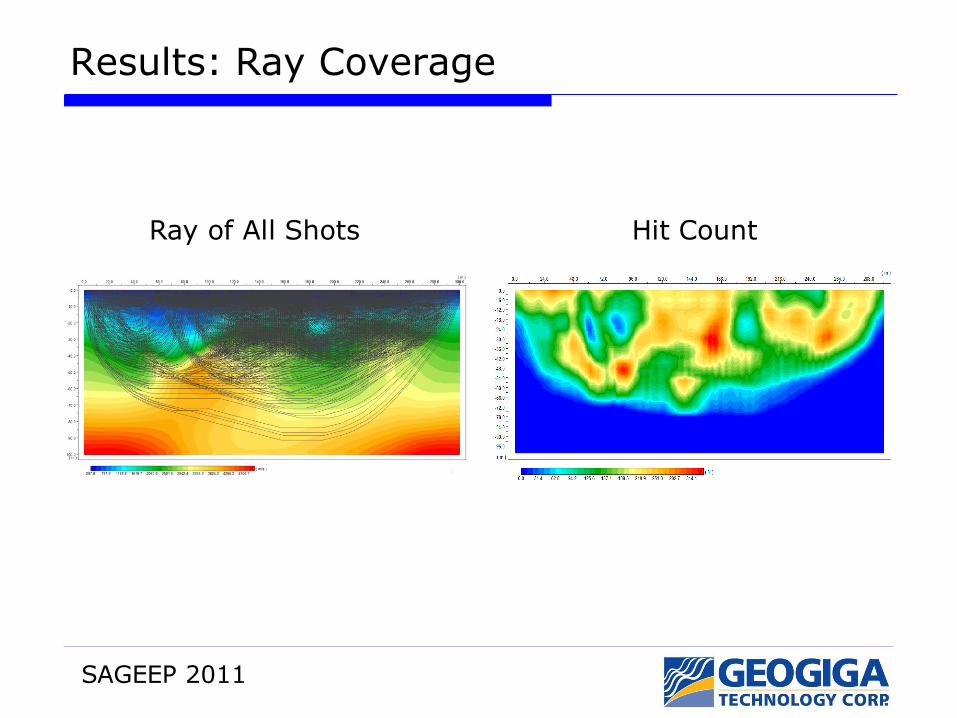
Results: Ray Coverage
Hit Count Ray of All Shots
SAGEEP 2011
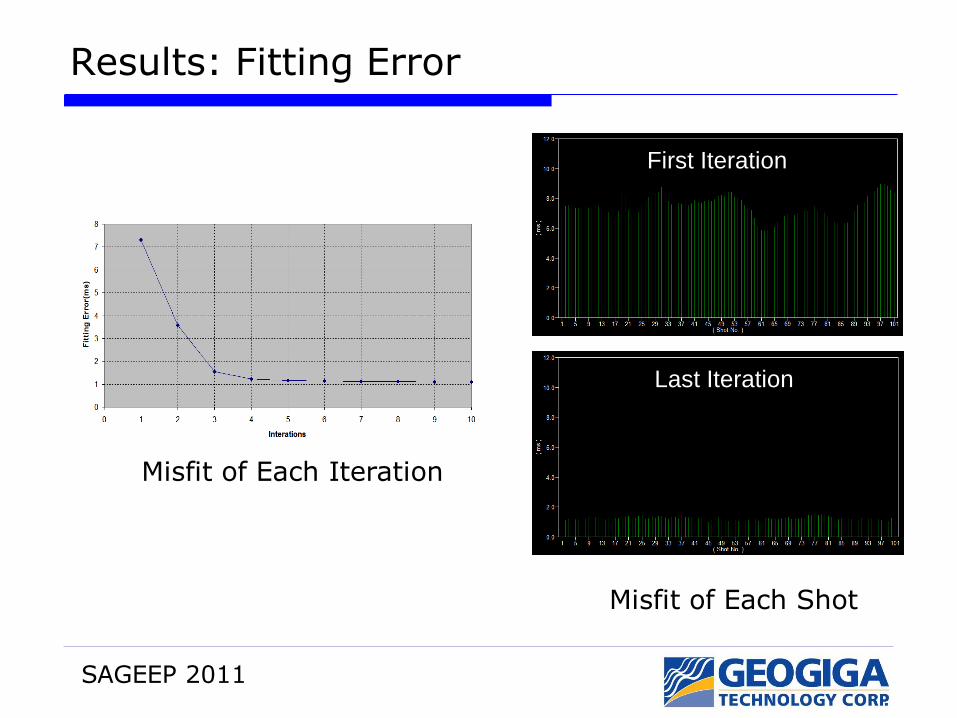
Results: Fitting Error
First Iteration
Last Iteration
Misfit of Each Shot
Misfit of Each Iteration
SAGEEP 2011
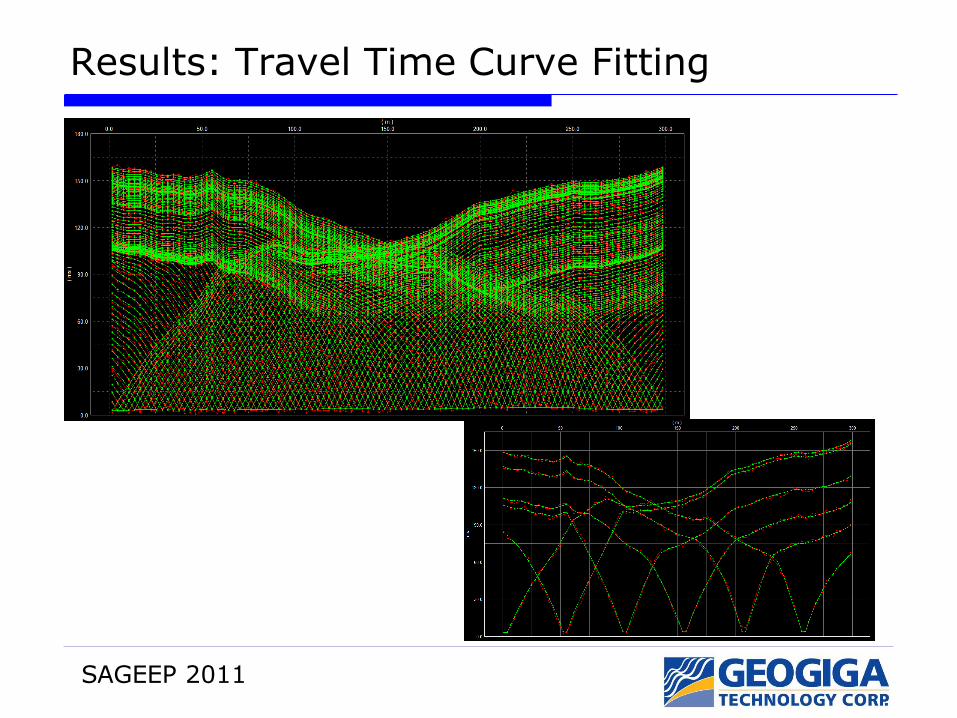
Results: Travel Time Curve Fitting
SAGEEP 2011
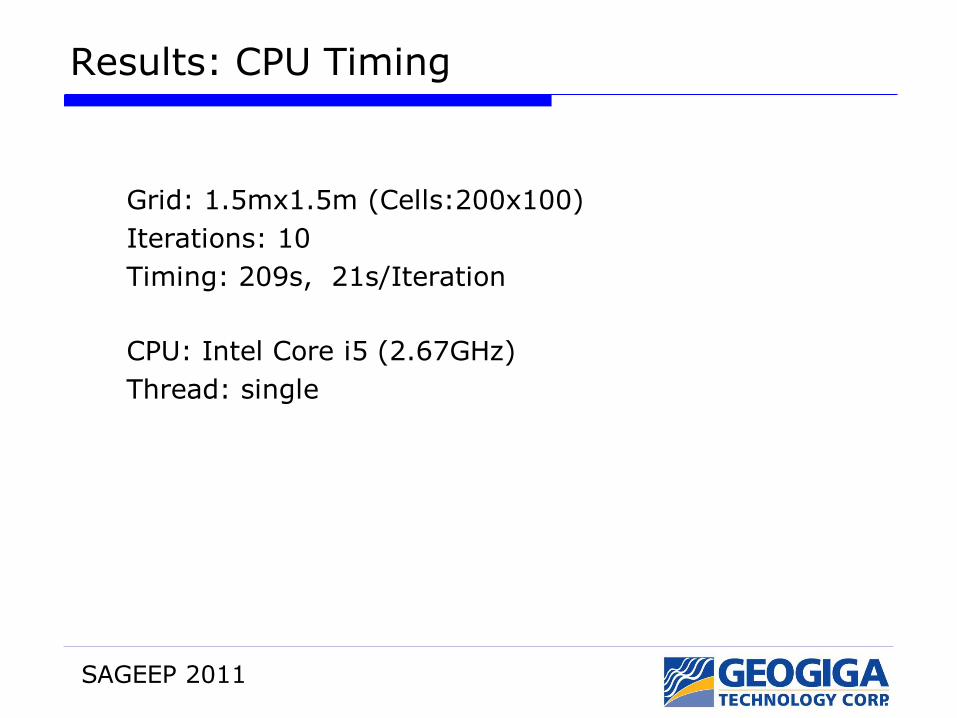
Results: CPU Timing
Grid: 1.5mx1.5m (Cells:200x100)
Iterations: 10
Timing: 209s, 21s/Iteration
CPU: Intel Core i5 (2.67GHz)
Thread: single
SAGEEP 2011
Outline
Forward Modeling
Inversion Approach
Results
Comparison with Different Parameters
Conclusion
SAGEEP 2011
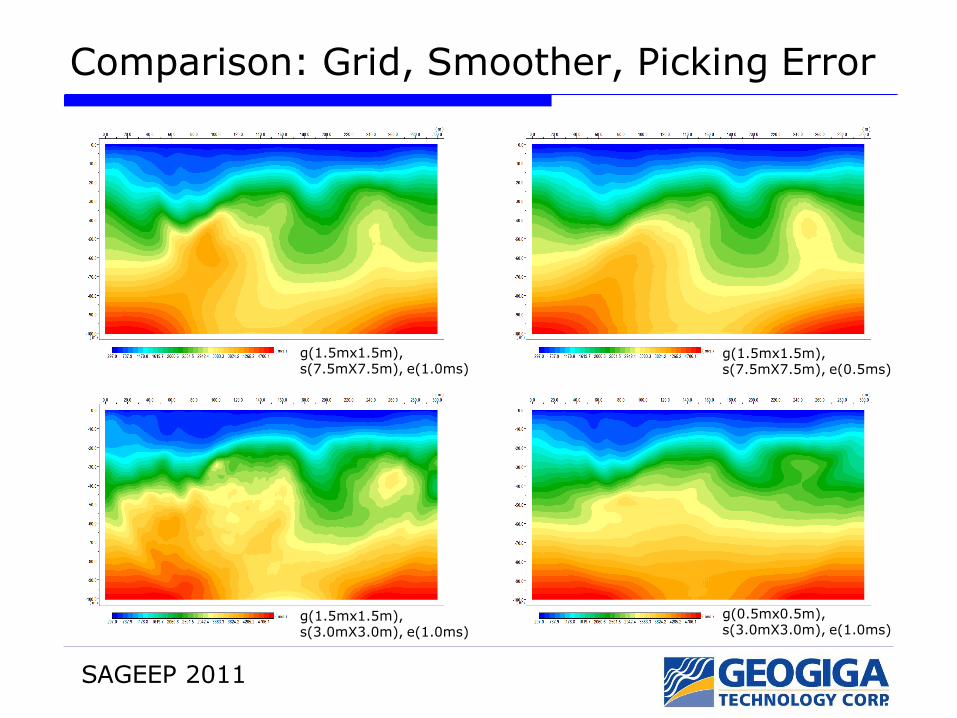
Comparison: Grid, Smoother, Picking Error
g(0.5mx0.5m), s(3.0mX3.0m), e(1.0ms)
g(1.5mx1.5m), s(3.0mX3.0m), e(1.0ms)
g(1.5mx1.5m), s(7.5mX7.5m), e(1.0ms)
g(1.5mx1.5m), s(7.5mX7.5m), e(0.5ms)
SAGEEP 2011
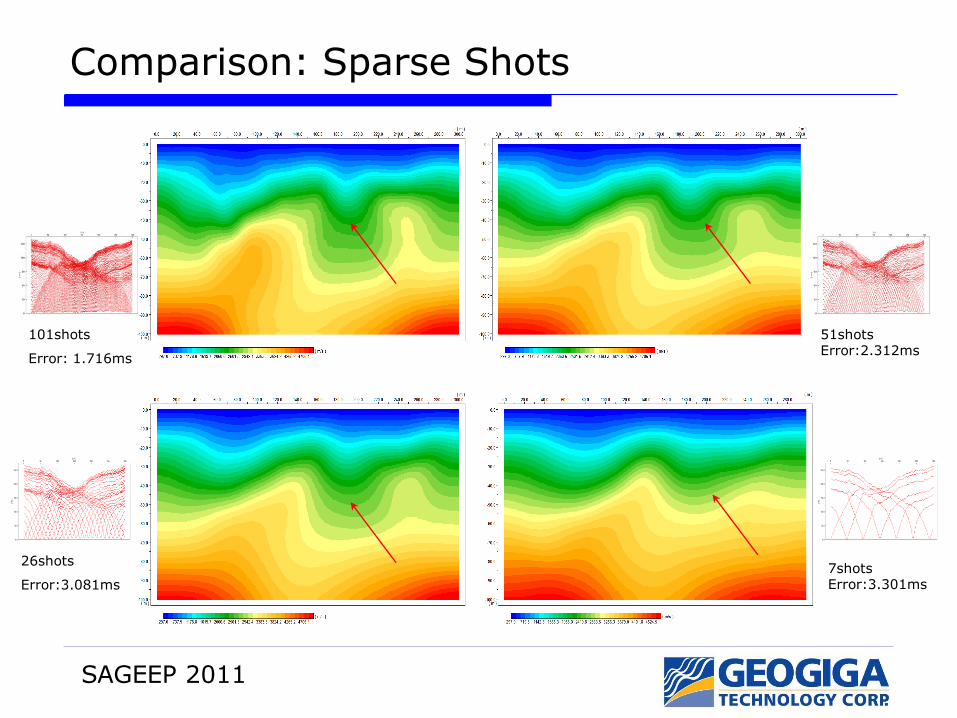
7shots Error:3.301ms
26shots
Error:3.081ms
51shots Error:2.312ms
101shots
Error: 1.716ms
Comparison: Sparse Shots
SAGEEP 2011
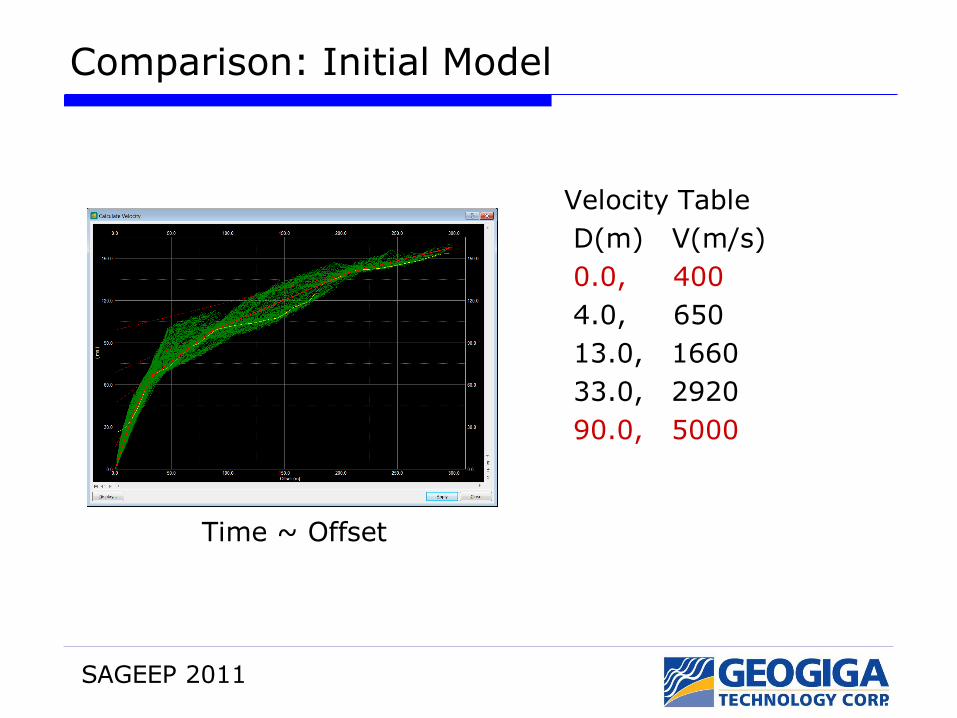
Comparison: Initial Model
Velocity Table
D(m) V(m/s)
0.0, 400
4.0, 650
13.0, 1660
33.0, 2920
90.0, 5000
Time ~ Offset
SAGEEP 2011
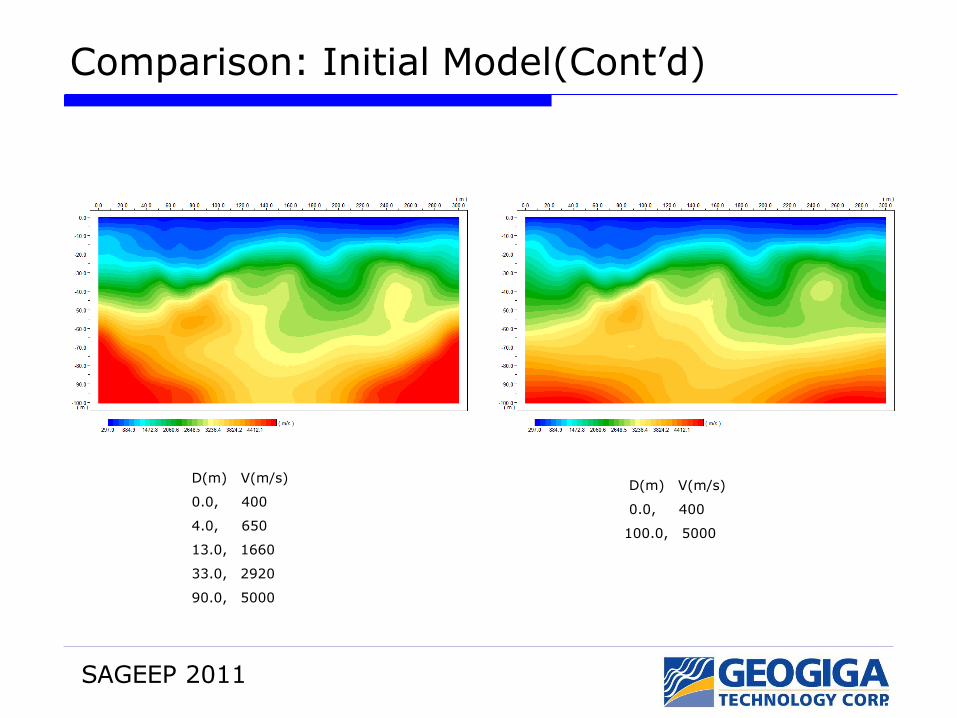
Comparison: Initial Model(Cont’d)
D(m) V(m/s)
0.0, 400
4.0, 650
13.0, 1660
33.0, 2920
90.0, 5000
D(m) V(m/s)
0.0, 400
100.0, 5000
SAGEEP 2011
Conclusion
Graph method has advantages for seismic ray tracing
Regularized approach provides lots of constraints to stabilize inversion
Due to non-uniqueness of tomography, results change with parameters, but most of them are comparable