Embed Size (px)
Citation preview

27/07/2018
1
Dominican Republic Air Transport Case Study
P/15 Agenda Item 8 SecretariatEighth Meeting of the North American, Central American and Caribbean Directors of Civil Aviation (NACC/DCA/08)Ottawa, Canada, 31 July to 2 August 2018
2
Introduction
Policy and Regulation
Safety Audit Results
Air Connectivity and the State of Air Transport
Economic Benefits and Job Contribution

27/07/2018
2
3
RO NACC and ATB to Conduct Case Study
4
Objectives of the Study
• Demonstrate that a country’s political will and commitment to establishingaviation as a national priority can drive economic development to the country
• Quantify the economic and social benefits from civil aviation to DominicanRepublic, using data and analysis of the past two decades
• Provide a more relevant and accurate representation of the “before” and“after” effects on the economies and sustainable developments of SmallDeveloping Island States (SIDS)

27/07/2018
3
Small Island Developing States (SIDS) consist of 38 maritime developing
countries, including Dominican Republic (and 20 non‐UN Members
and Associate Members) facing specific social, economic and environmental
vulnerabilities.
Small Island Developing States (SIDS)
• Small domestic markets with heavy dependence on foreign markets
• High costs for energy, infrastructure, transportation and communication
• Long distances from major trading and tourist-generating markets
• Low and irregular international traffic volumes
• Little resilience to natural disasters and fragile natural environments
5
6
Study Outline
I. Introduction
II. State of air transport
III. Connectivity
IV. Policy and regulation
V. Navigational scenarios in the Dominican Republic
VI. Safety audit results
VII. Direct and indirect economic and job contributions of civilaviation to the Dominican Republic’s economy
VIII. Policies that could further enhance economic contributionof civil air transport

27/07/2018
4
7
Introduction
Policy and Regulation
Safety Audit Results
Air Connectivity and the State of Air Transport
Economic Benefits and Job Contribution
Aviation as Priority
DECISION & POLITICAL WILLDominican Republic chose to make aviation a priority sector
in their national development planning and policies
Civil Aviation Law No.491‐06 (promulgated 28 December 2006)
• Strengthen the role of the civil aviation board and itsmandate for negotiations (3rd and 4th freedom rights)
• Allows for more flexibility for foreign operators
Policy and Regulation
Source: JAC 8

27/07/2018
5
Aviation as PriorityModifications for higher degree of liberalization
2010 – Resolution No.180‐(2010)(promulgated by JAC, currently under review)• 6th freedom rights for passenger, cargo and combined• 7th freedom rights for all‐cargo
2013 – Law 67‐13 (amending Law 491‐06)• Relaxation of ownership requirements for national operators
(company with foreign capital (up to 100%) can beconsidered as a national air operator, provided, that theinvestment is from an internationally known airline)
Source: JAC 9
Policy and Regulation
Aviation as Priority
JAC Requirement Manual (Version 6.0)
Regulatory framework for the Civil Aviation Board
• Includes regulatory framework for charter and special permits
• More flexible requirements for the issuance of Operating Permits were introduced and simplified gradually
Source: JAC 10
Policy and Regulation
27/07/2018
6
Bilateral Agreements:
Total number: 60
incl. 5th freedom: 54
incl. 6th freedom: 17
incl. 7th freedom: 19(all cargo)
Multilateral Agreements:
Air Transport Agreement of Association of Caribbean States (ACS)
(rubricated February 2004, final signature pending)
Multilateral Agreement of Open Skies among the Member States of the Latin American Civil Aviation Commission
(LACAC)(signed November 2011)
Source: ICAO WASA‐Traffic Map (2017 traffic data)
11
Air Services Agreements
12
Introduction
Policy and Regulation
Safety Audit Results
Air Connectivity and the State of Air Transport
Economic Benefits and Job Contribution

27/07/2018
7
13
How Safety Affects Air Traffic
• Safety reputation might affect travelers'choice of destination and airlines
• Accidents and incidents might lead to animmediate decline of demand to travelwith a particular airline
• Using an econometric model, it isestimated that 10 per cent improvementof the effective implementation of a State’ssafety oversight system might generate,on average, an additional 1.8 per cent ofaircraft departures from the Stateconcerned
Source: Aviation Benefits report, 2017, ICAO
14Source: ICAO
• Dominican Republic improved Effective Implementation (EI) from 85.98% (2009) to 90.52% (world average is 66.32%), ranking the country 4 of 21 in NACC region
• Dominican Republic reached the Global Aviation Safety Plan (GASP) Targets
Safety Audit Results

27/07/2018
8
15Source: ICAO
Safety Audit Results
Dominican Republic Performance Dashboard based on ICAO Safety Audits
Green indicates that the State exceeds the target set by ICAO
16
Introduction
Policy and Regulation
Safety Audit Results
Air Connectivity and the State of Air Transport
Economic Benefits and Job Contribution

27/07/2018
9
Movement of passengers, mail and cargo involving the minimum of transit points
– which makes trip as short as possible
– with optimal user satisfaction
– at the minimum price possible
Market Access
Airline Activities
Inter‐modality
Facili‐tation
Optimal Use of Airport Systems
Optimal Use of ANS
Optimal Use of Aircraft
Market AccessMarket Access
Airline Activities Airline
Activities Inter‐
modalityInter‐
modalityFacili‐tationFacili‐tation
Optimal Use of Airport Systems
Optimal Use of Airport Systems
Optimal Use of ANS
Optimal Use of ANS
Optimal Use of Aircraft
Optimal Use of Aircraft
Definition of Air Connectivity
17
Measurement of Air Connectivity
Global Air Connectivity Index
Source: MIDT Big data
The World Bank uses this connectivity index in it’s major report which focuses on understanding the role of connectivity in economic growth and development
DepartureShare of 2016
Pax0 stop (Direct) 1 Stop 2016 2 Stops 2016
Weighted average Stops 2016
United States 7.87% 47.0% 46.3% 6.8% 0.60
United Kingdom 7.06% 84.3% 14.6% 1.1% 0.17
Germany 5.12% 75.5% 22.7% 1.8% 0.26
Spain 4.94% 83.9% 14.5% 1.6% 0.18
China 4.49% 73.7% 24.6% 1.7% 0.28
Italy 3.76% 75.2% 22.6% 2.2% 0.27
France 3.65% 77.7% 20.7% 1.6% 0.24
Japan 2.91% 75.1% 22.3% 2.5% 0.27
Republic of Korea 2.33% 86.2% 12.7% 1.1% 0.15
Thailand 2.17% 75.3% 22.4% 2.3% 0.27
United Arab Emirates 2.16% 86.2% 13.1% 0.7% 0.14
Canada 2.05% 54.5% 38.8% 6.6% 0.52
India 2.00% 51.1% 43.8% 5.2% 0.54
Hong Kong, SAR, China 1.77% 87.6% 11.9% 0.5% 0.13
Taiwan Province of China 1.68% 89.5% 9.5% 1.0% 0.12
Dominican Republic 0.43% 61.1% 36.6% 2.4% 0.41(ranks 47th by share of 2016 pax)
18

27/07/2018
10
19
Measurement of Shipping Network Connectivity
Source: Making Development Co‐operation work for Small Island Developing States, OECD
The score of Dominican Republic (23) is close to the average for other developing countries (25)
20
The State of Air TransportDominican Republic
2017
Source: ICAO‐ICM
• Over 99.9% of traffic is international
• More than 90% of tourists arrive by air
• 80% of passengers originating in Dominican Republic depart from Punta Cana and Santo Domingo airports
• Half of passengers departing from Dominican Republic fly to United States
• Eight out of the top 10 outbound routes are to United States
• More than 20% of passengers departing from Dominican Republic travel to New York/Newark

27/07/2018
11
Airlines of Dominican Republic
Source: ICAO
0
50,000
100,000
150,000
200,000
250,000
300,000
350,000
400,000
450,000
500,000
2008 2009 2010 2011 2012 2013 2014 2015 2016 2017 2018
Number of seats offered
Seats offered by airlines registered in Dominican Republic
Aerolineas MAS PAWA Dominicana
1995: Dominicana de Aviación ceased all operations
2001‐2004: Massive drop of domestic capacity partly due to the increased road connectivity within the State
2003: PAWA Dominicana was founded
2005: Aerolíneas Mas was founded
2012: End of scheduled domestic services
2012‐2014: PAWA Dominicana temporarily ceased scheduled flights, only offering non‐scheduled flights
2015: Aerolíneas Mas ceased all operations
2018: PAWA Dominicana ceased all operations
21
22
Passenger Arrivals
Source: JAC, Dominican Republic
0
2,000,000
4,000,000
6,000,000
8,000,000
10,000,000
12,000,000
14,000,000
2005 2006 2007 2008 2009 2010 2011 2012 2013 2014 2015 2016 2017
Passengers
A
Scheduled flights Non‐scheduled flights
2006
27/07/2018
12
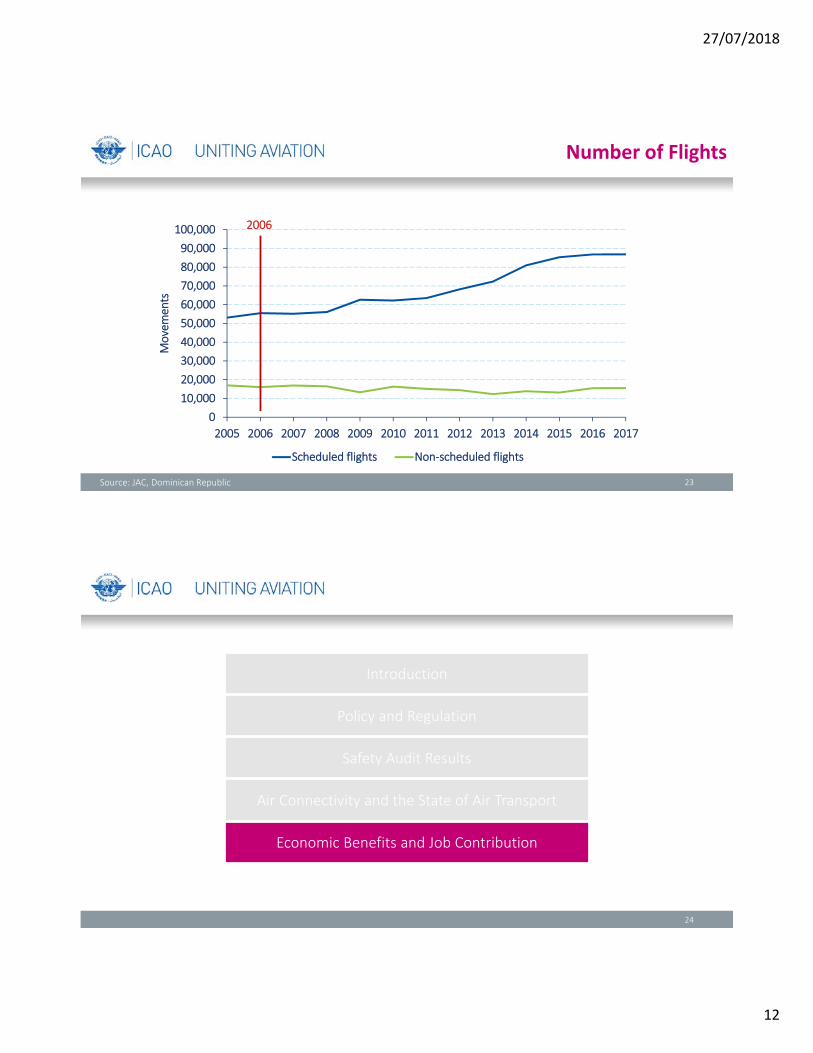
0
10,000
20,000
30,000
40,000
50,000
60,000
70,000
80,000
90,000
100,000
2005 2006 2007 2008 2009 2010 2011 2012 2013 2014 2015 2016 2017
Movements
R
Scheduled flights Non‐scheduled flights
23
Number of Flights
Source: JAC, Dominican Republic
2006
24
Introduction
Policy and Regulation
Safety Audit Results
Air Connectivity and the State of Air Transport
Economic Benefits and Job Contribution

27/07/2018
13
Economy of Dominican Republic Some Key Facts
‐ Small Island Developing State (SIDS)
‐ Upper middle‐income developing country (by World Bank Group)
‐ 99th in Ease of Doing Business Ranking 2018 (by World Bank Group)
‐ 104th in Global Competitiveness Index 2017‐2018 (by World Economic Forum)
‐ 76th in Travel & Tourism Competitive Index 2017 (by World Economic Forum)
Source: ICAO
Dominican Republic has enjoyed strong economic growth in recent years and a significant reduction in poverty, although the country remains vulnerable to natural disasters such as hurricanes (World Bank Group)
25
26
Real GDP and Population of Dominican Republic
0
1,500
3,000
4,500
6,000
7,500
9,000
10,500
12,000
0
10,000
20,000
30,000
40,000
50,000
60,000
70,000
80,000
1995 1997 1999 2001 2003 2005 2007 2009 2011 2013 2015 2017
Populatio
n (Th
ousan
ds)
Real G
DP in M
illions of US $
Real Gross Domestic Product and Population of Dominican Republic (1995‐2017)
Source: World Bank national accounts data, and OECD National Accounts data files
2006

27/07/2018
14
27
Income Generated by Tourism in Dominican Republic
0
1,000
2,000
3,000
4,000
5,000
6,000
7,000
8,000
1980 1983 1986 1989 1992 1995 1998 2001 2004 2007 2010 2013 2016
Income (m
illions US $)
Income generated by tourism (1980‐2017)
Source: Hotels & Tourism Association of the Dominican Republic and Central Bank of the Dominican Republic
2006
28
Time-series regression analysis
generated t, Tourist , , ,
• Dependent variable:
– Income generated by tourism
• Independent variables:
– Total jobs, expense per trip, number of tourists (Dominican non-residents and non-resident foreigners), hotel rooms available and GDP
– Some independent variables may be multiplied together, logged and/or first differenced
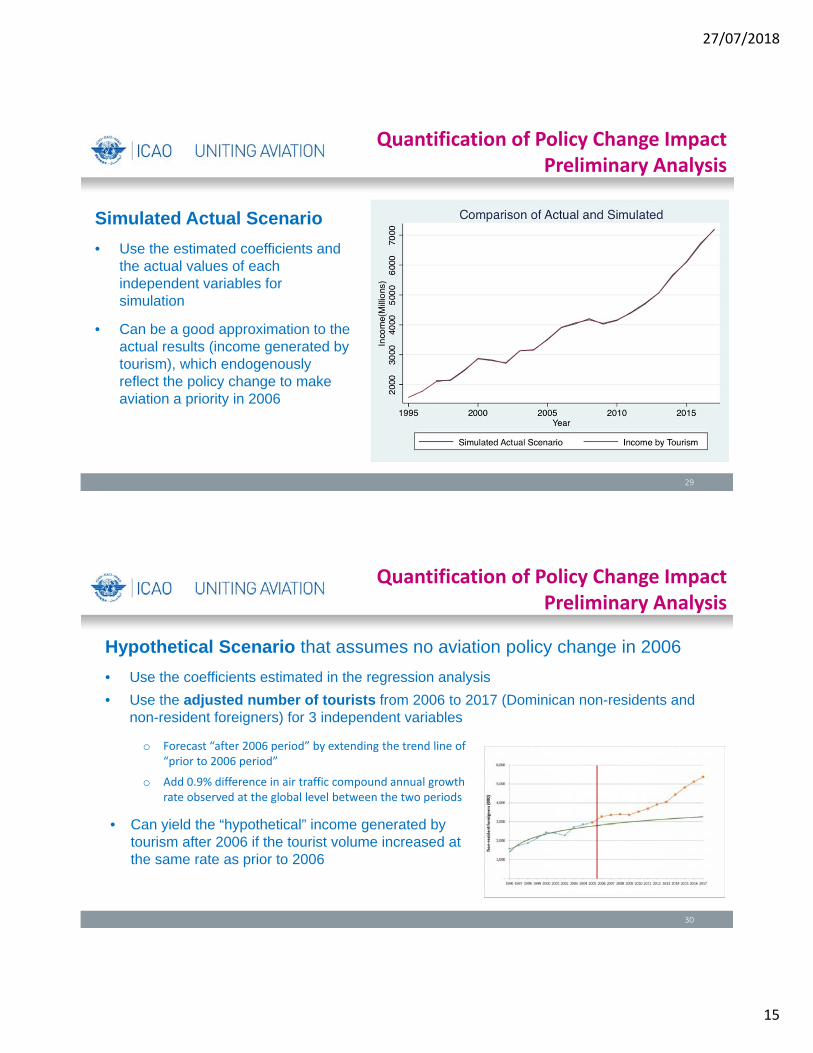
Quantification of Policy Change ImpactPreliminary Analysis
27/07/2018
15
29
Simulated Actual Scenario
• Use the estimated coefficients and the actual values of each independent variables for simulation
• Can be a good approximation to the actual results (income generated by tourism), which endogenously reflect the policy change to make aviation a priority in 2006
Quantification of Policy Change ImpactPreliminary Analysis
Quantification of Policy Change ImpactPreliminary Analysis
30
Hypothetical Scenario that assumes no aviation policy change in 2006
• Use the coefficients estimated in the regression analysis
• Use the adjusted number of tourists from 2006 to 2017 (Dominican non-residents and non-resident foreigners) for 3 independent variables
o Forecast “after 2006 period” by extending the trend line of “prior to 2006 period”
o Add 0.9% difference in air traffic compound annual growth rate observed at the global level between the two periods
• Can yield the “hypothetical” income generated by tourism after 2006 if the tourist volume increased at the same rate as prior to 2006
27/07/2018
16
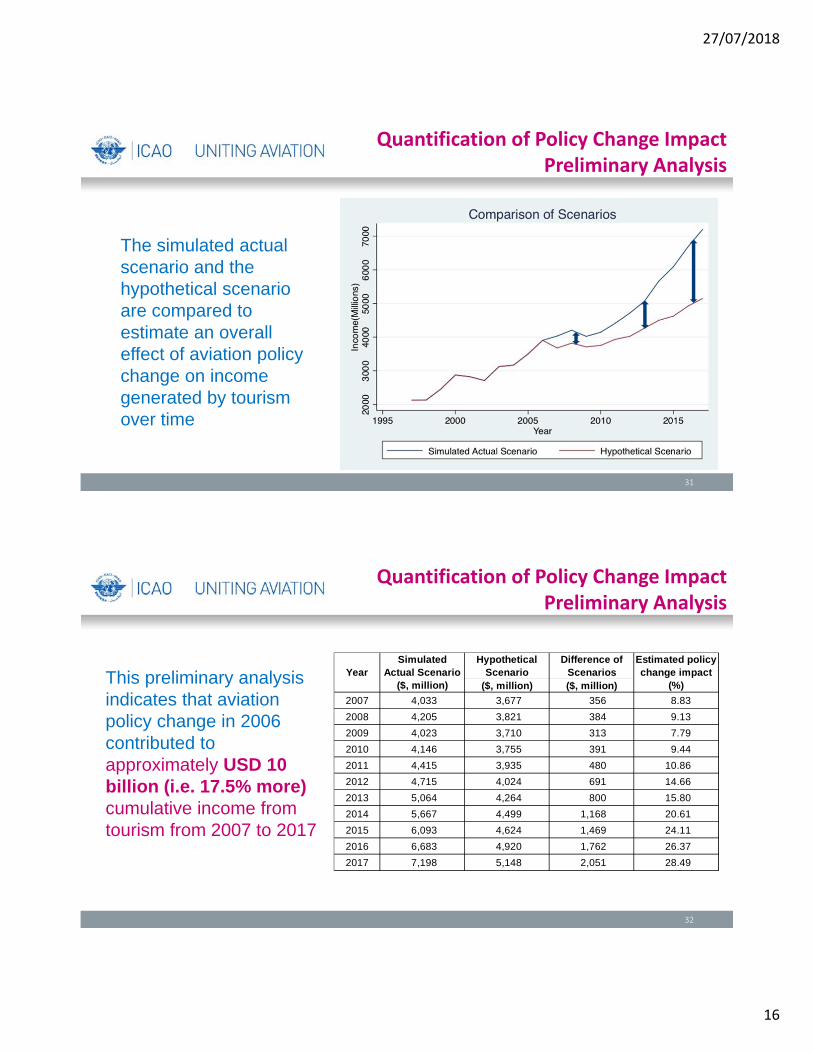
Quantification of Policy Change ImpactPreliminary Analysis
31
The simulated actual scenario and the hypothetical scenario are compared to estimate an overall effect of aviation policy change on income generated by tourism over time
Quantification of Policy Change ImpactPreliminary Analysis
32
This preliminary analysis indicates that aviation policy change in 2006 contributed to approximately USD 10 billion (i.e. 17.5% more) cumulative income from tourism from 2007 to 2017
Hypothetical Scenario
Difference of Scenarios
($, million) ($, million)
2007 4,033 3,677 356 8.83
2008 4,205 3,821 384 9.13
2009 4,023 3,710 313 7.79
2010 4,146 3,755 391 9.44
2011 4,415 3,935 480 10.86
2012 4,715 4,024 691 14.66
2013 5,064 4,264 800 15.80
2014 5,667 4,499 1,168 20.61
2015 6,093 4,624 1,469 24.11
2016 6,683 4,920 1,762 26.37
2017 7,198 5,148 2,051 28.49
YearSimulated
Actual Scenario ($, million)
Estimated policy change impact
(%)

27/07/2018
17
33Source: IATA and ICAO estimates
Quantification of Policy Change ImpactPreliminary Analysis
In 2014,
– 15.8% of total gross value added by aviation (i.e. USD 1.2 billion out of USD 7.4 billion)
– 1.8% of Dominican Republic’s GDP
can be attributed to aviation policy change made in 2006
• Many of the SDGs are directly and indirectly connected to sustainable air transport (especially SDG 9, 8, 11 and 13)
• Progress towards the goals needs to be monitored and evaluated by adequate and quality data
• SDG Target 9.1 – Develop quality, reliable, sustainable and resilient infrastructure with a focus on affordable and equitable access for all
– ICAO is a custodial agency responsible for collecting traffic data and sharing the information with the UN system to support the agreed global indicator (passenger and freight volumes by mode of transport)
Sustainable Development Goals (SDGs)Attainment of the SDGs relies on advances in sustainable air transport, which is a driver of sustainable development.
UN 2030 Agendafor Sustainable Development
34

27/07/2018
18
35
Thank You
This study will serve as a template for other SIDS toconsider in order to optimize their own air transport benefits
Source: United Nations
Appendix
36

27/07/2018
19
37
Air Connectivity of Dominican Republic
2011 2017
Source: ICAO‐ICM
ICAO‐ICM Global Air Transport Diagnosis using Marketing Information Data Transfer (MITD) Data
Passenger Traffic Composition of Dominican Republic in 2017
Source: ICAO‐ICM 38

27/07/2018
20
Origin Airport Traffic
Source: ICAO‐ICM 39
80% of passengers originating in Dominican Republic departed from Punta Cana (PUJ) and Santo Domingo (SDQ) airports in 2017
Source: ICAO‐ICM 40
Top 10 Destination Countries
Half of passengers departing from Dominican Republic flew to United States

27/07/2018
21
Source: ICAO‐ICM 41
Top 10 Outbound Routes
Eight out of the top 10 outbound routes from Dominican Republic are to United States in 2017
Source: ICAO‐ICM 42
Top 10 Destination Airports
More than 20% of passengers departing from Dominican Republic travel to New York (JFK or EWR) in 2017

27/07/2018
22
43Source: JAC, Dominican Republic
0
1,000,000
2,000,000
3,000,000
4,000,000
5,000,000
6,000,000
7,000,000
8,000,000
9,000,000
2005200620072008200920102011201220132014201520162017
Passengers
Scheduled flights
0
200,000
400,000
600,000
800,000
1,000,000
1,200,000
1,400,000
1,600,000
1,800,000
2005 2006 2007 2008 2009 2010 2011 2012 2013 2014 2015 2016 2017
Passengers
Non‐scheduled flights2006 2006
Passenger Arrivals
44
Passenger Arrivals
Source: JAC, Dominican Republic
19.4%
16.8%
1.6%
62.2%
2005
Europe
CentralAmerica/Caribbean
South America
North America
Passengers by Region of Origin: Scheduled Flights to Dominican Republic
14.3%
13.0%
6.6%66.1%
2017
27/07/2018
23
45
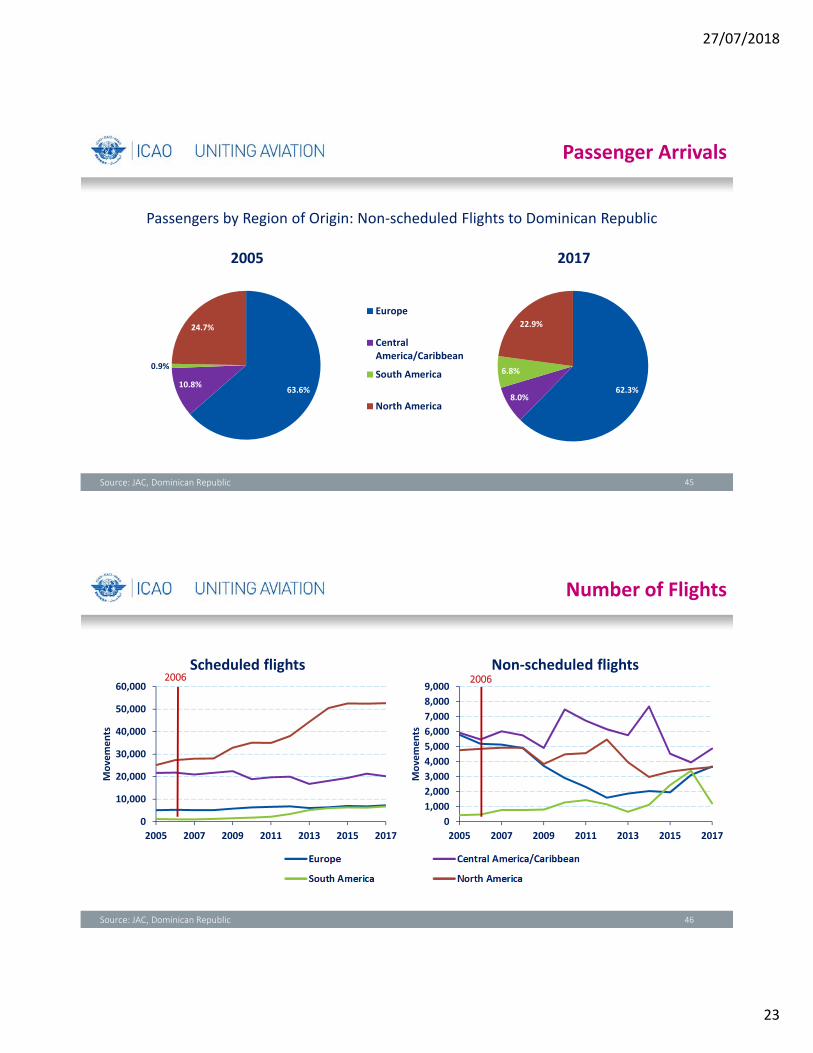
Passenger Arrivals
Source: JAC, Dominican Republic
63.6%10.8%
0.9%
24.7%
2005
Europe
CentralAmerica/Caribbean
South America
North America
Passengers by Region of Origin: Non‐scheduled Flights to Dominican Republic
62.3%8.0%
6.8%
22.9%
2017
46Source: JAC, Dominican Republic
0
10,000
20,000
30,000
40,000
50,000
60,000
2005 2007 2009 2011 2013 2015 2017
Movements
Scheduled flights
0
1,000
2,000
3,000
4,000
5,000
6,000
7,000
8,000
9,000
2005 2007 2009 2011 2013 2015 2017
Movements
Non‐scheduled flights2006 2006
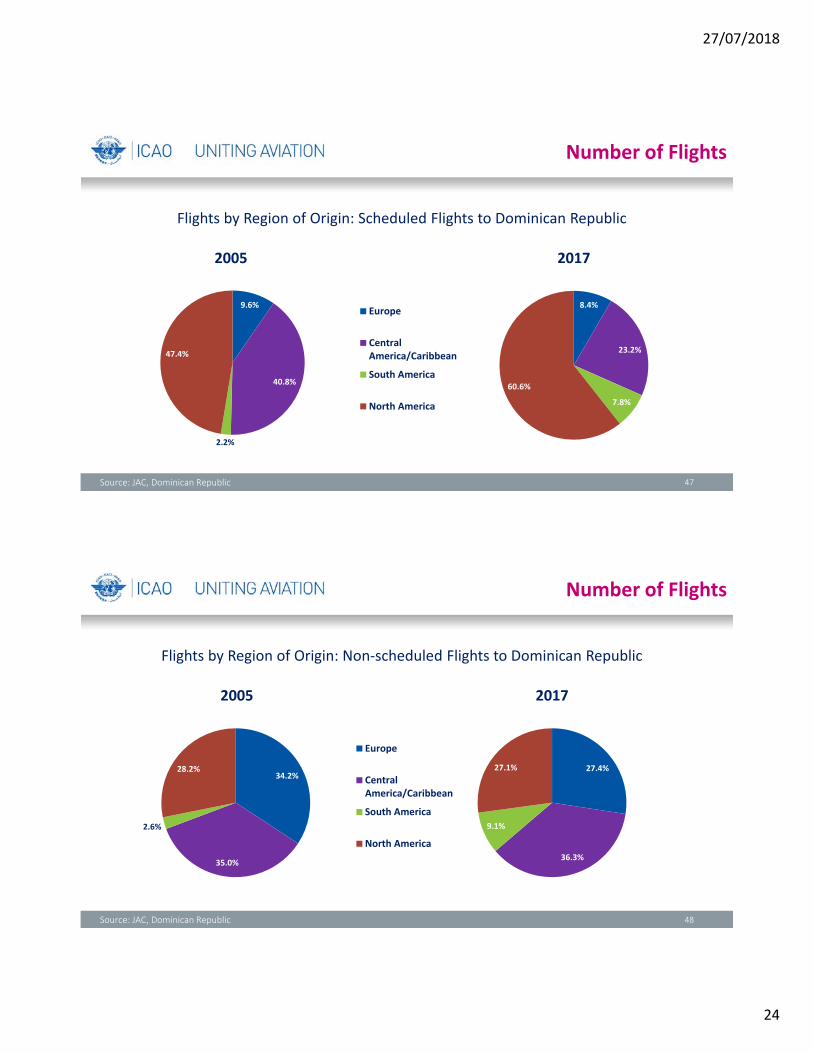
Number of Flights
27/07/2018
24
47Source: JAC, Dominican Republic
9.6%
40.8%
2.2%
47.4%
2005
Europe
CentralAmerica/Caribbean
South America
North America
Flights by Region of Origin: Scheduled Flights to Dominican Republic
Number of Flights
8.4%
23.2%
7.8%
60.6%
2017
48Source: JAC, Dominican Republic
34.2%
35.0%
2.6%
28.2%
2005
Europe
CentralAmerica/Caribbean
South America
North America
Flights by Region of Origin: Non‐scheduled Flights to Dominican Republic
Number of Flights
27.4%
36.3%
9.1%
27.1%
2017

27/07/2018
25
49Source: Dirección General de Aduanas (DGA). Departamento de Estadísticas.
Trade by Mode of Transport
2017 2013
50
Tourist Arrivals by Air
In Dominican Republic, more than 90% of tourists arrive by air
Source: UNWTO

27/07/2018
26
51
Expenditure and Duration of Stay
Source: Dominican Republic
0
1.5
3
4.5
6
7.5
9
10.5
12
0
20
40
60
80
100
120
140
160
1995 1997 1999 2001 2003 2005 2007 2009 2011 2013 2015 2017
Number o
f nigh
tsAverage daily expense (US $)
Daily expenditure and average duration stay of non‐resident foreigners
2006
52
Expenditure and Average per Night
Source: Dominican Republic
0
5
10
15
20
25
0
180
360
540
720
900
1995 1997 1999 2001 2003 2005 2007 2009 2011 2013 2015 2017
Average p
er nigh
tExpense per stay (US $)
Expenditure and average per night of Dominican non‐residents2006
27/07/2018
27
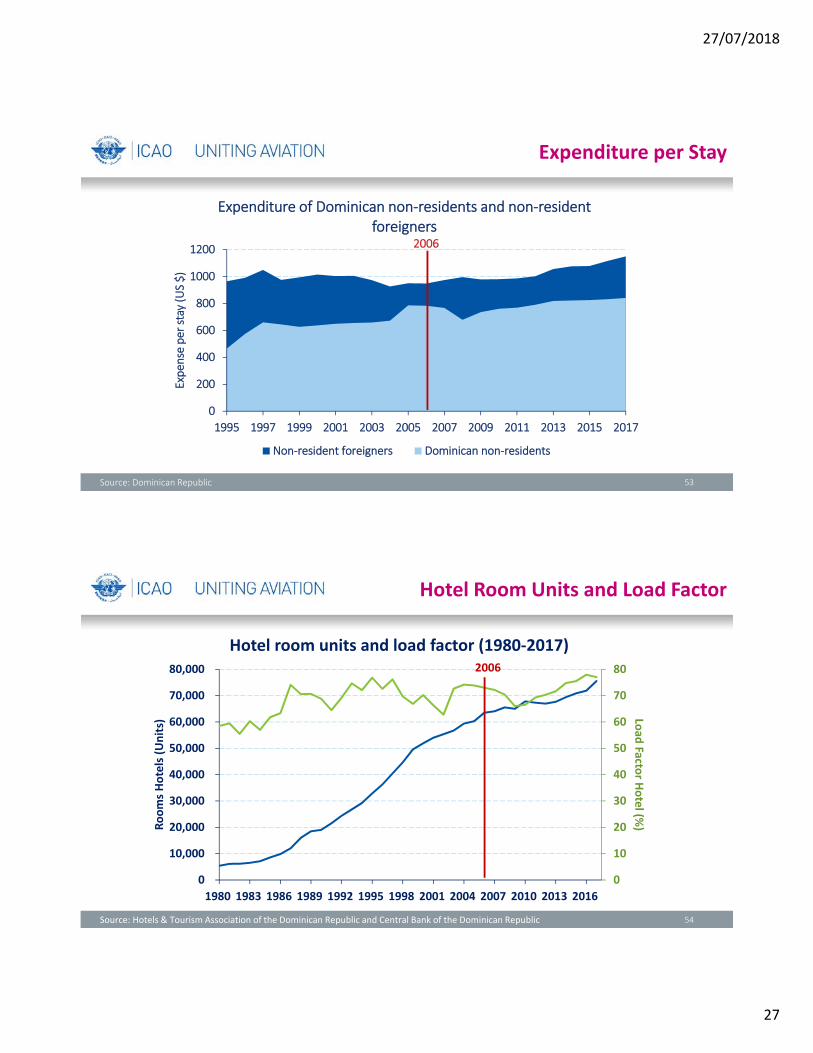
53
Expenditure per Stay
Source: Dominican Republic
0
200
400
600
800
1000
1200
1995 1997 1999 2001 2003 2005 2007 2009 2011 2013 2015 2017
Expense per stay (US $)
Expenditure of Dominican non‐residents and non‐resident foreigners
Non‐resident foreigners Dominican non‐residents
2006
54
Hotel Room Units and Load Factor
0
10
20
30
40
50
60
70
80
0
10,000
20,000
30,000
40,000
50,000
60,000
70,000
80,000
1980 1983 1986 1989 1992 1995 1998 2001 2004 2007 2010 2013 2016
Load
Factor H
otel (%
)Rooms Hotels (Units)
Hotel room units and load factor (1980‐2017)
Source: Hotels & Tourism Association of the Dominican Republic and Central Bank of the Dominican Republic
2006

27/07/2018
28
55
Jobs Generated by Hotels in Dominican Republic
0
50,000
100,000
150,000
200,000
250,000
1980 1983 1986 1989 1992 1995 1998 2001 2004 2007 2010 2013 2016
Jobs generated by hotels (1980‐2017)
Direct jobs Indirect jobs
Source: Hotels & Tourism Association of the Dominican Republic and Central Bank of the Dominican Republic
2006
56
0
5
10
15
20
25
30
35
40
45
1995 2000 2005 2010 2015 2020 2025 2030 2035
Revenue Passenger Kilometres (RPK)
(Billions)
Source: ICAO
Revenue Passenger Kilometres (RPK) departing from Dominican Republic
2006
Long‐term Traffic Forecasts

27/07/2018
29
57
0
10
20
30
40
50
60
70
80
90
0
20,000
40,000
60,000
80,000
100,000
120,000
1995 2000 2005 2010 2015 2020 2025 2030 2035
Load
factor (%
)Number of flights
Source: ICAO
Number of flights and load factor departing from Dominican Republic
Long‐term Traffic Forecasts
2006
• The System of National Accounts (SNA) is the internationally agreed standard set of recommendations on how to compile measures of economic activity in accordance with strict accounting conventions based on economic principles
• A Satellite Account is to provide more depth on measuring economic activities and social behavior of certain economic sectors that are not defined as industries in national accounts
• Examples of existing Satellite Accounts:
– Tourism Satellite Account
– Health Satellite Account
– Unpaid household activity
What is Satellite Account?
58

27/07/2018
30
Difficult to quantify contribution of aviation to economy
Incremental impact of investments in aviation in different sectors is unclear
Importance of aviation industry is often felt underestimated
No existing standard framework to measure the economic impact of civil aviation activities
Aviation Satellite Account
Aviation Satellite Account (ASA)
Need of Aviation Satellite Account (ASA)
59
ASA Framework
Aviation contribution
to GDP
Ranking of aviation GDP compared to other sectors
Number of jobs created by aviation
Taxes and charges
generated by aviation
Aviation consumption
Impact of aviation on balance of payments
The ASA will provide State an articulated framework measuring all aviation related economic activities
What does ASA Framework Measure?
60

27/07/2018
31
61
Aviation’s Economic Contribution
SIDS (2014)Latin America and the Caribbean (2014)
Source: Aviation Benefits Beyond Borders 2016, ATAG