Embed Size (px)
Citation preview
ORIGINAL ARTICLE
Dominant resistance to Bt cotton and minor cross-resistanceto Bt toxin Cry2Ab in cotton bollworm from ChinaLin Jin,1 Yiyun Wei,1 Lei Zhang,1 Yihua Yang,1 Bruce E. Tabashnik2 and Yidong Wu1
1 Key Laboratory of Integrated Management of Crop Diseases and Pests (Ministry of Education), College of Plant Protection,
Nanjing Agricultural University, Nanjing, China
2 Department of Entomology, University of Arizona, Tucson, AZ, USA
Keywords
dominant resistance, resistance evolution,
resistance management
Correspondence
Yidong Wu, College of Plant Protection,
Nanjing Agricultural University, Nanjing
210095, China.
Tel.: +86 25 84396062;
fax: +86 25 84396294;
e-mail: [email protected]
Received: 1 May 2013
Accepted: 16 August 2013
doi:10.1111/eva.12099
Abstract
Evolution of resistance by insect pests threatens the long-term benefits of trans-
genic crops that produce insecticidal proteins from Bacillus thuringiensis (Bt).
Previous work has detected increases in the frequency of resistance to Bt toxin
Cry1Ac in populations of cotton bollworm, Helicoverpa armigera, from northern
China where Bt cotton producing Cry1Ac has been grown extensively for more
than a decade. Confirming that trend, we report evidence from 2011 showing that
the percentage of individuals resistant to a diagnostic concentration of Cry1Ac
was significantly higher in two populations from different provinces of northern
China (1.4% and 2.3%) compared with previously tested susceptible field popu-
lations (0%). We isolated two resistant strains: one from each of the two field-
selected populations. Relative to a susceptible strain, the two strains had 460- and
1200-fold resistance to Cry1Ac, respectively. Both strains had dominant resis-
tance to a diagnostic concentration of Cry1Ac in diet and to Bt cotton leaves con-
taining Cry1Ac. Both strains had low, but significant cross-resistance to
Cry2Ab (4.2- and 5.9-fold), which is used widely as the second toxin in two-toxin
Bt cotton. Compared with resistance in other strains of H. armigera, the resis-
tance in the two strains characterized here may be especially difficult to suppress.
Introduction
The insecticidal proteins of Bacillus thuringiensis (Bt) kill
some major insect pests, but are harmless to vertebrates
and most other organisms (Mendelsohn et al. 2003; Sana-
huja et al. 2011; Pardo-L�opez et al. 2013). Corn and cotton
plants genetically engineered to produce Bt toxins have
provided many benefits including pest suppression,
reduced use of insecticide sprays, conservation of natural
enemies, increased yield, and higher farmer profits (Wu
et al. 2008; Carpenter 2010; Hutchison et al. 2010;
National Research Council 2010; Tabashnik et al. 2010;
Edgerton 2012; Kathage and Qaim 2012; Lu et al. 2012).
Since 1996, farmers worldwide have planted transgenic
crops producing Bt toxins on a cumulative total of more
than 480 million ha, including 70 million hectares in 2012
(James 2012). The most widely used Bt proteins are crystal-
line (Cry) toxins, particularly three toxins that kill lepidop-
teran larvae: Cry1Ab in Bt corn, Cry1Ac in Bt cotton, and
Cry2Ab in second-generation Bt corn and Bt cotton
(Tabashnik et al. 2009b).
The primary threat to the continued efficacy of Bt toxins
is evolution of resistance by pests (Tabashnik 1994; Gould
1998; Ferr�e and Van Rie 2002; Tabashnik et al. 2009b,
2013). Field-evolved (or field-selected) resistance is defined
as a genetically based decrease in susceptibility of a popula-
tion to a toxin caused by exposure of the population to the
toxin in the field (Tabashnik et al. 2009b). Field-evolved
resistance associated with reduced efficacy of Bt toxins has
been reported in some populations of seven pest species:
two targeted by Bt sprays (Tabashnik et al. 1990; Janmaat
and Myers 2003) and five targeted by Bt crops (Luttrell
et al. 2004; Van Rensburg 2007; Tabashnik et al. 2008,
2013; Storer et al. 2010; Dhurua and Gujar 2011; Gass-
mann et al. 2011). Other cases of significant decreases in
susceptibility to the Bt toxins in transgenic crops including
‘incipient resistance’ and ‘early warning’ of resistance have
been detected in at least four additional pest species (Dow-
© 2013 The Authors. Evolutionary Applications published by John Wiley & Sons Ltd. This is an open access article under the terms of the Creative
Commons Attribution License, which permits use, distribution and reproduction in any medium, provided
the original work is properly cited.
1222
Evolutionary Applications ISSN 1752-4571
Evolutionary Applications
nes et al. 2010; Alcantara et al. 2011; Zhang et al. 2011;
Huang et al. 2012; Wan et al. 2012).
In particular, increases in the frequency of resistance to
Cry1Ac have been reported in populations of the major
cotton pest, cotton bollworm (Helicoverpa armigera), from
northern China, where Bt cotton that produces Cry1Ac has
been grown intensively for more than a decade (Liu et al.
2010; Zhang et al. 2011, 2012a). Decreased susceptibility to
Cry1Ac in populations of H. armigera from China has been
documented with monitoring data from a number of
studies based on comparisons over time within populations
exposed intensively to Bt cotton and between populations
that differ in their history of exposure to Bt cotton (Wu
et al. 1999; Li et al. 2007, 2010; Yang et al. 2007; An et al.
2010; Liu et al. 2010; Zhang et al. 2011, 2012a). Nonethe-
less, the maximum percentage of resistant individuals
reported in a population is 2.6% (compared with 0% for
susceptible populations), and Bt cotton producing Cry1Ac
has continued to provide substantial control of this pest in
China (Zhang et al. 2011). Thus, the small but statistically
significant increases in the frequency of resistance noted
above provide an early warning of resistance that could
become a more serious problem (Zhang et al. 2011).
The main strategy for delaying evolution of pest resis-
tance to Bt crops relies on refuges of host plants that do
not produce Bt toxins, which promotes survival of pests
susceptible to Bt toxins (Gould 1998; Tabashnik et al.
2004). Ideally, most of the rare resistant pests surviving on
Bt crops will mate with the relatively abundant susceptible
pests from nearby refuges. If inheritance of resistance is
recessive, the progeny from such matings will die on Bt
crops, substantially delaying the evolution of resistance.
Conversely, if inheritance of resistance is dominant, the
progeny from matings between resistant and susceptible
adults will survive on Bt crops, and refuges will be less
effective for delaying resistance.
The refuge strategy has been used with first generation Bt
plants that produce a single Bt toxin and with more
recently introduced Bt crop ‘pyramids’ that produce two or
more Bt toxins that kill a given pest (Zhao et al. 2005;
Br�evault et al. 2013). Pyramids are expected to be most
effective for delaying evolution of resistance if adaptation
to one toxin in the pyramid does not cause cross-resistance
to the other toxin(s) in the pyramid (Zhao et al. 2005;
Tabashnik et al. 2009a; Br�evault et al. 2013). Whereas Bt
cotton producing only Cry1Ac is grown in China, second-
generation Bt cotton plants producing toxins Cry1Ac and
Cry2Ab are grown in Australia, India, and the United States
(Tabashnik et al. 2013).
Because the refuge and pyramid strategies for delaying
resistance require understanding of the dominance of resis-
tance and cross-resistance, we evaluated these traits in two
resistant strains of H. armigera isolated from populations
in two provinces of northern China where Bt cotton has
been grown extensively for more than a decade. We quanti-
fied dominance of resistance with the parameter h, which
varies from 0 for completely recessive resistance to 1 for
completely dominant resistance (Liu and Tabashnik 1997).
Whereas h for resistance to a diagnostic concentration of
Cry1Ac ranged from 0 to 0.66 (mean = 0.19) in 14 previ-
ously studied strains of H. armigera (Kaur and Dilawari
2011; Zhang et al. 2012a,b), it was 1 for both strains ana-
lyzed here, indicating completely dominant resistance. Also
in contrast to previous results for H. armigera (Akhurst
et al. 2003; Xu et al. 2005; Luo et al. 2007; Liang et al.
2008; Yang et al. 2009; Zhang et al. 2012b), both resistant
strains had minor but significant cross-resistance to
Cry2Ab.
Materials and methods
Bt toxins, diet bioassays, and rearing
Dr. Marianne P. Carey (Case Western Reserve University,
USA) provided Cry1A activated toxins (Cry1Aa, Cry1Ab,
and Cry1Ac). Cry2Ab protoxin was provided by the Insti-
tute of Plant Protection, Chinese Academy of Agricultural
Sciences (CAAS), China.
We used diet surface overlay bioassays (Zhang et al.
2011) in which toxin stock suspensions were diluted with a
0.01 M, pH 7.4, phosphate-buffered solution (PBS). Liquid
artificial diet (900 lL) was dispensed into each well of a
24-well plate. After the diet cooled and solidified, 100 lLof PBS containing the desired concentration of Bt toxin
was applied evenly to the diet surface in each well and
allowed to air dry, and a single larva was placed in each
well. At the end of the bioassay, we scored larvae as dead if
they died or if they weighed <5 mg.
For Cry1A toxins, we tested second instars that were
starved for 4 h and we recorded mortality at 5 days, as in
our previous studies (Xu et al. 2005; Yang et al. 2007;
Zhang et al. 2011). For Cry2Ab, we tested unfed neonates
(24 h old) and recorded mortality after 7 days, which is the
method established in Australia for testing Cry2Ab against
H. armigera (Mahon et al. 2007) and requires less toxin.
We used a diagnostic concentration of 1 lg Cry1Ac/cm2
diet, which in previous studies killed all larvae tested from
susceptible populations (n > 2000), but <10% of larvae
from the resistant strain SCD-r1 (Xu et al. 2005; Zhang
et al. 2011, 2012a,b). Because this concentration kills virtu-
ally all susceptible larvae, it provides a conservative method
for detecting resistance. We used a series of concentrations
to estimate the concentration of each toxin killing 50% of
larvae (LC50) for susceptible strain SCD and resistant
strains AY2 and QX7 (described below). To estimate LC50
values, we tested 48 larvae of each strain at each toxin con-
centration, including a control with PBS and notoxin. We
© 2013 The Authors. Evolutionary Applications published by John Wiley & Sons Ltd 6 (2013) 1222–1235 1223
Jin et al. Dominant resistance to Bt cotton in bollworm
adjusted for control mortality (range = 0–8.3%) to esti-
mate LC50 values, but not in the bioassays with only the
diagnostic concentration, which had lower control mortal-
ity (<5%).
Larvae from all strains were reared on an artificial diet,
and adults were maintained as described previously (Zhang
et al. 2011). All experiments were conducted at 26°C(�1°C) and 60% (�10%) RH with 16 h L: 8 h D.
Previously described susceptible strain SCD and resistant
strain SCD-r1
The susceptible SCD strain of H. armigera was started with
insects from the Cote d’Ivoire (Ivory Coast), Africa, over
30 years ago and was maintained in the laboratory without
exposure to insecticides or Bt toxins (Yang et al. 2009). A
2010 survey showed that despite this long-term laboratory
rearing, susceptibility to Cry1Ac was not greater for SCD
compared with the most susceptible field populations
tested (Zhang et al. 2011). The LC50 of Cry1Ac-activated
toxin was numerically higher for SCD than for both field
populations tested from northwestern China that had lim-
ited exposure to Bt cotton as well as for two of the 13 field
populations tested from northern China (Zhang et al.
2011). The LC50 of Cry2Ab was equal to or higher for SCD
compared with all of the 14 field populations tested from
northern and northwestern China (Zhang et al. 2011). The
recessive r1 allele of the cadherin gene (HaCad) was isolated
from the resistant strain GYBT, which was started in
August 2001 with 300 large larvae collected from Bt cotton
in Gaoyang County of Hebei Province of northern China
and selected with Cry1Ac for 28 generations in the labora-
tory (Xu et al. 2005). The resistant strain SCD-r1 was cre-
ated by introgressing r1 from GYBT into SCD (Yang et al.
2009).
Isolation of strains AY2 and QX7 with field-derived
resistance
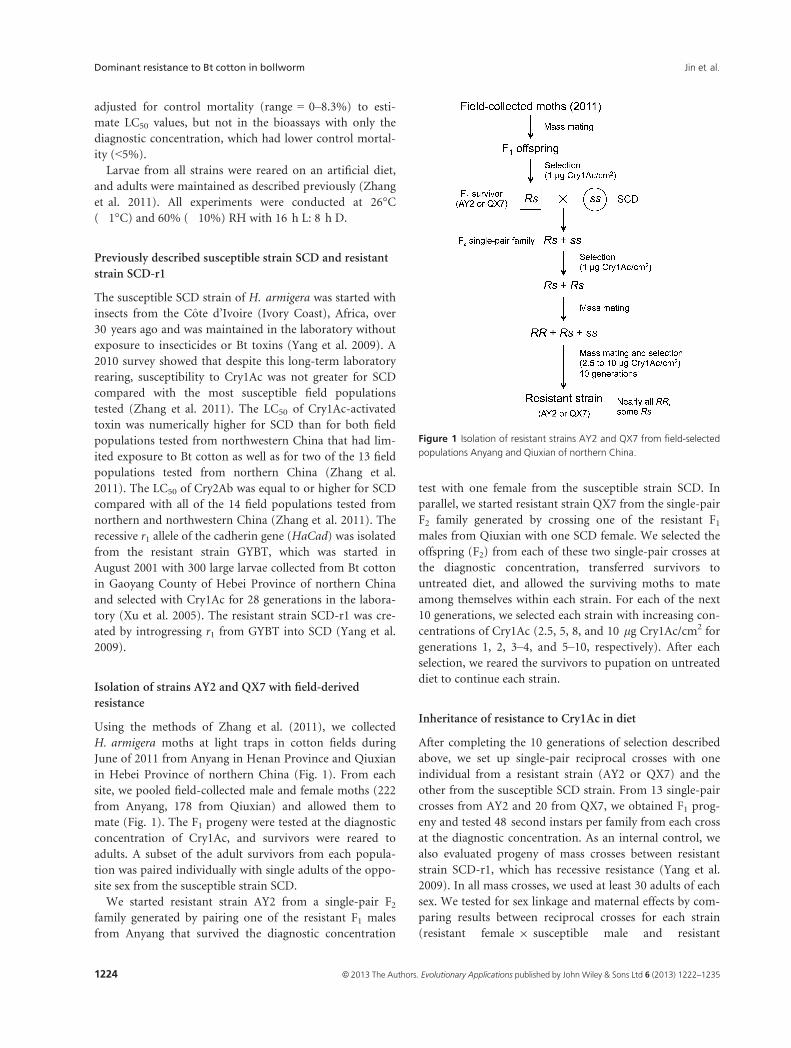
Using the methods of Zhang et al. (2011), we collected
H. armigera moths at light traps in cotton fields during
June of 2011 from Anyang in Henan Province and Qiuxian
in Hebei Province of northern China (Fig. 1). From each
site, we pooled field-collected male and female moths (222
from Anyang, 178 from Qiuxian) and allowed them to
mate (Fig. 1). The F1 progeny were tested at the diagnostic
concentration of Cry1Ac, and survivors were reared to
adults. A subset of the adult survivors from each popula-
tion was paired individually with single adults of the oppo-
site sex from the susceptible strain SCD.
We started resistant strain AY2 from a single-pair F2family generated by pairing one of the resistant F1 males
from Anyang that survived the diagnostic concentration
test with one female from the susceptible strain SCD. In
parallel, we started resistant strain QX7 from the single-pair
F2 family generated by crossing one of the resistant F1males from Qiuxian with one SCD female. We selected the
offspring (F2) from each of these two single-pair crosses at
the diagnostic concentration, transferred survivors to
untreated diet, and allowed the surviving moths to mate
among themselves within each strain. For each of the next
10 generations, we selected each strain with increasing con-
centrations of Cry1Ac (2.5, 5, 8, and 10 lg Cry1Ac/cm2 for
generations 1, 2, 3–4, and 5–10, respectively). After each
selection, we reared the survivors to pupation on untreated
diet to continue each strain.
Inheritance of resistance to Cry1Ac in diet
After completing the 10 generations of selection described
above, we set up single-pair reciprocal crosses with one
individual from a resistant strain (AY2 or QX7) and the
other from the susceptible SCD strain. From 13 single-pair
crosses from AY2 and 20 from QX7, we obtained F1 prog-
eny and tested 48 second instars per family from each cross
at the diagnostic concentration. As an internal control, we
also evaluated progeny of mass crosses between resistant
strain SCD-r1, which has recessive resistance (Yang et al.
2009). In all mass crosses, we used at least 30 adults of each
sex. We tested for sex linkage and maternal effects by com-
paring results between reciprocal crosses for each strain
(resistant female 9 susceptible male and resistant
Figure 1 Isolation of resistant strains AY2 and QX7 from field-selected
populations Anyang and Qiuxian of northern China.
1224 © 2013 The Authors. Evolutionary Applications published by John Wiley & Sons Ltd 6 (2013) 1222–1235
Dominant resistance to Bt cotton in bollworm Jin et al.
male 9 susceptible female). We evaluated the dominance
of resistance in each of the three resistant strains by com-
paring survival between the resistant strain, SCD, and the
F1 progeny from the cross between the resistant strain and
SCD. We conducted backcrosses [(resistant 9 SCD)
9 SCD] and evaluated the number of loci conferring resis-
tance with three methods: direct tests of a one-locus model,
indirect tests of models with one, two, five, and ten loci,
and estimation of the minimum number of effective factors
influencing resistance (Lande 1981; Tabashnik et al. 1992,
2002).
Inheritance of resistance to Bt cotton leaves in AY2 and
QX7
We used methods analogous to those described above to
evaluate dominance of resistance in AY2, QX7, and SCD-r1
to leaves from Bt cotton containing Cry1Ac. All larvae
tested in leaf bioassays were obtained from mass crosses,
including reciprocal mass crosses between each resistant
strain and the susceptible SCD strain.
The leaves tested in bioassays were obtained from Bt cot-
ton planted in the field on April 18, 2012, at Luhe in the Ji-
angsu Province of China. We used Bt cotton cultivar GK19,
which produces a Cry1Ac/Cry1Ab fused protein (Wan
et al. 2005; Tabashnik et al. 2012). GK varieties producing
this protein predominate in China and accounted for 93%
of China’s Bt cotton in 2009 (Tabashnik et al. 2012). No
insecticides were used to protect plants. We collected the
top second or third leaf on the main stem on the morning
of July 23, 2012, when plants were flowering. We took
leaves to the laboratory in insulated boxes with ice and
infested them with larvae on the afternoon of July 23, 2012.
For each replicate, we put five unfed neonates (up to
24 h old) on one cotton leaf and put the leaf into a 115-mL
glass tube. To provide moisture, we inserted the petiole of
each leaf into 20 mL of 1% agar at the bottom of the tube.
Each tube was covered with two layers of black cloth to
prevent the insects from escaping. We tested 30 replicates
(150 neonates) for each of the following: SCD, AY2, QX7,
SCD-r1, and the F1 progeny from crosses between each
resistant strain and SCD. After 5 days, we scored larvae as
dead if they died or if they weighed <5 mg.
Cry1Ac concentration in field-collected Bt cotton leaves
used in bioassays
A subset of the Bt cotton leaves collected from the field as
described above were stored at �80°C and used later for
measuring Cry1Ac concentration with an enzyme-linked
immunosorbent assay (ELISA) kit (QualiPlateTM Kit; Envi-
rologix, Portland, ME, USA). The kit is a ‘sandwich’ ELISA
in which Cry1Ac binds to antibody and is detected by the
addition of horseradish peroxidase-labeled antibody. For
each of three replicates, we tested a leaf sample of 100 mg
consisting of pieces (about 5 mg each) from 20 different
leaves. We added extraction buffer (1 mL) to the tube and
ground the plant tissue with a pestle. Extracts were diluted
with the buffer solution at 1:200 to bring assay results
within the range of calibration. To establish a standard
curve, we used a microtiter plate to measure the optical
density (OD) at 450 nm of a series of dilutions of Cry1Ac
of known concentration. We measured the OD of leaf
extracts and used the standard curve to convert OD to
Cry1Ac concentration. We used this concentration to cal-
culate the lg of Cry1Ac per gram of fresh leaf tissue.
Data analysis
Probit analysis
We used the PoloPlus program (LeOra Software 2002) to
conduct probit analysis of the mortality data to estimate
LC50, the 95% fiducial limits of the LC50, the slope of the
concentration-mortality line, and the standard error of the
slope. We considered two LC50 values significantly different
only if their 95% fiducial limits did not overlap, which is a
conservative criterion (Tabashnik et al. 1987; Payton et al.
2003). We calculated the resistance ratio (RR) as the LC50
of a population divided by the LC50 of the susceptible SCD
strain. We use the term ‘cross-resistance ratio’ (CRR) to
refer to resistance ratio for one toxin (e.g., Cry2Ab) that
results from selection with a different toxin (e.g., Cry1Ac).
Our use of the LC50 of Cry2Ab for SCD as the divisor to
calculate the CRR for Cry2Ab may underestimate cross-
resistance to Cry2Ab in AY2 and QX7 because the LC50 of
Cry2Ab was significantly higher for SCD than for six of the
14 field populations tested from northern and northwest-
ern China (Zhang et al. 2011). For Cry2Ab, the LC50 was
eight times higher for SCD than for the most susceptible
field population, and none of the 14 field populations,
including Anyang and Qiuxian, had a higher LC50 than
SCD (Zhang et al. 2011).
Evaluation of dominance using bioassay data
From the data collected in this study, we calculated the
dominance parameter h, which varies from 0 (completely
recessive) to 1 (completely dominant) (Liu and Tabashnik
1997), using survival (%) at the diagnostic concentration
of Cry1Ac or survival on leaves of Bt cotton as follows:
h = (survival of F1 – survival of SCD)/(survival of resistant
strain – survival of SCD). We also used LC50 values for each
resistant strain, susceptible strain SCD, and their F1 prog-
eny to calculate the dominance parameter D (Stone 1968),
and we converted D to h as described by Liu and Tabashnik
(1997): h = (D + 1)/2. In addition, we analyzed data from
previous studies to calculate h as described above. The val-
© 2013 The Authors. Evolutionary Applications published by John Wiley & Sons Ltd 6 (2013) 1222–1235 1225
Jin et al. Dominant resistance to Bt cotton in bollworm
ues of h we calculated matched those in the papers cited
with one exception: Akhurst et al. (2003) reported
h = 0.26, but our calculations using their reported values
of LC50 yielded h = 0.39.
Cross-resistance between Cry1A and Cry2A toxins in selection
experiments with H. armigera and other lepidopteran pests
Following a previously described method (Br�evault et al.
2013), we used a one-tailed Wilcoxon signed-rank test
(http://www.vassarstats.net/wilcoxon.html) to determine
whether the log-transformed cross-resistance ratio for
Cry2A toxins was significantly greater than zero in nine
Cry1Ac-resistant strains of H. armigera, which would indi-
cate an overall significant cross-resistance to Cry2A toxins
caused by selection with Cry1Ac. We used the same
method to determine if the log-transformed cross-
resistance ratio between Cry1A and Cry2A toxins was sig-
nificantly greater than zero in 23 selection experiments
with strains of eight species of lepidopteran pests including
H. armigera. The Cry2A cross-resistance ratio for H. armi-
gera strain LFR10 was originally reported as 1.014 (Luo
et al. 2007), which we report here as 1.0 and consider equal
to one in summarizing the data.
Survival at the diagnostic concentration
We used Fisher’s exact test (http://graphpad.com/quick-
calcs/contingency1.cfm) to determine whether the fre-
quency of live and dead larvae from diagnostic
concentration bioassays with Cry1Ac differed significantly
between populations or over time for a single population.
In one exceptional case (Anyang 2005 vs Anyang 2011), we
used a chi-squared test with Yates’ correction because the
total sample size (11 544) exceeded the algorithm’s maxi-
mum for Fisher’s exact test.
Results
Isolation of resistant strains AY2 and QX7 from field-
selected populations
We isolated two strains with dominant resistance to
Cry1Ac while screening H. armigera collected in 2011 from
two field populations in northern China that had been
exposed extensively to Bt cotton producing Cry1Ac: Any-
ang in Henan Province and Qiuxian in Hebei Province
(Fig. 1). We allowed field-collected moths from each site
(222 from Anyang and 178 from Qiuxian) to mate among
themselves and tested the F1 progeny from each site at a
diagnostic concentration of Cry1Ac (1 lg Cry1Ac/cm2
diet). Survival at the diagnostic concentration for the F1offspring was 2.3% (36 of 1560) for Anyang and 1.4% for
Qiuxian (24 of 1680).
We started resistant strain AY2 from a single-pair F2family generated by pairing one of the resistant F1 males
from Anyang that survived the diagnostic concentration
test with one female from the susceptible strain SCD. In
parallel, we started resistant strain QX7 from the single-pair
F2 family generated by crossing one of the resistant F1males from Qiuxian with one SCD female. We tested the
offspring (F2) from each of these two single-pair crosses at
the diagnostic concentration, which yielded 33% survival
for AY2 and 33% survival for QX7. These results indicate
that the resistant F1 males that started the AY2 and QX7
strains had nonrecessive resistance, because recessive resis-
tance in these males would have yielded 0% survival in the
F2 progeny generated by single-pair crosses with females
from the susceptible strain.
In each of the next 10 generations (F3–F12), we selected
larvae of AY2 and QX7 at increasing concentrations of
Cry1Ac (2.5–10 lg Cry1Ac/cm2 diet) and reared the survi-
vors to continue each strain. After 10 successive generations
of selection, Cry1Ac resistance ratios (see Methods) were
1200 for AY2 and 460 for QX7 (Table 1).
Inheritance of resistance to Cry1Ac
Diagnostic concentration of Cry1Ac
After 10 generations of selection with Cry1Ac in diet,
results of bioassays with progeny from single-pair crosses
demonstrated autosomal, dominant resistance to a diag-
nostic concentration of Cry1Ac in AY2 and QX7 (Fig. 2).
For both strains, inheritance of resistance was autosomal,
with essentially identical survival for the two reciprocal
crosses for each strain (e.g., 96% for eight families from
AY2♂ 9 SCD♀ and 97% for five families from
SCD♂ 9 AY2♀, Fig. 2B). For the 13 single-pair families
generated by reciprocal crosses between AY2 and SCD, sur-
vival at the diagnostic concentration ranged from 88 to
100% (mean = 96%, h = 1.0, Fig. 2B). For the 20 single-
pair F1 families derived from reciprocal crosses between
QX7 and SCD, survival at the diagnostic concentration
ranged from 88% to 98% for 18 families (mean = 93%,
h = 1.0, Fig. 2C) and was 48% for both of the other fami-
lies. In the 18 families with 88% to 98% survival, we infer
that the resistant parents from QX7 were homozygous for a
dominant resistance allele (RR). The simplest explanation
for the 48% survival in the two other families is that the
resistant parents from QX7 were heterozygotes, with one
copy of a dominant resistant allele (R) and one copy of a
recessive susceptible allele (s), which would yield
an expected 1:1 ratio of Rs:ss and 50% survival in the F1progeny. From these results, we estimate that in QX7, after
10 successive generations of selection, the frequency was
0.9 (18/20) for RR and 0.1 (2/20) for Rs.
In contrast to the results with AY2 and QX7, survival at
the diagnostic concentration of Cry1Ac was 0% for F1progeny from both reciprocal crosses between resistant
1226 © 2013 The Authors. Evolutionary Applications published by John Wiley & Sons Ltd 6 (2013) 1222–1235
Dominant resistance to Bt cotton in bollworm Jin et al.
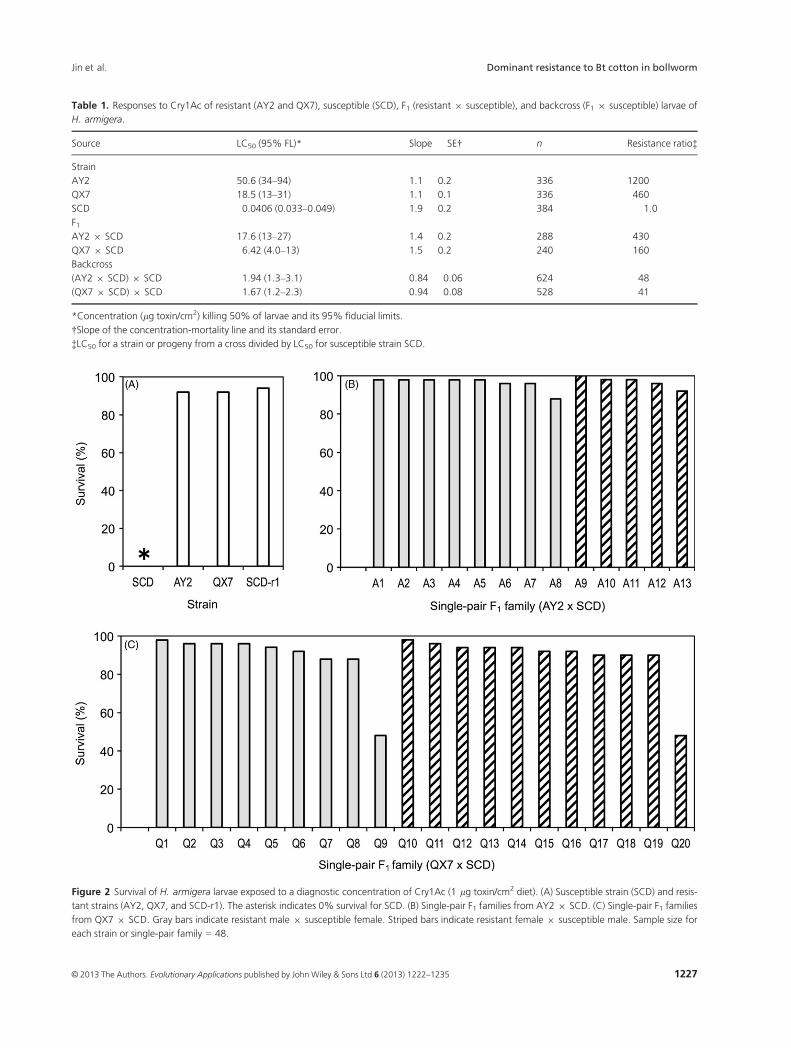
Table 1. Responses to Cry1Ac of resistant (AY2 and QX7), susceptible (SCD), F1 (resistant 9 susceptible), and backcross (F1 9 susceptible) larvae of
H. armigera.
Source LC50 (95% FL)* Slope � SE† n Resistance ratio‡
Strain
AY2 50.6 (34–94) 1.1 � 0.2 336 1200
QX7 18.5 (13–31) 1.1 � 0.1 336 460
SCD 0.0406 (0.033–0.049) 1.9 � 0.2 384 1.0
F1AY2 9 SCD 17.6 (13–27) 1.4 � 0.2 288 430
QX7 9 SCD 6.42 (4.0–13) 1.5 � 0.2 240 160
Backcross
(AY2 9 SCD) 9 SCD 1.94 (1.3–3.1) 0.84 � 0.06 624 48
(QX7 9 SCD) 9 SCD 1.67 (1.2–2.3) 0.94 � 0.08 528 41
*Concentration (lg toxin/cm2) killing 50% of larvae and its 95% fiducial limits.
†Slope of the concentration-mortality line and its standard error.
‡LC50 for a strain or progeny from a cross divided by LC50 for susceptible strain SCD.
Figure 2 Survival of H. armigera larvae exposed to a diagnostic concentration of Cry1Ac (1 lg toxin/cm2 diet). (A) Susceptible strain (SCD) and resis-
tant strains (AY2, QX7, and SCD-r1). The asterisk indicates 0% survival for SCD. (B) Single-pair F1 families from AY2 9 SCD. (C) Single-pair F1 families
from QX7 9 SCD. Gray bars indicate resistant male 9 susceptible female. Striped bars indicate resistant female 9 susceptible male. Sample size for
each strain or single-pair family = 48.
© 2013 The Authors. Evolutionary Applications published by John Wiley & Sons Ltd 6 (2013) 1222–1235 1227
Jin et al. Dominant resistance to Bt cotton in bollworm
strain SCD-r1 and SCD (h = 0, Table S1). These data show
autosomal, recessive inheritance of resistance to Cry1Ac in
SCD-r1, confirming previous results with this strain (Yang
et al. 2009; Zhang et al. 2012b).
Dominance at different concentrations of Cry1Ac
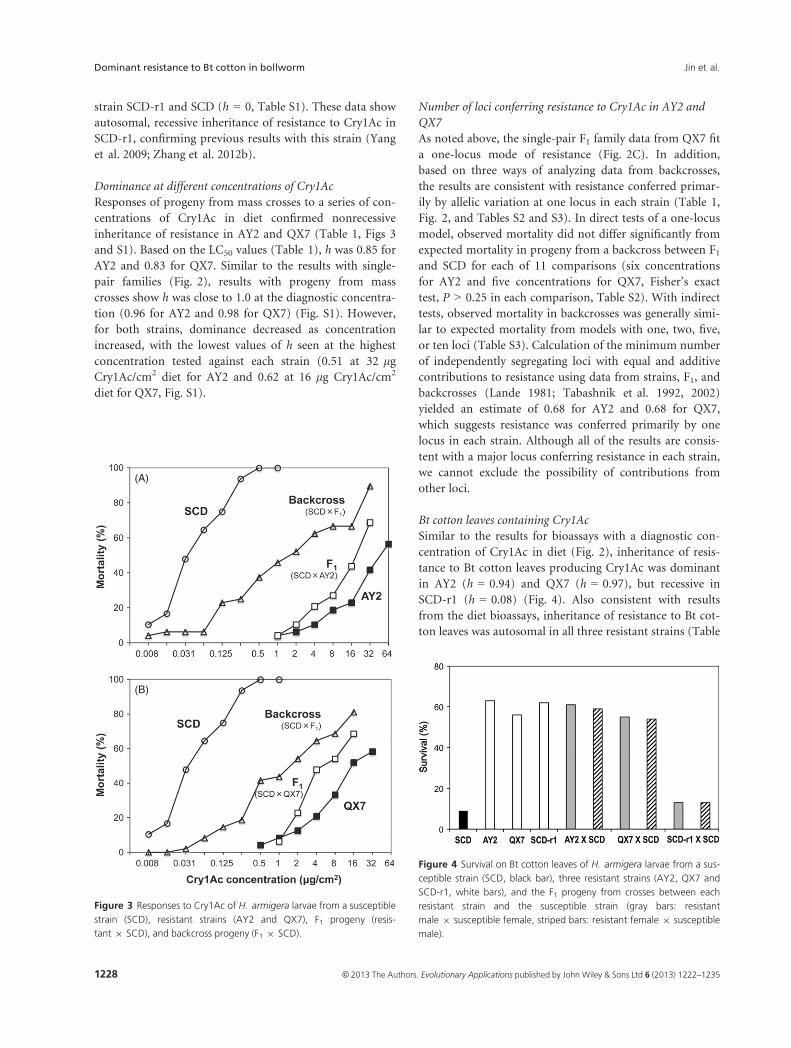
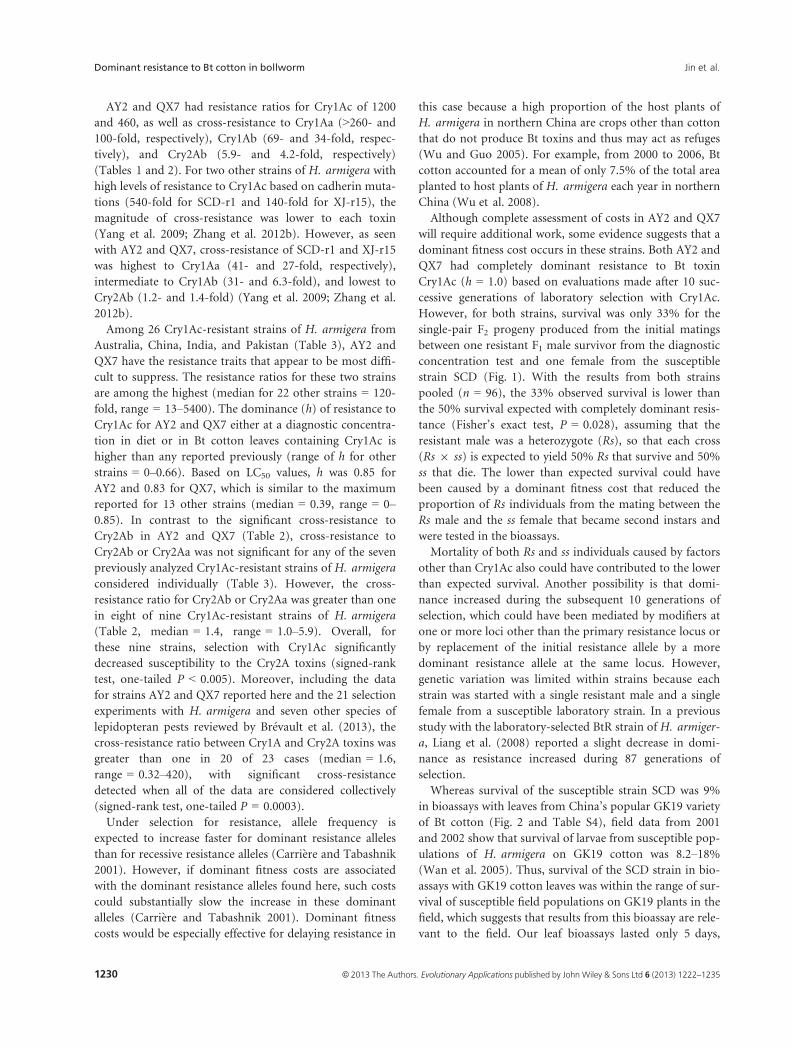
Responses of progeny from mass crosses to a series of con-
centrations of Cry1Ac in diet confirmed nonrecessive
inheritance of resistance in AY2 and QX7 (Table 1, Figs 3
and S1). Based on the LC50 values (Table 1), h was 0.85 for
AY2 and 0.83 for QX7. Similar to the results with single-
pair families (Fig. 2), results with progeny from mass
crosses show h was close to 1.0 at the diagnostic concentra-
tion (0.96 for AY2 and 0.98 for QX7) (Fig. S1). However,
for both strains, dominance decreased as concentration
increased, with the lowest values of h seen at the highest
concentration tested against each strain (0.51 at 32 lgCry1Ac/cm2 diet for AY2 and 0.62 at 16 lg Cry1Ac/cm2
diet for QX7, Fig. S1).
Number of loci conferring resistance to Cry1Ac in AY2 and
QX7
As noted above, the single-pair F1 family data from QX7 fit
a one-locus mode of resistance (Fig. 2C). In addition,
based on three ways of analyzing data from backcrosses,
the results are consistent with resistance conferred primar-
ily by allelic variation at one locus in each strain (Table 1,
Fig. 2, and Tables S2 and S3). In direct tests of a one-locus
model, observed mortality did not differ significantly from
expected mortality in progeny from a backcross between F1and SCD for each of 11 comparisons (six concentrations
for AY2 and five concentrations for QX7, Fisher’s exact
test, P > 0.25 in each comparison, Table S2). With indirect
tests, observed mortality in backcrosses was generally simi-
lar to expected mortality from models with one, two, five,
or ten loci (Table S3). Calculation of the minimum number
of independently segregating loci with equal and additive
contributions to resistance using data from strains, F1, and
backcrosses (Lande 1981; Tabashnik et al. 1992, 2002)
yielded an estimate of 0.68 for AY2 and 0.68 for QX7,
which suggests resistance was conferred primarily by one
locus in each strain. Although all of the results are consis-
tent with a major locus conferring resistance in each strain,
we cannot exclude the possibility of contributions from
other loci.
Bt cotton leaves containing Cry1Ac
Similar to the results for bioassays with a diagnostic con-
centration of Cry1Ac in diet (Fig. 2), inheritance of resis-
tance to Bt cotton leaves producing Cry1Ac was dominant
in AY2 (h = 0.94) and QX7 (h = 0.97), but recessive in
SCD-r1 (h = 0.08) (Fig. 4). Also consistent with results
from the diet bioassays, inheritance of resistance to Bt cot-
ton leaves was autosomal in all three resistant strains (Table
(A)
(B)
Figure 3 Responses to Cry1Ac of H. armigera larvae from a susceptible
strain (SCD), resistant strains (AY2 and QX7), F1 progeny (resis-
tant 9 SCD), and backcross progeny (F1 9 SCD).
Figure 4 Survival on Bt cotton leaves of H. armigera larvae from a sus-
ceptible strain (SCD, black bar), three resistant strains (AY2, QX7 and
SCD-r1, white bars), and the F1 progeny from crosses between each
resistant strain and the susceptible strain (gray bars: resistant
male 9 susceptible female, striped bars: resistant female 9 susceptible
male).
1228 © 2013 The Authors. Evolutionary Applications published by John Wiley & Sons Ltd 6 (2013) 1222–1235
Dominant resistance to Bt cotton in bollworm Jin et al.
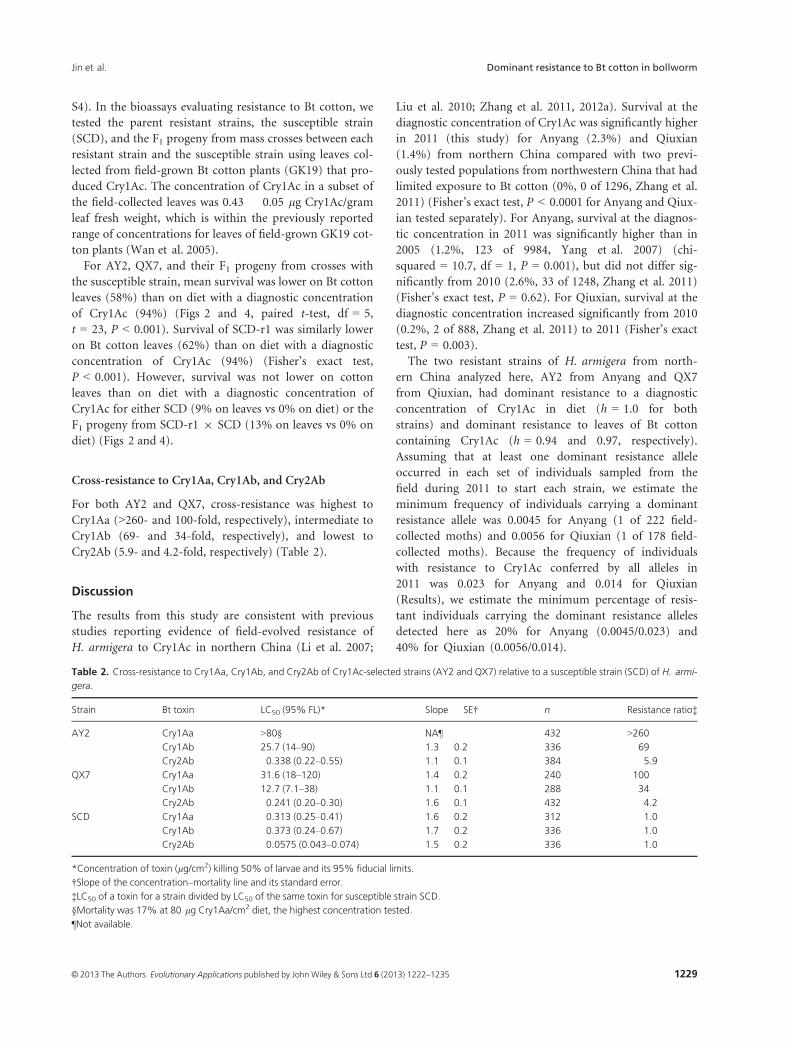
S4). In the bioassays evaluating resistance to Bt cotton, we
tested the parent resistant strains, the susceptible strain
(SCD), and the F1 progeny from mass crosses between each
resistant strain and the susceptible strain using leaves col-
lected from field-grown Bt cotton plants (GK19) that pro-
duced Cry1Ac. The concentration of Cry1Ac in a subset of
the field-collected leaves was 0.43 � 0.05 lg Cry1Ac/gram
leaf fresh weight, which is within the previously reported
range of concentrations for leaves of field-grown GK19 cot-
ton plants (Wan et al. 2005).
For AY2, QX7, and their F1 progeny from crosses with
the susceptible strain, mean survival was lower on Bt cotton
leaves (58%) than on diet with a diagnostic concentration
of Cry1Ac (94%) (Figs 2 and 4, paired t-test, df = 5,
t = 23, P < 0.001). Survival of SCD-r1 was similarly lower
on Bt cotton leaves (62%) than on diet with a diagnostic
concentration of Cry1Ac (94%) (Fisher’s exact test,
P < 0.001). However, survival was not lower on cotton
leaves than on diet with a diagnostic concentration of
Cry1Ac for either SCD (9% on leaves vs 0% on diet) or the
F1 progeny from SCD-r1 9 SCD (13% on leaves vs 0% on
diet) (Figs 2 and 4).
Cross-resistance to Cry1Aa, Cry1Ab, and Cry2Ab
For both AY2 and QX7, cross-resistance was highest to
Cry1Aa (>260- and 100-fold, respectively), intermediate to
Cry1Ab (69- and 34-fold, respectively), and lowest to
Cry2Ab (5.9- and 4.2-fold, respectively) (Table 2).
Discussion
The results from this study are consistent with previous
studies reporting evidence of field-evolved resistance of
H. armigera to Cry1Ac in northern China (Li et al. 2007;
Liu et al. 2010; Zhang et al. 2011, 2012a). Survival at the
diagnostic concentration of Cry1Ac was significantly higher
in 2011 (this study) for Anyang (2.3%) and Qiuxian
(1.4%) from northern China compared with two previ-
ously tested populations from northwestern China that had
limited exposure to Bt cotton (0%, 0 of 1296, Zhang et al.
2011) (Fisher’s exact test, P < 0.0001 for Anyang and Qiux-
ian tested separately). For Anyang, survival at the diagnos-
tic concentration in 2011 was significantly higher than in
2005 (1.2%, 123 of 9984, Yang et al. 2007) (chi-
squared = 10.7, df = 1, P = 0.001), but did not differ sig-
nificantly from 2010 (2.6%, 33 of 1248, Zhang et al. 2011)
(Fisher’s exact test, P = 0.62). For Qiuxian, survival at the
diagnostic concentration increased significantly from 2010
(0.2%, 2 of 888, Zhang et al. 2011) to 2011 (Fisher’s exact
test, P = 0.003).
The two resistant strains of H. armigera from north-
ern China analyzed here, AY2 from Anyang and QX7
from Qiuxian, had dominant resistance to a diagnostic
concentration of Cry1Ac in diet (h = 1.0 for both
strains) and dominant resistance to leaves of Bt cotton
containing Cry1Ac (h = 0.94 and 0.97, respectively).
Assuming that at least one dominant resistance allele
occurred in each set of individuals sampled from the
field during 2011 to start each strain, we estimate the
minimum frequency of individuals carrying a dominant
resistance allele was 0.0045 for Anyang (1 of 222 field-
collected moths) and 0.0056 for Qiuxian (1 of 178 field-
collected moths). Because the frequency of individuals
with resistance to Cry1Ac conferred by all alleles in
2011 was 0.023 for Anyang and 0.014 for Qiuxian
(Results), we estimate the minimum percentage of resis-
tant individuals carrying the dominant resistance alleles
detected here as 20% for Anyang (0.0045/0.023) and
40% for Qiuxian (0.0056/0.014).
Table 2. Cross-resistance to Cry1Aa, Cry1Ab, and Cry2Ab of Cry1Ac-selected strains (AY2 and QX7) relative to a susceptible strain (SCD) of H. armi-
gera.
Strain Bt toxin LC50 (95% FL)* Slope � SE† n Resistance ratio‡
AY2 Cry1Aa >80§ NA¶ 432 >260
Cry1Ab 25.7 (14–90) 1.3 � 0.2 336 69
Cry2Ab 0.338 (0.22–0.55) 1.1 � 0.1 384 5.9
QX7 Cry1Aa 31.6 (18–120) 1.4 � 0.2 240 100
Cry1Ab 12.7 (7.1–38) 1.1 � 0.1 288 34
Cry2Ab 0.241 (0.20–0.30) 1.6 � 0.1 432 4.2
SCD Cry1Aa 0.313 (0.25–0.41) 1.6 � 0.2 312 1.0
Cry1Ab 0.373 (0.24–0.67) 1.7 � 0.2 336 1.0
Cry2Ab 0.0575 (0.043–0.074) 1.5 � 0.2 336 1.0
*Concentration of toxin (lg/cm2) killing 50% of larvae and its 95% fiducial limits.
†Slope of the concentration–mortality line and its standard error.
‡LC50 of a toxin for a strain divided by LC50 of the same toxin for susceptible strain SCD.
§Mortality was 17% at 80 lg Cry1Aa/cm2 diet, the highest concentration tested.
¶Not available.
© 2013 The Authors. Evolutionary Applications published by John Wiley & Sons Ltd 6 (2013) 1222–1235 1229
Jin et al. Dominant resistance to Bt cotton in bollworm
AY2 and QX7 had resistance ratios for Cry1Ac of 1200
and 460, as well as cross-resistance to Cry1Aa (>260- and100-fold, respectively), Cry1Ab (69- and 34-fold, respec-
tively), and Cry2Ab (5.9- and 4.2-fold, respectively)
(Tables 1 and 2). For two other strains of H. armigera with
high levels of resistance to Cry1Ac based on cadherin muta-
tions (540-fold for SCD-r1 and 140-fold for XJ-r15), the
magnitude of cross-resistance was lower to each toxin
(Yang et al. 2009; Zhang et al. 2012b). However, as seen
with AY2 and QX7, cross-resistance of SCD-r1 and XJ-r15
was highest to Cry1Aa (41- and 27-fold, respectively),
intermediate to Cry1Ab (31- and 6.3-fold), and lowest to
Cry2Ab (1.2- and 1.4-fold) (Yang et al. 2009; Zhang et al.
2012b).
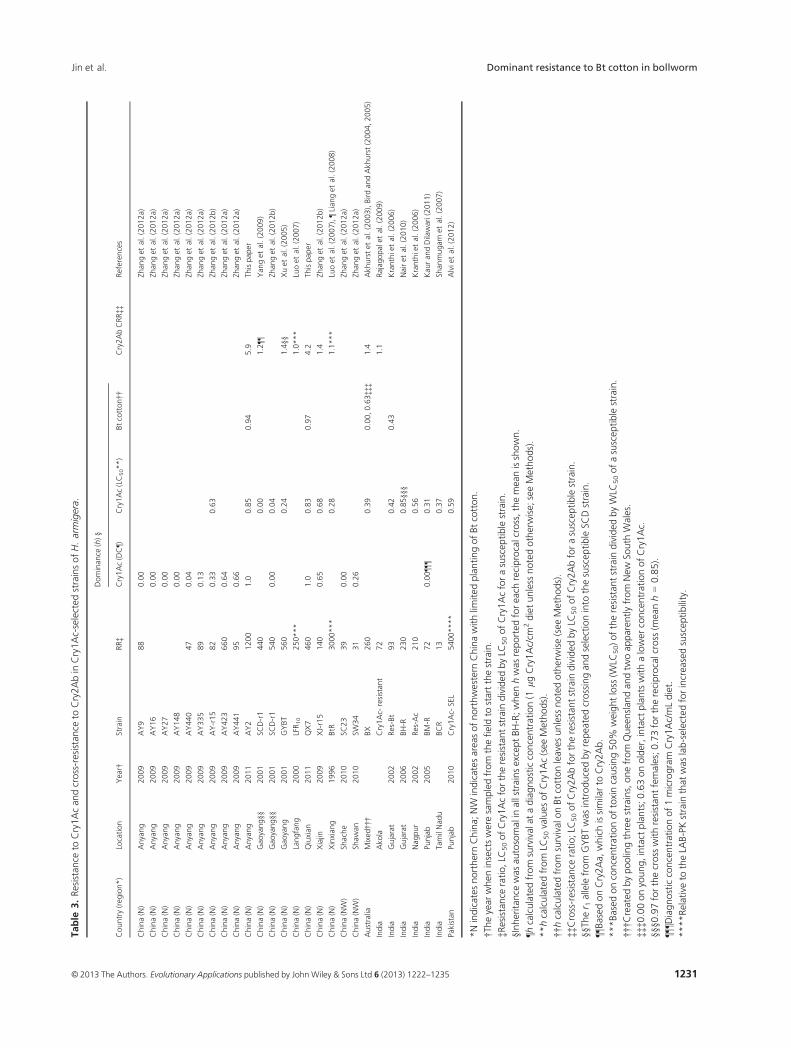
Among 26 Cry1Ac-resistant strains of H. armigera from
Australia, China, India, and Pakistan (Table 3), AY2 and
QX7 have the resistance traits that appear to be most diffi-
cult to suppress. The resistance ratios for these two strains
are among the highest (median for 22 other strains = 120-
fold, range = 13–5400). The dominance (h) of resistance to
Cry1Ac for AY2 and QX7 either at a diagnostic concentra-
tion in diet or in Bt cotton leaves containing Cry1Ac is
higher than any reported previously (range of h for other
strains = 0–0.66). Based on LC50 values, h was 0.85 for
AY2 and 0.83 for QX7, which is similar to the maximum
reported for 13 other strains (median = 0.39, range = 0–0.85). In contrast to the significant cross-resistance to
Cry2Ab in AY2 and QX7 (Table 2), cross-resistance to
Cry2Ab or Cry2Aa was not significant for any of the seven
previously analyzed Cry1Ac-resistant strains of H. armigera
considered individually (Table 3). However, the cross-
resistance ratio for Cry2Ab or Cry2Aa was greater than one
in eight of nine Cry1Ac-resistant strains of H. armigera
(Table 2, median = 1.4, range = 1.0–5.9). Overall, for
these nine strains, selection with Cry1Ac significantly
decreased susceptibility to the Cry2A toxins (signed-rank
test, one-tailed P < 0.005). Moreover, including the data
for strains AY2 and QX7 reported here and the 21 selection
experiments with H. armigera and seven other species of
lepidopteran pests reviewed by Br�evault et al. (2013), the
cross-resistance ratio between Cry1A and Cry2A toxins was
greater than one in 20 of 23 cases (median = 1.6,
range = 0.32–420), with significant cross-resistance
detected when all of the data are considered collectively
(signed-rank test, one-tailed P = 0.0003).
Under selection for resistance, allele frequency is
expected to increase faster for dominant resistance alleles
than for recessive resistance alleles (Carri�ere and Tabashnik
2001). However, if dominant fitness costs are associated
with the dominant resistance alleles found here, such costs
could substantially slow the increase in these dominant
alleles (Carri�ere and Tabashnik 2001). Dominant fitness
costs would be especially effective for delaying resistance in
this case because a high proportion of the host plants of
H. armigera in northern China are crops other than cotton
that do not produce Bt toxins and thus may act as refuges
(Wu and Guo 2005). For example, from 2000 to 2006, Bt
cotton accounted for a mean of only 7.5% of the total area
planted to host plants of H. armigera each year in northern
China (Wu et al. 2008).
Although complete assessment of costs in AY2 and QX7
will require additional work, some evidence suggests that a
dominant fitness cost occurs in these strains. Both AY2 and
QX7 had completely dominant resistance to Bt toxin
Cry1Ac (h = 1.0) based on evaluations made after 10 suc-
cessive generations of laboratory selection with Cry1Ac.
However, for both strains, survival was only 33% for the
single-pair F2 progeny produced from the initial matings
between one resistant F1 male survivor from the diagnostic
concentration test and one female from the susceptible
strain SCD (Fig. 1). With the results from both strains
pooled (n = 96), the 33% observed survival is lower than
the 50% survival expected with completely dominant resis-
tance (Fisher’s exact test, P = 0.028), assuming that the
resistant male was a heterozygote (Rs), so that each cross
(Rs 9 ss) is expected to yield 50% Rs that survive and 50%
ss that die. The lower than expected survival could have
been caused by a dominant fitness cost that reduced the
proportion of Rs individuals from the mating between the
Rs male and the ss female that became second instars and
were tested in the bioassays.
Mortality of both Rs and ss individuals caused by factors
other than Cry1Ac also could have contributed to the lower
than expected survival. Another possibility is that domi-
nance increased during the subsequent 10 generations of
selection, which could have been mediated by modifiers at
one or more loci other than the primary resistance locus or
by replacement of the initial resistance allele by a more
dominant resistance allele at the same locus. However,
genetic variation was limited within strains because each
strain was started with a single resistant male and a single
female from a susceptible laboratory strain. In a previous
study with the laboratory-selected BtR strain of H. armiger-
a, Liang et al. (2008) reported a slight decrease in domi-
nance as resistance increased during 87 generations of
selection.
Whereas survival of the susceptible strain SCD was 9%
in bioassays with leaves from China’s popular GK19 variety
of Bt cotton (Fig. 2 and Table S4), field data from 2001
and 2002 show that survival of larvae from susceptible pop-
ulations of H. armigera on GK19 cotton was 8.2–18%(Wan et al. 2005). Thus, survival of the SCD strain in bio-
assays with GK19 cotton leaves was within the range of sur-
vival of susceptible field populations on GK19 plants in the
field, which suggests that results from this bioassay are rele-
vant to the field. Our leaf bioassays lasted only 5 days,
1230 © 2013 The Authors. Evolutionary Applications published by John Wiley & Sons Ltd 6 (2013) 1222–1235
Dominant resistance to Bt cotton in bollworm Jin et al.
Table
3.Resistance
toCry1Acan
dcross-resistance
toCry2Abin
Cry1Ac-selected
strainsofH.armigera.
Country(reg
ion*)
Location
Year†
Strain
RR‡
Dominan
ce(h)§
Cry2AbCRR‡‡
Referen
ces
Cry1Ac(DC¶)
Cry1Ac(LC50**)
Btcotton††
China(N)
Anyang
2009
AY9
88
0.00
Zhan
get
al.(2012a)
China(N)
Anyang
2009
AY16
0.00
Zhan
get
al.(2012a)
China(N)
Anyang
2009
AY27
0.00
Zhan
get
al.(2012a)
China(N)
Anyang
2009
AY148
0.00
Zhan
get
al.(2012a)
China(N)
Anyang
2009
AY440
47
0.04
Zhan
get
al.(2012a)
China(N)
Anyang
2009
AY335
89
0.13
Zhan
get
al.(2012a)
China(N)
Anyang
2009
AY-r15
82
0.33
0.63
Zhan
get
al.(2012b)
China(N)
Anyang
2009
AY423
660
0.64
Zhan
get
al.(2012a)
China(N)
Anyang
2009
AY441
95
0.66
Zhan
get
al.(2012a)
China(N)
Anyang
2011
AY2
1200
1.0
0.85
0.94
5.9
Thispap
er
China(N)
Gao
yang§§
2001
SCD-r1
440
0.00
1.2¶¶
Yan
get
al.(2009)
China(N)
Gao
yang§§
2001
SCD-r1
540
0.00
0.04
Zhan
get
al.(2012b)
China(N)
Gao
yang
2001
GYBT
560
0.24
1.4§§
Xuet
al.(2005)
China(N)
Langfang
2000
LFR10
250***
1.0***
Luoet
al.(2007)
China(N)
Qiuxian
2011
QX7
460
1.0
0.83
0.97
4.2
Thispap
er
China(N)
Xiajin
2009
XJ-r15
140
0.65
0.68
1.4
Zhan
get
al.(2012b)
China(N)
Xinxian
g1996
BtR
3000***
0.28
1.1***
Luoet
al.(2007),¶Lian
get
al.(2008)
China(NW)
Shache
2010
SC23
39
0.00
Zhan
get
al.(2012a)
China(NW)
Shaw
an2010
SW34
31
0.26
Zhan
get
al.(2012a)
Australia
Mixed
†††
BX
260
0.39
0.00,0.63‡‡‡
1.4
Akh
urstet
al.(2003),Birdan
dAkh
urst(2004,2005)
India
Ako
laCry1Ac-
resistan
t72
1.1
Rajag
opalet
al.(2009)
India
Gujarat
2002
Res-Bt
93
0.42
0.43
Kranthietal.(2006)
India
Gujarat
2006
BH-R
230
0.85§§§
Nairet
al.(2010)
India
Nag
pur
2002
Res-Ac
210
0.56
Kranthietal.(2006)
India
Punjab
2005
BM-R
72
0.00¶¶¶
0.31
Kau
ran
dDilawari(2011)
India
TamilNad
uBCR
13
0.37
Shan
mugam
etal.(2007)
Pakistan
Punjab
2010
Cry1Ac-
SEL
5400****
0.59
Alvietal.(2012)
*Nindicates
northernChina;
NW
indicates
area
sofnorthwestern
Chinawithlim
ited
plantingofBtcotton.
†Theyear
when
insectsweresampledfrom
thefieldto
startthestrain.
‡Resistance
ratio,LC
50ofCry1Acfortheresistan
tstrain
divided
byLC
50ofCry1Acforasuscep
tiblestrain.
§Inheritan
cewas
autosomalin
allstrainsexceptBH-R;when
hwas
reported
forea
chreciprocalcross,themea
nisshown.
¶hcalculatedfrom
survivalat
adiagnosticconcentration(1
lgCry1Ac/cm
2dietunless
notedotherwise;
seeMethods).
**hcalculatedfrom
LC50values
ofCry1Ac(see
Methods).
††hcalculatedfrom
survivalonBtcottonleaves
unless
notedotherwise(see
Methods).
‡‡Cross-resistance
ratio;LC
50ofCry2Abfortheresistan
tstrain
divided
byLC
50ofCry2Abforasuscep
tiblestrain.
§§Th
er 1allelefrom
GYBTwas
introducedbyrepea
tedcrossingan
dselectioninto
thesuscep
tibleSC
Dstrain.
¶¶Based
onCry2Aa,
whichissimilarto
Cry2Ab.
***Based
onconcentrationoftoxincausing50%
weightloss
(WLC
50)oftheresistan
tstrain
divided
byWLC
50ofasuscep
tiblestrain.
†††C
reated
bypoolingthreestrains,onefrom
Quee
nslan
dan
dtw
oap
paren
tlyfrom
New
South
Wales.
‡‡‡0
.00onyoung,intact
plants;0.63onolder,intact
plantswithalower
concentrationofCry1Ac.
§§§0
.97forthecross
withresistan
tfemales;0.73forthereciprocalcross
(mea
nh=0.85).
¶¶¶D
iagnosticconcentrationof1microgram
Cry1Ac/mLdiet.
****Relativeto
theLA
B-PKstrain
that
was
lab-selectedforincrea
sedsuscep
tibility.
© 2013 The Authors. Evolutionary Applications published by John Wiley & Sons Ltd 6 (2013) 1222–1235 1231
Jin et al. Dominant resistance to Bt cotton in bollworm
which could boost survival relative to survival for longer
periods required for complete larval development in the
field. On the other hand, H. armigera larvae in the field eat
a variety of plant parts, some of which have a much lower
concentration of Cry1Ac than leaves, which could raise sur-
vival in the field relative to the leaf bioassays. In addition,
in the field, the concentration of Cry1Ac declines in Bt cot-
ton plants as they age (Wan et al. 2005), which increases
survival of H. armigera larvae (Bird and Akhurst 2004,
2005). In greenhouse experiments with 15-week-old Bt cot-
ton plants producing Cry1Ac, survival from neonate to
adult was 62% for an H. armigera strain with a Cry1Ac
resistance ratio of 97–440, 0% for a susceptible strain, and
39% for the F1 progeny of the resistant and susceptible
strain, which had a Cry1Ac resistance ratio of 2–4 (Bird
and Akhurst 2004, 2005). Similar to previous results with
the Cry1Ac-selected Res-Bt strain of H. armigera from
India (Kranthi et al. 2006) (Table 3), the results here with
AY2 and QX7 show that dominance of resistance to
Cry1Ac was similar whether measured in diet bioassays
with Cry1Ac or in bioassays using Bt cotton leaves produc-
ing Cry1Ac (Figs 2 and 4, Table 3).
The high levels of resistance to Cry1Ac (1200- and
460-fold) and lower but significant cross-resistance to
Cry2Ab (5.9- and 4.2-fold) of AY2 and QX7 raise con-
cern about their potential resistance to two-toxin Bt cot-
ton producing Cry1Ac and Cry2Ab. In bioassays with Bt
cotton leaves containing Cry1Ac and Cry2Ab, survival
was 13 times higher for the Cry1Ac-selected Res-Bt strain
of H. armigera (32%) relative to a susceptible strain
(2.4%) (Rajagopal et al. 2009), even though Res-Bt had
only 72-fold resistance to Cry1Ac and no cross-resistance
to Cry2Ab (Rajagopal et al. 2009). Similar results with
the closely related pest species Helicoverpa zea show that
survival from neonate to adult on Bt cotton producing
Cry1Ac and Cry2Ab was 11 times higher for the Cry1Ac-
selected GA-R strain (6.7%) relative to its unselected par-
ent strain (0.6%), even though resistance of GA-R rela-
tive to GA was only 10-fold to Cry1Ac and twofold to
Cry2Ab (Br�evault et al. 2013).
While Cry1Ac is the only Bt toxin produced by trans-
genic cotton grown in China, two-toxin Bt cotton produc-
ing Cry1Ac and Cry2Ab has become the sole type of Bt
cotton grown in Australia and the predominant type of Bt
cotton grown in India and the United States (Tabashnik
et al. 2013). An immediate switch in China to two-toxin Bt
cotton producing Cry1Ac and Cry2Ab would probably
slow the evolution of resistance to Bt cotton in H. armigera
and in another major lepidopteran pest, Pectinophora gos-
sypiella (Tabashnik et al. 2012). However, considering the
increasing frequency of resistance of H. armigera in China
to Cry1Ac and the concerns about an associated potential
increase in survival on Bt cotton producing Cry1Ac and
Cry2Ab described above, a shift to Bt cotton producing a
toxin other than Cry1Ac or Cry2Ab could be particularly
useful in China (Zhang et al. 2011).
Bt toxin Vip3Aa, which has no structural homology to
Cry toxins (Estruch et al. 1996), is promising for control-
ling H. armigera populations (An et al. 2010; Mahon et al.
2012). Commercial varieties of three-toxin Bt cotton pro-
ducing Vip3A, Cry1Ac, and Cry2Ab are under develop-
ment, with availability in Australia and the United States
expected in 2016 (Mahon et al. 2012). Susceptibility was
not correlated between Cry1Ac and Vip3Aa within the Anci
and Xiajin populations of H. armigera from northern
China, and susceptibility was negatively associated between
Cry1Ac and Vip3Aa across these two populations (An et al.
2010). In two Australian strains of H. armigera highly resis-
tant to Vip3Aa, the mean LC50 of Cry1Ac was similar to
that of a susceptible strain, while the mean LC50 of Cry2Ab
was about fivefold lower than for a susceptible strain (Ma-
hon et al. 2012). The frequency of recessive alleles confer-
ring resistance to Vip3A was estimated as 0.008 in
Australian populations of H. armigera, providing an indi-
cation of the potential for evolution of resistance to this
toxin (Mahon et al. 2012). In addition to increasing the
number and diversity of toxins in Bt cotton, integration of
Bt cotton with other control tactics could help to delay the
evolution of resistance and provide a more sustainable pest
management system (Tabashnik et al. 2010).
Acknowledegments
This work was funded by research grants from the Ministry
of Agriculture of China (Grant 2013ZX08012-004), the
National Natural Science Foundation of China (Grant
31071983), and the 111 program (Grant B07030).
Data archiving statement
Raw data for this study are available as Supporting Infor-
mation (Tables S1–S4) attached to the online version of the
article.
Literature cited
Akhurst, R. J., W. James, L. J. Bird, and C. Beard 2003. Resistance to the
Cry1Ac d-endotoxin of Bacillus thuringiensis in the cotton bollworm,
Helicoverpa armigera (Lepidoptera: Noctuidae). Journal of Economic
Entomology 96:1290–1299.
Alcantara, E., A. Estrada, V. Alpuerto, and G. Head 2011. Monitoring
Cry1Ab susceptibility in Asian corn borer (Lepidoptera: Crambidae)
on Bt corn in the Philippines. Crop Protection 30:554–559.
Alvi, A. H. K., A. H. Sayyed, M. Naeem, and M. Ali 2012. Field
evolved resistance in Helicoverpa armigera (Lepidoptera: Noctui-
dae) to Bacillus thuringiensis toxin Cry1Ac in Pakistan. PLoS
ONE 7:e47309.
1232 © 2013 The Authors. Evolutionary Applications published by John Wiley & Sons Ltd 6 (2013) 1222–1235
Dominant resistance to Bt cotton in bollworm Jin et al.
An, J. J., Y. L. Gao, K. M. Wu, F. Gould, J. H. Gao, Z. C. Shen, and C. L.
Lei 2010. Vip3Aa tolerance response of Helicoverpa armigera popula-
tions from a Cry1Ac cotton planting region. Journal of Economic
Entomology 103:2169–2173.
Bird, L. J., and R. J. Akhurst 2004. Relative fitness of Cry1A-resistant and
-susceptible Helicoverpa armigera (Lepidoptera: Noctuidae) on con-
ventional and transgenic cotton. Journal of Economic Entomology
97:1699–1709.
Bird, L. J., and R. J. Akhurst 2005. Fitness of Cry1A-resistant and -sus-
ceptible Helicoverpa armigera (Lepidoptera: Noctuidae) on transgenic
cotton with reduced levels of Cry1Ac. Journal of Economic Entomol-
ogy 98:1311–1319.
Br�evault, T., S. Heuberger, M. Zhang, C. Ellers-Kirk, X. Ni, L. Masson,
X. Li et al. 2013. Potential shortfall of pyramided transgenic cotton
for insect resistance management. Proceedings of the National Acad-
emy of Sciences USA 110:5806–5811.
Carpenter, J. E. 2010. Peer-reviewed surveys indicate positive impact of
commercialized GM crops. Nature Biotechnology 28:319–321.
Carri�ere, Y., and B. E. Tabashnik 2001. Reversing insect adaptation to
transgenic insecticidal plants. Proceedings of the Royal Society of Lon-
don. Series B, Biological Sciences 268:1475–1480.
Dhurua, S., and G. T. Gujar 2011. Field-evolved resistance to Bt toxin
Cry1Ac in the pink bollworm, Pectinophora gossypiella (Saunders)
(Lepidoptera: Gelechiidae), from India. Pest Management Science
67:898–903.
Downes, S., T. Parker, and R. Mahon 2010. Incipient resistance of Heli-
coverpa punctigera to the Cry2Ab Bt toxin in Bollgard II� cotton. PLoS
ONE 5:e12567.
Edgerton, M. D. 2012. Transgenic insect resistance traits increase corn
yield and yield stability. Nature Biotechnology 30:493–496.
Estruch, J., G. Warren, M. Mullins, G. Nye, and J. K. Craig 1996. Vip3A,
a novel Bacillus thuringiensis vegetative insecticidal protein with a
wide spectrum of activities agrainst lepidopteran insects. Proceedings
of the National Academy of Sciences USA 93:5389–5394.
Ferr�e, J., and J. Van Rie 2002. Biochemistry and genetics of insect resis-
tance to Bacillus thuringiensis. Annual Review of Entomology 47:501–
533.
Gassmann, A. J., J. L. Petzold-Maxwell, R. S. Keweshan, and M. W. Dun-
bar 2011. Field-evolved resistance to Bt maize by western corn root-
worm. PLoS ONE 6:e22629.
Gould, F. 1998. Sustainability of transgenic insecticidal cultivars: inte-
grating pest genetics and ecology. Annual Review of Entomology
43:701–726.
Huang, F. N., M. N. Ghimire, B. R. Leonard, C. Daves, R. Levy, and J.
Baldwin 2012. Extended monitoring of resistance to Bacillus thuringi-
ensis Cry1Ab maize in Diatraea saccharalis (Lepidoptera: Crambidae).
GM Crops and Food 3:245–254.
Hutchison, W. D., E. C. Burkness, P. D. Mitchell, R. D. Moon, T. W.
Leslie, S. J. Fleischer, M. Abrahamson et al. 2010. Areawide suppres-
sion of European corn borer with Bt maize reaps savings to non-Bt
maize growers. Science 330:222–225.
James, C. 2012. Global Status of Commercialized Biotech/GM Crops:
2012. ISAAA Brief No. 44. ISAAA, Ithaca, NY.
Janmaat, A. F., and J. Myers 2003. Rapid evolution and the cost of resis-
tance to Bacillus thuringiensis in greenhouse populations of cabbage
loopers, Trichoplusia ni. Proceedings of the Royal Society of London.
Series B, Biological Sciences 270:2263–2270.
Kathage, J. K., and M. Qaim 2012. Economic impacts and impact
dynamics of Bt (Bacillus thuringiensis) cotton in India. Proceedings of
the National Academy of Sciences USA 109:11652–11656.
Kaur, P., and V. K. Dilawari 2011. Inheritance of resistance to Bacillus
thuringiensis Cry1Ac toxin in Helicoverpa armigera (H€ubner) (Lepi-
doptera: Noctuidae) from India. Pest Management Science 67:1294–
1302.
Kranthi, K. R., C. S. Dhawad, S. R. Naidu, K. Mate, G. T. Behere, R. M.
Wadaskar, and S. Kranthi 2006. Inheritance of resistance in Indian
Helicoverpa armigera (H€ubner) to Cry1Ac toxin of Bacillus thuringien-
sis. Crop Protection 25:119–124.
Lande, R. 1981. The number of genes contributing to quantitative varia-
tion between and within populations. Genetics 99:541–553.
LeOra Software. 2002. Polo Plus, a user’s guide to probit and logit analy-
sis. LeOra Software, Berkeley, CA.
Li, G. P., K. M. Wu, F. Gould, J. K. Wang, J. Miao, X. W. Gao, and Y. Y.
Guo 2007. Increasing tolerance to Cry1Ac cotton from cotton boll-
worm, Helicoverpa armigera, was confirmed in Bt cotton farming area
of China. Ecological Entomology 32:366–375.
Li, G. P., H. Q. Feng, Y. L. Gao, K. A. C. Wyckhuys, and K. M. Wu 2010.
Frequency of Bt resistance alleles in Helicoverpa armigera in the Xinji-
ang cotton-planting region of China. Environmental Entomology
39:1698–1704.
Liang, G. M., K. M. Wu, H. K. Yu, K. K. Li, X. Feng, and Y. Y. Guo 2008.
Changes of inheritance mode and fitness in Helicoverpa armigera
(H€ubner) (Lepidoptera: Noctuidae) along with its resistance evolution
to Cry1Ac toxin. Journal of Invertebrate Pathology 97:142–149.
Liu, Y., and B. E. Tabashnik 1997. Inheritance of resistance to the Bacil-
lus thuringiensis toxin Cry1C in the diamondback moth. Applied and
Environmental Microbiology 63:2218–2223.
Liu, F. Y., Z. P. Xu, Y. C. Zhu, F. N. Huang, Y. H. Wang, H. L. Li, H. Li
et al. 2010. Evidence of field-evolved resistance to Cry1Ac-expressing
Bt cotton in Helicoverpa armigera (Lepidoptera: Noctuidae) in north-
ern China. Pest Management Science 66:155–161.
Lu, Y. H., K. M. Wu, Y. Y. Jiang, Y. Y. Guo, and N. Desneux 2012. Wide-
spread adoption of Bt cotton and insecticide decrease promotes bio-
control services. Nature 487:362–365.
Luo, S. D., K. M. Wu, Y. Tian, G. M. Liang, X. Feng, J. Zhang, and Y. Y.
Guo 2007. Cross-resistance studies of Cry1Ac-resistant strains of Heli-
coverpa armigera (Lepidoptera: Noctuidae) to Cry2Ab. Journal of Eco-
nomic Entomology 100:909–915.
Luttrell, R. G., I. Ali, K. C. Allen, S. Y. Young III, A. Szalanski, K.
Williams, G. Lorenz et al. 2004. Resistance to Bt in Arkansas pop-
ulations of cotton bollworm. In D. A. Richter, ed. Proceedings,
2004 Beltwide Cotton Conferences, 5–9 January 2004, San Anto-
nio, TX, pp. 1373–1383. National Cotton Council of America,
Memphis, TN.
Mahon, R. J., K. M. Olsen, K. A. Garsia, and S. R. Young 2007. Resis-
tance to Bacillus thuringiensis toxin Cry2Ab in a strain of Helicoverpa
armigera (Lepidoptera: Noctuidae) in Australia. Journal of Economic
Entomology 100:894–902.
Mahon, R. J., S. J. Downes, and B. James 2012. Vip3A resistance alleles
exist at high levels in Australian targets before release of cotton
expressing this toxin. PLoS ONE 7:e39192.
Mendelsohn, M., J. Kough, Z. Vaituzis, and K. Matthews 2003. Are Bt
crops safe? Nature Biotechnology 21:1003–1009.
Nair, R., V. Kalia, K. K. Aggarwal, and G. T. Gujar 2010. Inheritance of
Cry1Ac resistance and associated biological traits in the cotton boll-
worm, Helicoverpa armigera (Lepidoptera: Noctuidae). Journal of
Invertebrate Pathology 104:31–38.
National Research Council. 2010. The Impact of Genetically Engineered
Crops on Farm Sustainability in the United States. National Acade-
mies Press, Washington, DC.
© 2013 The Authors. Evolutionary Applications published by John Wiley & Sons Ltd 6 (2013) 1222–1235 1233
Jin et al. Dominant resistance to Bt cotton in bollworm
Pardo-L�opez, L., M. Sober�on, and A. Bravo 2013. Bacillus thuringiensis
insecticidal three-domain toxins: mode of action, insect resistance and
consequences for crop protection. FEMS Microbiology Reviews 37:3–
22.
Payton, M. E., M. H. Greenstone, and N. Schenker 2003. Overlapping
confidence intervals or standard error intervals: what do they mean in
terms of statistical significance? Journal of Insect Science 3:34.
Rajagopal, R., N. Arora, S. Sivakumar, N. G. Rao, S. A. Nimbalkar, and
R. K. Bhatnagar 2009. Resistance of Helicoverpa armigera to Cry1Ac
toxin from Bacillus thuringiensis is due to improper processing of the
protoxin. Journal of Biological Chemistry 419:309–316.
Sanahuja, G., R. Banakar, R. Twyman, T. Capell, and P. Christou 2011.
Bacillus thuringiensis: a century of research, development and com-
mercial applications. Plant Biotechnology Journal 9:283–300.
Shanmugam, P. S., R. Balagurunathan, N. Sathiah, and N. G. V. Rao
2007. Inheritance and cross-resistance of Bacillus thuringiensis insecti-
cidal crystal protein Cry1Ac resistance in cotton bollworm Helicoverpa
armigera (H€ubner) population from Tamil Nadu, India. Journal of
Pest Science 80:175–181.
Stone, B. F. 1968. A formula for determining degree of dominance in
cases of monofactorial inheritance of resistance to chemicals. Bulletin
of the World Health Organization 38:325–326.
Storer, N. P., J. M. Babcock, M. Schlenz, T. Meade, G. D. Thompson, J.
W. Bing, and R. M. Huckaba 2010. Discovery and characterization of
field resistance to Bt maize: Spodoptera frugiperda (Lepidoptera: Noc-
tuidae) in Puerto Rico. Journal of Economic Entomology 103:1031–
1038.
Tabashnik, B. E. 1994. Evolution of resistance to Bacillus thuringiensis.
Annual Review of Entomology 39:47–79.
Tabashnik, B. E., N. L. Cushing, and M. W. Johnson 1987. Diamondback
moth (Lepidoptera: Plutellidae) resistance to insecticides in Hawaii:
intra-island variation and cross-resistance. Journal of Economic Ento-
mology 80:1091–1099.
Tabashnik, B. E., N. L. Cushing, N. Finson, and M. W. Johnson 1990.
Field development of resistance to Bacillus thuringiensis in diamond-
back moth (Lepidoptera: Plutellidae). Journal of Economic Entomol-
ogy 83:1671–1676.
Tabashnik, B. E., J. M. Schwartz, N. Finson, and M. W. Johnson 1992.
Inheritance of resistance to Bacillus thuringiensis in diamondback
moth (Lepidoptera: Plutellidae). Journal of Economic Entomology
85:1046–1055.
Tabashnik, B. E., Y. B. Liu, T. J. Dennehy, M. A. Sims, M. S. Sisterson, R.
W. Biggs, and Y. Carri�ere 2002. Inheritance of resistance to Bt toxin
Cry1Ac in a field-derived strain of pink bollworm (Lepidoptera: Gele-
chiidae). Journal of Economic Entomology 95:1018–1026.
Tabashnik, B. E., F. Gould, and Y. Carri�ere 2004. Delaying evolution of
insect resistance to transgenic crops by decreasing dominance and
heritability. Journal of Evolutionary Biology 17:904–912.
Tabashnik, B. E., A. J. Gassmann, D. W. Crowder, and Y. Carri�ere 2008.
Insect resistance to Bt crops: evidence versus theory. Nature Biotech-
nology 26:199–202.
Tabashnik, B. E., G. C. Unnithan, L. Masson, D. W. Crowder, X. Li,
and Y. Carri�ere 2009a. Asymmetrical cross-resistance between Bacil-
lus thuringiensis toxins Cry1Ac and Cry2Ab in pink bollworm. Pro-
ceedings of the National Academy of Sciences USA 106:11889–
11984.
Tabashnik, B. E., J. B. J. Van Rensburg, and Y. Carri�ere 2009b. Field-
evolved insect resistance to Bt crops: definition, theory, and data.
Journal of Economic Entomology 102:2011–2025.
Tabashnik, B. E., M. S. Sisterson, P. C. Ellsworth, T. J. Dennehy, L. Antil-
la, L. Liesner, M. Whitlow et al. 2010. Suppressing resistance to Bt
cotton with sterile insect releases. Nature Biotechnology 28:1304–
1307.
Tabashnik, B. E., K. Wu, and Y. Wu 2012. Early detection of field-
evolved resistance to Bt cotton in China: cotton bollworm and pink
bollworm. Journal of Invertebrate Pathology 110:301–306.
Tabashnik, B. E., T. Br�evault, and Y. Carri�ere 2013. Insect resistance to
Bt crops: lessons from the first billion acres. Nature Biotechnology
31:510–521.
Van Rensburg, J. 2007. First report of field resistance by stem borer,
Busseola fusca (Fuller) to Bt-transgenic maize. South African Journal
of Plant and Soil 24:147–151.
Wan, P., Y. J. Zhang, K. M. Wu, and M. S. Huang 2005. Seasonal expres-
sion profiles of insecticidal protein and control efficacy against Heli-
coverpa armigera for Bt cotton in the Yangtze River valley of China.
Journal of Economic Entomology 98:195–201.
Wan, P., Y. X. Huang, H. H. Wu, M. S. Huang, S. B. Cong, B. E. Tabash-
nik, and K. M. Wu 2012. Increased frequency of pink bollworm resis-
tance to Bt toxin Cry1Ac in China. PLoS ONE 7:e29975.
Wu, K. M., and Y. Y. Guo 2005. The evolution of cotton pest manage-
ment practices in China. Annual Review of Entomology 50:31–52.
Wu, K., Y. Y. Guo, and N. Lv 1999. Geographic variation in susceptibil-
ity of Helicoverpa armigera (Lepidoptera: Noctuidae) to Bacillus thur-
ingiensis insecticidal protein in China. Journal of Economic
Entomology 92:273–278.
Wu, K. M., Y. H. Lu, H. Q. Feng, Y. Y. Jiang, and J. Z. Zhao 2008. Sup-
pression of cotton bollworm in multiple crops in China in areas with
Bt toxin-containing cotton. Science 321:1676–1678.
Xu, X. J., L. Y. Yu, and Y. D. Wu 2005. Disruption of a cadherin gene
associated with resistance to Cry1Ac d-endotoxin of Bacillus thuringi-
ensis in Helicoverpa armigera. Applied and Environmental Microbiol-
ogy 71:948–954.
Yang, Y. J., H. Y. Chen, Y. D. Wu, Y. H. Yang, and S. W. Wu
2007. Mutated cadherin alleles from a field population of
Helicoverpa armigera confer resistance to Bacillus thuringiensis
toxin Cry1Ac. Applied and Environmental Microbiology 73:6939–
6944.
Yang, Y. H., Y. J. Yang, W. Y. Gao, J. J. Guo, Y. H. Wu, and Y. D. Wu
2009. Introgression of a disrupted cadherin gene enables susceptible
Helicoverpa armigera to obtain resistance to Bacillus thuringiensis toxin
Cry1Ac. Bulletin of Entomological Research 99:175–181.
Zhang, H. N., W. Yin, J. Zhao, L. Jin, Y. H. Yang, S. W. Wu, B. E. Ta-
bashnik et al. 2011. Early warning of cotton bollworm resistance asso-
ciated with intensive planting of Bt cotton in China. PLoS ONE 6:
e22874.
Zhang, H. N., W. Tian, J. Zhao, L. Jin, J. Yang, C. H. Liu, Y. H. Yang
et al. 2012a. Diverse genetic basis of field-evolved resistance to Bt cot-
ton in cotton bollworm from China. Proceedings of the National
Academy of Sciences USA 109:10275–10280.
Zhang, H. N., S. W. Wu, Y. H. Yang, B. E. Tabashnik, and Y. D. Wu
2012b. Non-recessive Bt toxin resistance conferred by an intracellular
cadherin mutation in field-selected populations of cotton bollworm.
PLoS ONE 7:e53418.
Zhao, J.-Z., J. Cao, H. L. Collins, S. L. Bates, R. T. Roush, E. D. Earle,
and A. M. Shelton 2005. Concurrent use of transgenic plants express-
ing a single and two Bacillus thuringiensis genes speeds insect adapta-
tion to pyramided plants. Proceedings of the National Academy of
Sciences USA 102:8426–8430.
1234 © 2013 The Authors. Evolutionary Applications published by John Wiley & Sons Ltd 6 (2013) 1222–1235
Dominant resistance to Bt cotton in bollworm Jin et al.
Supporting Information
Additional Supporting Information may be found in the online version
of this article:
Figure S1. Dominance (h) of resistance in AY2 and QX7 strains of
H. armigera at different concentrations of Cry1Ac.
Table S1. Dominance of resistance to a diagnostic concentration of
Cry1Ac (1 lg Cry1Ac/cm2 diet) in three resistant strains of H. armigera
(see Methods for details).
Table S2. Direct tests show no significant difference between observed
mortality and mortality expected from a one-locus model for backcross
progeny tested against Cry1Ac in diet.
Table S3. Indirect tests for fit between observed mortality and mortal-
ity expected from models with 1, 2, 5 or 10 loci for backcross progeny
tested against Cry1Ac in diet.
Table S4. Dominance of resistance to Bt cotton leaves
(0.43 lg � 0.05 lg Cry1Ac/g leaf fresh weight) in three resistant strains
of H. armigera (see Methods for details).
© 2013 The Authors. Evolutionary Applications published by John Wiley & Sons Ltd 6 (2013) 1222–1235 1235
Jin et al. Dominant resistance to Bt cotton in bollworm