Embed Size (px)
Citation preview

Domestic Tourism
Survey, 2016
Dr Pali Lehohla
Statistician-General
#StatsSA #Tourism

DTS
Demographic information
Day trips taken inside South Africa
Main destinations
Reasons for travelling
Modes of transport used
Overnight trips taken inside South Africa
Living Standard Measure
Information Gathered

The DTS 2016 findings reflect a general pattern of decline in domestic tourism over the past two years as associated with economic stagnation and re-prioritisation of consumer spending that has taken place in the country during that time.

4,4m
6,2m
0,0
1,0
2,0
3,0
4,0
5,0
6,0
7,0
Q1 Q2 Q3 Q4 Q1 Q2 Q3 Q4 Q1 Q2 Q3 Q4 Q1 Q2 Q3 Q4 Q1 Q2 Q3 Q4 Q1 Q2 Q3 Q4 Q1 Q2 Q3 Q4 Q1 Q2 Q3 Q4 Q1 Q2 Q3 Q4 Q1 Q2
2008 2009 2010 2011 2012 2013 2014 2015 2016 2017
Mill
ion
Number of unemployed
57,0%
67,2%
10,0
30,0
50,0
70,0
90,0
Q1 Q2 Q3 Q4 Q1 Q2 Q3 Q4 Q1 Q2 Q3 Q4 Q1 Q2 Q3 Q4 Q1 Q2 Q3 Q4 Q1 Q2 Q3 Q4 Q1 Q2 Q3 Q4 Q1 Q2 Q3 Q4 Q1 Q2 Q3 Q4 Q1 Q2
2008 2009 2010 2011 2012 2013 2014 2015 2016 2017
Long term unemployment
Labour Market Dashboard
Source: QLFS Q2 2017
Increasing number of unemployed persons were witnessed during 2008 to 2015
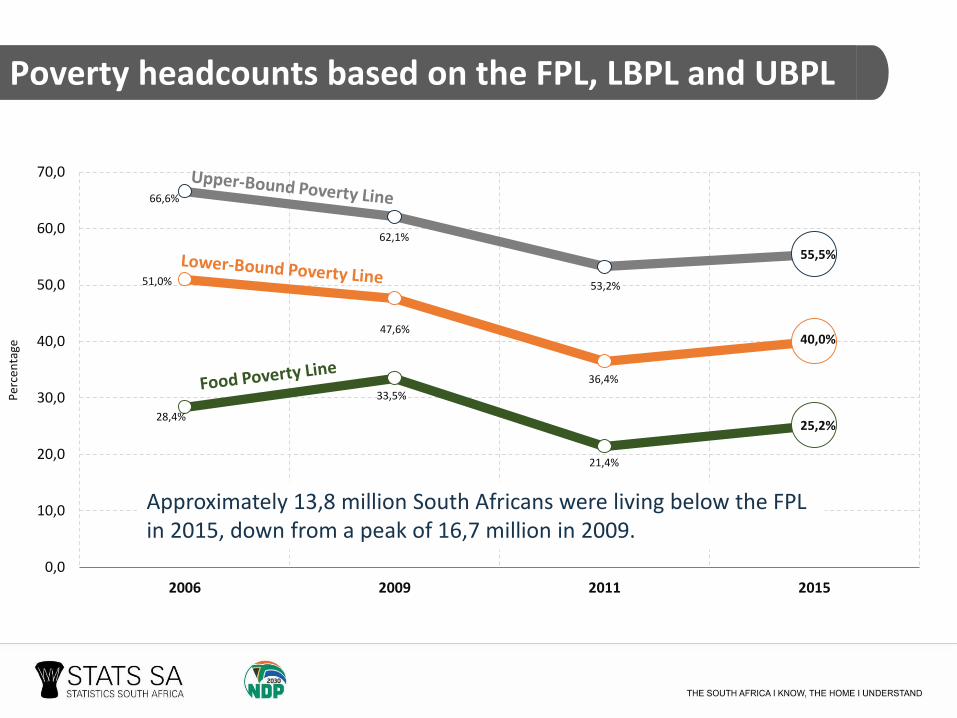
28,4%
33,5%
21,4%
25,2%
51,0%
47,6%
36,4%
40,0%
66,6%
62,1%
53,2%
55,5%
0,0
10,0
20,0
30,0
40,0
50,0
60,0
70,0
2006 2009 2011 2015
Per
cen
tage
Approximately 13,8 million South Africans were living below the FPL in 2015, down from a peak of 16,7 million in 2009.
Poverty headcounts based on the FPL, LBPL and UBPL

Findings of the DTS 2016

Day
44,3m 39,4m
Overnight
45,4m
43,0m
0
10
20
30
40
50
60
2015 2016
Day Overnight
A general pattern of decline in domestic
tourism for both day and overnight tripsis observed from 2015 to 2016
Total number of trips (million), 2015 – 2016
Day tripA trip outside of the usual environment, where one leaves and returns within the same day (i.e. do not stay overnight).
Overnight tripA trip outside of one’s usual environment where one night or more is spent away from the usual environment.
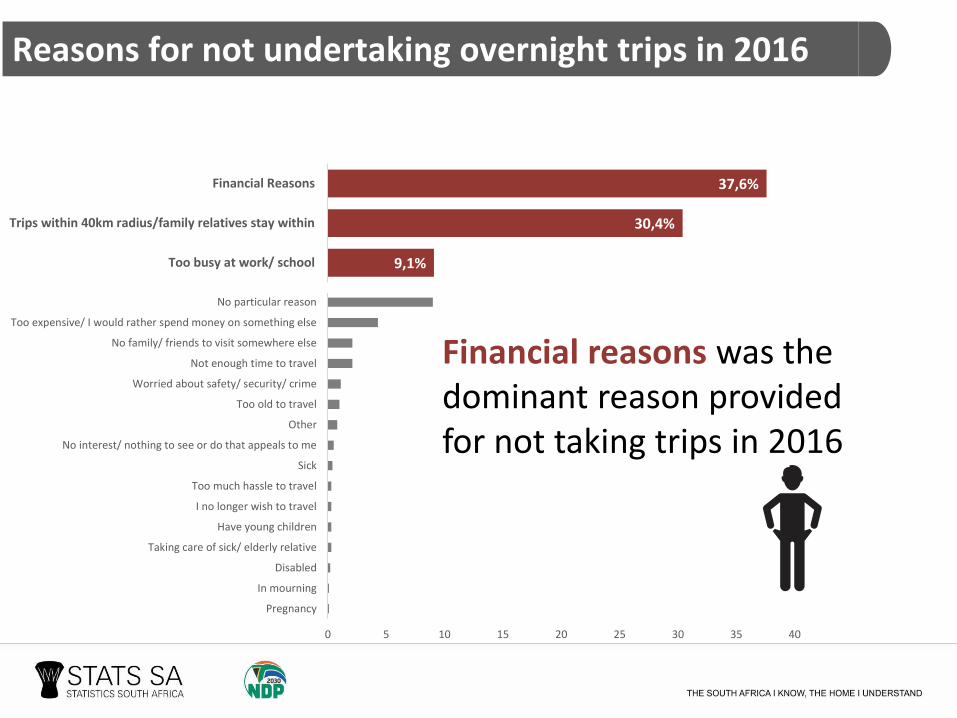
Reasons for not undertaking overnight trips in 2016
9,1%
30,4%
37,6%
0 5 10 15 20 25 30 35 40
Pregnancy
In mourning
Disabled
Taking care of sick/ elderly relative
Have young children
I no longer wish to travel
Too much hassle to travel
Sick
No interest/ nothing to see or do that appeals to me
Other
Too old to travel
Worried about safety/ security/ crime
Not enough time to travel
No family/ friends to visit somewhere else
Too expensive/ I would rather spend money on something else
No particular reason
Too busy at work/ school
Trips within 40km radius/family relatives stay within
Financial Reasons
Financial reasons was the dominant reason provided for not taking trips in 2016
9,1%
30,4%
37,6%
Too busy at work/ school
Trips within 40km radius/family relatives stay within
Financial Reasons

Most recent trips has seen a decline in both day and overnight trips between 2015 and 2016
18,5 million
16,2 million
28,0 million 26,0 million
0
5
10
15
20
25
30
2015 2016
Day Overnight
Most recent day and overnight trips, 2015 – 2016

9,1
9,1
8,78,3
8,6 8,5
6,9
7,9
7,1
7,0
6,9
11,8
8,5
9,3
7,28,2
8,7
9,3
7,7
7,0
7,3
7,1
8,0
11,8
4,0
6,0
8,0
10,0
12,0
14,0
16,0
Jan Feb Mar Apr May Jun Jul Aug Sept Oct Nov Dec
Perc
enta
ge
The number of day trips decreased from 44 million in 2015 to 39 million in 2016.
Total number of day trips taken by month (per cent), 2015 – 2016
2015
A drop in day trips can be seen during March 2016.
Day trips remained the same during the December holiday
period
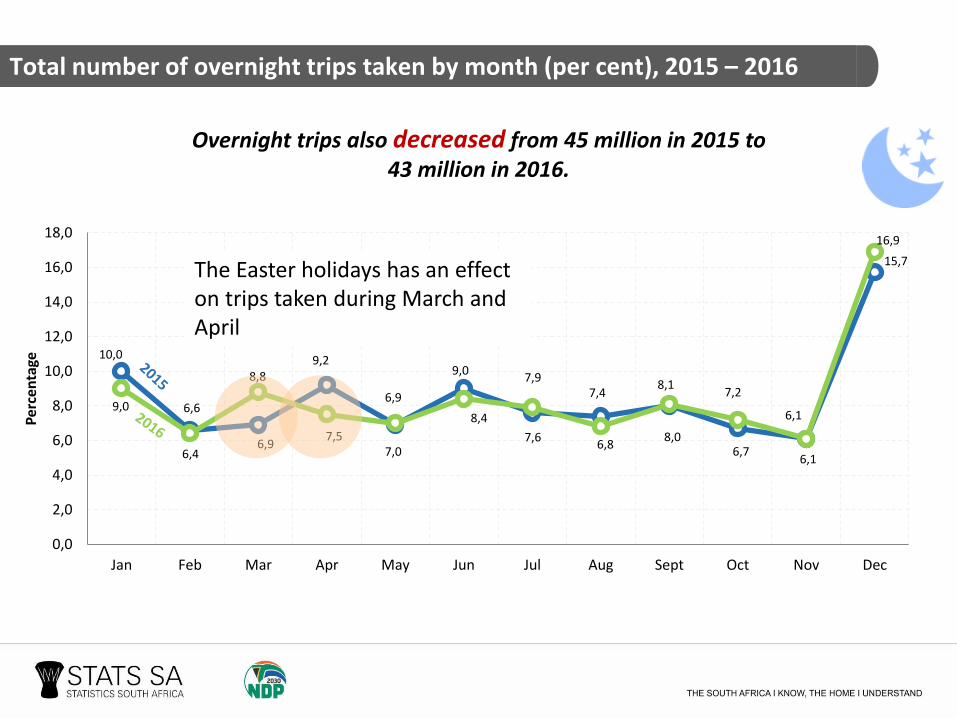
10,0
6,6
6,9
9,2
6,9
9,0
7,6
7,4
8,06,7
6,1
15,7
9,0
6,4
8,8
7,57,0
8,4
7,9
6,8
8,17,2
6,1
16,9
0,0
2,0
4,0
6,0
8,0
10,0
12,0
14,0
16,0
18,0
Jan Feb Mar Apr May Jun Jul Aug Sept Oct Nov Dec
Per
cen
tage
The Easter holidays has an effect on trips taken during March and April
Overnight trips also decreased from 45 million in 2015 to 43 million in 2016.
Total number of overnight trips taken by month (per cent), 2015 – 2016

-70
3
-24
-75
5
84
-57
2
-1000
-500
0
500
1000
January February March April May June July August September October November December
-94
0
-1000
-500
0
500
1000
January February March April May June July August September October November December
Change in Day Trips between 2015 and 2016
Change in Overnight Trip between 2015 and 2016
A general decline is noticed across most months for day and overnight trips

The decline in trips taken varies by
LSM group

Day Trip 2015 and 2016 by LSM Group (millions)
39 million day trips were taken between January and December 2016.
9,4%
44,1%46,6%
6,9%
47,5%45,6%
0,0
5,0
10,0
15,0
20,0
25,0
30,0
35,0
40,0
45,0
50,0
LSM 1 - 4 LSM 5 - 7 LSM 8 - 10
2015 2016
In 2015, individuals from LSM group 8-10 undertook the most number of day trips (46,6%) whereas in 2016, it was those in LSM group 5-7 with 47,5%
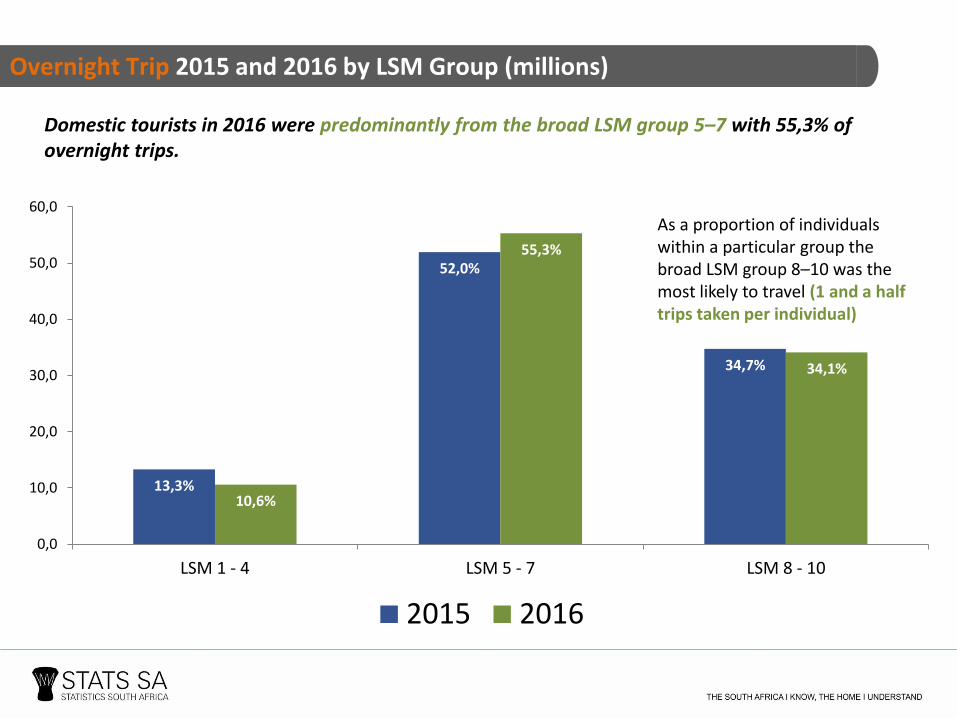
Overnight Trip 2015 and 2016 by LSM Group (millions)
Domestic tourists in 2016 were predominantly from the broad LSM group 5–7 with 55,3% of overnight trips.
13,3%
52,0%
34,7%
10,6%
55,3%
34,1%
0,0
10,0
20,0
30,0
40,0
50,0
60,0
LSM 1 - 4 LSM 5 - 7 LSM 8 - 10
2015 2016
As a proportion of individuals within a particular group the broad LSM group 8–10 was the most likely to travel (1 and a half trips taken per individual)

Total expenditure (in Billion rand), 2013 - 2016
* Numbers have been rounded off
R104bn R110bn
R87bn R87bn
0
20
40
60
80
100
120
2013 2014 2015 2016
Total expenditure on domestic day and overnight trips grew from R104 billion 2013 to R110 billion in 2014
Between 2015 and 2016 expenditure remained constant

The main reason reported for undertaking day trips was:
Shopping
Visiting friends and relatives
Leisure
Shopping VFR Leisure Funeral Business Religion Sporting Other Unspecified
2015 27,4 23,8 16,7 6,3 4,3 5,4 2,0 13,7 0,4
2016 27,0 22,5 13,4 8,2 5,2 5,1 4,1 14,0 0,6
0,0
5,0
10,0
15,0
20,0
25,0
30,0
Perc
enta
ge
Main purpose of most recent day trips, 2015 - 2016
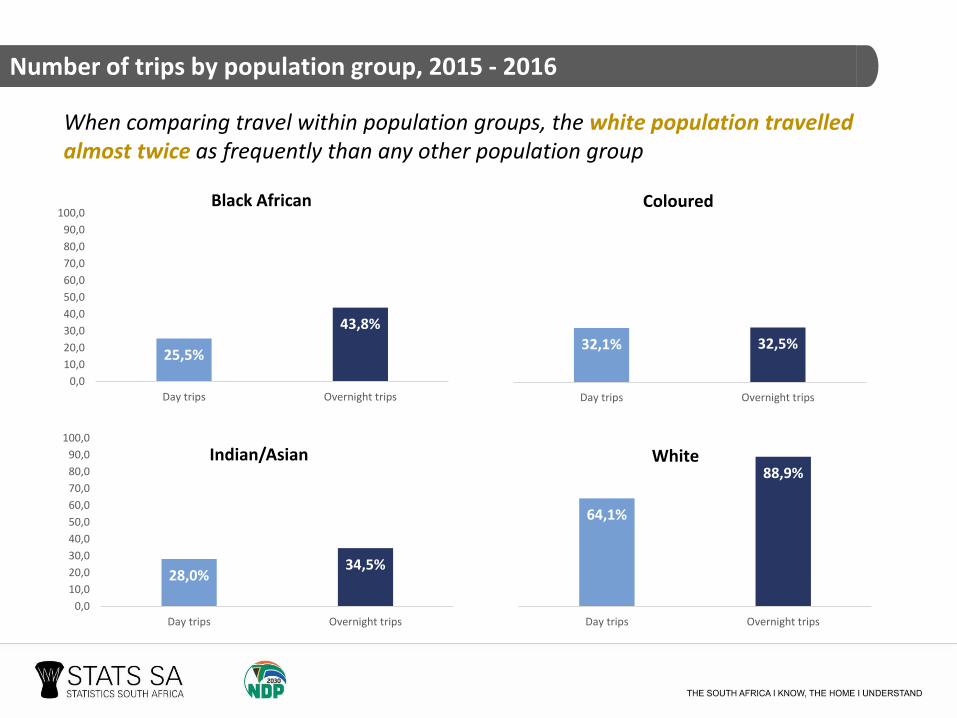
Number of trips by population group, 2015 - 2016
25,5%
43,8%
0,0
10,0
20,0
30,0
40,0
50,0
60,0
70,0
80,0
90,0
100,0
Day trips Overnight trips
Black African
32,1% 32,5%
Day trips Overnight trips
Coloured
28,0%34,5%
0,0
10,0
20,0
30,0
40,0
50,0
60,0
70,0
80,0
90,0
100,0
Day trips Overnight trips
Indian/Asian
64,1%
88,9%
Day trips Overnight trips
White
When comparing travel within population groups, the white population travelled almost twice as frequently than any other population group

The main reason reported for undertaking overnight trips was:
Visiting friends and relatives
Leisure
Funeral
VFR Leisure Funeral Religion Business Shopping SportingCultural
OccasionOther Unspecified
2015 48,7 18,5 14,2 6,3 2,2 0,6 0,8 1,8 6,4 0,6
2016 48,0 17,3 13,8 6,1 2,7 0,6 0,5 1,9 8,5 0,7
0
5
10
15
20
25
30
35
40
45
50
Perc
enta
ge
Main purpose of most recent overnight trips, 2015 – 2016
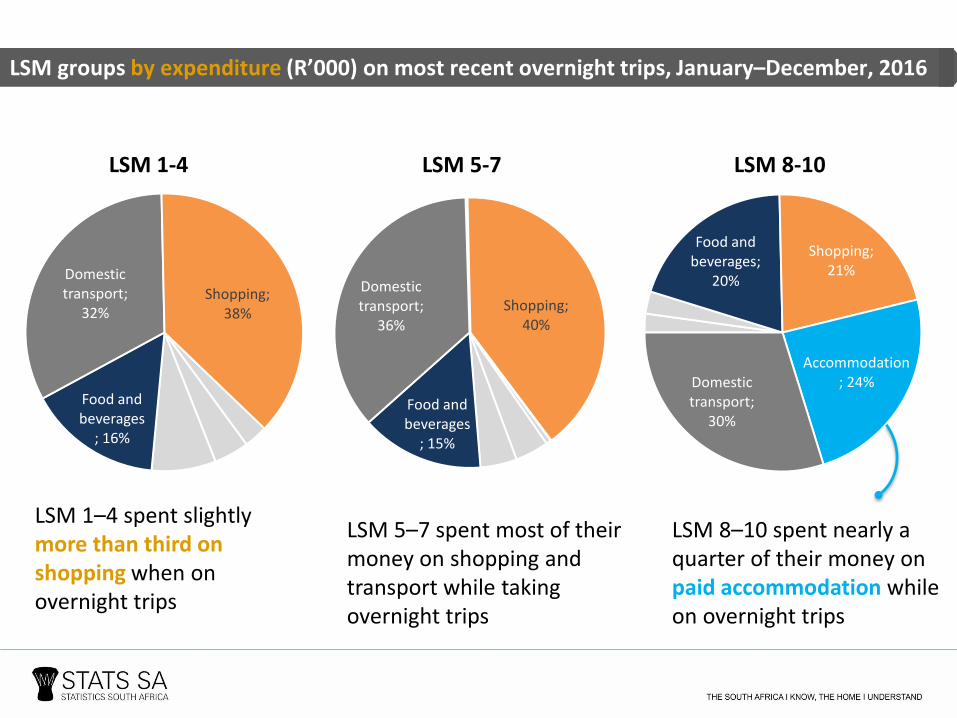
Food and beverages
; 16%
Domestic transport;
32%Shopping;
38%
Food and beverages
; 15%
Domestic transport;
36%
Shopping; 40%
LSM 5-7
Food and beverages;
20%
Shopping; 21%
Accommodation; 24%Domestic
transport; 30%
LSM 8-10LSM 1-4
LSM groups by expenditure (R’000) on most recent overnight trips, January–December, 2016
LSM 1–4 spent slightly more than third on shopping when on overnight trips
LSM 5–7 spent most of their money on shopping and transport while taking overnight trips
LSM 8–10 spent nearly a quarter of their money on paid accommodation while on overnight trips

MP7,7%
KZN8,4%
EC10,1%
FS4,3%
NW9,8%
NC4,3%
WC13,2%
GP23,0%
Gauteng , Limpopo and Western Cape
were the most popular destinations
for day travellers
LP17,3%
Percentage of most recent day trips by province of destination, 2016

MP10,5%
EC12,2%
FS4,8%
NW7,5%
NC2,5%
WC9,7%
GP13,4%
LP17,0%
KZN13,0%
The main destination for overnight travel was Limpopo followed by
Gauteng and KwaZulu-Natal
Percentage of most recent overnight trip by province of destination, 2016

50% 49%
0%
20%
40%
60%
80%
2015 2016
36% 36%
2015 2016
3%4%
2015 2016AIRPLANE
BUS
TAXI
Cars and Taxis were the most used mode of transport for overnight trips.
9% 8%
2015 2016
CAR
The use of busses for overnight trips decreased over this period, while the use of airplanes rose
Main mode of transport for overnight trips, 2015 - 2016
Accommodation

73,3%4,4%
4,1%
3,9%
12,6%
Other
Self Catering
Hotel
Holiday home
of tourists made
use of unpaidaccommodation
when undertaking an
overnight trip bystaying with
friends or relatives
73%
STAYING WITH FRIENDSOR RELATIVES
Accommodation used on most recent overnight trip, 2016
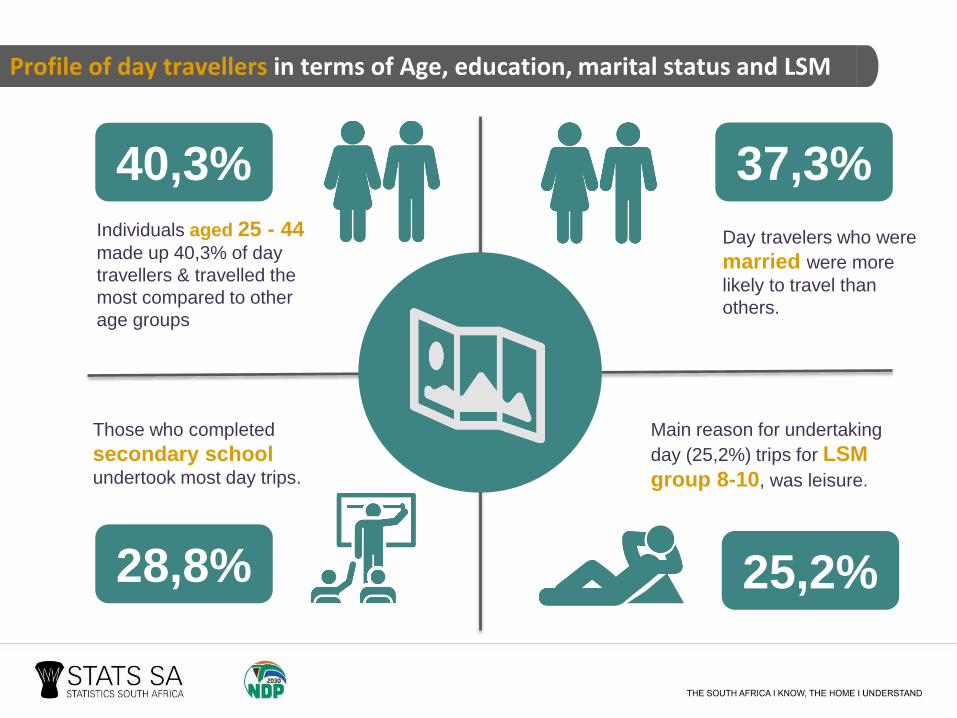
Day travelers who were
married were more
likely to travel than
others.
Individuals aged 25 - 44 made up 40,3% of day
travellers & travelled the
most compared to other
age groups
40,3% 37,3%
28,8%
Those who completed
secondary school undertook most day trips.
25,2%
Main reason for undertaking
day (25,2%) trips for LSM
group 8-10, was leisure.
Profile of day travellers in terms of Age, education, marital status and LSM
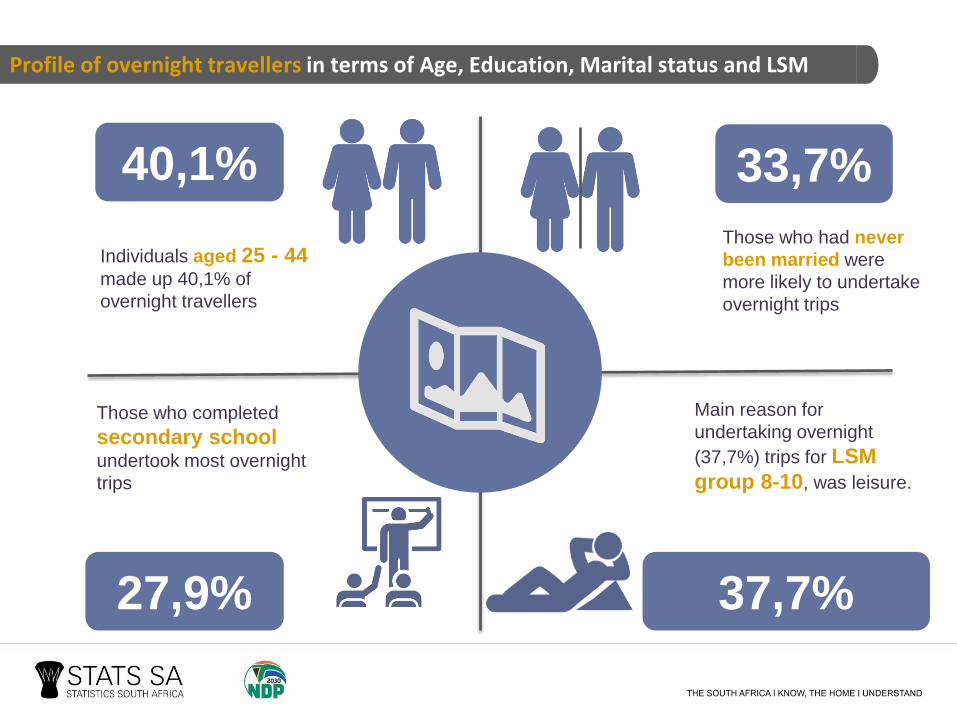
Those who had never
been married were
more likely to undertake
overnight trips
Individuals aged 25 - 44 made up 40,1% of
overnight travellers
40,1% 33,7%
27,9%
Those who completed
secondary school undertook most overnight
trips
37,7%
Main reason for
undertaking overnight
(37,7%) trips for LSM
group 8-10, was leisure.
Profile of overnight travellers in terms of Age, Education, Marital status and LSM

Thank you