Embed Size (px)
Citation preview

Domestic Refrigeration
Presented by Tim Hamer,ATA Melbourne Branch Convenor

Structure
1. Selection and location issues2. The current market and energy
performance overview3. How does the fridge perform within the
home?4. Designing for RAPS considerations.
Sources
SustainabilityVictoria.
www.climatecommunities.vic.gov.au
Celebrating 5 years of helping Victorianstackle climate change by
reducing waste and energy.
Sources
Your Home Technical Manual 4th Edition
www.yourhome.gov.au
Home energy use-Baseline Energy Estimates, 2008

Sources
www.energyrating.gov.au
www.pc.gov.au/_data/assetts/pdf_file/0009/45945/SL
Motor optimizing technology

Whitegoods Report
Sources
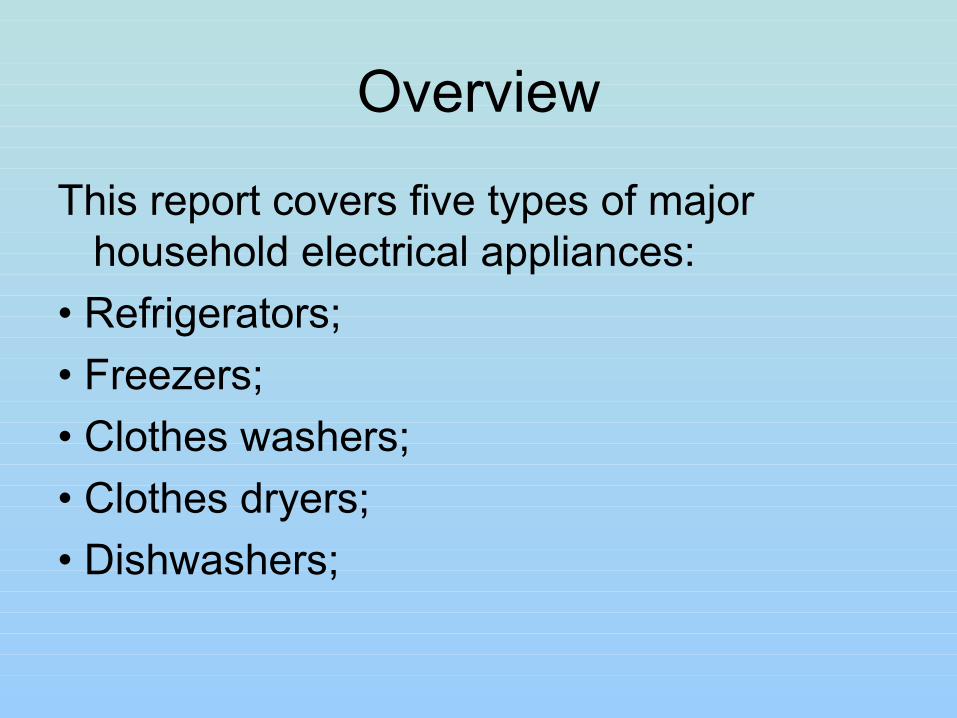
Overview
This report covers five types of major household electrical appliances:
• Refrigerators;• Freezers;• Clothes washers;• Clothes dryers;• Dishwashers;
Overview
We will only be looking at-• Refrigerators• Freezers.

Home energy use
• Heating & cooling- 38%• Water heating- 25%• Other Appliances- 16%• Lighting- 7%• Refrigeration- 7%• Cooking- 4%• Standby- 3%

Overview of Appliance Market
• The analysis in this report provides a detailed analysis of the appliance performance trends in Australia from 1993 to 2009. The whitegoods market grew significantly over this period: the analysis in this report now includes 2.6 million appliances sold in 2009 with a total retail value of AU$2.2 billion.
Overview cont.
• Generally, there has been a significant improvement in efficiency for all products as a result of Energy Rating Labels. In the case of refrigerators and freezers, additional improvements have occurred as a result of MEPS, which was introduced in 1999 and subsequently made more stringent in 2005.
Overview cont.
• Generally, sales of all appliance types have been increasing. This is a result of increasing numbers of households, increasing penetration and ownership of some appliance types (especially dishwashers) and the replacement of older appliances as they are retired. Note that some of the appliances reported are sold into the commercial sector
Choosing a Fridge or freezer
• A cool cupboard will keep many fruits and vegetables well in most climates, allowing you to choose a smaller fridge.
• Cool cupboards should be located in the coolest part of the house and have good airflow in at floor level and out at the ceiling.

Building Design considerations
• When designing a new kitchen or laundry, think about the best layout and placement of appliances to maximise efficiency.
• Refrigerators and freezers should be located out of direct sunlight and away from other sources of heat such as ovens and stoves.
Choosing a Fridge or freezer• Place the fridge or freezer in a cool spot
out of direct sunlight and away from cookers, heaters and dishwashers.
• Ensure 75mm air space around all sides of the cabinet. If in an alcove make sure the top is also ventilated.
• Make sure the door seal is clean and in good condition. It should hold a piece of paper tightly in place when shut.
Choosing a Fridge or freezer
• Avoid overloading the fridge or freezer.• Try to leave about 20 per cent free space
for air circulation.• Defrost manual models regularly or when
ice is more than five millimeters thick.
Choosing a fridge or freezer
• Running a six star 360L fridge will produce almost half a tonne less greenhouse gas each year than a three star model.

Choosing a Fridge or freezer
• Buy appliances that are the right size, especially freezers as their energy demand is high.
• A larger model will use more energy than a smaller one with the same energy star rating.
• One large fridge will usually be more efficient than two smaller ones.

Choosing a Fridge or freezer
• Look for features such as easily adjustable shelving, easy access to the thermostat, simple thermostat controls, separate thermostats for fridge and freezer compartments, a door-open alarm and rollers or castors that will make cleaning and operating the fridge easier.

Choosing a Fridge or freezer
• Chest freezers are usually more efficient than upright models as cold air does not escape every time you open the door. Upright freezers with enclosed drawers (not baskets) are a good compromise.

Choosing a Fridge or freezer
• Through-the-door features such as cold water dispensers and ice-makers use more energy and cost more. Avoid these if possible.
Choosing a Fridge or freezer
• Set the fridge thermostat to between 3°C and 5°C.
• The freezer should be set to between -15°C and -18°C. Every degree lower requires five per cent more energy.
• A fridge thermometer is a good investment.
Choosing a Fridge or freezer
• Turn the second fridge off when not needed. Do not put it in a hot garage or veranda.
• Avoid placing hot food in the fridge.• Dispose of old fridges properly to avoid
release of ozone damaging CFCs. Your local council should be able to offer advice.
My Existing Fridge
• Fisher & Paykel 442 litre 2 door fridge with the freezer on the bottom.
• Purchased in 2000.• Then 5 Star Rating.• Projected to use 680 kWh/yr.
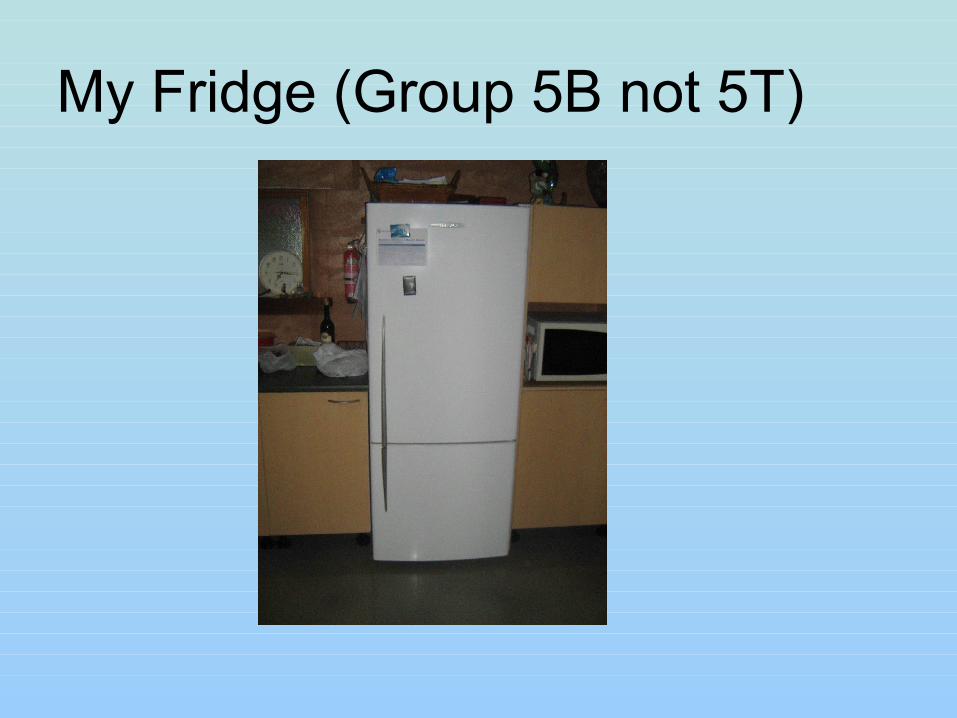
My Fridge (Group 5B not 5T)
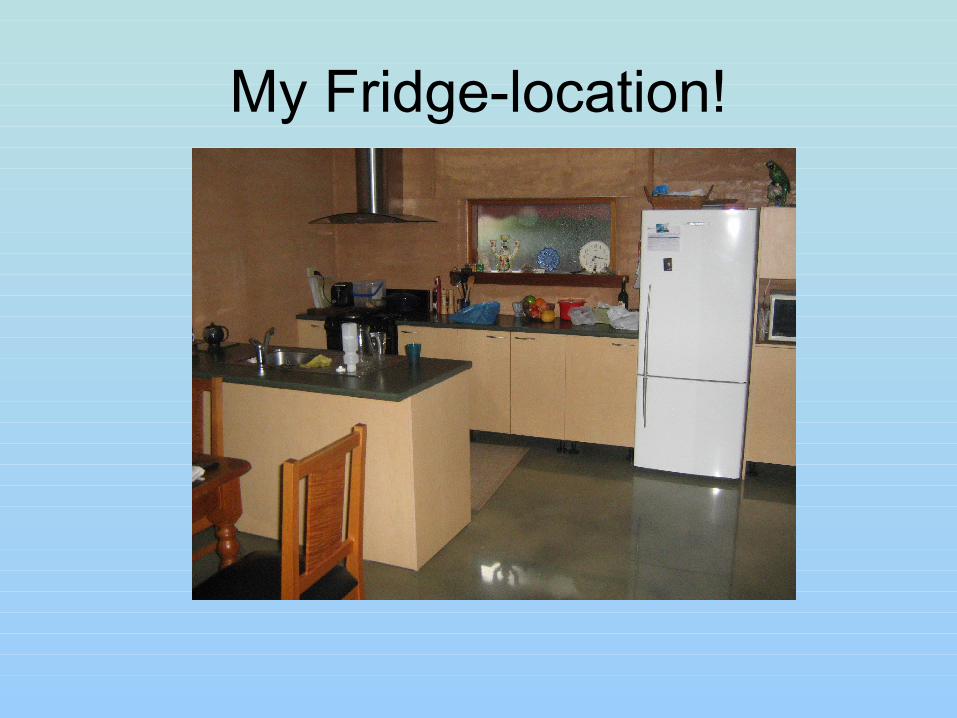
My Fridge-location!
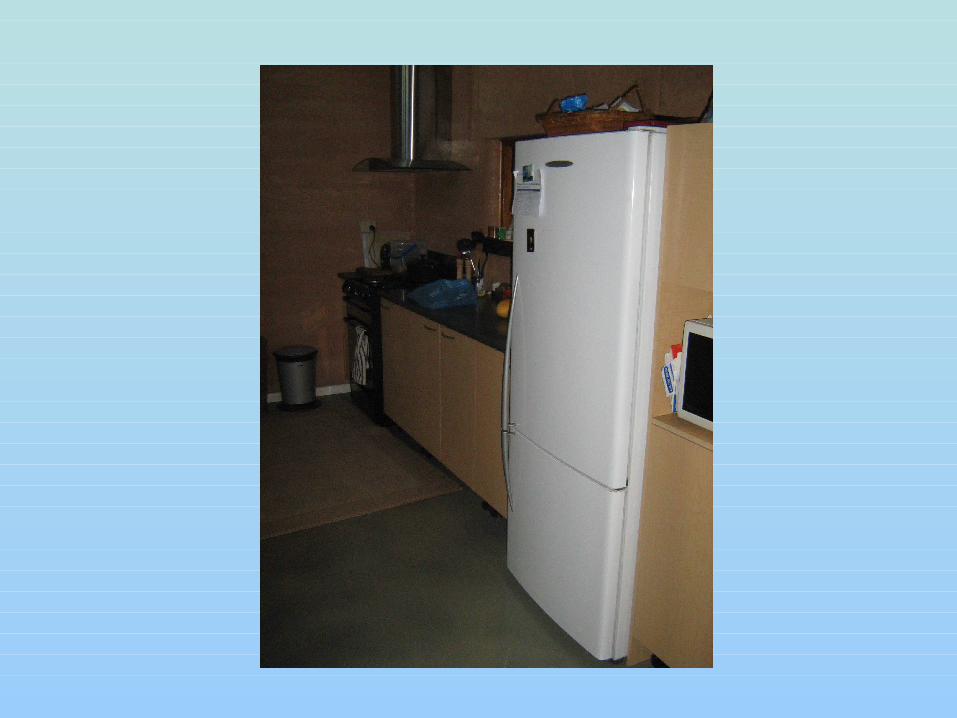
My Fridge
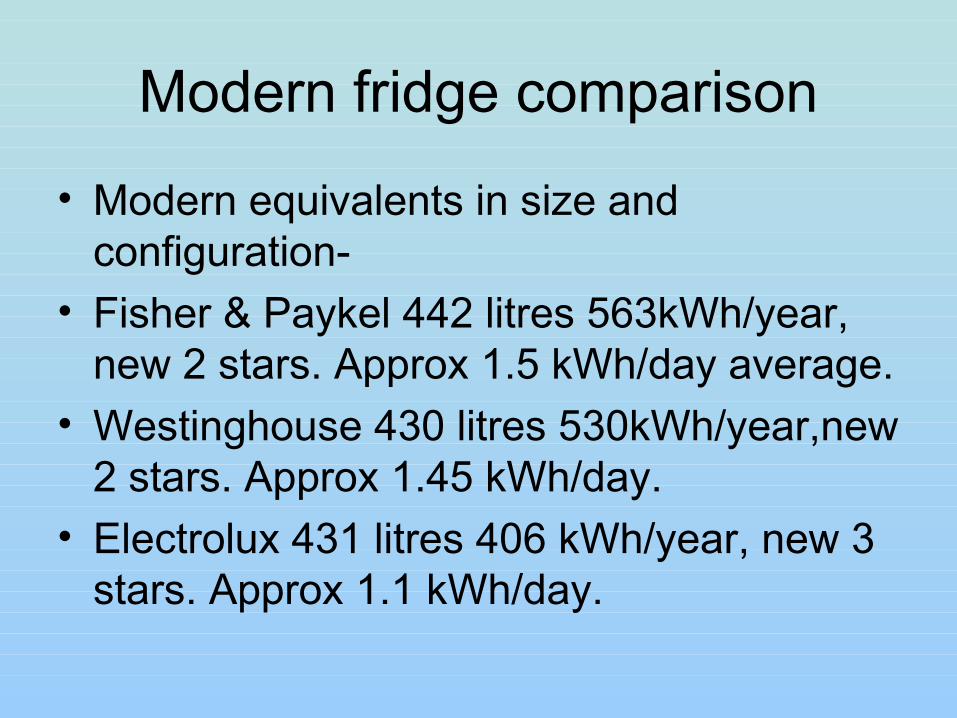
Modern fridge comparison
• Modern equivalents in size and configuration-
• Fisher & Paykel 442 litres 563kWh/year, new 2 stars. Approx 1.5 kWh/day average.
• Westinghouse 430 litres 530kWh/year,new 2 stars. Approx 1.45 kWh/day.
• Electrolux 431 litres 406 kWh/year, new 3 stars. Approx 1.1 kWh/day.

Green fridge labeled a fraud Melissa Singer 17/3/2010 SMH
• LG Electronics has agreed to compensate potentially thousands of consumers after two of its fridges - models L197NFS and P197WFS - were found to contain an illegal device that activates an energy-saving mode when it detects room conditions similar to those in a test laboratory.
• The device detects test conditions - typically 22 degrees - and activates the energy-saving mode, creating the impression of lower running costs and energy usage. The devices have been banned in Australia since 2007.
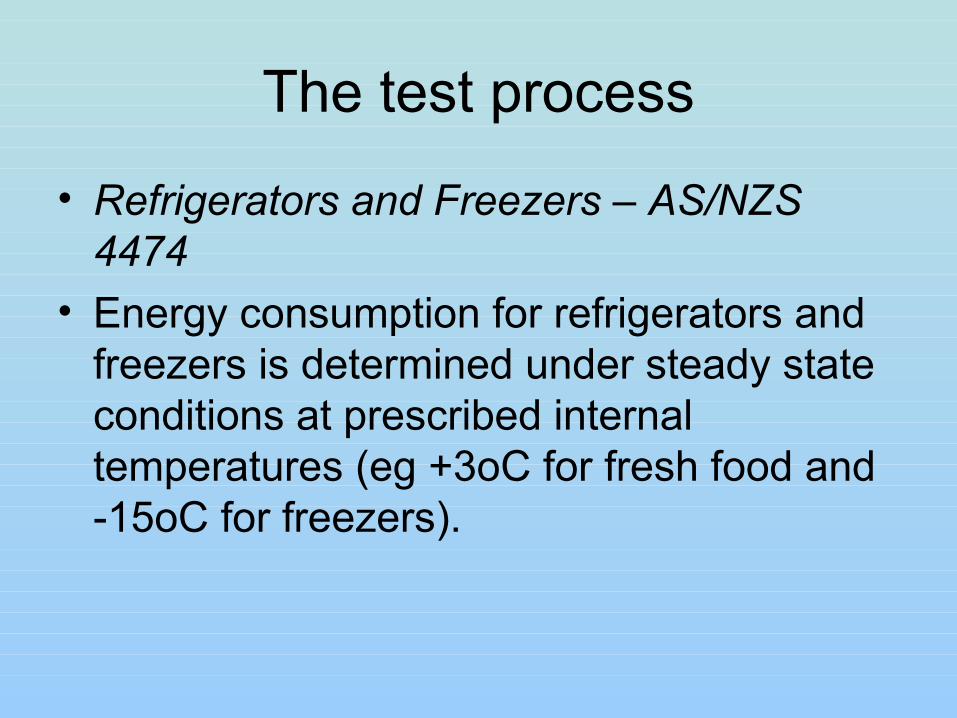
The test process
• Refrigerators and Freezers – AS/NZS 4474
• Energy consumption for refrigerators and freezers is determined under steady state conditions at prescribed internal temperatures (eg +3oC for fresh food and -15oC for freezers).
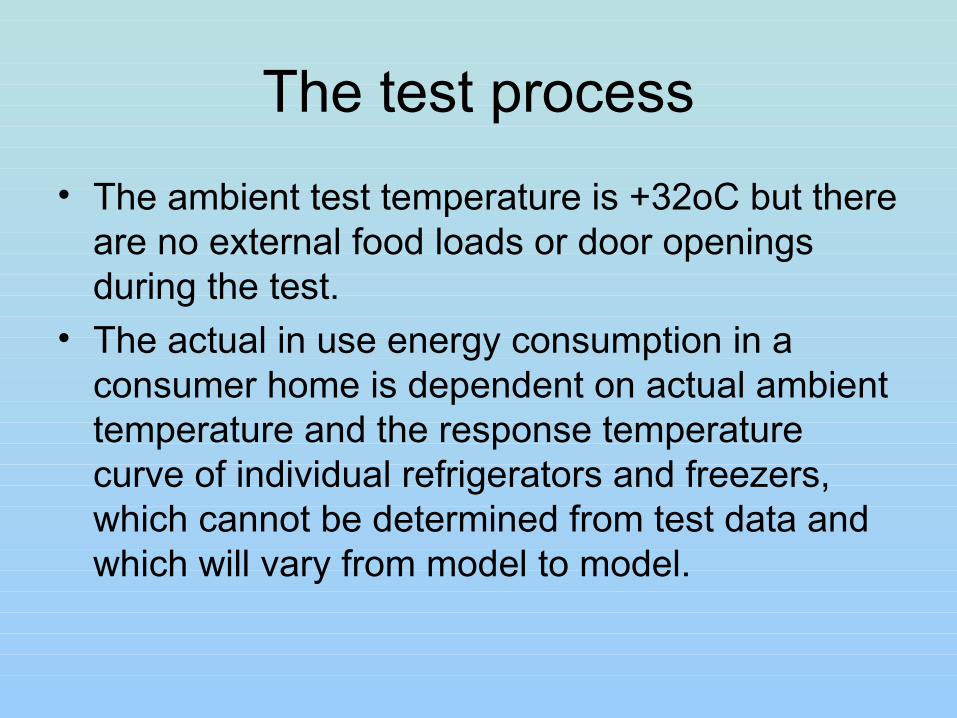
The test process• The ambient test temperature is +32oC but there
are no external food loads or door openings during the test.
• The actual in use energy consumption in a consumer home is dependent on actual ambient temperature and the response temperature curve of individual refrigerators and freezers, which cannot be determined from test data and which will vary from model to model.
The test process• The internal temperatures selected by the
user and frequency and duration of door openings and warm food loads will all have some impact on energy consumption during normal use.
• The current energy test also provides no information on processing efficiency – removal of heat from food loads and door openings

The test process
• The very limited field data indicates that on average the energy consumption is overestimated by around 10% in temperature climates (this varies from +40% to -10% at a model level). This difference will on average be more in cooler climates and less in warmer climates.
The test process• More discussion on the energy consumption of
refrigerators and freezers during normal use can be found in Harrington (2009). Lloyd Harrington (2009), Energy Efficient Strategies, A New Global Test Procedure for Refrigerators & Freezers, paper presented to the conference on Energy Efficient Domestic Appliances and Lighting (EEDAL), 16-18 June 2009, Berlin. Paper available from www.energyrating.gov.au
Market Trends – Main Findings
• In 2009, 938,938 unit sales were identified which made up 99.2% of retail sales collected by GfK. The main findings were as follows:
• Total retail refrigerator sales for the period 1993 to 2009 increased at an average3.7% per annum
Market trends-Main findings• The market share of Group 5S (side by
side) refrigerators appears to have stabilised.
• Sales of models in this group have experienced a very large increase from 2002 (around 35,000 sales) to 2006 (around 140,000 sales), but sales have since levelled out. The group had a 15.7% market share in 2009.

Market trends-main findings
• The market share of Group 5T (2 door frost free refrigerator/freezer with top mounted freezer) peaked in 2000 at 58% after which they have had a decrease in sales share but appears to have stabilised by 2007. In 2009, Group 5T made up 47.6% of all refrigerator sales, still by far the market leader.
Market trends-main findings
• The market share of Group 5B (2 door frost free refrigerator/freezer with bottom mounted freezer) have been fairly steady over most of the analysis period at about 10% to 13%, but after 2006 this increased to about 16%.
Market trends-main findings
• The market share of Group 2 (typically small bar refrigerators – many are used in commercial offices) was steady at around 14% share, while the market share of Group 1 (all refrigerators) declined slightly from 9% in 1993 to 5% in 2009.
Market trends-main findings
• Group 4 (2 door cyclic defrost refrigerator-freezers) made up 30% of the market in 1993. For the year 2009, it had a 0.2% market share and has essentially disappeared completely from the market.
Market trends-main findings• Sales of Group 3 (refrigerator with short
term freezer) have been virtually non existent since the late 1990’s, although there was a spike in units sold in the years 2005 to 2007 (up to around a 3.5% market share), this has since declined to 0.5% in 2009. These units are similar to Group 2 (Group 3 has a slightly colder freezer) and the total share of Group 2 & 3 has been fairly constant.
Market trends-main findings
Fresh food compartment size: the average fresh food compartment size for all refrigerators and refrigerator/freezers has remained stable since 1993. In 2009 the overall average size was 272 litres. However, there have been notable changes within some of the groups:

Market trends-main findings
• Group 1 (all refrigerator) compartment size increased sharply from 1998 (308 litres) to 2000 (359 litres), and has dropped sharply to 325 litres in 2009 (361 litres in 2005).

Market trends-main findings• Group 4 (2 door cyclic defrost
refrigerators) showed a significant decrease in its fresh food compartment size from 314 litres in 2003 to 177 litres in 2009. However, sales of Group 4 models are now extremely small, so this trend is highly skewed by the few remaining models left on the market and is of little interest and impact in terms of sales weighted trends.
Market trends-main findings
• Group 5S (side by side frost free refrigerators) size has declined since 2001 where fresh food compartment size was 413 litres.
• In 2008 it was 375 litres.
Market trends-main findings• Freezer compartment size: Average
freezer compartment size has increased from 1993 (81 litres) to 2009 (110 litres). This is mostly driven by increased sales share of groups with larger freezers. Within Groups, freezer volume has been mostly stable from 1993 to 2009, although there has been a slight decrease for Group 5S (in line with overall changes in volume for this group).
Market trends-main findings
• Purchase Price: The nominal price of an average refrigerator increased at around 0.9% per annum. The price trends for refrigerators are complicated substantially by the change in sales share by Group.
• IE Some models declined and others increased in price due to market changes.
Energy Efficiency Trends – Main Findings
• The energy consumption of refrigerators is trending downwards at -2.9% per annum over the 17 year period. The most significant falls in energy consumption occurred with the introduction of MEPS in late 1999 and with the more stringent MEPS levels in 2005. Average energy consumption across all refrigerators in 2003 was 619kWh/year compared to a significantly lower 480kWh/year in 2009.
Energy Efficiency Trends – Main Findings
• While the adjusted volume is still increasing slowly, the total energy efficiency of the refrigerator market is also increasing, at a rate of around +3.9% per annum (i.e. kWh per adjusted litre is trending downwards at –3.9% per annum). However, the change from year-to-year has varied substantially.
Types of Fridges and Freezers
Market Trends-Total sales increased at 3.7% per annum over the
17 year period.• Side by side (Group 5S) refrigerators sales have
stabilised, after experiencing a very large increase from 2003 (around 50,000 sales) to 2006 (around 140,000 sales), and now have a 15.7% share in 2009.

Market trends cont.
• Two door frost free refrigerator/freezers (top and bottom freezers) – Group 5T and 5B - still dominate the market with 64% of sales.

Market trends cont.
• Single door refrigerators with a short-term freezer compartment (Group 3) and two door cyclic defrost refrigerator/freezers (Group 4) have virtually disappeared from the market.

Market trends cont.
• Average fresh food and freezer volumes now appear to be relatively stable after freezer volumes increased during the 1990’s.
Market trends cont.
• Prices trends within each Group are quite variable. Some groups have experienced increases in nominal prices over the analysis period while some groups have experienced falls in nominal prices.

Energy
• Energy consumption decreased at an average of 2.9% per annum from 1993 to 2009 (see Figure 1).
• Energy efficiency (taking account of changes in volume) increased at 3.9% per annum over the period.

Star Ratings
• The average star rating under the original rating system climbed from 3.58 in 1993 to 5.25 in 2009.
• Under the 2000 star rating system this increased from 1.76 in 1993 to 3.99 in 2009.
Star ratings cont.
• In 2003, 88% of refrigerators sold did not pass 2005 MEPS levels, while in 2009, only 0.3% models sold failed to meet 2005 MEPS (these were existing stock that already in the country at the time MEPS requirements were introduced).
Freezers- market trends
• Total sales grew at an average of 3.9% per annum, although the majority of this increase occurred in years 2003 to 2009 (sales before this date were fairly static).
• The average volume of freezers has slightly decreased overall.

Market trends cont-
• The sales of frost free vertical freezers (Group 7) are mostly steady, while manual defrost vertical freezers (Group 6U) increased very sharply over the period 2003 to 2008, but decreased in 2009.

Market trends cont.
• Chest freezer (Group 6C) sales constitute nearly 45% of the market and have decreased slightly over the period.
• Group 6U has experienced a decrease in nominal prices over the analysis period while groups 6C and 7 have experienced increases in nominal prices.
Energy-
• Energy consumption decreased at an average of 3.1% per annum from 1993 to 2009, with the most significant decline occurring in 2005 (see Figure 2), linked to the introduction of the more stringent freezer MEPS in January 2005.
Energy-
• Energy efficiency (taking account of changes in volume) increased at 2.8% per annum over the period. The average star rating under the original rating system climbed from 4.24 in 1993 to 5.32 in 2009. Under the 2000 star rating system this increased from 1.48 in 1993 to 3.49 in 2009.

Figure 2: Energy Consumption of Freezers
End-use metering project-Ian McNicol from Sustainability Victoria
• I've attached a copy of document which contains some load profile data on the fridge at my house.
• My fridge is fairly new and is an inverter type fridge - it was the most efficient fridge in its size category when we purchased it about a year ago. The fridge has a variable speed compressor, and so can operate at a number of power levels when the compressor is running. Each day there is a short pronounced spike in power consumption - I assume this is related to a defrost function in the fridge, but don't now exactly what it is

End-use metering project
• There is also a national end-use metering project underway. I'll follow up with them to see if they are able to provide any load profile data for the fridges included in their study.
End-use metering project• Load Profile Data – Electrolux Inverter
Refrigerator• Data based on on-site measurement of fridge
power consumption at 1 minute intervals• Electrolux ESE6107SC, 606 litre side-by-side
refrigerator• Star rating – 5 Stars (old rating scale); 3 stars
(Post April 210 rating scale)• Annual energy use from label = 519 kWh/yr.
Expect around 85% of this in Melbourne or 441 kWh/yr or an average of 1.2 kWh/day

End-use metering project• Energy Use• Measured energy use• Tues 24 Aug, 2010 – 0.885 kWh• Wed 25 Aug, 2010 – 0.859 kWh• Thurs 26 Aug, 2010 – 0.827 kWh• Fri 27 Aug, 2010 – 0.854 kWh• Average use = 0.856 kWh/day• Mon 27 Sep, 2010 – 0.796 kWh (on holidays, house
unoccupied)• Note that this data was measured during winter. Would
expect daily energy use to be higher in summer.

End-use metering project
Load Profile - Electrolux invertor fridge 25/8
0
50
100
150
200
250
300
1 58 115 172 229 286 343 400 457 514 571 628 685 742 799 856 913 970 1027 1084 1141 1198 1255 1312 1369 1426
Pow
er -
1 m
in a
v (W
atts
)
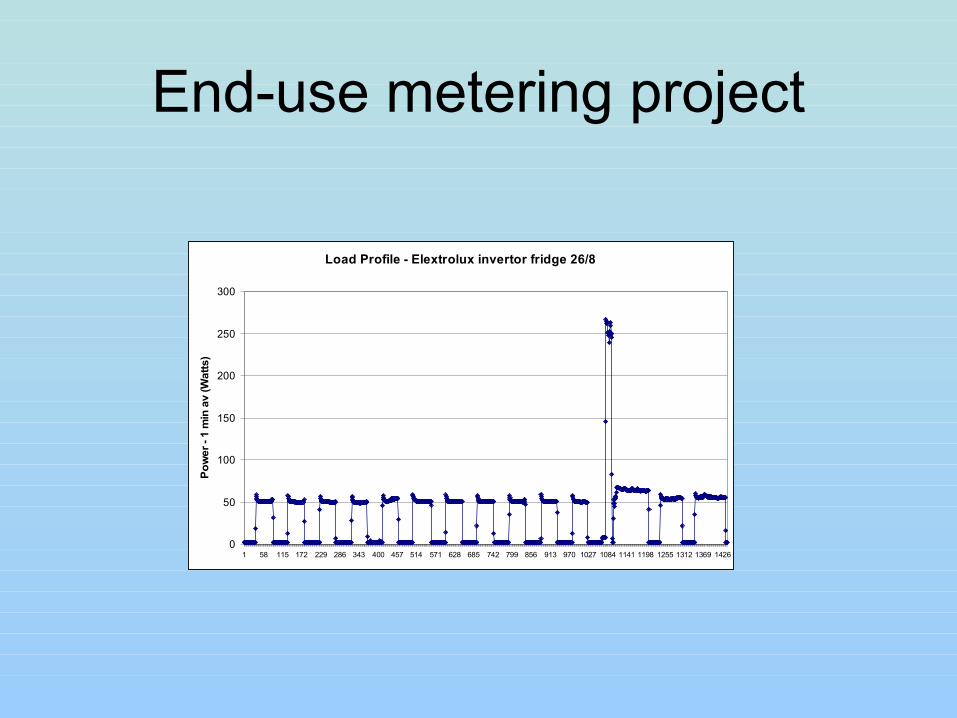
End-use metering project
Load Profile - Elextrolux invertor fridge 26/8
0
50
100
150
200
250
300
1 58 115 172 229 286 343 400 457 514 571 628 685 742 799 856 913 970 1027 1084 1141 1198 1255 1312 1369 1426
Pow
er -
1 m
in a
v (W
atts
)
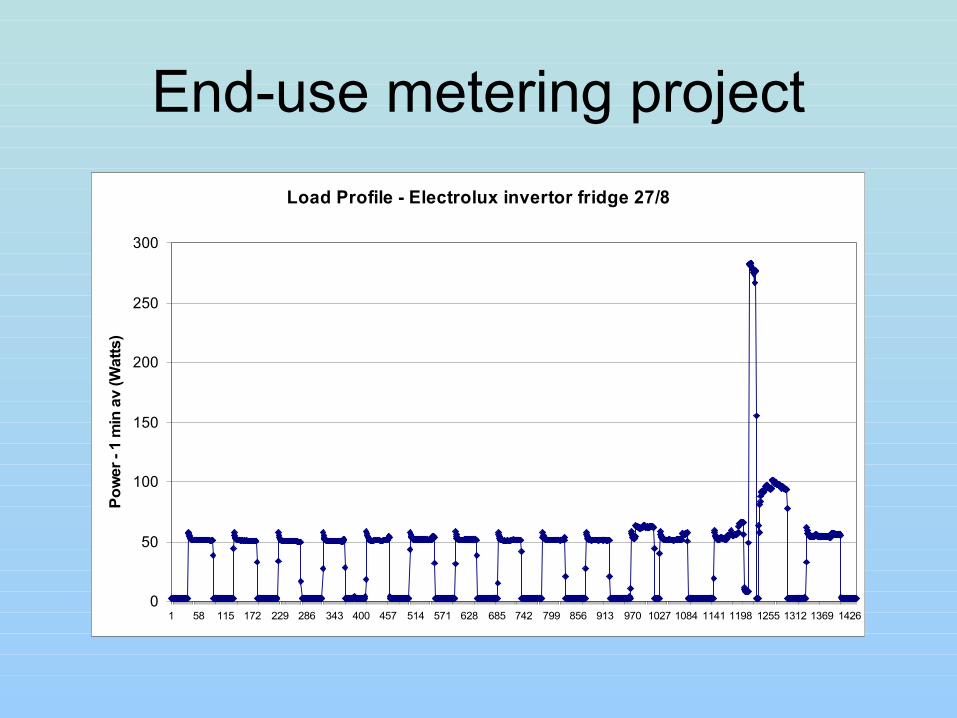
End-use metering projectLoad Profile - Electrolux invertor fridge 27/8
0
50
100
150
200
250
300
1 58 115 172 229 286 343 400 457 514 571 628 685 742 799 856 913 970 1027 1084 1141 1198 1255 1312 1369 1426
Pow
er -
1 m
in a
v (W
atts
)
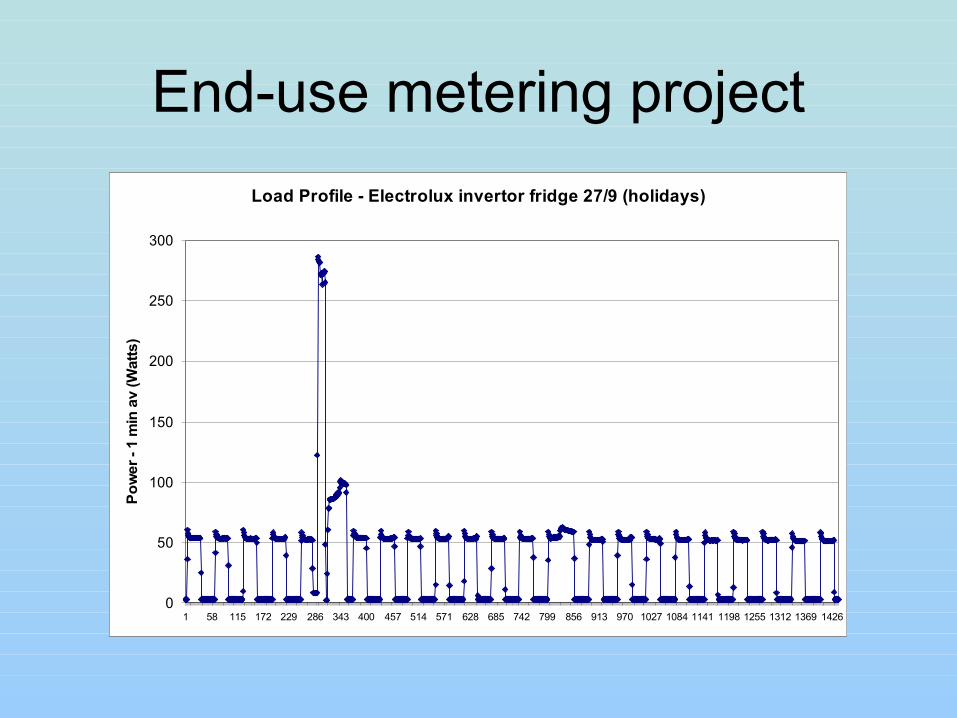
End-use metering projectLoad Profile - Electrolux invertor fridge 27/9 (holidays)
0
50
100
150
200
250
300
1 58 115 172 229 286 343 400 457 514 571 628 685 742 799 856 913 970 1027 1084 1141 1198 1255 1312 1369 1426
Pow
er -
1 m
in a
v (W
atts
)

Refrigeration & RAPSRichard Potter from Solarcharge
• Gas, Kero and small dual fuel type fridges may be more appropriate for small/weekender type refrigeration loads at premises run on a Remote Area Power Supply (RAPS).
• Gas and kero fridges must be vented to the outside for safety reasons.
Refrigeration & RAPS cont.
• Larger RAPS loads require more sophisticated Battery/inverter systems. High efficiency 240v AC fridges may have difficulty bringing inverter online.
• 12 or 24v DC cabling must be appropriately sized and the fridge kept close to the batteries to avoid significant voltage drops.
Refrigeration & RAPS cont.
• Electronic compressor motor start-up technologies (“soft-start”) used in high efficiency 240V fridges may affect the load detection “stand by” function of inverters leading to the inverter having to be switched from stand by mode to continuous mode. May require inverter to stay in continuous mode for reliable operation.
Refrigeration & RAPS cont.• VestFrost refrigerators (European sold by
Solar Charge) are efficient because of separate compressors for fridge & freezer compartments, high insulation levels, and clever compartment design- eg Freezer drawers not baskets. The freezer is located at the bottom of the fridge. Anecdotal usage is in the range 800 -1000 Watt hours/day depending on usage and placement patterns.