Embed Size (px)
Citation preview
NREL is a national laboratory of the U.S. Department of Energy Office of Energy Efficiency & Renewable Energy Operated by the Alliance for Sustainable Energy, LLC This report is available at no cost from the National Renewable Energy Laboratory (NREL) at www.nrel.gov/publications.
Contract No. DE-AC36-08GO28308
Domestic Material Content in Molten-Salt Concentrating Solar Power Plants
Craig Turchi, Parthiv Kurup, Sertac Akar, and Francisco Flores
Technical Report NREL/TP-5500-64429 August 2015
NREL is a national laboratory of the U.S. Department of Energy Office of Energy Efficiency & Renewable Energy Operated by the Alliance for Sustainable Energy, LLC This report is available at no cost from the National Renewable Energy Laboratory (NREL) at www.nrel.gov/publications.
Contract No. DE-AC36-08GO28308
National Renewable Energy Laboratory 15013 Denver West Parkway Golden, CO 80401 303-275-3000 • www.nrel.gov
Domestic Material Content in Molten-Salt Concentrating Solar Power Plants
Craig Turchi, Parthiv Kurup, Sertac Akar, and Francisco Flores Prepared under Task No. CP13.3510
Technical Report NREL/TP-5500-64429 August 2015

NOTICE
This report was prepared as an account of work sponsored by an agency of the United States government. Neither the United States government nor any agency thereof, nor any of their employees, makes any warranty, express or implied, or assumes any legal liability or responsibility for the accuracy, completeness, or usefulness of any information, apparatus, product, or process disclosed, or represents that its use would not infringe privately owned rights. Reference herein to any specific commercial product, process, or service by trade name, trademark, manufacturer, or otherwise does not necessarily constitute or imply its endorsement, recommendation, or favoring by the United States government or any agency thereof. The views and opinions of authors expressed herein do not necessarily state or reflect those of the United States government or any agency thereof.
This report is available at no cost from the National Renewable Energy Laboratory (NREL) at www.nrel.gov/publications.
Available electronically at SciTech Connect http:/www.osti.gov/scitech
Available for a processing fee to U.S. Department of Energy and its contractors, in paper, from:
U.S. Department of Energy Office of Scientific and Technical Information P.O. Box 62 Oak Ridge, TN 37831-0062 OSTI http://www.osti.gov Phone: 865.576.8401 Fax: 865.576.5728 Email: [email protected]
Available for sale to the public, in paper, from:
U.S. Department of Commerce National Technical Information Service 5301 Shawnee Road Alexandria, VA 22312 NTIS http://www.ntis.gov Phone: 800.553.6847 or 703.605.6000 Fax: 703.605.6900 Email: [email protected]
Cover Photos by Dennis Schroeder: (left to right) NREL 26173, NREL 18302, NREL 19758, NREL 29642, NREL 19795.
NREL prints on paper that contains recycled content.
1
This report is available at no cost from the National Renewable Energy Laboratory (NREL) at www.nrel.gov/publications.
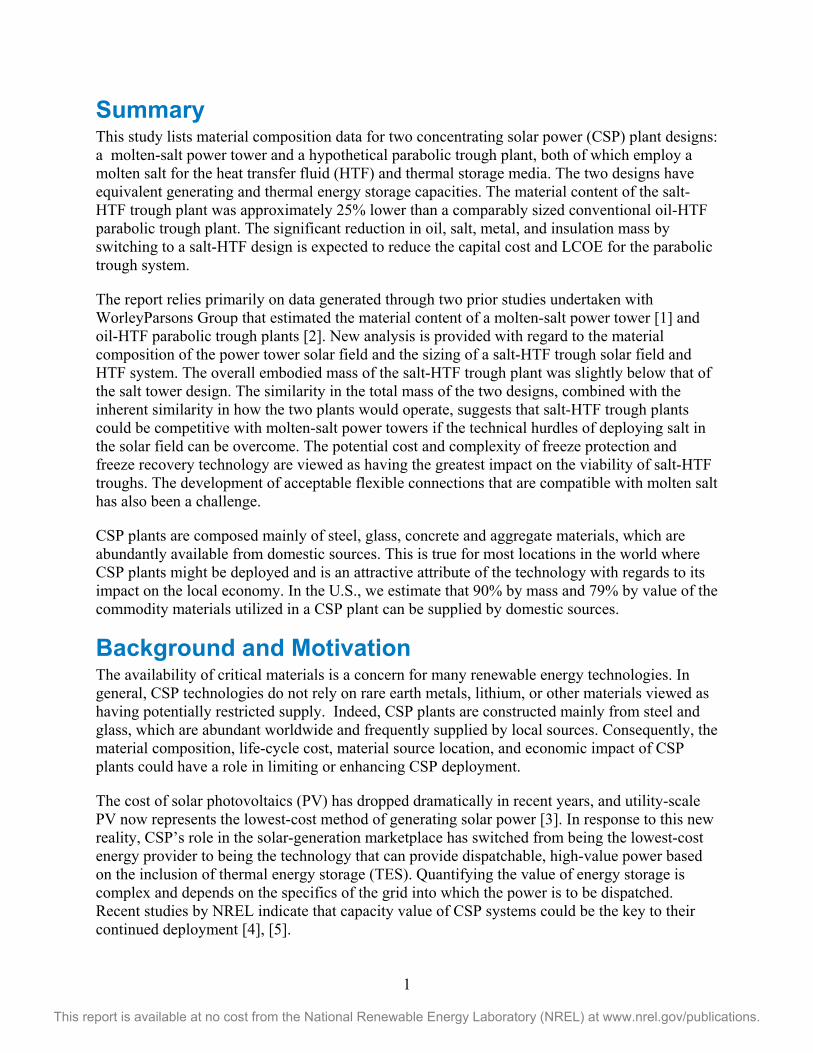
Summary This study lists material composition data for two concentrating solar power (CSP) plant designs: a molten-salt power tower and a hypothetical parabolic trough plant, both of which employ a molten salt for the heat transfer fluid (HTF) and thermal storage media. The two designs have equivalent generating and thermal energy storage capacities. The material content of the salt-HTF trough plant was approximately 25% lower than a comparably sized conventional oil-HTF parabolic trough plant. The significant reduction in oil, salt, metal, and insulation mass by switching to a salt-HTF design is expected to reduce the capital cost and LCOE for the parabolic trough system.
The report relies primarily on data generated through two prior studies undertaken with WorleyParsons Group that estimated the material content of a molten-salt power tower [1] and oil-HTF parabolic trough plants [2]. New analysis is provided with regard to the material composition of the power tower solar field and the sizing of a salt-HTF trough solar field and HTF system. The overall embodied mass of the salt-HTF trough plant was slightly below that of the salt tower design. The similarity in the total mass of the two designs, combined with the inherent similarity in how the two plants would operate, suggests that salt-HTF trough plants could be competitive with molten-salt power towers if the technical hurdles of deploying salt in the solar field can be overcome. The potential cost and complexity of freeze protection and freeze recovery technology are viewed as having the greatest impact on the viability of salt-HTF troughs. The development of acceptable flexible connections that are compatible with molten salt has also been a challenge.
CSP plants are composed mainly of steel, glass, concrete and aggregate materials, which are abundantly available from domestic sources. This is true for most locations in the world where CSP plants might be deployed and is an attractive attribute of the technology with regards to its impact on the local economy. In the U.S., we estimate that 90% by mass and 79% by value of the commodity materials utilized in a CSP plant can be supplied by domestic sources.
Background and Motivation The availability of critical materials is a concern for many renewable energy technologies. In general, CSP technologies do not rely on rare earth metals, lithium, or other materials viewed as having potentially restricted supply. Indeed, CSP plants are constructed mainly from steel and glass, which are abundant worldwide and frequently supplied by local sources. Consequently, the material composition, life-cycle cost, material source location, and economic impact of CSP plants could have a role in limiting or enhancing CSP deployment.
The cost of solar photovoltaics (PV) has dropped dramatically in recent years, and utility-scale PV now represents the lowest-cost method of generating solar power [3]. In response to this new reality, CSP’s role in the solar-generation marketplace has switched from being the lowest-cost energy provider to being the technology that can provide dispatchable, high-value power based on the inclusion of thermal energy storage (TES). Quantifying the value of energy storage is complex and depends on the specifics of the grid into which the power is to be dispatched. Recent studies by NREL indicate that capacity value of CSP systems could be the key to their continued deployment [4], [5].
2
This report is available at no cost from the National Renewable Energy Laboratory (NREL) at www.nrel.gov/publications.
In addition to the advantage provided by thermal energy storage, CSP plants tend to have a much higher content of locally sourced materials than PV plants. That translates into greater benefit to the economy of the host country. This report seeks to further the understanding of that aspect of CSP plant design by building on previous assessments of the material content of state-of-the-art CSP plants [1], [2], and assessing the fraction of those materials likely to come from domestic suppliers. The report looks exclusively at plants that use solar salt as the HTF and thermal storage media: a molten-salt power tower and a hypothetical molten-salt parabolic trough plant.
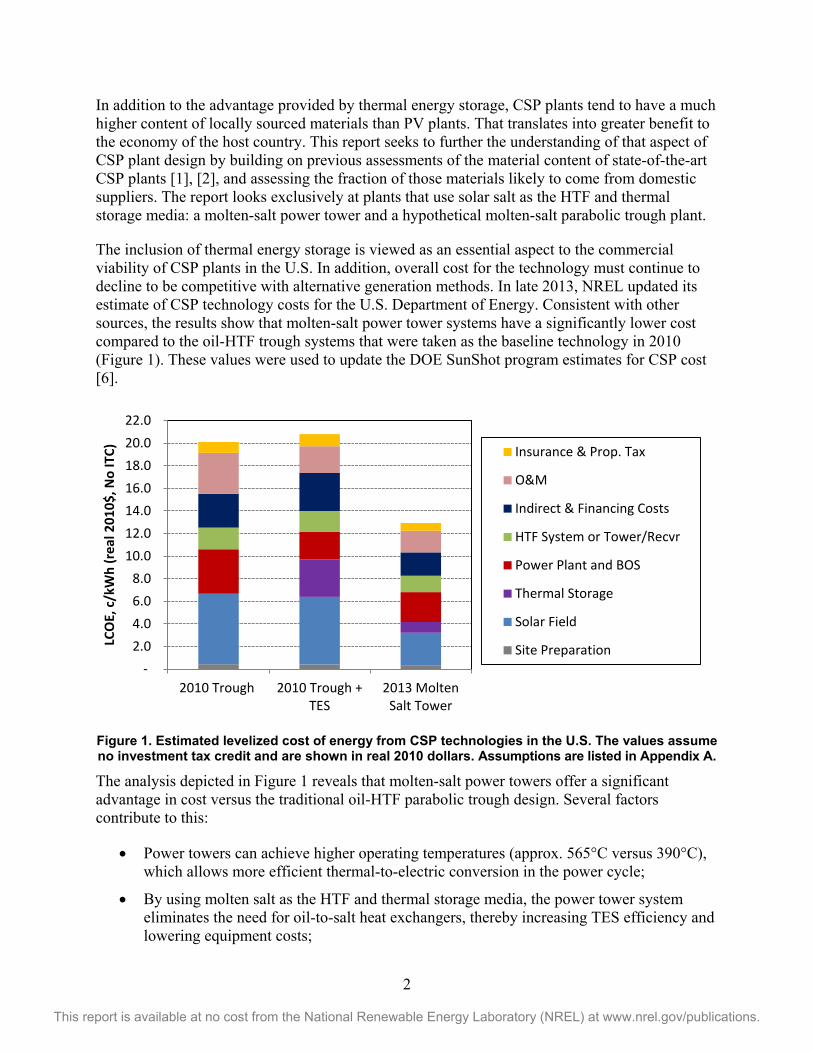
The inclusion of thermal energy storage is viewed as an essential aspect to the commercial viability of CSP plants in the U.S. In addition, overall cost for the technology must continue to decline to be competitive with alternative generation methods. In late 2013, NREL updated its estimate of CSP technology costs for the U.S. Department of Energy. Consistent with other sources, the results show that molten-salt power tower systems have a significantly lower cost compared to the oil-HTF trough systems that were taken as the baseline technology in 2010 (Figure 1). These values were used to update the DOE SunShot program estimates for CSP cost [6].
Figure 1. Estimated levelized cost of energy from CSP technologies in the U.S. The values assume no investment tax credit and are shown in real 2010 dollars. Assumptions are listed in Appendix A.
The analysis depicted in Figure 1 reveals that molten-salt power towers offer a significant advantage in cost versus the traditional oil-HTF parabolic trough design. Several factors contribute to this:
• Power towers can achieve higher operating temperatures (approx. 565°C versus 390°C), which allows more efficient thermal-to-electric conversion in the power cycle;
• By using molten salt as the HTF and thermal storage media, the power tower system eliminates the need for oil-to-salt heat exchangers, thereby increasing TES efficiency and lowering equipment costs;
- 2.0 4.0 6.0 8.0
10.0 12.0 14.0 16.0 18.0 20.0 22.0
2010 Trough 2010 Trough +TES
2013 MoltenSalt Tower
LCO
E, c
/kW
h (r
eal 2
010$
, No
ITC)
Insurance & Prop. Tax
O&M
Indirect & Financing Costs
HTF System or Tower/Recvr
Power Plant and BOS
Thermal Storage
Solar Field
Site Preparation
3
This report is available at no cost from the National Renewable Energy Laboratory (NREL) at www.nrel.gov/publications.
• The higher operating temperature of power tower systems allows the TES system to span a wider temperature range, which greatly increases the energy storage per tonne of salt and reduces salt requirements per MWhth of storage.
Furthermore, while the 2010 trough cost numbers assumed a wet-cooled power plant, the 2013 tower values are based on the use of dry cooling. This switch reduces the water requirements for plant operation by 90% or more [7], which is viewed as an essential element of deployment in the drought-stricken Southwest. The cycle-efficiency penalty for switching to dry cooling is lower for a power tower because of its higher operating temperature. The power tower advantages listed above are contingent on the ability to use a high-temperature HTF, such as solar salt, rather than oil as the HTF in the receiver. If trough systems could deploy the same or a similar molten-salt HTF, they could also take advantage of these attributes.
Various teams have explored the potential of using molten salt as the HTF in a parabolic trough plant [8] - [9], and the 5-MW Archimede facility in Sicily is testing molten salt in troughs [10]. These industry studies have predicted that molten-salt HTF plants could reduce the LCOE of parabolic trough technology by approximately 15%. However, the challenge of dealing with extensive piping and receiver networks filled with molten salt have proven difficult to overcome, the major issues being the needed development of reliable flex-joints for the rotating troughs and the risk associated with potential freezing of the HTF network.
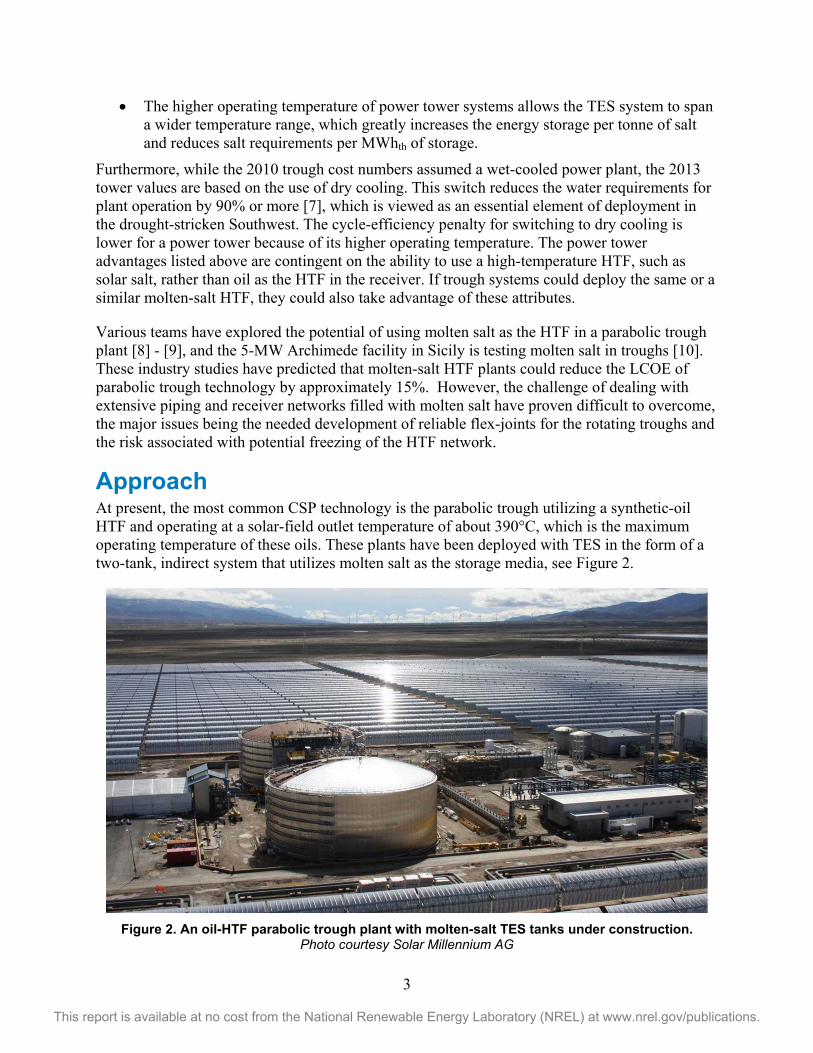
Approach At present, the most common CSP technology is the parabolic trough utilizing a synthetic-oil HTF and operating at a solar-field outlet temperature of about 390°C, which is the maximum operating temperature of these oils. These plants have been deployed with TES in the form of a two-tank, indirect system that utilizes molten salt as the storage media, see Figure 2.
Figure 2. An oil-HTF parabolic trough plant with molten-salt TES tanks under construction.
Photo courtesy Solar Millennium AG
4
This report is available at no cost from the National Renewable Energy Laboratory (NREL) at www.nrel.gov/publications.
In contrast, the use of molten salt as the HTF with direct storage leads to greater efficiency and lower cost. In the present analysis we assume the power tower and parabolic trough plants employ this design. Solar salt, a blend of 60wt% sodium nitrate and 40wt% potassium nitrate, is the HTF and thermal storage media. Solar Salt is used in the Archimede molten-salt parabolic trough pilot test. The use of Solar Salt allows a straightforward comparison with molten-salt power towers and oil-trough plants using indirect TES with Solar Salt. Other salts might be better suited as the solar field HTF, but if direct TES is cost prohibitive some of the advantages of the molten-salt trough plant design are lost.
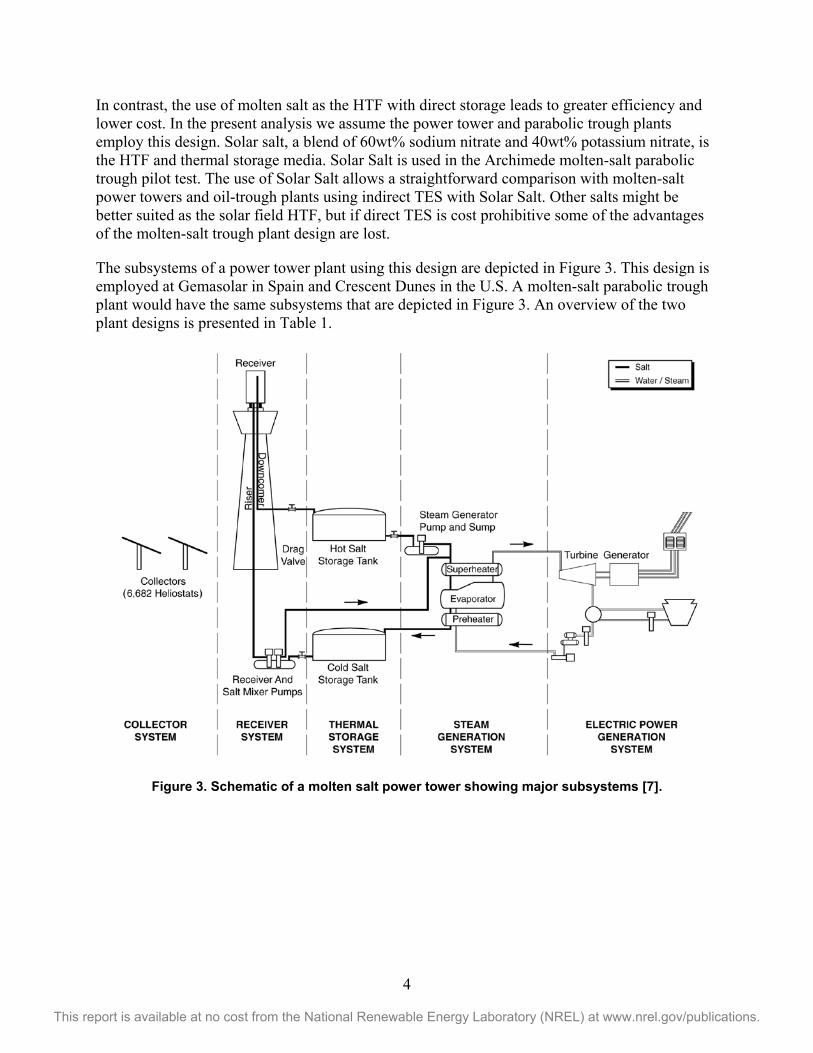
The subsystems of a power tower plant using this design are depicted in Figure 3. This design is employed at Gemasolar in Spain and Crescent Dunes in the U.S. A molten-salt parabolic trough plant would have the same subsystems that are depicted in Figure 3. An overview of the two plant designs is presented in Table 1.
Figure 3. Schematic of a molten salt power tower showing major subsystems [7].
5
This report is available at no cost from the National Renewable Energy Laboratory (NREL) at www.nrel.gov/publications.
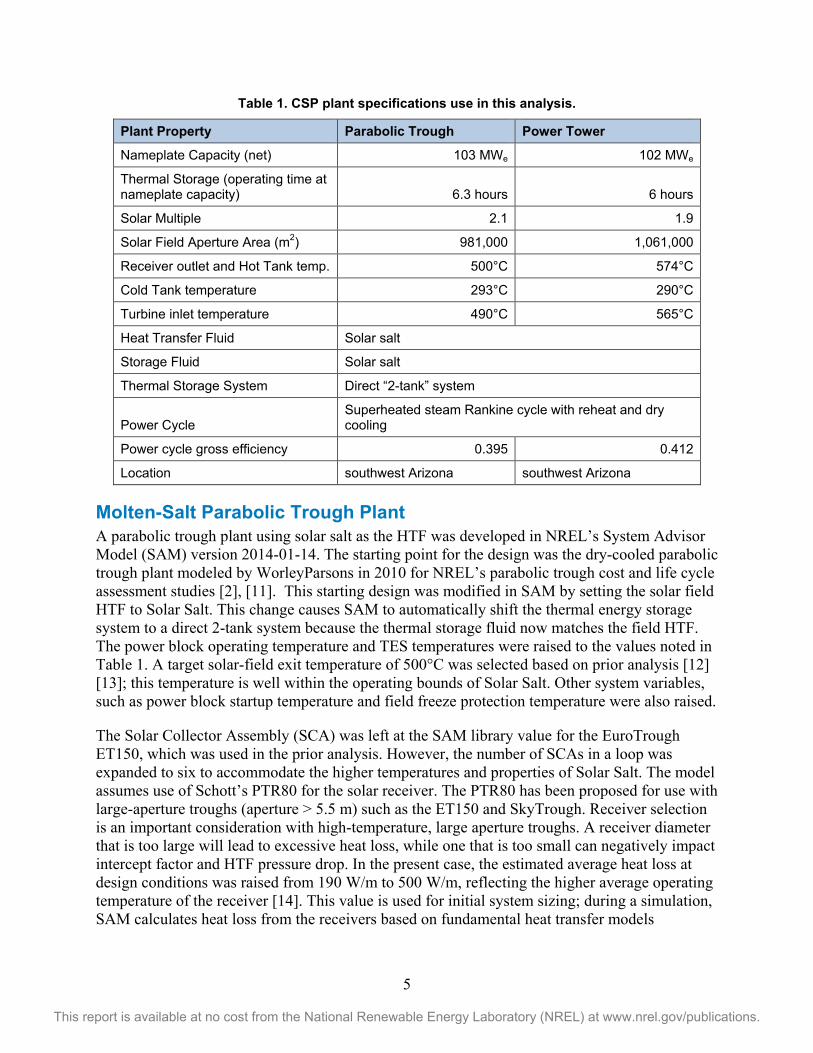
Table 1. CSP plant specifications use in this analysis.
Plant Property Parabolic Trough Power Tower
Nameplate Capacity (net) 103 MWe 102 MWe
Thermal Storage (operating time at nameplate capacity) 6.3 hours 6 hours
Solar Multiple 2.1 1.9
Solar Field Aperture Area (m2) 981,000 1,061,000
Receiver outlet and Hot Tank temp. 500°C 574°C
Cold Tank temperature 293°C 290°C
Turbine inlet temperature 490°C 565°C
Heat Transfer Fluid Solar salt
Storage Fluid Solar salt
Thermal Storage System Direct “2-tank” system
Power Cycle Superheated steam Rankine cycle with reheat and dry cooling
Power cycle gross efficiency 0.395 0.412
Location southwest Arizona southwest Arizona
Molten-Salt Parabolic Trough Plant A parabolic trough plant using solar salt as the HTF was developed in NREL’s System Advisor Model (SAM) version 2014-01-14. The starting point for the design was the dry-cooled parabolic trough plant modeled by WorleyParsons in 2010 for NREL’s parabolic trough cost and life cycle assessment studies [2], [11]. This starting design was modified in SAM by setting the solar field HTF to Solar Salt. This change causes SAM to automatically shift the thermal energy storage system to a direct 2-tank system because the thermal storage fluid now matches the field HTF. The power block operating temperature and TES temperatures were raised to the values noted in Table 1. A target solar-field exit temperature of 500°C was selected based on prior analysis [12] [13]; this temperature is well within the operating bounds of Solar Salt. Other system variables, such as power block startup temperature and field freeze protection temperature were also raised.
The Solar Collector Assembly (SCA) was left at the SAM library value for the EuroTrough ET150, which was used in the prior analysis. However, the number of SCAs in a loop was expanded to six to accommodate the higher temperatures and properties of Solar Salt. The model assumes use of Schott’s PTR80 for the solar receiver. The PTR80 has been proposed for use with large-aperture troughs (aperture > 5.5 m) such as the ET150 and SkyTrough. Receiver selection is an important consideration with high-temperature, large aperture troughs. A receiver diameter that is too large will lead to excessive heat loss, while one that is too small can negatively impact intercept factor and HTF pressure drop. In the present case, the estimated average heat loss at design conditions was raised from 190 W/m to 500 W/m, reflecting the higher average operating temperature of the receiver [14]. This value is used for initial system sizing; during a simulation, SAM calculates heat loss from the receivers based on fundamental heat transfer models
6
This report is available at no cost from the National Renewable Energy Laboratory (NREL) at www.nrel.gov/publications.
developed by Forristall (see [15]), thereby accounting for greater heat loss at the higher operating temperatures.
The gross power block efficiency was raised to 0.395, representative of the improvement one may expect when turbine inlet temperature is increased to 490°C [12]. The dry-cooling conditions were left unchanged from the prior WorleyParsons-study assumptions.
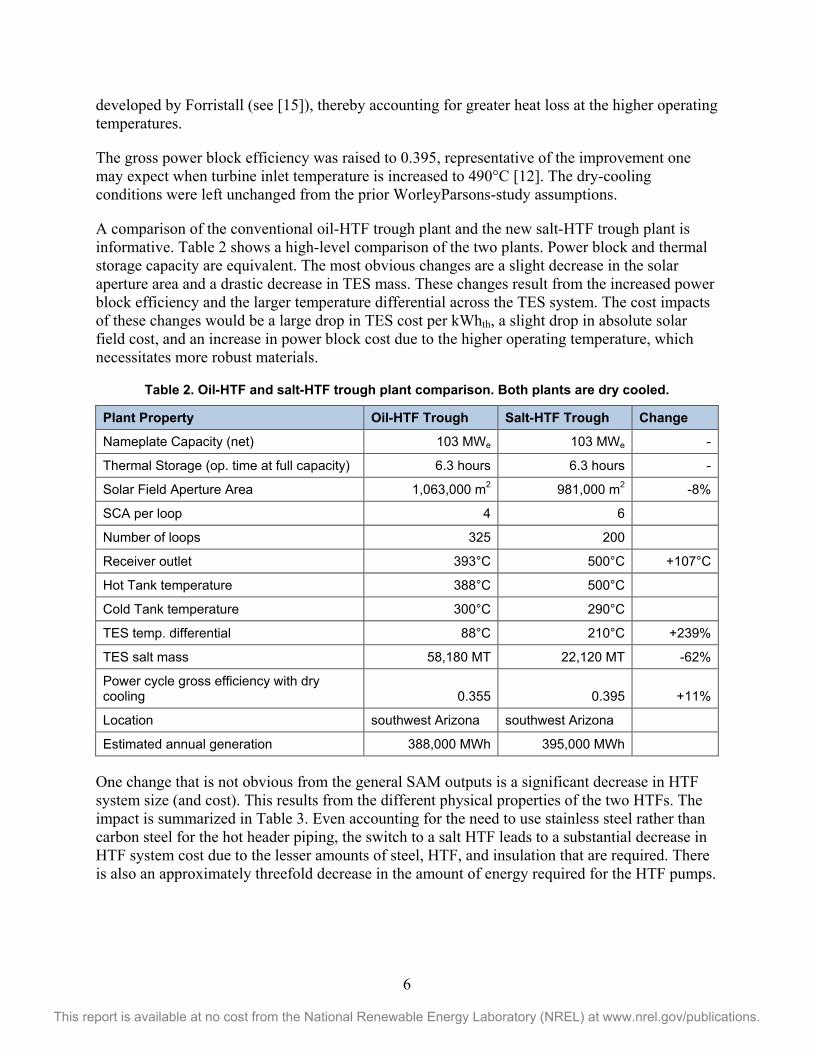
A comparison of the conventional oil-HTF trough plant and the new salt-HTF trough plant is informative. Table 2 shows a high-level comparison of the two plants. Power block and thermal storage capacity are equivalent. The most obvious changes are a slight decrease in the solar aperture area and a drastic decrease in TES mass. These changes result from the increased power block efficiency and the larger temperature differential across the TES system. The cost impacts of these changes would be a large drop in TES cost per kWhth, a slight drop in absolute solar field cost, and an increase in power block cost due to the higher operating temperature, which necessitates more robust materials.
Table 2. Oil-HTF and salt-HTF trough plant comparison. Both plants are dry cooled.
Plant Property Oil-HTF Trough Salt-HTF Trough Change
Nameplate Capacity (net) 103 MWe 103 MWe -
Thermal Storage (op. time at full capacity) 6.3 hours 6.3 hours -
Solar Field Aperture Area 1,063,000 m2 981,000 m2 -8%
SCA per loop 4 6
Number of loops 325 200
Receiver outlet 393°C 500°C +107°C
Hot Tank temperature 388°C 500°C
Cold Tank temperature 300°C 290°C
TES temp. differential 88°C 210°C +239%
TES salt mass 58,180 MT 22,120 MT -62%
Power cycle gross efficiency with dry cooling 0.355 0.395 +11%
Location southwest Arizona southwest Arizona
Estimated annual generation 388,000 MWh 395,000 MWh
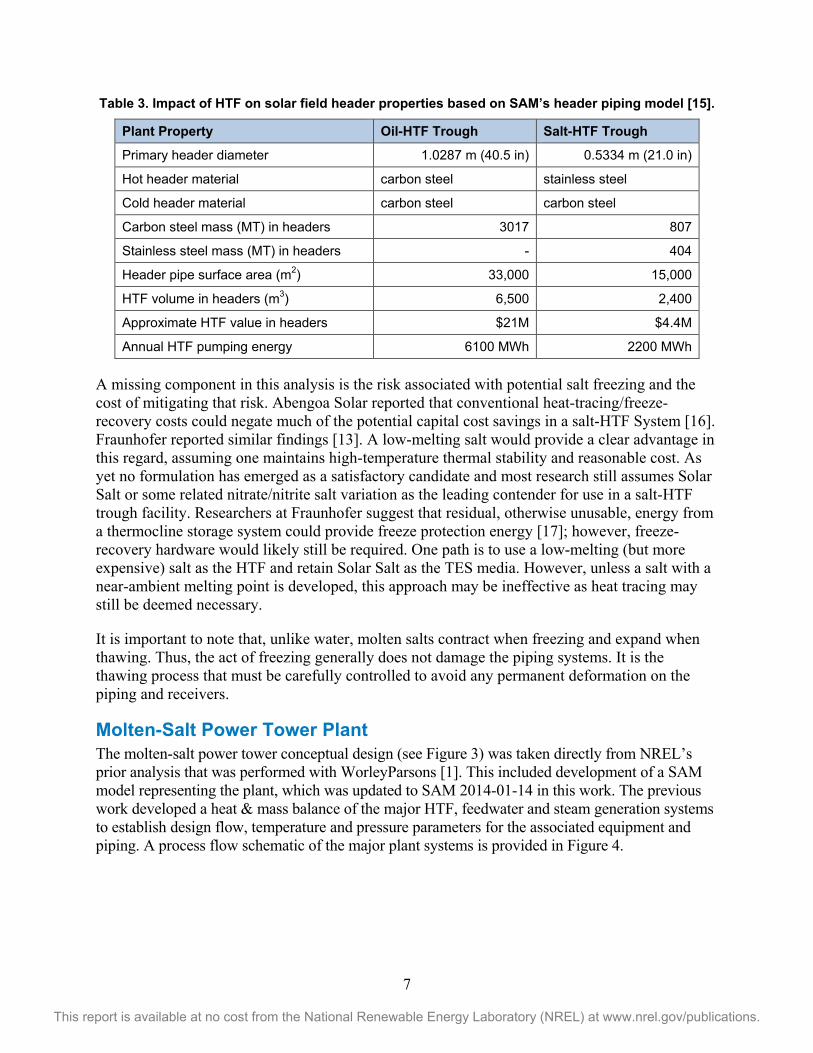
One change that is not obvious from the general SAM outputs is a significant decrease in HTF system size (and cost). This results from the different physical properties of the two HTFs. The impact is summarized in Table 3. Even accounting for the need to use stainless steel rather than carbon steel for the hot header piping, the switch to a salt HTF leads to a substantial decrease in HTF system cost due to the lesser amounts of steel, HTF, and insulation that are required. There is also an approximately threefold decrease in the amount of energy required for the HTF pumps.
7
This report is available at no cost from the National Renewable Energy Laboratory (NREL) at www.nrel.gov/publications.
Table 3. Impact of HTF on solar field header properties based on SAM’s header piping model [15].
Plant Property Oil-HTF Trough Salt-HTF Trough
Primary header diameter 1.0287 m (40.5 in) 0.5334 m (21.0 in)
Hot header material carbon steel stainless steel
Cold header material carbon steel carbon steel
Carbon steel mass (MT) in headers 3017 807
Stainless steel mass (MT) in headers - 404
Header pipe surface area (m2) 33,000 15,000
HTF volume in headers (m3) 6,500 2,400
Approximate HTF value in headers $21M $4.4M
Annual HTF pumping energy 6100 MWh 2200 MWh
A missing component in this analysis is the risk associated with potential salt freezing and the cost of mitigating that risk. Abengoa Solar reported that conventional heat-tracing/freeze-recovery costs could negate much of the potential capital cost savings in a salt-HTF System [16]. Fraunhofer reported similar findings [13]. A low-melting salt would provide a clear advantage in this regard, assuming one maintains high-temperature thermal stability and reasonable cost. As yet no formulation has emerged as a satisfactory candidate and most research still assumes Solar Salt or some related nitrate/nitrite salt variation as the leading contender for use in a salt-HTF trough facility. Researchers at Fraunhofer suggest that residual, otherwise unusable, energy from a thermocline storage system could provide freeze protection energy [17]; however, freeze-recovery hardware would likely still be required. One path is to use a low-melting (but more expensive) salt as the HTF and retain Solar Salt as the TES media. However, unless a salt with a near-ambient melting point is developed, this approach may be ineffective as heat tracing may still be deemed necessary.
It is important to note that, unlike water, molten salts contract when freezing and expand when thawing. Thus, the act of freezing generally does not damage the piping systems. It is the thawing process that must be carefully controlled to avoid any permanent deformation on the piping and receivers.
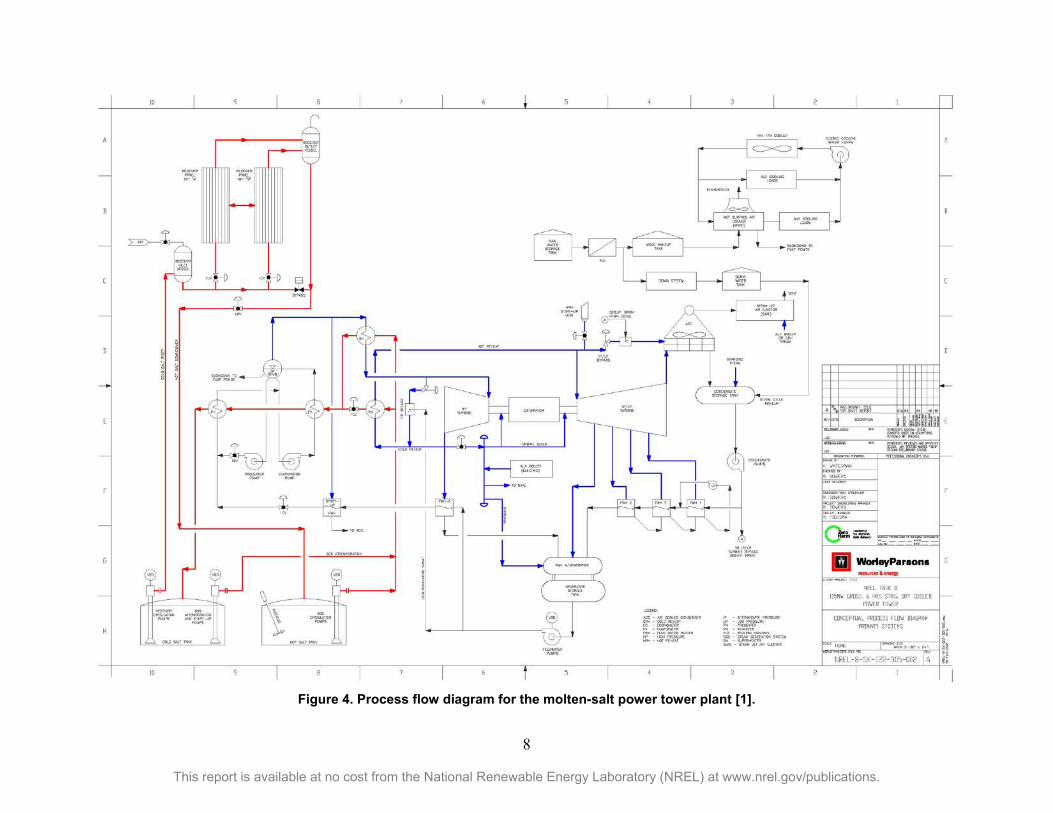
Molten-Salt Power Tower Plant The molten-salt power tower conceptual design (see Figure 3) was taken directly from NREL’s prior analysis that was performed with WorleyParsons [1]. This included development of a SAM model representing the plant, which was updated to SAM 2014-01-14 in this work. The previous work developed a heat & mass balance of the major HTF, feedwater and steam generation systems to establish design flow, temperature and pressure parameters for the associated equipment and piping. A process flow schematic of the major plant systems is provided in Figure 4.
8
This report is available at no cost from the National Renewable Energy Laboratory (NREL) at www.nrel.gov/publications.
Figure 4. Process flow diagram for the molten-salt power tower plant [1].
9
This report is available at no cost from the National Renewable Energy Laboratory (NREL) at www.nrel.gov/publications.
For the receiver design, NREL provided the thermal-transfer capacity, panel quantity, diameter, and height of the solar receiver and also the panel tube diameter, wall thickness, and solar absorption length. Tube quantities per panel were calculated from these data, and structures were designed to support the panel tubes and headers. An additional structure attached to the top of the tower was designed to support the panels, boom crane, salt inlet vessel, salt outlet vessel, salt overflow vessel, and other auxiliary receiver equipment. A concrete tower was designed based on the seismic criteria and typical soils found in the Tucson, AZ area. The weight of the receiver and equipment, salt piping, heat tracing, insulation, instrumentation, and wiring was calculated to determine the design load on top of and inside of the concrete tower. The tower and receiver included stairs, platforms, and elevators for personnel and equipment.
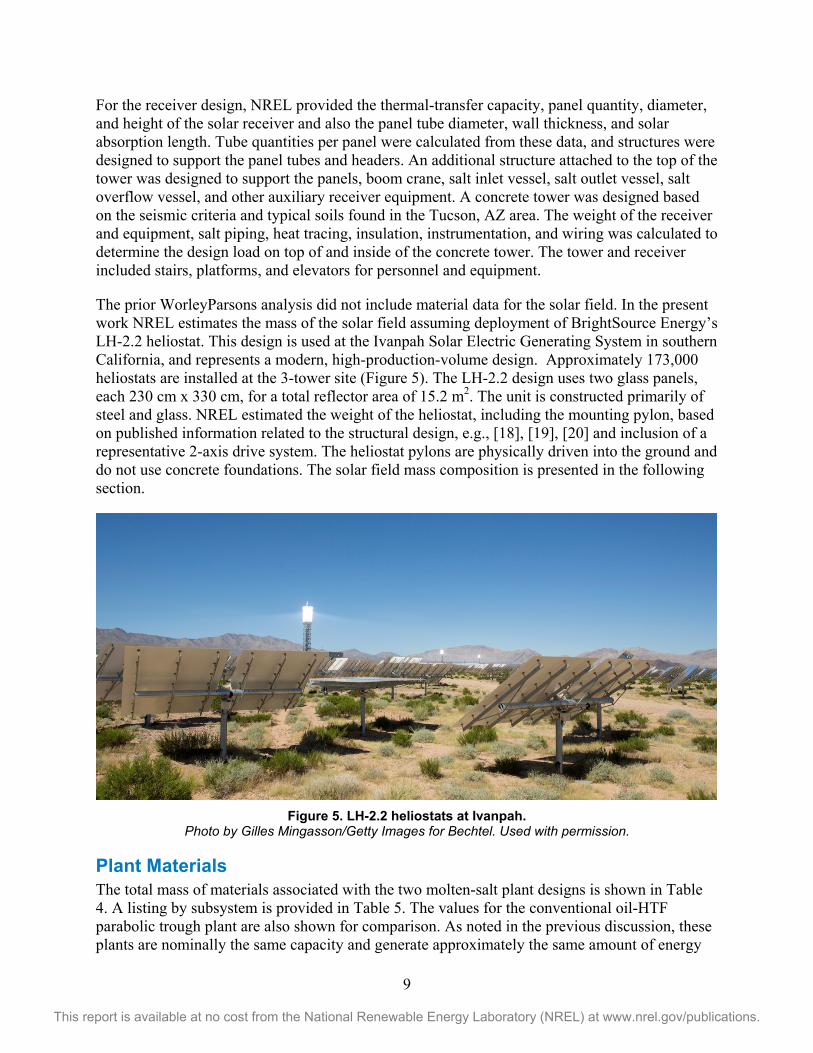
The prior WorleyParsons analysis did not include material data for the solar field. In the present work NREL estimates the mass of the solar field assuming deployment of BrightSource Energy’s LH-2.2 heliostat. This design is used at the Ivanpah Solar Electric Generating System in southern California, and represents a modern, high-production-volume design. Approximately 173,000 heliostats are installed at the 3-tower site (Figure 5). The LH-2.2 design uses two glass panels, each 230 cm x 330 cm, for a total reflector area of 15.2 m2. The unit is constructed primarily of steel and glass. NREL estimated the weight of the heliostat, including the mounting pylon, based on published information related to the structural design, e.g., [18], [19], [20] and inclusion of a representative 2-axis drive system. The heliostat pylons are physically driven into the ground and do not use concrete foundations. The solar field mass composition is presented in the following section.
Figure 5. LH-2.2 heliostats at Ivanpah.
Photo by Gilles Mingasson/Getty Images for Bechtel. Used with permission.
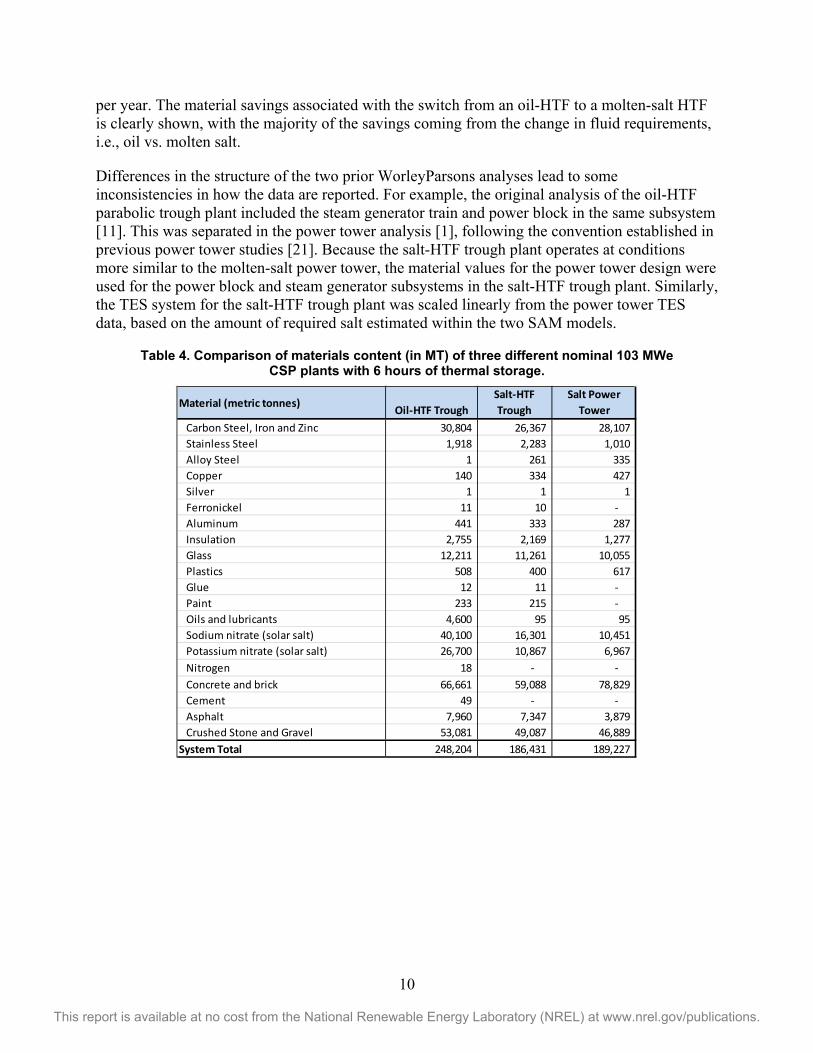
Plant Materials The total mass of materials associated with the two molten-salt plant designs is shown in Table 4. A listing by subsystem is provided in Table 5. The values for the conventional oil-HTF parabolic trough plant are also shown for comparison. As noted in the previous discussion, these plants are nominally the same capacity and generate approximately the same amount of energy
10
This report is available at no cost from the National Renewable Energy Laboratory (NREL) at www.nrel.gov/publications.
per year. The material savings associated with the switch from an oil-HTF to a molten-salt HTF is clearly shown, with the majority of the savings coming from the change in fluid requirements, i.e., oil vs. molten salt.
Differences in the structure of the two prior WorleyParsons analyses lead to some inconsistencies in how the data are reported. For example, the original analysis of the oil-HTF parabolic trough plant included the steam generator train and power block in the same subsystem [11]. This was separated in the power tower analysis [1], following the convention established in previous power tower studies [21]. Because the salt-HTF trough plant operates at conditions more similar to the molten-salt power tower, the material values for the power tower design were used for the power block and steam generator subsystems in the salt-HTF trough plant. Similarly, the TES system for the salt-HTF trough plant was scaled linearly from the power tower TES data, based on the amount of required salt estimated within the two SAM models.
Table 4. Comparison of materials content (in MT) of three different nominal 103 MWe CSP plants with 6 hours of thermal storage.
Material (metric tonnes) Oil-HTF TroughSalt-HTF Trough
Salt Power Tower
Carbon Steel, Iron and Zinc 30,804 26,367 28,107 Stainless Steel 1,918 2,283 1,010 Alloy Steel 1 261 335 Copper 140 334 427 Silver 1 1 1 Ferronickel 11 10 - Aluminum 441 333 287 Insulation 2,755 2,169 1,277 Glass 12,211 11,261 10,055 Plastics 508 400 617 Glue 12 11 - Paint 233 215 - Oils and lubricants 4,600 95 95 Sodium nitrate (solar salt) 40,100 16,301 10,451 Potassium nitrate (solar salt) 26,700 10,867 6,967 Nitrogen 18 - - Concrete and brick 66,661 59,088 78,829 Cement 49 - - Asphalt 7,960 7,347 3,879 Crushed Stone and Gravel 53,081 49,087 46,889
System Total 248,204 186,431 189,227
11
This report is available at no cost from the National Renewable Energy Laboratory (NREL) at www.nrel.gov/publications.
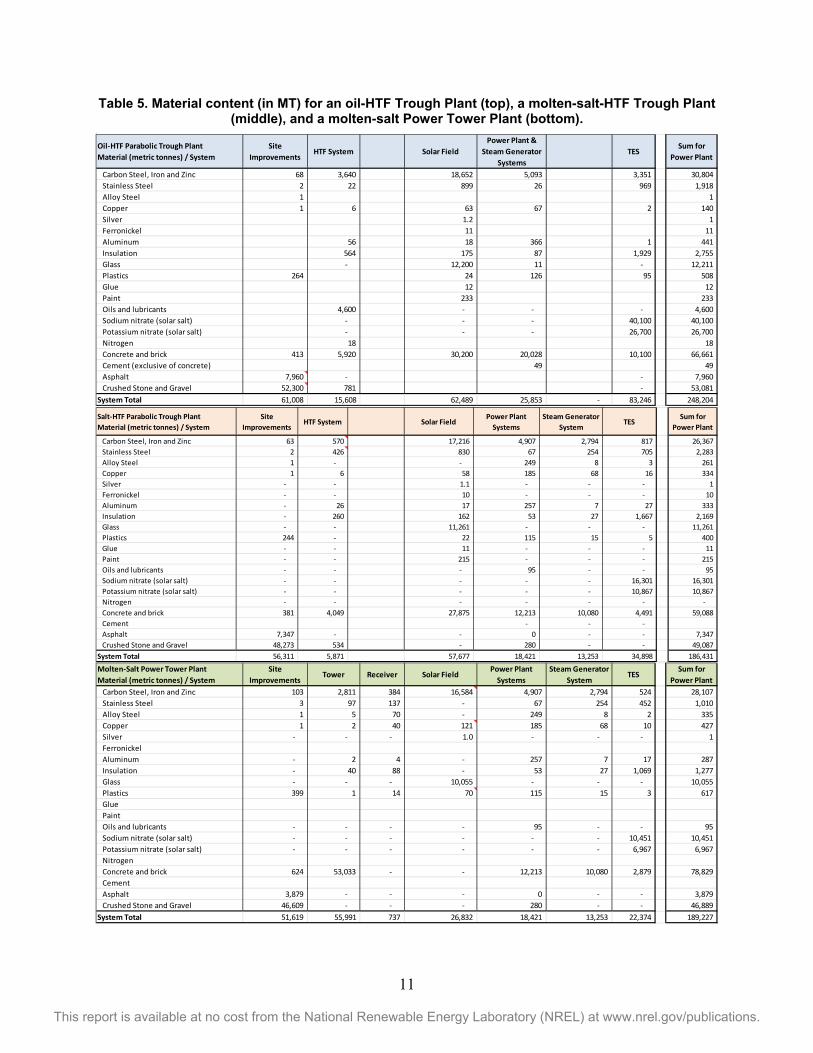
Table 5. Material content (in MT) for an oil-HTF Trough Plant (top), a molten-salt-HTF Trough Plant (middle), and a molten-salt Power Tower Plant (bottom).
Oil-HTF Parabolic Trough Plant Material (metric tonnes) / System
Site Improvements
HTF System Solar FieldPower Plant &
Steam Generator Systems
TESSum for
Power Plant
Carbon Steel, Iron and Zinc 68 3,640 18,652 5,093 3,351 30,804 Stainless Steel 2 22 899 26 969 1,918 Alloy Steel 1 1 Copper 1 6 63 67 2 140 Silver 1.2 1 Ferronickel 11 11 Aluminum 56 18 366 1 441 Insulation 564 175 87 1,929 2,755 Glass - 12,200 11 - 12,211 Plastics 264 24 126 95 508 Glue 12 12 Paint 233 233 Oils and lubricants 4,600 - - - 4,600 Sodium nitrate (solar salt) - - - 40,100 40,100 Potassium nitrate (solar salt) - - - 26,700 26,700 Nitrogen 18 18 Concrete and brick 413 5,920 30,200 20,028 10,100 66,661 Cement (exclusive of concrete) 49 49 Asphalt 7,960 - - 7,960 Crushed Stone and Gravel 52,300 781 - 53,081
System Total 61,008 15,608 62,489 25,853 - 83,246 248,204
Salt-HTF Parabolic Trough PlantMaterial (metric tonnes) / System
Site Improvements
HTF System Solar FieldPower Plant
SystemsSteam Generator
SystemTES
Sum for Power Plant
Carbon Steel, Iron and Zinc 63 570 17,216 4,907 2,794 817 26,367 Stainless Steel 2 426 830 67 254 705 2,283 Alloy Steel 1 - - 249 8 3 261 Copper 1 6 58 185 68 16 334 Silver - - 1.1 - - - 1 Ferronickel - - 10 - - - 10 Aluminum - 26 17 257 7 27 333 Insulation - 260 162 53 27 1,667 2,169 Glass - - 11,261 - - - 11,261 Plastics 244 - 22 115 15 5 400 Glue - - 11 - - - 11 Paint - - 215 - - - 215 Oils and lubricants - - - 95 - - 95 Sodium nitrate (solar salt) - - - - - 16,301 16,301 Potassium nitrate (solar salt) - - - - - 10,867 10,867 Nitrogen - - - - - - - Concrete and brick 381 4,049 27,875 12,213 10,080 4,491 59,088 Cement - - - Asphalt 7,347 - - 0 - - 7,347 Crushed Stone and Gravel 48,273 534 - 280 - - 49,087
System Total 56,311 5,871 57,677 18,421 13,253 34,898 186,431
Molten-Salt Power Tower PlantMaterial (metric tonnes) / System
Site Improvements
Tower Receiver Solar FieldPower Plant
SystemsSteam Generator
SystemTES
Sum for Power Plant
Carbon Steel, Iron and Zinc 103 2,811 384 16,584 4,907 2,794 524 28,107 Stainless Steel 3 97 137 - 67 254 452 1,010 Alloy Steel 1 5 70 - 249 8 2 335 Copper 1 2 40 121 185 68 10 427 Silver - - - 1.0 - - - 1 FerronickelAluminum - 2 4 - 257 7 17 287 Insulation - 40 88 - 53 27 1,069 1,277 Glass - - - 10,055 - - - 10,055 Plastics 399 1 14 70 115 15 3 617 GluePaintOils and lubricants - - - - 95 - - 95 Sodium nitrate (solar salt) - - - - - - 10,451 10,451 Potassium nitrate (solar salt) - - - - - - 6,967 6,967 NitrogenConcrete and brick 624 53,033 - - 12,213 10,080 2,879 78,829 CementAsphalt 3,879 - - - 0 - - 3,879 Crushed Stone and Gravel 46,609 - - - 280 - - 46,889
System Total 51,619 55,991 737 26,832 18,421 13,253 22,374 189,227
12
This report is available at no cost from the National Renewable Energy Laboratory (NREL) at www.nrel.gov/publications.
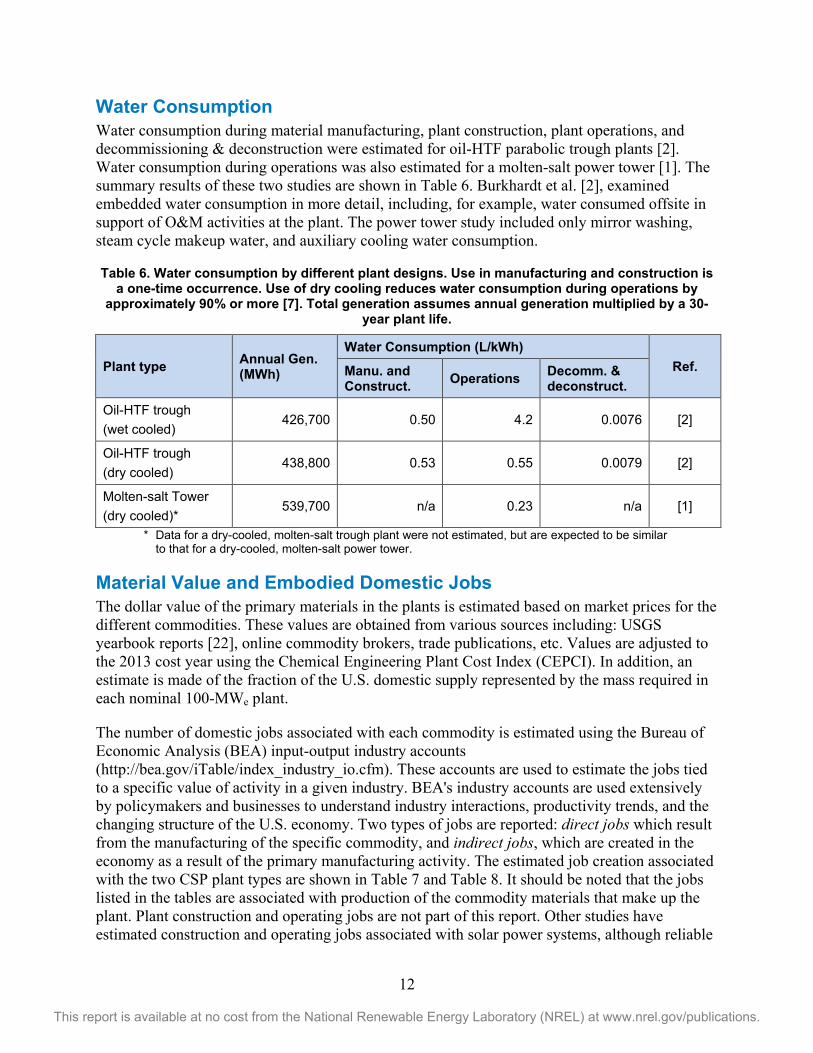
Water Consumption Water consumption during material manufacturing, plant construction, plant operations, and decommissioning & deconstruction were estimated for oil-HTF parabolic trough plants [2]. Water consumption during operations was also estimated for a molten-salt power tower [1]. The summary results of these two studies are shown in Table 6. Burkhardt et al. [2], examined embedded water consumption in more detail, including, for example, water consumed offsite in support of O&M activities at the plant. The power tower study included only mirror washing, steam cycle makeup water, and auxiliary cooling water consumption.
Table 6. Water consumption by different plant designs. Use in manufacturing and construction is a one-time occurrence. Use of dry cooling reduces water consumption during operations by
approximately 90% or more [7]. Total generation assumes annual generation multiplied by a 30-year plant life.
Plant type Annual Gen. (MWh)
Water Consumption (L/kWh) Ref. Manu. and
Construct. Operations Decomm. & deconstruct.
Oil-HTF trough (wet cooled)
426,700 0.50 4.2 0.0076 [2]
Oil-HTF trough (dry cooled)
438,800 0.53 0.55 0.0079 [2]
Molten-salt Tower (dry cooled)*
539,700 n/a 0.23 n/a [1]
* Data for a dry-cooled, molten-salt trough plant were not estimated, but are expected to be similar to that for a dry-cooled, molten-salt power tower.
Material Value and Embodied Domestic Jobs The dollar value of the primary materials in the plants is estimated based on market prices for the different commodities. These values are obtained from various sources including: USGS yearbook reports [22], online commodity brokers, trade publications, etc. Values are adjusted to the 2013 cost year using the Chemical Engineering Plant Cost Index (CEPCI). In addition, an estimate is made of the fraction of the U.S. domestic supply represented by the mass required in each nominal 100-MWe plant.
The number of domestic jobs associated with each commodity is estimated using the Bureau of Economic Analysis (BEA) input-output industry accounts (http://bea.gov/iTable/index_industry_io.cfm). These accounts are used to estimate the jobs tied to a specific value of activity in a given industry. BEA's industry accounts are used extensively by policymakers and businesses to understand industry interactions, productivity trends, and the changing structure of the U.S. economy. Two types of jobs are reported: direct jobs which result from the manufacturing of the specific commodity, and indirect jobs, which are created in the economy as a result of the primary manufacturing activity. The estimated job creation associated with the two CSP plant types are shown in Table 7 and Table 8. It should be noted that the jobs listed in the tables are associated with production of the commodity materials that make up the plant. Plant construction and operating jobs are not part of this report. Other studies have estimated construction and operating jobs associated with solar power systems, although reliable
13
This report is available at no cost from the National Renewable Energy Laboratory (NREL) at www.nrel.gov/publications.
data are often difficult to obtain [23]. A recent analysis estimated substantial net job creation from a shift away from fossil energy to renewable energy sources [24].
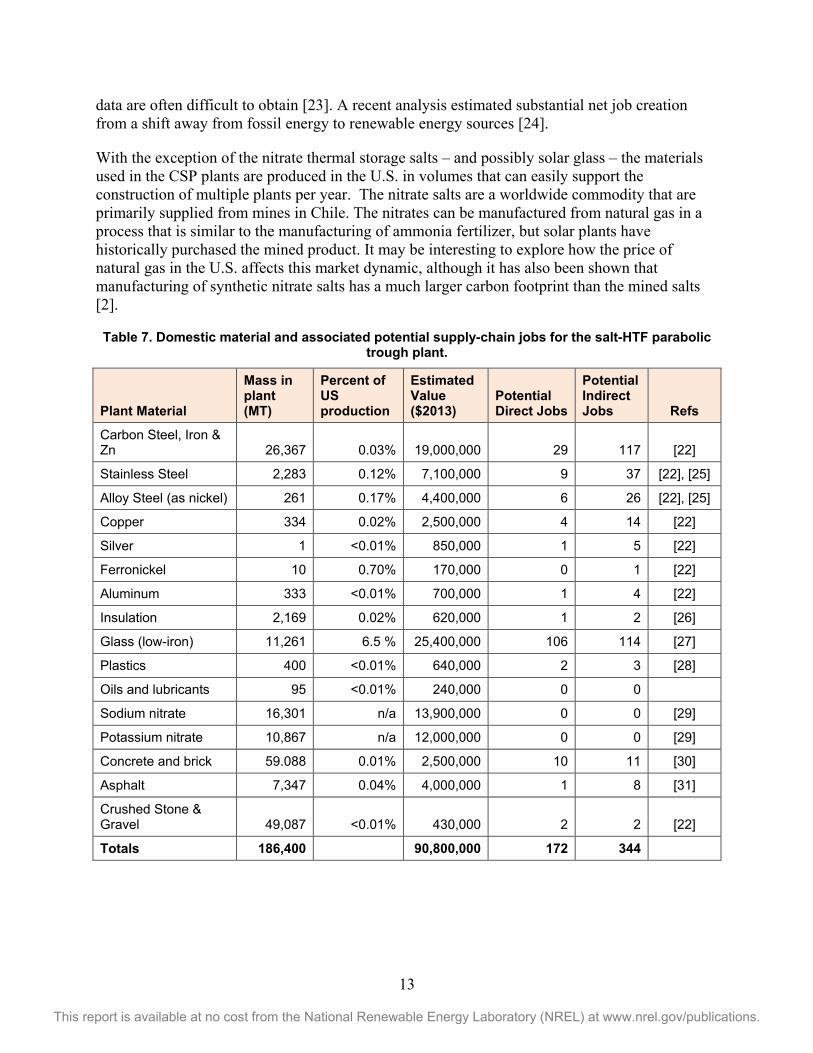
With the exception of the nitrate thermal storage salts – and possibly solar glass – the materials used in the CSP plants are produced in the U.S. in volumes that can easily support the construction of multiple plants per year. The nitrate salts are a worldwide commodity that are primarily supplied from mines in Chile. The nitrates can be manufactured from natural gas in a process that is similar to the manufacturing of ammonia fertilizer, but solar plants have historically purchased the mined product. It may be interesting to explore how the price of natural gas in the U.S. affects this market dynamic, although it has also been shown that manufacturing of synthetic nitrate salts has a much larger carbon footprint than the mined salts [2].
Table 7. Domestic material and associated potential supply-chain jobs for the salt-HTF parabolic trough plant.
Plant Material
Mass in plant (MT)
Percent of US production
Estimated Value ($2013)
Potential Direct Jobs
Potential Indirect Jobs Refs
Carbon Steel, Iron & Zn 26,367 0.03% 19,000,000 29 117 [22]
Stainless Steel 2,283 0.12% 7,100,000 9 37 [22], [25]
Alloy Steel (as nickel) 261 0.17% 4,400,000 6 26 [22], [25]
Copper 334 0.02% 2,500,000 4 14 [22]
Silver 1 <0.01% 850,000 1 5 [22]
Ferronickel 10 0.70% 170,000 0 1 [22]
Aluminum 333 <0.01% 700,000 1 4 [22]
Insulation 2,169 0.02% 620,000 1 2 [26]
Glass (low-iron) 11,261 6.5 % 25,400,000 106 114 [27]
Plastics 400 <0.01% 640,000 2 3 [28]
Oils and lubricants 95 <0.01% 240,000 0 0
Sodium nitrate 16,301 n/a 13,900,000 0 0 [29]
Potassium nitrate 10,867 n/a 12,000,000 0 0 [29]
Concrete and brick 59.088 0.01% 2,500,000 10 11 [30]
Asphalt 7,347 0.04% 4,000,000 1 8 [31]
Crushed Stone & Gravel 49,087 <0.01% 430,000 2 2 [22]
Totals 186,400 90,800,000 172 344
14
This report is available at no cost from the National Renewable Energy Laboratory (NREL) at www.nrel.gov/publications.
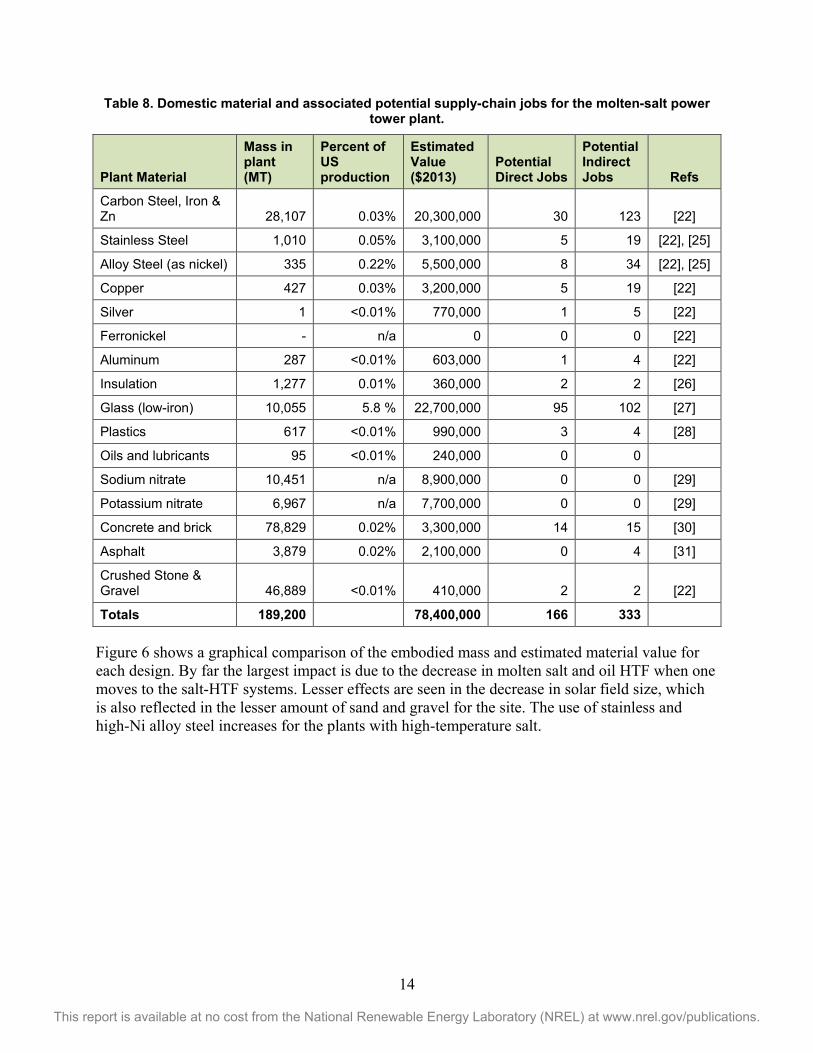
Table 8. Domestic material and associated potential supply-chain jobs for the molten-salt power tower plant.
Plant Material
Mass in plant (MT)
Percent of US production
Estimated Value ($2013)
Potential Direct Jobs
Potential Indirect Jobs Refs
Carbon Steel, Iron & Zn 28,107 0.03% 20,300,000 30 123 [22]
Stainless Steel 1,010 0.05% 3,100,000 5 19 [22], [25]
Alloy Steel (as nickel) 335 0.22% 5,500,000 8 34 [22], [25]
Copper 427 0.03% 3,200,000 5 19 [22]
Silver 1 <0.01% 770,000 1 5 [22]
Ferronickel - n/a 0 0 0 [22]
Aluminum 287 <0.01% 603,000 1 4 [22]
Insulation 1,277 0.01% 360,000 2 2 [26]
Glass (low-iron) 10,055 5.8 % 22,700,000 95 102 [27]
Plastics 617 <0.01% 990,000 3 4 [28]
Oils and lubricants 95 <0.01% 240,000 0 0
Sodium nitrate 10,451 n/a 8,900,000 0 0 [29]
Potassium nitrate 6,967 n/a 7,700,000 0 0 [29]
Concrete and brick 78,829 0.02% 3,300,000 14 15 [30]
Asphalt 3,879 0.02% 2,100,000 0 4 [31]
Crushed Stone & Gravel 46,889 <0.01% 410,000 2 2 [22]
Totals 189,200 78,400,000 166 333
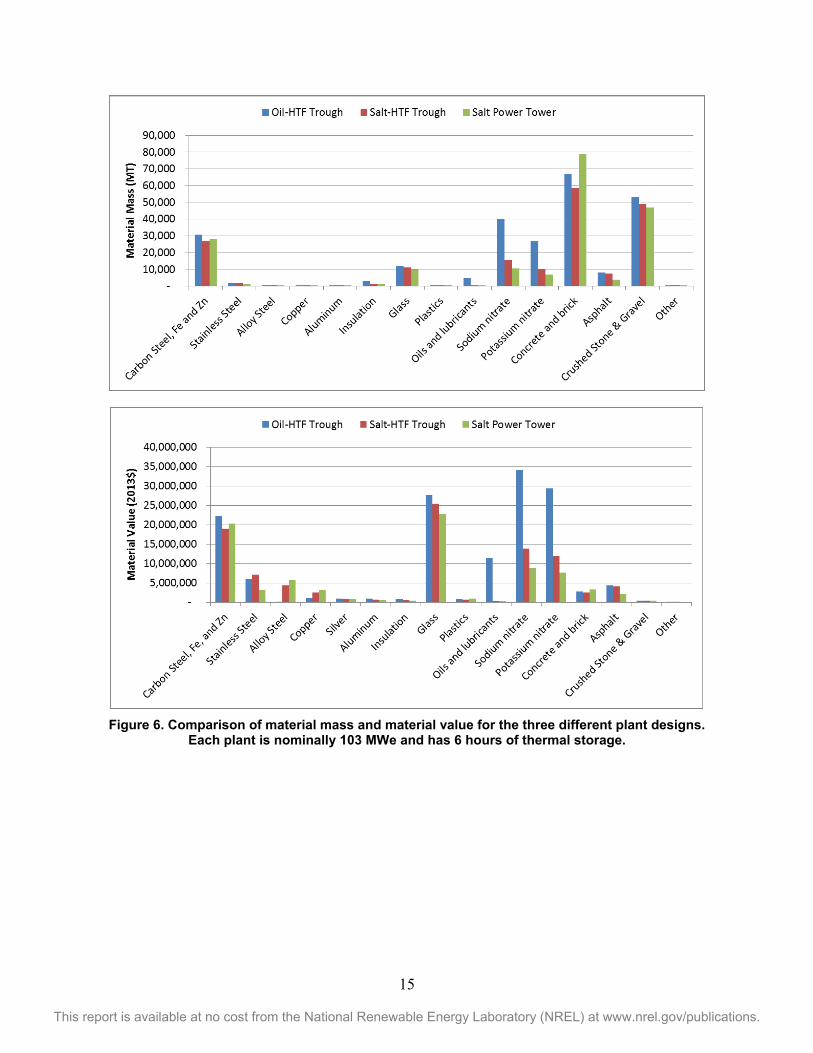
Figure 6 shows a graphical comparison of the embodied mass and estimated material value for each design. By far the largest impact is due to the decrease in molten salt and oil HTF when one moves to the salt-HTF systems. Lesser effects are seen in the decrease in solar field size, which is also reflected in the lesser amount of sand and gravel for the site. The use of stainless and high-Ni alloy steel increases for the plants with high-temperature salt.
15
This report is available at no cost from the National Renewable Energy Laboratory (NREL) at www.nrel.gov/publications.
Figure 6. Comparison of material mass and material value for the three different plant designs.
Each plant is nominally 103 MWe and has 6 hours of thermal storage.
16
This report is available at no cost from the National Renewable Energy Laboratory (NREL) at www.nrel.gov/publications.
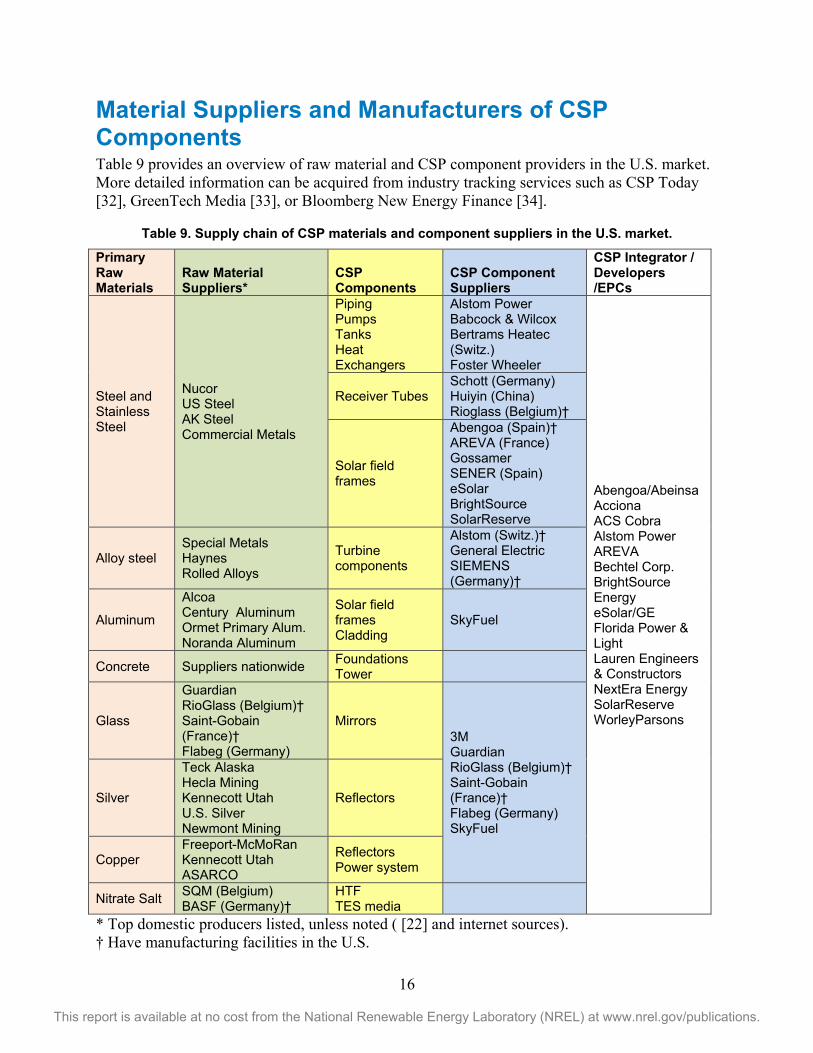
Material Suppliers and Manufacturers of CSP Components Table 9 provides an overview of raw material and CSP component providers in the U.S. market. More detailed information can be acquired from industry tracking services such as CSP Today [32], GreenTech Media [33], or Bloomberg New Energy Finance [34].
Table 9. Supply chain of CSP materials and component suppliers in the U.S. market.
Primary Raw Materials
Raw Material Suppliers*
CSP Components
CSP Component Suppliers
CSP Integrator / Developers /EPCs
Steel and Stainless Steel
Nucor US Steel AK Steel Commercial Metals
Piping Pumps Tanks Heat Exchangers
Alstom Power Babcock & Wilcox Bertrams Heatec (Switz.) Foster Wheeler
Abengoa/Abeinsa Acciona ACS Cobra Alstom Power AREVA Bechtel Corp. BrightSource Energy eSolar/GE Florida Power & Light Lauren Engineers & Constructors NextEra Energy SolarReserve WorleyParsons
Receiver Tubes Schott (Germany) Huiyin (China) Rioglass (Belgium)†
Solar field frames
Abengoa (Spain)† AREVA (France) Gossamer SENER (Spain) eSolar BrightSource SolarReserve
Alloy steel Special Metals Haynes Rolled Alloys
Turbine components
Alstom (Switz.)† General Electric SIEMENS (Germany)†
Aluminum
Alcoa Century Aluminum Ormet Primary Alum. Noranda Aluminum
Solar field frames Cladding
SkyFuel
Concrete Suppliers nationwide Foundations Tower
Glass
Guardian RioGlass (Belgium)† Saint-Gobain (France)† Flabeg (Germany)
Mirrors 3M Guardian RioGlass (Belgium)† Saint-Gobain (France)† Flabeg (Germany) SkyFuel
Silver
Teck Alaska Hecla Mining Kennecott Utah U.S. Silver Newmont Mining
Reflectors
Copper Freeport-McMoRan Kennecott Utah ASARCO
Reflectors Power system
Nitrate Salt SQM (Belgium) BASF (Germany)†
HTF TES media
* Top domestic producers listed, unless noted ( [22] and internet sources). † Have manufacturing facilities in the U.S.
17
This report is available at no cost from the National Renewable Energy Laboratory (NREL) at www.nrel.gov/publications.
Conclusions This study compiled material composition data for a molten-salt power tower and hypothetical molten-salt-HTF parabolic trough plant. The former design is commercial and the latter has reached pilot-scale stage in the form of the Archimede plant in Italy. The analysis sized both plants for similar power production (103 MWe) and thermal storage (6 hours) capacity. The material composition of the salt-HTF trough plant was approximately 25% lower than a comparably sized conventional oil-HTF parabolic trough plant. Although cost analysis was not part of this project scope, the significant reduction in oil, salt, metal, and insulation mass by switching to a salt-HTF design is expected to reduce the capital cost and LCOE for the parabolic trough system.
The overall embodied mass of the salt-HTF trough plant was slightly below that of the salt tower design. The similarity in the total mass of the two designs, along with their similar power generation profiles and operating requirements, suggests that salt-HTF trough plants could be competitive with molten-salt power towers if the technical hurdles of deploying salt in the solar field can be overcome. Parabolic tough systems have other advantages, such as modularity, no concerns related to reflected sunlight or towers affecting birds or aircraft, and a more extensive operating record, that could influence technology selection. However, questions remain regarding the potential cost and complexity of freeze protection and freeze recovery technology for salt-HTF troughs.
CSP plants are composed mainly of steel, glass, concrete and aggregate materials, which are abundantly available from domestic sources. This is true for most locations in the world where CSP plants might be deployed and is an attractive attribute of the technology with regards to its impact on the local economy. In the U.S., we estimate that 90% by mass and 79% by value of the commodity materials utilized in a CSP plant can be supplied by domestic sources.
The most unique of the materials with respect to potential sources is the nitrate solar salt. The largest supply of nitrate salt is from the Atacama Desert in Chile. Alternative salts based on chlorides or carbonates would be more universally accessible, but the selection of salt is dominated by the thermo-physical properties of the salt, and thus far no material has been able to supplant the nitrates. Nitrate salts can be produced synthetically from natural gas, which may be a viable domestic option with sufficiently low gas prices.
18
This report is available at no cost from the National Renewable Energy Laboratory (NREL) at www.nrel.gov/publications.
Nomenclature BEA Bureau of Economic Analysis CSP Concentrating Solar Power DOE Department of Energy EPC Engineering, Procurement, Construction (type of contract or contractor) HTF Heat Transfer Fluid ITC Investment Tax Credit LCOE Levelized Cost of Energy MT Metric Tonne NREL National Renewable Energy Laboratory PV Photovoltaic SAM System Advisor Model SCA Solar Collector Assembly TES Thermal Energy Storage
19
This report is available at no cost from the National Renewable Energy Laboratory (NREL) at www.nrel.gov/publications.
Works Cited [1] C. S. Turchi and G. A. Heath, "Molten Salt Power Tower Cost Model for the System
Advisor Model (SAM)," National Renewable Energy Laboratory, Golden, Colorado, 2013.
[2] J. J. Burkhardt, G. A. Heath and C. S. Turchi, "Life Cycle Assessment of a Parabolic Trough Concentrating Solar Power Plant and the Impacts of Key Design Alternatives," Environmental Science & Technology, vol. 45, no. 6, pp. 2457-2464, 2011.
[3] M. Bolinger and S. Weaver, "Utility-Scale Solar 2012, An Empirical Analysis of Project Cost, Performance, and Pricing Trends in the United States," Lawrence Berkeley National Laboratory, LBNL-6408E, Berkeley, California, USA, 2013.
[4] S. H. Madaeni, R. Sioshansi and P. Denholm, "Estimating the Capacity Value of Concentrating Solar Power Plants With Thermal Energy Storage: A Case Study of the Southwestern United States," IEEE Transactions on Power Systems, vol. 28, no. 2, pp. 1205-1215, 2013.
[5] P. Denholm, Y. H. Wan, M. Hummon and M. Mehos, "Value of CSP with Thermal Energy Storage in the Western United States," Energy Procedia, vol. 49, pp. 1622-1631, 2013.
[6] Solar Energy Technologies Office, "SunShot Initiative: Tackling Challenges in Solar," U.S. Department of Energy, Washington, DC, 2014.
[7] C. Turchi, M. Wagner and C. Kutscher, "Water Use in Parabolic Trough Power Plants: Summary Results from WorleyParsons' Analyses," National Renewable Energy Laboratory, NREL/TP-5500-49468, Golden, CO, 2010.
[8] D. Kearney, B. Kelly, D. Cable, N. Potrovitza, U. Herrmann, P. Nava, R. Mahoney, J. Pacheco, D. Blake and H. Price, "Overview on Use of a Molten Salt HTF in a Trough Solar Field," National Renewable Energy Laboratory, NREL/PR-550-40028, Golden, Colorado, USA, 2003.
[9] Solar Millennium, LLC, "Advanced High Temperature Trough Collector Development, US DOE project DE-FC36-08GO18035," 2011.
[10] M. Falchetta, "Control and Automation of the Archimede Molten Salt Operated Solar Field," in SolarPACES 2009, Berlin, Germany, 2009.
[11] C. Turchi, "Parabolic Trough Reference Plant for Cost Modeling with the Solar Advisor Model (SAM)," National Renewable Energy Laboratory, NREL/TP-550-47605, Golden, CO, 2010.
[12] C. Turchi, M. Mehos, C. K. Ho and G. J. Kolb, "Current and Future Costs for Parabolic Trough and Power Tower Systems in the US Market," in SolarPACES 2010, Perpignan, France, 2010.
20
This report is available at no cost from the National Renewable Energy Laboratory (NREL) at www.nrel.gov/publications.
[13] F. Boss, T. P. Fluri, R. Branke and W. J. Platzer, "Simulation of Parabolic Trough Power Plants with Molten Salt as Heat Transfer Fluid," in SolarPACES 2012, Marrakech, Morocco, 2012.
[14] J. Crawford and F. Burkholder, "Heat Loss Testing of Schott's Prototype PTR 80-4.7 (2008) Parabolic Trough Receiver," National Renewable Energy Laboratory, Golden, CO, 2009.
[15] M. Wagner and P. Gilman, "Technical Manual for the SAM Physical Trough Model," National Renewable Energy Laboratory, NREL/TP-5500-51825, Golden, CO, 2011.
[16] Abengoa Solar, "Development of Molten-Salt Heat Transfer Fluid Technology for Parabolic Trough Solar Power Plants," www.OSTI.gov, 2013.
[17] B. T. Seubert, A. K. Vogel, T. P. Flui and W. J. Platzer, "Freeze Protection Strategies for Molten Salt Parabolic Trough Solar Fields using Residual Heat of Thermocline Storages," in SolarPACES 2014, Beijing, China, 2014.
[18] S. Huss, Y. D. Traeger, Z. Shvets, M. Rojansky, S. Stoyanoff and J. Garber, "Evaluating Effects of Wind Loads in Heliostat Design," in SolarPACES 2011, Granada, Spain, 2011.
[19] M. Bobinecz, "Ivanpah Solar Electric Generating Facility," in Engineering and Construction Contracting Conference, San Antonio, Texas, 2012.
[20] K. R. Bhargav, F. Gross and P. Schramek, "Life Cycle cost optimized heliostat size for power towers," in SolarPACES 2013, Las Vegas, Nevada, USA, 2013.
[21] G. J. Kolb, C. K. Ho, T. R. Mancini and J. Gary, "Power Tower Technology Roadmap and Cost Reduction Plan," Sandia National Laboratories, SAND2011-2419, Albuquerque, New Mexico, USA, 2011.
[22] US Geological Survey, "USGS Minerals Yearbook," [Online]. Available: http://minerals.usgs.gov/minerals/pubs/commodity/myb/.
[23] L. Cameron and B. van der Zwaan, "Employment factors for wind and solar energy technologies: a literature review," Renewable and Sustainable Energy Reviews, vol. 45, pp. 160-172, 2015.
[24] M. Z. Jacobson, et al., "100% clean and renewable wind, water, and sunlight (WWS) all-sector energy roadmaps forthe 50 United States," Energy & Environmental Science, vol. 8, pp. 2093-2117, 2015.
[25] "Stainless Steel News and Nickel Prices," [Online]. Available: www.estainlesssteel.com. [Accessed May 2015].
[26] Worrell, E., C. Galitsky, E. Masanet and W. Graus, "Energy Efficiency Improvement and Cost Saving Opportunities for the Glass Industry," Lawrence berkeley National Laboratory, LBNL-57335, Berkeley, California, USA, 2008.
21
This report is available at no cost from the National Renewable Energy Laboratory (NREL) at www.nrel.gov/publications.
[27] Major US glass supplier, April, 2015.
[28] Platts Global, "Low-Density Polyethylene Price Index," 2013.
[29] G. Casubolo, "SQM," email correspondence, February, 2015.
[30] "US Ready-Mix Concrete shipped value," 2010. [Online]. Available: Statista.com. [Accessed May 2015].
[31] California Department of Transportation, "Asphalt Prices, used representative summer value," 2013. [Online]. Available: http://www.dot.ca.gov/hq/esc/oe/asphalt_index/PREVIOUS_YEARS/.
[32] CSP Today, [Online]. Available: http://social.csptoday.com/.
[33] GreenTech Media, [Online]. Available: http://www.greentechmedia.com/.
[34] Bloomberg New Energy Finance, [Online]. Available: http://www.bloomberg.com/profiles/companies/3470094Z:LN-bloomberg-new-energy-finance
22
This report is available at no cost from the National Renewable Energy Laboratory (NREL) at www.nrel.gov/publications.
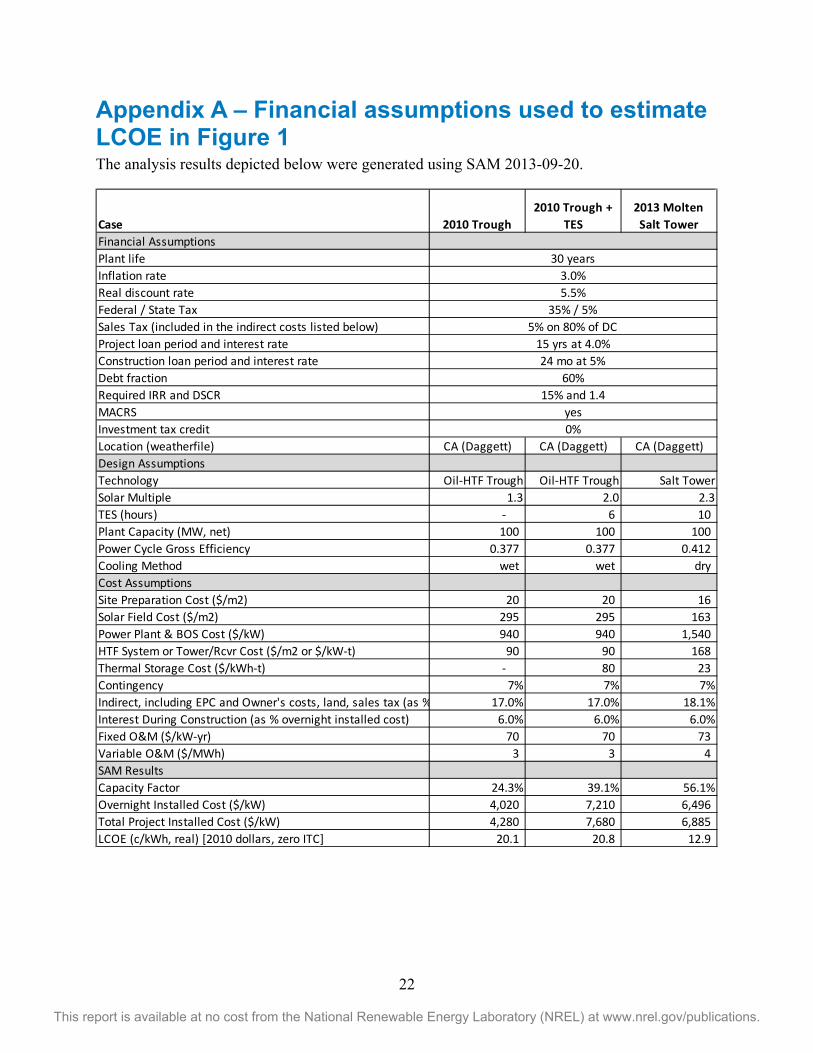
Appendix A – Financial assumptions used to estimate LCOE in Figure 1 The analysis results depicted below were generated using SAM 2013-09-20.
Case 2010 Trough 2010 Trough +
TES2013 Molten Salt Tower
Financial AssumptionsPlant lifeInflation rateReal discount rateFederal / State TaxSales Tax (included in the indirect costs listed below)Project loan period and interest rateConstruction loan period and interest rateDebt fraction Required IRR and DSCRMACRSInvestment tax creditLocation (weatherfile) CA (Daggett) CA (Daggett) CA (Daggett)Design AssumptionsTechnology Oil-HTF Trough Oil-HTF Trough Salt TowerSolar Multiple 1.3 2.0 2.3TES (hours) - 6 10 Plant Capacity (MW, net) 100 100 100 Power Cycle Gross Efficiency 0.377 0.377 0.412 Cooling Method wet wet dryCost AssumptionsSite Preparation Cost ($/m2) 20 20 16 Solar Field Cost ($/m2) 295 295 163 Power Plant & BOS Cost ($/kW) 940 940 1,540 HTF System or Tower/Rcvr Cost ($/m2 or $/kW-t) 90 90 168 Thermal Storage Cost ($/kWh-t) - 80 23 Contingency 7% 7% 7%Indirect, including EPC and Owner's costs, land, sales tax (as % 17.0% 17.0% 18.1%Interest During Construction (as % overnight installed cost) 6.0% 6.0% 6.0%Fixed O&M ($/kW-yr) 70 70 73 Variable O&M ($/MWh) 3 3 4 SAM ResultsCapacity Factor 24.3% 39.1% 56.1%Overnight Installed Cost ($/kW) 4,020 7,210 6,496 Total Project Installed Cost ($/kW) 4,280 7,680 6,885 LCOE (c/kWh, real) [2010 dollars, zero ITC] 20.1 20.8 12.9
24 mo at 5%60%
yes0%
30 years3.0%5.5%
35% / 5% 5% on 80% of DC
15 yrs at 4.0%
15% and 1.4