Embed Size (px)
Citation preview

Work ing PaPer Ser ieSno 1566 / j uly 2013
DomeStic creDit groWth anD international caPital FloWS
Philip R. Lane and Peter McQuade
In 2013 all ECB publications
feature a motif taken from
the €5 banknote.
note: This Working Paper should not be reported as representing the views of the European Central Bank (ECB). The views expressed are those of the authors and do not necessarily reflect those of the ECB.

© European Central Bank, 2013
Address Kaiserstrasse 29, 60311 Frankfurt am Main, GermanyPostal address Postfach 16 03 19, 60066 Frankfurt am Main, GermanyTelephone +49 69 1344 0Internet http://www.ecb.europa.euFax +49 69 1344 6000
All rights reserved.
ISSN 1725-2806 (online)EU Catalogue No QB-AR-13-063-EN-N (online)
Any reproduction, publication and reprint in the form of a different publication, whether printed or produced electronically, in whole or in part, is permitted only with the explicit written authorisation of the ECB or the authors.This paper can be downloaded without charge from http://www.ecb.europa.eu or from the Social Science Research Network electronic library at http://ssrn.com/abstract_id=2284255.Information on all of the papers published in the ECB Working Paper Series can be found on the ECB’s website, http://www.ecb.europa.eu/pub/scientific/wps/date/html/index.en.html
Acknowledgements This project was generously supported by Fondation Banque de France and the Institute for New Economic Thinking. We thank the three anonymous referees, Matthieu Bussiere and participants at seminars at the Banque de France, Banca d’Espana and the Bank for International Settlements for helpful comments. We thank Barbara Pels, Caroline Mehigan and Clemens Struck for research assistance. The opinions expressed in this paper are those of the authors and should not be attributed to the European Central Bank.
Philip R. LaneTrinity College Dublin; e-mail: [email protected]
Peter McQuadeEuropean Central Bank; e-mail: [email protected]
1
ABSTRACT Europe experienced substantial cross-country variation in domestic credit growth and cross-
border capital flows during the pre-crisis period. We investigate the inter-relations between
domestic credit growth and international capital flows over 1993-2008, with a special focus on
the 2003-2008 boom period. We establish that domestic credit growth in European countries is
strongly related to net debt inflows but not to net equity inflows. This pattern also holds for an
extended sample of 54 advanced and emerging economies.
Keywords: Financial stability, financial globalisation, macro-prudential regulation
JEL codes: E51, F32, G15
2
NON-TECHNICAL SUMMARY Understanding the origins of the various waves of the global financial crisis (especially the
current European crisis) is a high priority for researchers and policy-makers. Such diagnostic
work is essential both in designing policy solutions to resolve the current crisis and in
improving preventive frameworks to mitigate the risk of future crises.
Two key contributory factors in the current crisis have been the balance sheet problems
associated with rapid credit growth in some countries (most obviously, Ireland and Spain)
during the pre-crisis period and excessive external imbalances. For instance, Lane and Milesi-
Ferretti (2011) have documented that the variation in the size of recessions during 2008-2009
was significantly related to the scale of domestic credit growth during the 2003-2008 period and
the size of outstanding current account imbalances. In related fashion, Lane and Milesi-Ferretti
(2012) show that above-normal current account deficits during the pre-crisis period was
significantly associated with major declines in domestic demand and sharp reversals in private
capital flows over 2008-2010.
The importance of these twin factors raises the question of whether there are important
interactions between domestic credit growth and international capital flows. If these variables
are jointly determined and/or interact in economically-interesting ways, this should frame the
analytical framework guiding theoretical and policy analysis. Along one dimension, it would
indicate that international capital flows should be a central theme in the rapidly-growing macro-
prudential literature that seeks to understand the dynamics of domestic credit growth (and the
associated risk factors). Along another dimension, it would indicate the domestic credit channel
is a key channel in understanding the relation between international capital flows and domestic
macroeconomic and financial variables.
In this paper, our main focus is on the relation between domestic credit growth and international
capital flows for a sample of European countries. In particular, we focus on the EU27, plus
Norway, Switzerland and Iceland. (Taken together, we label these countries as the E30 group.)
Europe is an important testing ground for exploring the inter-relation between credit and capital
flows, in view of the remarkable dispersion in domestic credit patterns during the pre-crisis
period and the very high level of cross-border capital flows.
Moreover, the large and persistent intra-European external imbalances provide an additional
layer of complexity (Giavazzi and Spaventa 2010, Lane and Pels 2012). In particular, net capital
ows and domestic credit growth have been separately identified as important sources of
macroeconomic imbalances, such that it is highly relevant to understand any inter-connections
between these variables.
3
A major trend in European banking systems during the pre-crisis period was the divergence
between domestic deposit growth and credit growth. In order to finance credit growth that was
more rapid than deposit growth, banks raised funds by borrowing short term on international
interbank and money markets and by issuing bonds. These shifts in bank funding patterns in
Europe and the associated growth in cross-border bank-related financial flows are suggestive
that a systematic relation might exist between international capital flows and domestic credit
growth.
The primary focus is on the E30 group over the period 2003-2008, although additional analysis
is conducted on annual data for an extended sample of 54 countries for the period 1994-2008.
Using these data we present stylised facts and run a series of OLS regressions to explain credit
growth. As there may be two-way causality effects between domestic credit growth and
international capital flows, we also report IV estimates, where international financial flows are
instrumented by their lagged values.
Our analysis confirms that the current account balance is a misleading indicator in
understanding the relation between international capital flows and domestic credit growth, in
view of the striking differences in the co-variation of domestic credit growth with net debt flows
and net equity flows. Moreover, it is striking that net debt flows appears to be the relevant
measure, with no apparent gain to splitting net debt flows between gross debt inflows and gross
debt outflows. This may have to do with the nature of international trade in debt claims, with
many types of gross inflows and outflows essentially cancelling each other out. Furthermore,
while our primary motivation is to study the European experience, it is striking that the results
are quite similar in the extended sample.
The apparent empirical connection between net international debt flows and domestic credit
growth calls for analytical models that can capture this relation. In particular, it is important to
understand better both the direct relation between international debt flows and domestic credit
growth (for instance, through the international funding activities of domestic banks) and the
indirect relation (the impact of international debt flows on domestic macroeconomic and
financial variables that can affect both supply and demand factors influencing domestic credit
growth).
In turn, these findings have implications for macro-prudential policy frameworks and the
monitoring of excessive imbalances. In particular, our analysis indicates that there is a strong
international dimension to the determination of national credit growth rates and that domestic
credit growth and external imbalances should be interpreted in an integrated, joint framework.

4
1 INTRODUCTION Understanding the origins of the various waves of the global financial crisis (especially the
current European crisis) is a high priority for researchers and policy-makers. Such diagnostic
work is essential both in designing policy solutions to resolve the current crisis and in
improving preventive frameworks to mitigate the risk of future crises.
Two key contributory factors in the current crisis have been the balance sheet problems
associated with rapid credit growth in some countries (most obviously, Ireland and Spain)
during the pre-crisis period and excessive external imbalances. For instance, Lane and Milesi-
Ferretti (2011) have documented that the variation in the size of recessions during 2008-2009
was significantly related to the scale of domestic credit growth during the 2003-2008 period and
the size of outstanding current account imbalances. In related fashion, Lane and Milesi-Ferretti
(2012) show that above-normal current account deficits during the pre-crisis period were
significantly associated with major declines in domestic demand and sharp reversals in private
capital flows over 2008-2010.
The importance of these twin factors raises the question of whether there are important
interactions between domestic credit growth and international capital flows. If these variables
are jointly determined and/or interact in economically-interesting ways, this should frame the
analytical framework guiding theoretical and policy analysis. Along one dimension, it would
indicate that international capital flows should be a central theme in the rapidly-growing macro-
prudential literature that seeks to understand the dynamics of domestic credit growth (and the
associated risk factors). Along another dimension, it would indicate the domestic credit channel
is a key channel in understanding the relation between international capital flows and domestic
macroeconomic and financial variables.
In terms of related literature, there is a sizeable body of work on the macroeconomic effects of
credit booms (see, amongst others, Mendoza and Terrones 2012). In related fashion, there is
considerable evidence that financial crises are often preceded by domestic credit booms (Jorda
et al 2011, Schularick and Taylor 2012, Gourinchas and Obstfeld 2012).
Still, these studies largely do not focus on the driving forces behind cross-country differences in
credit growth. While there is a development finance literature that studies cross-country
variation in credit ratios, this literature focuses on differences between developing and advanced
countries, rather than on variation within the set of advanced economies (Djankov et al 2007,
Tressel and Detragiache 2008).
Moreover, Hume and Sentance (2009) emphasise that the nature of the recent credit boom poses
a challenge to existing macroeconomic models. In part, this reflects the general limitations of

5
current macroeconomic models to adequately incorporate the full spectrum of macro-financial
linkages. In addition, financial innovation and structural changes in financial systems can
disrupt traditional credit mechanisms. In this regard, Schularick and Taylor (2012) and
Baeriswyl and Ganarin (2012) emphasise the weakening connection between monetary
aggregates and credit growth, reducing the reliability of traditional monetary models of credit
growth.
One of the major structural changes in financial systems in recent decades has been the rapid
growth in international financial integration (Lane and Milesi-Ferretti 2007). Moreover, as
emphasised by Lane and Milesi-Ferretti (2008), there is a strongly positive relation between the
size of domestic financial systems and the scale of cross-border financial positions.
The opening up of financial systems and the rise in cross-border financial flows can influence
domestic credit growth through multiple channels. At a macroeconomic level, current account
imbalances can affect macroeconomic variables such as the rate of output growth, the level of
domestic spending, exchange rates, inflation and asset prices which can all influence
equilibrium credit growth in a range of macro-financial models.
Still, it is important to emphasise that financial integration can influence credit dynamics even if
the current account is in balance (Borio and Disyatat 2011, Gourinchas 2012, Obstfeld 2012a,
2012b). In particular, gross international financial flows affect the funding environment faced
by domestic banks and non-banks, while also altering the menu of financial assets that can be
held by domestic banks and non-banks.
Under financial integration, domestic banks can seek funding from foreign depositors and
international counterparties in the interbank market and money market. In addition, domestic
banks can obtain medium-term funding through international bond issues. Interoffice funding is
yet another channel, with domestically-owned banks linked to overseas affiliates and foreign-
owned affiliates active in the domestic system linked to their parent banks. In relation to equity
funding, foreign portfolio investors and foreign direct investors are important sources of
shareholder capital for domestic banks.
On the asset side, domestic banks can hold foreign assets as well as domestic assets, with
foreign banks a primary set of counterparties for cross-border transactions. In relation to
international banks and multinational banks, a substantial proportion of cross border positions
are maintained vis-a-vis other branches and affiliates within the same banking organisation (see
also McCauley et al 2010).
In relation to non-banks, most domestic corporates and households only indirectly engage with
international financial system, with most claims and liabilities intermediated by the domestic
6
banking system. Accordingly, these entities are mainly affected by international capital flows to
the extent that these flows influence the provision of credit by domestic banks. However, large
corporates can raise international funding through bond issuance and inter-o-ce
lending/borrowing between domestic and foreign affiliates, as well as maintaining direct cross-
border relations with foreign banks. As quantified by Lanau (2011), tighter domestic financial
regulation can also prompt an increase in direct cross-border borrowing by domestic non-banks
that seek to overcome domestic restrictions on access to credit. Borio et al (2011) show that
international credit grew strongly during the pre-crisis period, which is complementary to our
focus on domestic credit.
Some recent contributions have focused on the role of gross international capital flows in the
funding of banks and the shadow banking system. For instance, Acharya and Schnabl (2009)
highlight that the overall current account balance is not a good guide to the direction of bank-
related capital flows. These authors focus on the sources of foreign funding for the US shadow
banking system and establish that European banks (rather than the main current account surplus
countries) were the main international purchasers of US mortgage-related assets.
Similarly, Shin (2012) emphasises the role of gross capital flows between Europe and the
United States in fuelling the US credit boom in the mid-2000s, even though the associated net
capital flows were zero since European banks were raising funding in the US to buy US-located
assets, while Cetorelli and Goldberg (2012) highlight the role of cross-border internal funding in
determining the behaviour of global banks.
While highly informative on specific channels, these studies do not examine aggregate capital
flows and aggregate domestic credit growth. Bruno and Shin (2013) look at the inter-relation
between international banking-sector flows and domestic private credit, emphasising that global
liquidity and the leverage cycle of global banks as a key driver of credit growth in a wide
sample of countries. However, their specification does not directly examine the relation between
cross-country variation in capital flows and the cross-country variation in domestic credit
growth.
Jorda et al. (2011) highlight that the bilateral correlation between credit growth and the current
account was not important historically but turned significant after 1975. However, these authors
do not systematically look at the inter-relation between the current account and credit growth in
a multivariate setting, nor at the possible differences between the underlying net debt and net
equity flows.
Mendoza and Terrones (2012) also find that credit booms are typically associated with net
capital inflows. However, that study does not differentiate between net debt flows and net

7
equity flows. Moreover, it only considers credit booms rather than also investigating the
behaviour of capital flows during periods of low (or even negative) domestic credit growth. In a
recent contribution, Calderon and Kubota (2012) examine a large sample of countries over
1975.Q1 to 2010.Q4 and find that surges in gross debt inflows are a good predictor of
subsequent credit booms, which is a pattern consistent with the results in this paper.
Finally, a related strand of research examines the connections between house prices and
international capital flows, with a primary emphasis on the current account (see, amongst
others, Aizenman and Jinjarik 2009, Adam et al 2011, Favilukis et al 2012a).
Domestic credit growth is surely a key mechanism linking capital flows and house prices but
this channel is not directly studied by this line of work, even if credit supply factors and
international capital flows are recognised in some of this work as separate factors influencing
house price dynamics.
In this paper, our main focus is on the relation between domestic credit growth and international
capital flows for a sample of European countries. In particular, we focus on the EU27, plus
Norway, Switzerland and Iceland. (Taken together, we label these countries as the E30 group.)
Europe is an important testing ground for exploring the interrelation between credit and capital
flows, in view of the remarkable dispersion in domestic credit patterns during the pre-crisis
period and the very high level of cross-border capital flows. Moreover, the large and persistent
intra-European external imbalances provide an additional layer of complexity (Giavazzi and
Spaventa 2010, Lane and Pels 2012). In particular, net capital flows and domestic credit growth
have been separately identified as important sources of macroeconomic imbalances, such that it
is highly relevant to understand any inter-connections between these variables.1
Still, we also check whether the patterns observed in the European data also show up in an
extended sample of 54 advanced and emerging economies. Previewing our results, we find that
the European evidence is largely replicated for the broader sample. The structure of the rest of
the paper is as follows. In Section 2, we provide a brief narrative of some of the main trends in
European banking activity, with a particular focus on the growth in cross-border funding. Next,
we present some key stylized facts and correlation patterns in Section 4. Section 5 reports the
econometric analysis. Finally, Section 6 concludes.
1 The European Commission's “excessive imbalances” procedure (as laid out in the 2011 “six pack” regulations) includes both
rapid credit growth and large current account deficits as warning indicators.

8
2 DOMESTIC CREDIT AND INTERNATIONAL CAPITAL FLOWS IN EUROPE: A BRIEF NARRATIVE
A major trend in European banking systems during the pre-crisis period was the divergence
between domestic deposit growth and credit growth. In the E30 group of countries, the average
ratio of bank deposits to GDP grew from 57 percent in 1999 to 89 percent in 2007, whereas the
average ratio of private credit to GDP grew much more quickly from 67 percent in 1999 to 107
percent in 2007.
In order to finance credit growth that was more rapid than deposit growth, banks raised funds by
borrowing short term on international interbank and money markets and by issuing bonds. The
tight correlation between bank deposits and private credit began to break down as banks
increasingly resorted to wholesale cross border funding (Hoggarth et al 2010). According to
European Central Bank (2009), the total balance sheets of euro area monetary financial
institutions (MFI) increased by 53 percent between December 2003 and December 2007. In
particular, banks increasingly resorted to short-term funding, with the share of money markets
in the total funding of European banks increasing from 11.8 percent in 2003 to 16 percent in
2007, with rapid growth also in interbank funding and bond issuance.
Much of the increase in domestic credit has been shown to have been facilitated by a large
increase in cross border interbank lending, the opening of international subsidiaries and the
emergence of financial derivatives (Altunbas et al 2007, Cetorelli and Goldberg 2011, 2012).
Accounts of the growth in cross-border banking in Europe are provided by Allen et al (2011),
Barnes et al (2010), Committee on the Global Financial System (2010a, 2010b) and Committee
on International Economic Policy and Reform (2012).
In relation to intra-European international capital flows, Milesi-Ferretti and Tille (2011) show
that bank capital flows increased more rapidly than other types of capital flows.2 The share of
banks in total developed-country outflows went from 21 to 33 percent between the periods
2000-2003 and 2004-2007, while the share of banks in inflows increased from 24 to 32 percent.
In the euro area, the share of banks in total capital outflows also rose rapidly from 22 to 32
percent, while the share of banks in inflows increased from 22 to 33 percent. In related fashion,
McCauley et al (2010) report that the cross-border positions of banks accounted for 40-60
percent of the external liabilities of Belgium, Switzerland and the UK in 2007 and for a quarter
or more in France, Italy and the Netherlands.
2 See also Lane (2013).
9
In relation to the new EU member states, a number of studies have identified external factors as
driving credit growth during this period (Bakker and Gulde 2010, European Bank for
Reconstruction and Development 2010, Jevcak et al 2010). As highlighted by Allen et al (2011),
the dominant role of foreign-owned banks in many of these countries meant that these countries
were especially influenced by international developments in credit markets. Moreover, Schmitz
(2011) highlights that capital inflows into these countries were concentrated in those economies
with the most liberalised financial systems.
These shifts in bank funding patterns in Europe and the associated growth in cross border bank-
related financial flows suggest that a systematic relation might exist between international
capital flows and domestic credit growth. However, an exclusive reliance on banking-sector
data may miss other linkages between aggregate capital flows and the supply and demand
factors that determine domestic credit growth. Accordingly, it is important to examine the inter-
relations between broader measures of international capital flows and domestic credit growth.
We turn to these data in Sections 3 and 4.
10
3 DATA AND STYLIZED FACTS 3.1 COUNTRY SAMPLE
In what follows, we mainly focus on the E30 group, which consists of the 27 member countries
of the European Union, plus Iceland, Norway and Switzerland. The latter three countries are all
members of the European Economic Area and adhere to EU rules in relation to many
dimensions of economic and financial policies. Europe is an especially interesting region for
understanding the links between domestic credit growth and international capital flows, in view
of the very high degree of international financial integration. In addition, we also examine an
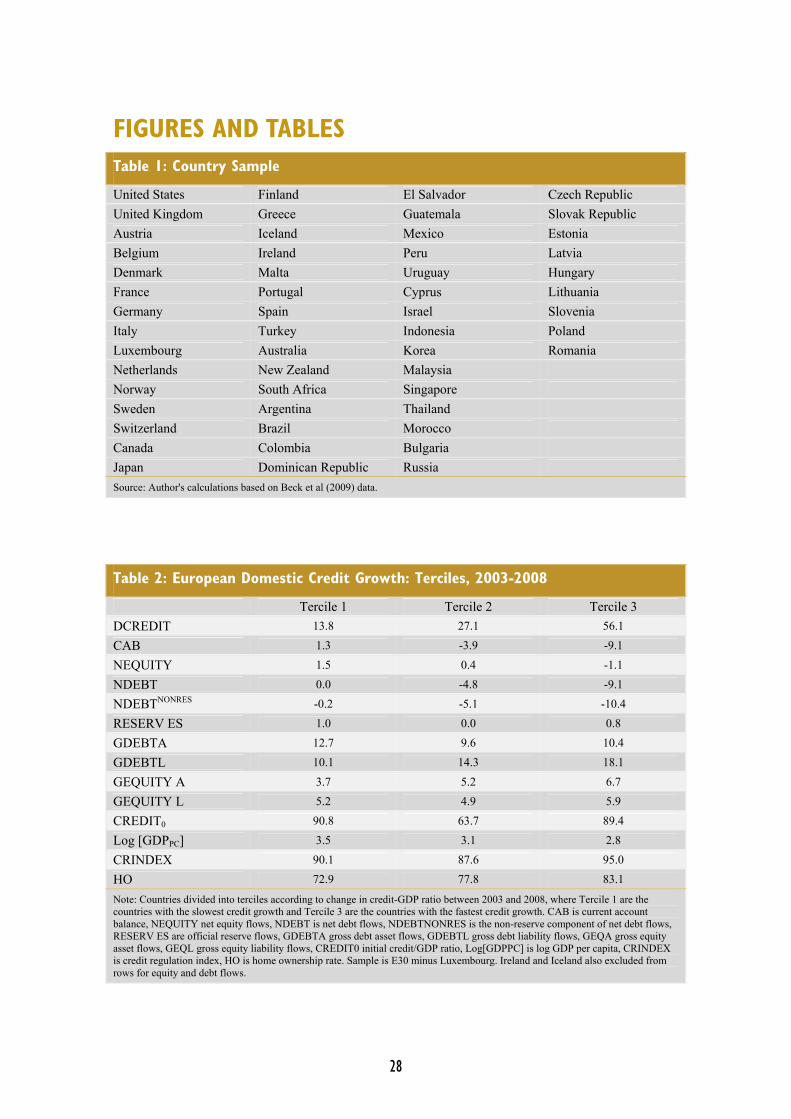
extended sample of 54 advanced and emerging countries as listed in Table 1.3
3.2 DATA SOURCES
The data appendix gives the full details of the data sources and methods. We measure domestic
credit growth as the five-year change in the ratio of private credit to GDP. It is measured over
five-year intervals: 1993-1998, 1998-2003 and 2003-2008. We focus on five-year changes to
focus on medium-term persistent changes in credit growth and the medium-term correlates of
these changes.
In relation to international capital flows, we look at a range of indicators (drawn from the IMF
Balance of Payments Statistics (BOPS) databank). In terms of aggregate net flows, we examine
the current account balance.4 We also split aggregate net flows between net debt flows and net
equity flows. Going further, we also differentiate between gross inflows and outflows. The
capital flows data are expressed as ratios to GDP and are measured as five-year averages.
In terms of sectoral capital flow data, we also examine the BIS international banking statistics
dataset and banking component of the BOPS databank. However, the number of BIS reporting
countries is limited (especially in relation to Central and Eastern Europe) and the sectoral
banking data are quite sparse in the BOPS databank, so that these data are primarily reported in
relation descriptive statistics in Section 3 rather than employed for the regression analysis in
Section 4.
In relation to other possible co-variates of domestic credit growth, we examine a credit
regulation quality index CRINDEX, which is taken from the Fraser Institute Index of Economic
Freedom. The subcomponent of the index related to credit regulation quality is itself composed
of a number of elements including the percentage of deposits held in privately owned banks, the
3 We follow Lane and Milesi-Ferretti (2011, 2012) in picking this sample. It consists of all countries that exceed a threshold value
of GDP ($20 billion dollars). Accordingly, it excludes tiny countries and countries with very low income per capita. 4 In the absence of statistical discrepancies, the current account balance should equal net financial flows.
11
extent to which banks face competition from foreign banks, the percentage of credit extended to
the private sector and the presence of interest rate controls.
In addition, we also consider the co-variation between domestic credit growth and the level of
GDP per capita and the rate of home ownership, where the latter is taken from the European
Union's Survey on Income and Living Conditions (EU-SILC).
3.3 STYLIZED FACTS
Figure 1 shows aggregate domestic credit growth for the E30 group over 1994-2008. Domestic
credit growth trended upwards over this period. Although there was a dip during the 2001-2002
recession, this was followed by a period of faster and rising credit growth during 2003-2008.
Figure 2 shows the cross-country standard deviation of domestic credit growth, which rose
sharply during 2003-2008 relative to previous periods - the credit boom was far from uniform
across countries.
This is also clear from Figure 3 which shows domestic credit growth in the individual countries
over the period 2003-2008. Mature economies such as Germany, Austria and Norway
experienced relatively little credit growth or even negative credit growth. This was also true of
new member states like the Slovak Republic, Poland and the Czech Republic. At the other end
of the spectrum, Iceland, Ireland, Spain and the Baltic states underwent unprecedented credit
booms.
See Figure 1, 2 and 3
As a first step in thinking about the co-variation between domestic credit growth and
international capital flows, it is useful to examine differences across the cross-country
distribution of credit growth experiences. Table 2 splits countries into three terciles according to
the rate of credit growth over 2003-2008. The median increase in the credit-GDP ratio was 13.8
percentage points for the bottom tercile and 56.1 percentage points for the top tercile. In relation
to capital flows, the median country in the bottom tercile ran a small current account surplus of
1.3 percent of GDP, whereas the median current account deficit for the top tercile was 9.1
percent.
See Table 2
The differences in terciles are not large for net international equity flows (which are small for
the median country in each tercile). However, there is a sizeable difference in relation to net
international debt flows - the median net debt flow is close to zero for the bottom tercile, while
the median net debt inflow is 9.1 percent of GDP for the top tercile. Furthermore, if we split net
12
debt flows between non-reserve debt flows and reserve flows, we can see that the inter-tercile
difference is driven by non-reserve debt flows.
In relation to gross capital flows, there is little difference across terciles in relation to gross
equity flows or gross debt outflows - the difference is in relation to gross debt inflows, with the
median value for the bottom tercile at 10.1 percent of GDP compared to 18.1 percent of GDP
for the top tercile. In relation to other country characteristics, the top tercile had a higher initial
value for the credit/GDP ratio, lower initial GDP per capita, a more liberal credit regulation
regime and a markedly-higher rate of home ownership compared to the values for the bottom
tercile.
We take a closer look at the different capital flow measures in Table 3. The current account
balance is significantly correlated with both net equity flows and net debt flows; however, the
bivariate correlation between net equity flows and net debt flows is weakly negative. There is a
very high correlation between gross debt inflows and gross debt outflows (0.91), whereas the
correlation between gross equity inflows and gross equity outflows is much smaller (0.41). If
we look at simple correlations, the current account balance is most closely correlated with net
debt flows.
See Table 3
We can learn more by looking at the bivariate scatter plots in Figures 4 and 5. In Figure 4, the
scatter shows that domestic credit growth is negatively correlated with the current account.
However, the co-variation between domestic credit growth and net debt flows is much closer
than is the case for the relation between credit growth and net equity flows. Looking across the
different measures of international capital flows, the correlation between the current account
and net international debt and net international equity flows appears reasonably similar,
especially if we exclude Iceland which is an extreme value in many of the panels. In Figure 5
we show bivariate scatter plots between the domestic credit growth and a number of country
characteristics.
Table 4 shows the correlations between net aggregate international debt flows, banking-sector
net debt flows (both from the IMF BOPS dataset) and the BIS-sourced measure of the change in
the net external assets of the banking sector. (Figure 6 shows bivariate scatter plots for these
variables.) The banking-sector data are available for fewer countries than the aggregate measure
of net debt flows but Table 4 and Figure 6 indicate reasonably-strong correlations across these
different measures.
See Figures 4, 5, 6 and Table 4
13
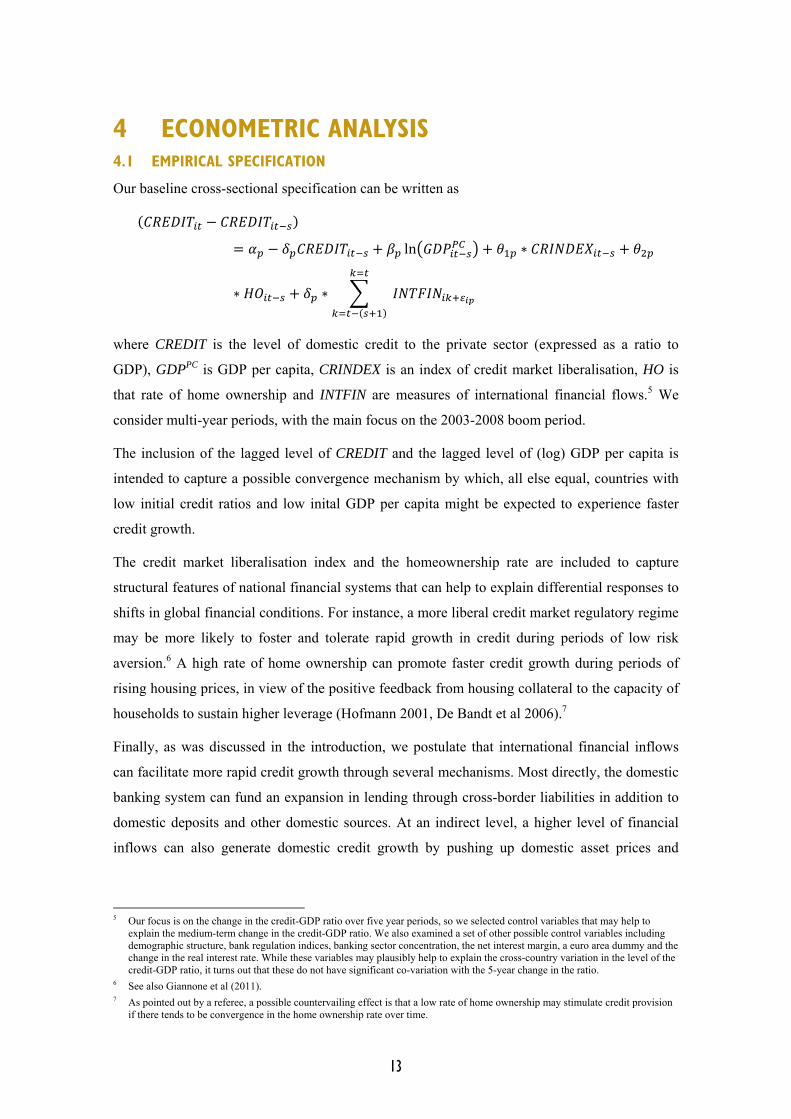
4 ECONOMETRIC ANALYSIS 4.1 EMPIRICAL SPECIFICATION
Our baseline cross-sectional specification can be written as
ln ∗
∗ ∗
where CREDIT is the level of domestic credit to the private sector (expressed as a ratio to
GDP), GDPPC is GDP per capita, CRINDEX is an index of credit market liberalisation, HO is
that rate of home ownership and INTFIN are measures of international financial flows.5 We
consider multi-year periods, with the main focus on the 2003-2008 boom period.
The inclusion of the lagged level of CREDIT and the lagged level of (log) GDP per capita is
intended to capture a possible convergence mechanism by which, all else equal, countries with
low initial credit ratios and low inital GDP per capita might be expected to experience faster
credit growth.
The credit market liberalisation index and the homeownership rate are included to capture
structural features of national financial systems that can help to explain differential responses to
shifts in global financial conditions. For instance, a more liberal credit market regulatory regime
may be more likely to foster and tolerate rapid growth in credit during periods of low risk
aversion.6 A high rate of home ownership can promote faster credit growth during periods of
rising housing prices, in view of the positive feedback from housing collateral to the capacity of
households to sustain higher leverage (Hofmann 2001, De Bandt et al 2006).7
Finally, as was discussed in the introduction, we postulate that international financial inflows
can facilitate more rapid credit growth through several mechanisms. Most directly, the domestic
banking system can fund an expansion in lending through cross-border liabilities in addition to
domestic deposits and other domestic sources. At an indirect level, a higher level of financial
inflows can also generate domestic credit growth by pushing up domestic asset prices and
5 Our focus is on the change in the credit-GDP ratio over five year periods, so we selected control variables that may help to
explain the medium-term change in the credit-GDP ratio. We also examined a set of other possible control variables including demographic structure, bank regulation indices, banking sector concentration, the net interest margin, a euro area dummy and the change in the real interest rate. While these variables may plausibly help to explain the cross-country variation in the level of the credit-GDP ratio, it turns out that these do not have significant co-variation with the 5-year change in the ratio.
6 See also Giannone et al (2011). 7 As pointed out by a referee, a possible countervailing effect is that a low rate of home ownership may stimulate credit provision
if there tends to be convergence in the home ownership rate over time.

14
raising the level of domestic demand in goods markets, thereby encouraging greater investment
and financial acquisitions.
We consider several different specifications for the INTFIN variables. At the most basic level,
we examine aggregate net financial flows, as captured by the current account balance. However,
net debt flows and net equity flows may have different effects on domestic credit, so we also
consider a specification in which aggregate flows are broken down into these two components.
Finally, we recognise that gross financial inflows and gross financial outflows may not have
symmetric effects on the domestic credit system, so we also look at specifications in which
equity and debt flows are further disaggregated between inflows and outflows.
We drop Ireland and Luxembourg from the sample in all the regressions, on account of their
outsized role in the international mutual funds industry. The international capital flows
associated with mutual funds create very large foreign equity liabilities and foreign debt assets
for the hosts of international mutual funds (foreign investors are the predominant owners of
equity shares in the funds, while these funds hold large international bond asset portfolios), with
these positions having zero impact on the domestic economy.
While the initial credit-GDP ratio, GDP per capita, the credit market liberalisation index and the
home ownership rate are predetermined variables, the INTFIN variables are measured
contemporaneously with credit growth. Clearly, there may be two-way causality effects between
domestic credit growth and international capital flows. Accordingly, we also report IV
estimates, where international financial flows are instrumented by lagged values.8
As indicated above, our primary focus is understanding credit growth during the 2003-2008
boom period. However, we also run cross-section specifications for the earlier periods (1993-
1998 and 1998-2003) and pooled specifications that combine the three cross-sections to see if
the relation between capital flows and domestic credit growth is also evident over a longer time
period.9 Furthermore, while our primary motivation is to understand the European experience,
we also run our empirical specifications on an extended sample of 54 countries to check if the
patterns are similar across a wider group of countries.
4.2 ECONOMETRIC RESULTS
Table 5 shows the results for the 2003-2008 period. We begin in column (1) by just including
the convergencevariables (the initial value for the credit-GDP ratio and log GDP per capita).
8 Our primary focus is on cross-sectional regressions, so the use of lagged values as instruments does not pose the same set of
potential problems as in a time series context. 9 We run separate cross-sections since it is plausible that coefficients should be time-varying, as is written in equation (1). We also
report pooled estimates to capture the “average” effects across the whole sample.

15
While GDP per capita is significant and has the expected negative sign, the initial credit-GDP
ratio is significantly positive. This indicates that credit growth during the 2003-2008 period was
most intense among those countries that already had high credit-GDP ratios. In fact, this pattern
holds across columns (1)-(6).
We expand the specification to include the credit market liberalisation index and the home
ownership rate in column (2). Each of these variables is significantly positive: credit growth was
faster under more liberal regulatory regimes and in countries with higher rates of home
ownership. The former result is consistent with a greater elasticity of credit growth to
favourable market conditions in lightly-regulated countries; the latter result is in line with a
positive role for housing equity in collateral-based lending during periods of rising asset values.
We introduce the international capital flow variables in columns (3)-(6). We start in column (3)
by including the average current account balance. This turns out to be significantly negative:
credit growth was faster in countries running current account deficits during this period.
Moreover, the inclusion of the current account balance results in the home ownership rate losing
individual significance; furthermore, this pattern holds true across columns (3)-(6).
We investigate whether domestic credit growth has similar covariation patterns with net
international debt flows and net international equity flows in column (4). The difference is quite
striking: net debt flows are highly significant but net equity flows are not significant. This
suggests that it is not the overall current account balance that intrinsically matters in
understanding the relation between international capital flows and domestic credit growth.
Rather, the significant connection is between international net debt flows and credit growth.10
We further probe this result in column (5) by splitting net flows into gross inflows and gross
outflows. The coefficients on debt inflows and debt outflows are both highly significant and are
similar in absolute value. This pattern suggests that it is net debt flows that mainly matters in
understanding the inter-relation between international capital flows and domestic credit growth.
See Table 5
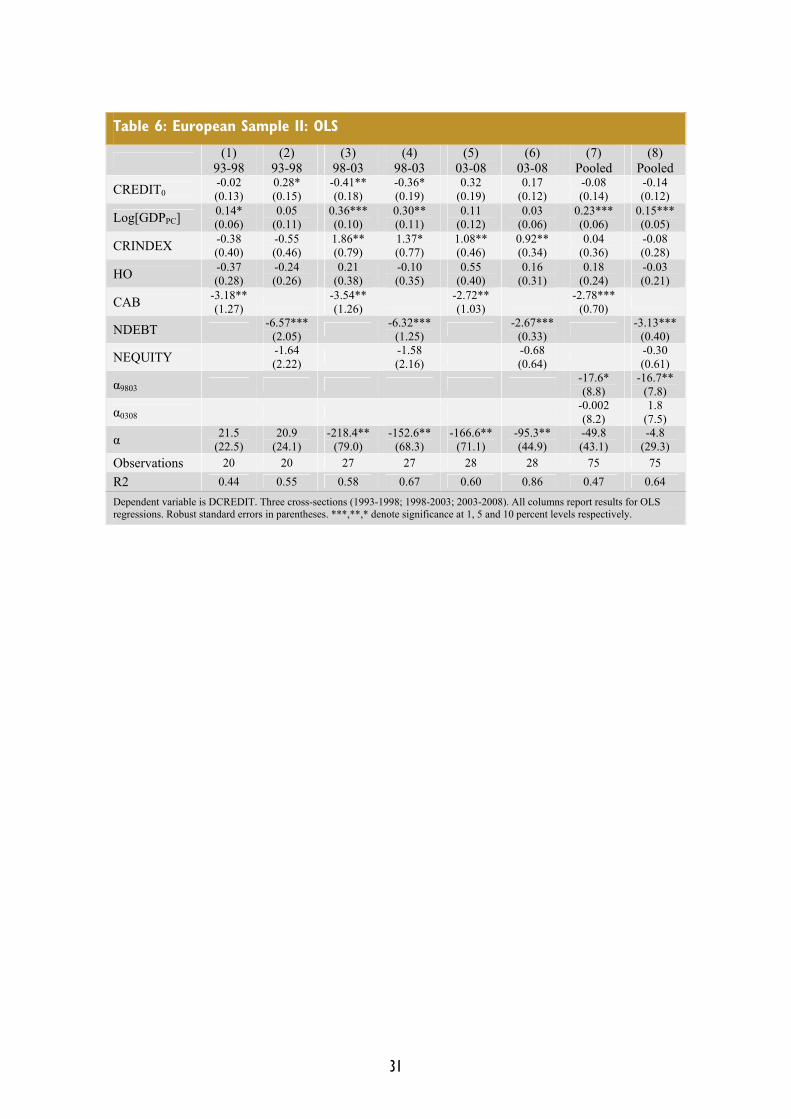
In Table 6, we ask whether these results also hold during earlier periods (1993-1998, 1998-
2003) and in a pooled specification.11 We focus on the specifications corresponding to columns
(3) and (4) in Table 5. For ease of comparability, we also repeat the 2003-2008 results in
columns (5) and (6). Finally, we also report the pooled estimates in column (7) and (8).
10 As a robustness check, we dropped Iceland from the sample. While the exclusion of Iceland resulted in a less significant result
for the current account balance in the column (3) specification, net debt flows remain highly significant and net equity flows are not significant.
11 In each cross section, we ensure a fixed sample between the current account specification and the specification that splits net financial flows between net debt flows and net equity lows. In the main tables, we do allow the sample to vary across time periods, since the data availability is scarcer for the earlier time periods. However, we also ran a _constant country_ sample, which we report in Section A of the web appendix. The results are very similar for the “constant country” sample.

16
It turns out the main findings are quite similar across the time periods.12 In particular, domestic
credit growth is significantly related to the current account balance in each time period and in
the pooled specification but this is driven by net debt flows rather than net equity flows.
See Table 6
In Table 7, we follow the same format as in Table 6 but now report IV estimates. The
instrumental variables regression is estimated using two-stage least squares, with lagged values
of the international capital flow variables used as instruments. In all specifications of the first-
stage regressions, the lagged flow variables are typically highly significant.13 As captured by the
Kleibergen-Paap LM statistic, the hypothesis of under-identification is typically rejected.14 We
also report the Kleibergen-Papp Wald statistic as a weak instruments test statistic, which is a
stier test than the under-identification test. Following Bazzi and Clemens (2013), we tabulate p-
values for two thresholds (15 percent and 25 percent) for the size of Wald test that the
parameters for the endogenous variables equal zero at the 5 percent significance level. Along
this dimension, the results are decidedly mixed, such that our IV strategy should be interpreted
as only partially successful. (The instruments are stronger in the larger sample in Table 9.) In
the IV estimates, the current account balance is no longer significant in any of the cross-sections
while net debt flows and net equity flows are not significant in the individual 1993-1998 and
1998-2003 cross sections. However, net debt flows retain significance in the core 2003-2008
cross section and in the pooled specification.
Next, we turn to the extended sample. To illustrate the main pattern in the data, Figure 7 shows
the strong negative correlation between domestic credit and net debt flows in the extended
sample for the 2003-2008 cross-section.
See Table 7
We report the regression results for the extended sample in Tables 8 and 9, which have the same
format as Tables 6 and 7.15 In the OLS estimates in Table 8, the significant co-variation pattern
between net debt flows and domestic credit growth is again evident in the 1998-2003 and 2003-
2008 cross sections and in the pooled estimates. In fact, net equity flows are marginally
significant but with a positive sign in the 1998-2003 cross section and in the pooled estimates.
12 There are fewer observations for the earlier time periods. Belgium is dropped for 1998-2003, since capital flow data were jointly
reported for Belgium and Luxembourg until 2001. The following countries were additionally dropped for 1993-1998: Cyprus, Czech Republic, Slovak Republic, Latvia, Lithuania, Slovenia and Romania.
13 These results are available in Section C of the web appendix. 14 We focus on the Kleibergen-Paap statistic, since there are two potentially-endogenous regressors once we include both net debt
flows and net equity flows. We also investigated whether the lagged capital flow variables provide additional explanatory power in explaining credit growth but these were insignificant, suggesting that these are valid instruments since they only operate through their influence on contemporaneous capital flows
15 We also ran the regressions separately for the non-European sample. These results are available in Section B of the web appendix. The co-variation between net debt flows and domestic credit growth is significant for the non-European sample in the OLS estimates for the 2003-2008 cross section and the pooled specification but is not significant in the IV estimates.
17
The patterns in the IV estimates in Table 9 are similar to those for the European sample in Table
7, with net debt flows significant in the 2003-2008 cross section and in the pooled estimates.
See Tables 8 and 9
In Tables 10 and 11, we report the results for an additional specification in which we split net
debt flows between non-reserve net debt flows and reserve flows (which are one component in
gross debt outflows). We make this split to check whether the key link is between non-reserve
net debt flows and domestic credit growth. While reserve flows have been low for advanced
economics in recent times, these were more important for Central and Eastern Europe and the
wider set of emerging economies that are included in the extended sample.
We report estimates for a variety of sample splits. In columns (1) and (2), we report the
estimates for the extended sample for the key 2003-2008 cross section and the pooled
specification. Since the relation between capital flows and credit growth may also depend on the
exchange rate regime, we investigate further sample splits in columns (3)-(8). In columns (3)-
(4), we restrict attention to the group of European peggers; in columns (5)-(6), we examine all
peggers in the extended sample; in columns (7) and (8), we consider the non-peggers in the
extended sample.16
Across the OLS estimates reported in Table 10, non-reserve net debt flows are highly correlated
with domestic credit growth, confirming the basic pattern from the previous tables. In column
(2), reserve flows are individually significant, so that rapid accumulation of foreign reserves is
associated with slower credit growth. However, reserve flows are not individually significant in
the other sample splits. Finally, net equity flows are positive and significant in the pooled
estimates for the full extended sample in column (2) and the non-pegger sample in column (8).
Non-reserve debt flows generally retain significance for the 2003-2008 cross section in the IV
estimates reported in Table 11 and are also marginally significant in the pooled estimates for the
European peggers sample.
See Tables 10 and 11
In summary, the econometric analysis shows that several country characteristics are correlated
with the cross-country variation in credit growth. In relation to international capital flows, the
most striking result is that those countries receiving net debt inflows also experienced the fastest
credit growth. This seems to be fairly general pattern but is strongest for the 2003-2008 pre-
crisis period.
16 We follow a de facto peg criterion as implemented by Lane and Milesi-Ferretti (2012). Members of the euro area are defined as
de facto peggers. There are not enough non-peggers to examine separately the set of non-peggers for the core European sample.

18
So far, our empirical work has focused on the 1993-2008 period. We further investigate the
relation between capital flows and domestic credit growth by examining the credit boom
episodes compiled by Mendoza and Terrones (2012). We focus on episodes in which the credit-
GDP ratio increased by more than 10 percent of GDP over a three-year window.
Table 12 flows that the median credit boom in this group involved a large net debt inflow,
whereas net equity flows were typically small (in fact, the median case shows a net equity
outflow).17 Accordingly, the general pattern in the case studies conforms to the main findings in
our empirical analysis.
4.3 DIRECTIONS FOR FUTURE RESEARCH
Clearly, our empirical focus on the cross-country variation in national-level aggregate data is
limited in scope. One direction for future research is to investigate the joint time series
dynamics of capital flows and domestic credit growth using higher-frequency data. However,
this is likely to be challenging, since capital flow data are quite volatile at high frequencies,
whereas credit growth tends to be more stable and persistent, such that medium-term co-
variation between these variables may be overshadowed in higher frequency data.
Furthermore, the evidence on the strength of our instruments is decidedly mixed. Accordingly, a
further empirical challenge is to investigate alternative approaches in identifying lines of
causality between international capital flows and domestic credit growth.
Along another dimension, it would be desirable to investigate the specific channels determining
the interaction between international capital flows and domestic credit growth. In particular,
given the central role of banking systems in cross-border debt flows, micro econometric studies
would be a useful complement in understanding how access to international capital flows
influences decisions over funding and credit provision at the level of individual banks and, in
the other direction, how domestic credit conditions influence the decision to raise cross-border
wholesale funding.
Furthermore, the empirical analysis of cross-border bank flows as a key mechanism linking
international capital flows and domestic credit growth should incorporate the central
intermediation role played by global banking groups, building on the interesting recent
contributions by Cetorelli and Goldberg (2011, 2012), Ivashina et al (2012), Bruno and Shin
(2013) and Niepmann (2013).
17 The main counter-examples are the well-known cases of Japan and Switzerland where the credit booms were associated with
current account surpluses and a large net debt outflow in the Swiss episode.

19
The empirical patterns we have uncovered can also help guide future theoretical research. For
instance, the significant correlation between net international debt flows and domestic credit
growth suggests that models of domestic credit fluctuations are incomplete if the open-economy
dimension is ignored.
Equally, open-economy models that seek to capture the macroeconomic impact of capital flow
cycles should incorporate their impact on domestic credit conditions, suggesting that models
that lack a distinct role for the financial system miss an important mechanism by which capital
flows affect macro-financial outcomes.18 Moreover, the sharp empirical differences between net
debt flows and net equity flows (in terms of the co-variation patterns with domestic credit
growth) cry out for models that can match the composition of international capital flows and
explain these different co-movement patterns.
In terms of policy relevance, the potential interplay between international debt flows and
domestic credit growth is especially important in view of the various distortions that can give
rise to inefficient credit booms and international overborrowing (Lorenzoni 2008, Mendoza
2010, Bianchi 2011, Jeanne and Korinek 2011, Bianchi et al 2012). Accordingly, a high priority
is to further develop open-economy macroeconomic models with financial frictions that can
jointly generate these phenomena. In turn, such models can provide the laboratory to study the
general equilibrium impact of various policy proposals (versions of macro-prudential
instruments, capital controls) that can mitigate such distortions.19
18 A recent quantitative model for the US that links domestic financial variables to capital inflows is provided by Favilukis et al
(2012b). However, that contribution just focuses on the holdings of US treasuries by the foreign official sector rather than a full-scale treatment of capital flows.
19 It is important to distinguish between macro-prudential regulation and capital controls. Although capital controls might be justifiable on macro-prudential grounds, there could be other unrelated motivations for introducing capital controls.

20
5 CONCLUSIONS Our aim in this paper has been to explore the links between international capital flows and
domestic credit growth, with a particular focus on understanding the European experience
during the 2003-2008 boom period. Our analysis confirms that the current account balance is a
misleading indicator in understanding the relation between international capital flows and
domestic credit growth, in view of the striking differences in the co-variation of domestic credit
growth with net debt flows and net equity flows.
Moreover, it is striking that net debt flows appears to be the relevant measure, with no apparent
gain to splitting net debt flows between gross debt inflows and gross debt outflows. This may
have to do with the nature of international trade in debt claims, with many types of gross
inflows and outflows essentially cancelling each other out. Furthermore, while our primary
motivation was to study the European experience, it is striking that the results are quite similar
in the extended sample.
The apparent empirical connection between net international debt flows and domestic credit
growth calls for analytical models that can capture this relation. In particular, it is important to
understand better both the direct relation between international debt flows and domestic credit
growth (for instance, through the international funding activities of domestic banks) and the
indirect relation (the interplay between international debt flows and domestic macroeconomic
and financial variables that can affect both supply and demand factors influencing domestic
credit growth).
In turn, these findings have implications for macro-prudential policy frameworks and the
monitoring of excessive imbalances.In particular, our analysis indicates that there is a strong
international dimension to the determination of national credit growth rates and that domestic
credit growth and external imbalances should be interpreted in an integrated, joint framework.

21
DATA APPENDIX TERCILE LIST FOR TABLE 2
Tercile 1: Argentina, Austria, Dominican Republic, El Salvador, Germany, Hong Kong,
Indonesia, Israel, Japan, Malaysia, Mexico, Pakistan, Peru, Philippines, Singapore, Sri
Lanka, Thailand, Tunisia, Uruguay.
Tercile 2: Belgium, Brazil, Canada, Chile, Colombia, Costa Rica, Czech Republic,
Finland, France, Guatemala, India, Korea, Malta, Norway, Poland, Russian Federation,
Slovak Republic, Switzerland, Turkey.
Tercile 3: Australia, Bulgaria, Cyprus, Denmark, Estonia, Greece, Hungary, Italy,
Latvia, Lithuania, Morocco, Netherlands, New Zealand, Portugal, Romania, Slovenia,
South Africa, Spain, Sweden.
DESCRIPTION OF VARIABLES
DCREDIT is the 5 year change in private credit from deposit-taking banks as a ratio to
GDP. The main source is the World Bank's Financial Development and Structure
dataset, as described in Beck et al (2009). The raw data are taken from the series Private
credit by deposit money banks(IFS line 22d), downloaded from the electronic version of
the IMF's International Financial Statistics, October 2008. A small number of
observations were missing. A number of countries (Austria, Belgium, France,
Luxembourg, Netherlands) were missing for the years 1998 and 1999. In these instances
the values were interpolated based on the and the 1997 and 2000 values. Supplementary
data for the private credit data were taken from the Central Bank of Iceland and the
Central Bank of Norway. The series for Norway is total domestic credit and is taken
from the Monetary Aggregates Norway series, Table A4. The series used for Iceland
were from the Central Bank statistics, household and non-nancial corporation loans
from banks in the loans from nancial corporations series and these two series were then
summed. The raw data for GDP in USD is also taken from Beck et al (2009).
CREDIT0 Beginning-of-period ratio of private credit to GDP. Same data sources as for
DCREDIT.
GDP per capita. Dollar GDP from IFS. Population data are the total population series
taken from the population section of the population and social conditions section of the
Eurostat database.

22
CRINDEX is taken credit regulation quality component of the Fraser Institute's
Indicators of Economic Freedom dataset. The observations used are either from the
beginning of period or, if beginning of period is not available, the earliest available
observation. Where data were missing (Bulgaria, Malta and Slovakia), values were
constructed on the basis of a comparison of the available Fraser Institute data with data
from the Banking Environment and Performance Survey (BEPS) provided by European
Bank for Reconstruction and Development (EBRD). The subcomponent of the index
related to credit regulation quality is itself composed of a number of elements including
the percentage of deposits held in privately owned banks, the extent to which banks face
competition from foreign banks and the percentage of credit extended to the private
sector and the presence of interest rate controls. For the privately owned banks
component, countries with larger shares if of privately held deposits received higher
ratings on intervals ranging from 0 to 10. Thus if privately held deposits totaled
between 95 and 100 percent, countries were give a rating of 10, between 75-95 percent
received 8, and so on while a zero rating was assigned when private deposits were 10
percent or less. The foreign bank competition component is calculated using of the
share of foreign bank assets as a share of total bank assets, and the foreign bank license
denial rate. The data are scaled from 1 to 10 with higher values indicating more foreign
bank competition. The component on the percentage of credit extended to the private
sector is calculated as the government fiscal deficit as a share of gross saving. If these
data are not available, this sub-component is instead based based on the share of private
credit to total credit extended in the banking sector. The data are scaled between 1 and
10 where higher values indicate a greater share of credit extended to the private credit.
The data on interest rate controls were scaled from 1 to 10 where higher values
indicated greater economic freedom. If, for example, interest rates were determined
primarily by market forces and real interest rates were positive, countries were given a
rating of 10. A zero rating would apply if the deposit and lending rates were fixed by
the government and real rates were persistently negative by double-digit amounts.
HO is the percentage of households who own their own home and it is taken from the
housing section of Eurostat's Income and Living conditions (EU-SILC) survey.
CAB is the 5 year average current account balance as a ratio to GDP. The data are taken
from the IMF Balance of Payment statistics (BOPS).
NDEBT is the 5 year average net debt flows as a ratio to GDP. The series was
calculated using underlying series from the IMF BOPS. Namely, it is the sum of flows
series for net portfolio debt assets, net other investment and reserve assets.

23
NEQUITY is a variable representing the 5 year average net equity flows assets a ratio to
GDP. The series was calculated using underlying series from the IMF BOPS. It is the
sum of net portfolio equity assets and net foreign direct investment.
GDEBTA 5 year average gross debt asset flows as a ratio to GDP. The series was
calculated using underlying series from the IMF BOPs. It is the sum of portfolio debt
assets, reserve assets and other investment assets.
GDEBTL 5 year average gross debt liability flows as a ratio to GDP. The series was
calculated using underlying series from the IMF BOPs. It is the sum of portfolio debt
liabilities and other investment liabilities.
GEQA 5 year average gross equity asset flows as a ratio to GDP. The series was
calculated using underlying series from the IMF BOPs. It is the sum of portfolio equity
assets and foreign direct investment assets.
GEQL 5 year average gross equity liability as a ratio to GDP. The series was calculated
using underlying series from the IMF BOPs. It is the sum of portfolio equity liabilities
and foreign direct investment liabilities.

24
REFERENCES Acharya, Viral and Philipp Schnabl (2009), Do Global Banks Spread Global Imbalances? The Case of Asset-Backed Commercial Paper During the Financial Crisis, IMF Jaques Polak Annual Research Conference Paper.
Adam, Klaus, Pei Kuang and Albert Marcet (2011), House Price Booms and the Current Account, NBER Working Paper No. 17224.
Aizenman, Joshua and Yothin Jinjarak (20090, Current Account Patterns and National Real Estate Markets, Journal of Urban Economics 66(2), 75-89.
Allen, Franklin, Thorsten Beck, Elena Carletti, Philip R. Lane, Dirk Schoenmaker and Wolf Wagner (2011), Cross-Border Banking in Europe: Implications for Financial Stability and Macroeconomic Policies, CEPR Report.
Altunbas, Yener, Leonardo Gambacorta and David Marques (2007), Securitisation and the Bank Lending Channel, ECB Working Paper Series No. 838.
Baeriswyl, Romain and Maja Ganarin (2012), The Non-Inationary Great Leveraging, mimeo, Swiss National Bank.
Bakker, Bas B. and Anne-Marie Gulde (2010), The Credit Boom in the EU New Member States: Bad Luck or Bad Policies?, IMF Working Paper 10/130.
De Bandt, Olivier and Catherine Bruneau and Widad El Amri (2006), Credit Demand Across Euro Area Countries: Evidence from Panel Data, Banque De France, Notes d'etudes et de recherche 158.
Barnes, Sebastian (2010), Resolving and Avoiding Unsustainable Imbalances in the Euro Area, OECD Economics Department Working Papers 827.
Barnes, Sebastian, Philip R. Lane and Artur Radziwill (2010), Minimising Risks from Imbalances in European Banking, OECD Economics Department Working Paper No. 828.
Bazzi, Samuel and Michael A. Clemens (2013), Blunt Instruments: Avoiding Common Pitfalls in Identifying the Causes of Economic Growth, American Economic Journal: Macroeconomics 5(2), 152-186.
Beck, Thorsten, Asli Demirguc-Kunt and Ross Levine (2009), Financial Institutions and Markets Across Countries and Over Time: Data and Analysis, World Bank Policy Research Working Paper Series No. 4943.
Bianchi, Javier (2011), Overborrowing and Systemic Externalities in the Business Cycle, American Economic Review 101(7), 3400-3426.
Bianchi, Javier, Emine Boz and Enrique Mendoza (2012), Macroprudential Policy in a Fisherian Model of Financial Innovation, IMF Economic Review 60(2), 223-269.
Blanchard, Olivier (2007), Current Account Decits in Rich Countries, IMF Staff Papers 54(2), 191-219.

25
Blanchard, Olivier and Francesco Giavazzi (2002), Current Account Deficits in the Euro Area: The End of the Feldstein-Horioka Puzzle?, Brookings Papers on Economic Activity 2(2002), 147-186.
Borio, Claudio and Piti Disyatat (2011), Global Imbalances and the Financial Crisis: Link or No Link?, BIS Working Paper No. 346.
Borio, Claudio, Robert McCauley and Patrick McGuire (2011), Global Credit and Domestic Credit Booms, BIS Quarterly Review (September), 43-57.
Bruno, Valentina and Hyun Song Shin (2013), Capital Flows, Cross-Border Banking and Global Liquidity, NBER Working Paper No. 18942.
Cetorelli, Nicola and Linda S. Goldberg (2011), Global Banks and International Shock Transmission: Evidence from the Crisis, IMF Economic Review 59(1), 41-76.
Cetorelli, Nicola and Linda Goldberg (2012), Banking Globalization and Monetary Transmission, Journal of Finance 67(5), 1811-1843.
Chen, Ruo, Gian Maria Milesi-Ferretti and Thierry Tressel (2013), External Imbalances in the Eurozone, Economic Policy 28(73), 101-142.
Committee on the Global Financial System (2010a), Funding Patterns and Liquidity Management of Internationally Active Banks, CGFS Paper No. 39.
Committee on the Global Financial System (2010b), Long-Term Issues in International Banking, CGFS Paper No. 41.
Committee on International Economic Policy and Reform (2012), Banks and Cross-Border Capital Flows: Policy Challenges and Regulatory Responses, Brookings Institution / Sloan Foundation.
Djankov, Simeon, Caralee McLiesh and Andrei Shleifer (2007), Private Credit in 129 Countries, Journal of Financial Economics 84(2), 299-329.
European Bank for Reconstruction and Development (2010), Transition Report, various issues.
European Central Bank (2009), EU Banks' Funding Structures and Policies, May.
Favilukis, Jack, David Kohn, Sydney C. Ludvigson and Stijn Van Nieuwerburgh (2012a), International Capital Flows and House Prices: Theory and Evidence, NBER Working Paper No. 17751.
Favilukis, Jack, Sydney C. Ludvigson and Stijn Van Nieuwerburgh (2012b), Foreign Ownership of US Safe Assets: Good or Bad? mimeo, New York University.
Geanakoplos, John (2010), The Leverage Cycle, NBER Macroeconomics Annual 24, 1-65.
Giannone, Domenico, Michele Lenza and Lucrezia Reichlin (2011), Market Freedom and the Global Recession, IMF Economic Review 59(1), 111-135.
Giavazzi, Francesco and Luigi Spaventa (2010), Why the Current Account Matters in a Monetary Union, CEPR Discussion Paper No. 8008.
26
Gourinchas, Pierre-Olivier (2012), Global Imbalances and Global Liquidity, mimeo, UCBerkeley.
Gourinchas, Pierre-Olivier and Maurice Obstfeld (2012), Stories of the Twentieth Century for the Twenty-First, American Economic Journal: Macroeconomics 4(1), 226-265.
Herrmann, Sabine and Adalbert Winkler (2008), Real Convergence, Financial Markets and the Current Account, ECB Occasional Paper No. 88.
Hofmann, Boris (2001), The Determinants of Private Sector Credit in Industrialised Countries: Do Property Prices Matter?, BIS Working Papers 108.
Hoggarth, Glenn, Lanvan Mahadevaand and Jeremy Martin (2010), Understanding International Bank Capital Flows During the Recent Financial Crisis, Bank of England Financial Stability Paper No.08.
Hume, Michael and Andrew Sentance (2009), The Global Credit Boom: Challenges for Macroeconomics and Policy, Journal of International Money and Finance 28, 1426-1461.
Ivashina, Victoria, David S. Scharfstein and Jeremy C. Stein (2012), Dollar Funding and the Lending Behavior of Global Banks, NBER Working Paper No. 18528.
Jeanne, Olivier and Anton Korinek (2011), Managing Credit Booms and Busts: A Pigouvian Taxation Approach, mimeo, University of Maryland.
Jevcak, Anton, Ralph Setzer and Massimo Suardi (2010), Determinants of Capital Flows to the New EU Member States Before and During the Financial Crisis, European Economy Economic Papers 425.
Jorda, Oscar, Moritz Schularick and Alan M. Taylor (2011), When Credit Bites back: Leverage, Business Cycles, and Crises, Federal Reserve Bank of San FranciscoWorking Paper Series 27.
Lanau, Sergi (2011), Domestic Financial Regulation and External Borrowing, Bank of England Working Paper No. 429.
Lane, Philip R. (2013), Capital Flows in the Euro Area, mimeo, Trinity College Dublin.
Lane, Philip R. and Gian Maria Milesi-Ferretti (2007a), The External Wealth of Nations Mark II, Journal of International Economics 73, 223-250
Lane, Philip R. and Gian Maria Milesi-Ferretti (2007b), Capital Flows to Central and Eastern Europe, Emerging Markets Review 8(2), 106-123.
Lane, Philip R. and Gian Maria Milesi-Ferretti (2008), The Drivers of Financial Globalization, American Economic Review 98(2), 327-332.
Lane, Philip R. and Gian Maria Milesi-Ferretti (2011), The Cross-Country Incidence of the Global Crisis, IMF Economic Review 59(1), 77-110.
Lane, Philip R. and Gian Maria Milesi-Ferretti (2012), External Adjustment and the Global Crisis, Journal of International Economics 88(2), 252-265.
Lane, Philip R. and Barbara Pels (2012), Current Account Imbalances in Europe, Moneda y Credito 234, 225-261.

27
Lorenzoni, Guido (2008), Ine-cient Credit Booms, Review of Economic Studies 75(3), 809-833.
McCauley, Robert, Patrick McGuire and Goetz Von Peter (2010), The Architecture of Global Banking: From International to Multinational?, BIS Quarterly Review (March), 25-37.
Mendoza, Enrique (2010), Sudden Stops, Financial Crises and Leverage, American Economic Review 100(5), 1941-1966.
Mendoza, Enrique and Marco Terrones (2012), An Anatomy Of Credit Booms and Their Demise, NBER Working Paper No. 18379.
Milesi-Ferretti, Gian-Maria and Cédric Tille (2011), The Great Retrenchment: International Capital Flows during the Global Financial Crisis, Economic Policy 26(66), 285-342.
Niepmann, Friederike (2013), Banking Across Borders, mimeo, Federal Reserve Bank of New York.
Obstfeld, Maurice (2012a), Financial Flows, Financial Crises, and Global Imbalances, Journal of International Money and Finance 31, 469-480.
Obstfeld, Maurice (2012b), Does the Current Account Still Matter?, American Economic Review 102(3), 1-23.
Schmitz, Martin (2011), Financial Reforms and Capital Flows to Emerging Europe, Empirica 38(4), 579-605.
Schularick, Moritz and Alan M. Taylor (2012), Credit Booms Gone Bust: Monetary Policy, Leverage Cycles, and Financial Crises, 1870-2008, American Economic Review 102(2), 1029-1061.
Shin, Hyun Song (2012), Global Banking Glut and Loan Risk Premium, IMF Economic Review 60, 155-192.
Stein, Jeremy (2012), Monetary Policy as Financial-Stability Regulation, Quarterly Journal of Economics 127(1), 57-95.
Tressel, Thierry and Enrica Detragiache (2008), Do Financial Sector Reforms Lead to Financial Development? Evidence from a New Dataset, IMF Working Paper No. 2008-265.
28
FIGURES AND TABLES Table 1: Country Sample
United States Finland El Salvador Czech Republic
United Kingdom Greece Guatemala Slovak Republic
Austria Iceland Mexico Estonia
Belgium Ireland Peru Latvia
Denmark Malta Uruguay Hungary
France Portugal Cyprus Lithuania
Germany Spain Israel Slovenia
Italy Turkey Indonesia Poland
Luxembourg Australia Korea Romania
Netherlands New Zealand Malaysia
Norway South Africa Singapore
Sweden Argentina Thailand
Switzerland Brazil Morocco
Canada Colombia Bulgaria
Japan Dominican Republic Russia
Source: Author's calculations based on Beck et al (2009) data.
Table 2: European Domestic Credit Growth: Terciles, 2003-2008
Tercile 1 Tercile 2 Tercile 3
DCREDIT 13.8 27.1 56.1
CAB 1.3 -3.9 -9.1
NEQUITY 1.5 0.4 -1.1
NDEBT 0.0 -4.8 -9.1
NDEBTNONRES -0.2 -5.1 -10.4
RESERV ES 1.0 0.0 0.8
GDEBTA 12.7 9.6 10.4
GDEBTL 10.1 14.3 18.1
GEQUITY A 3.7 5.2 6.7
GEQUITY L 5.2 4.9 5.9
CREDIT0 90.8 63.7 89.4
Log [GDPPC] 3.5 3.1 2.8
CRINDEX 90.1 87.6 95.0
HO 72.9 77.8 83.1
Note: Countries divided into terciles according to change in credit-GDP ratio between 2003 and 2008, where Tercile 1 are the countries with the slowest credit growth and Tercile 3 are the countries with the fastest credit growth. CAB is current account balance, NEQUITY net equity flows, NDEBT is net debt flows, NDEBTNONRES is the non-reserve component of net debt flows, RESERV ES are official reserve flows, GDEBTA gross debt asset flows, GDEBTL gross debt liability flows, GEQA gross equity asset flows, GEQL gross equity liability flows, CREDIT0 initial credit/GDP ratio, Log[GDPPC] is log GDP per capita, CRINDEX is credit regulation index, HO is home ownership rate. Sample is E30 minus Luxembourg. Ireland and Iceland also excluded from rows for equity and debt flows.

29
Table 3: International Capital Flows in Europe: Correlations, 2003-2008
CAB NDEBT NEQUITY GDEBTA GDEBTL GEQUITYA GEQUITYL
CAB 1
NDEBT 0.50 1
NEQUITY 0.50 -.032 1
GDEBTA -0.07 0.03 -0.17 1
GDEBTL -0.27 -0.33 -0.04 0.93 1
GEQUITYA 0.07 -0.46 0.36 0.45 0.59 1
GEQUITYL -0.25 -0.09 -0.43 0.63 0.63 0.67 1
CAB is current account balance, NDEBT is net debt flows, NEQ net equity flows, GDEBTA gross debt asset flows, GDEBTL gross debt liability flows, GEQA gross equity asset flows, GEQL gross equity liability flows. All variables are expressed as ratios to GDP.
Table 4: Alternative Measures of International Debt Flows in Europe: Correlations, 2003-2008
N DEBT NDEBTB NDEBTNB NDEBTBIS
N DEBT 1
(27)
NDEBTB 0.85 (17)
1 (17)
NDEBTNB 0.23 (17)
-0.33 (17)
1 (17)
NDEBTBIS 0.07 (15)
0.77 (8)
-0.74 (8)
1 (15)
NDEBT is net debt flows, NEQ net equity flows, NDEBTB banking-sector net debt flows, NDEBTNB is non-bank net debt flows, NDEBTBIS BIS-reported change in net external assets of banking sector. All variables are expressed as ratios to GDP. Number of observations in parentheses.

30
Table 5: European Sample I: OLS
(1) (2) (3) (4) (5)
CREDIT0 0.41* (0.24)
0.54* (0.28)
0.32 (0.19)
0.17 (0.12)
0.29* (0.15)
Log[GDPPC] -0.01* (0.01)
-0.01 (0.01)
0.01 (0.01)
0.00 (0.01)
0.00 (0.01)
CRINDEX 1.03* (0.55)
1.08** (0.46)
0.92** (0.34)
1.20*** (0.41)
HO 1.37** (0.64)
0.55 (0.40)
0.16 (0.31)
0.22 (0.30)
CAB -2.72** (1.03)
NDEBT -2.67***
(0.33)
NEQUITY -0.68 (0.64)
GDEBTA -3.41***
(0.45)
GDEBTL 3.15*** (0.35)
GEQA -1.73* (0.85)
GEQL 1.33
(0.90)
α 46.8*** (13.6)
-173.3* (85.1)
-166.6** (71.1)
-95.3** (44.9)
-129.2** (56.3)
Observations 28 28 28 28 28
R2 0.13 0.41 0.60 0.86 0.88
Dependent variable is DCREDIT from 2003 to 2008. All columns report results for OLS regressions. Robust standard errors in parentheses. ***, **, * denote significance at 1, 5 and 10 percent levels respectively.
31
Table 6: European Sample II: OLS
(1)
93-98 (2)
93-98 (3)
98-03 (4)
98-03 (5)
03-08 (6)
03-08 (7)
Pooled (8)
Pooled
CREDIT0 -0.02 (0.13)
0.28* (0.15)
-0.41** (0.18)
-0.36* (0.19)
0.32 (0.19)
0.17 (0.12)
-0.08 (0.14)
-0.14 (0.12)
Log[GDPPC] 0.14* (0.06)
0.05 (0.11)
0.36*** (0.10)
0.30** (0.11)
0.11 (0.12)
0.03 (0.06)
0.23*** (0.06)
0.15*** (0.05)
CRINDEX -0.38 (0.40)
-0.55 (0.46)
1.86** (0.79)
1.37* (0.77)
1.08** (0.46)
0.92** (0.34)
0.04 (0.36)
-0.08 (0.28)
HO -0.37 (0.28)
-0.24 (0.26)
0.21 (0.38)
-0.10 (0.35)
0.55 (0.40)
0.16 (0.31)
0.18 (0.24)
-0.03 (0.21)
CAB -3.18** (1.27)
-3.54** (1.26)
-2.72** (1.03)
-2.78***
(0.70)
NDEBT -6.57***
(2.05)
-6.32*** (1.25)
-2.67***
(0.33)
-3.13*** (0.40)
NEQUITY -1.64 (2.22)
-1.58 (2.16)
-0.68 (0.64)
-0.30 (0.61)
α9803 -17.6* (8.8)
-16.7** (7.8)
α0308 -0.002 (8.2)
1.8 (7.5)
α 21.5
(22.5) 20.9
(24.1) -218.4**
(79.0) -152.6**
(68.3) -166.6**
(71.1) -95.3** (44.9)
-49.8 (43.1)
-4.8 (29.3)
Observations 20 20 27 27 28 28 75 75
R2 0.44 0.55 0.58 0.67 0.60 0.86 0.47 0.64
Dependent variable is DCREDIT. Three cross-sections (1993-1998; 1998-2003; 2003-2008). All columns report results for OLS regressions. Robust standard errors in parentheses. ***,**,* denote significance at 1, 5 and 10 percent levels respectively.

32
Table 7: European Sample II: IV
(1)
93-98 (2)
93-98 (3)
98-03 (4)
98-03 (5)
03-08 (6)
03-08 (7)
Pooled (8)
Pooled
CREDIT0 0.22
(0.44) 0.24** (0.10)
-0.43** (0.17)
-0.43** (0.19)
0.40* (0.21)
0.18 (0.13)
-0.06 (0.15)
-0.17 (0.15)
Log[GDPPC] -0.13 (0.34)
-0.16* (0.08)
0.32*** (0.10)
0.30** (0.13)
0.03 (0.12)
-0.13 (0.13)
0.18** (0.08)
0.15 (0.10)
CRINDEX -1.04 (1.73)
-0.33 (0.30)
1.21 (0.81)
0.87 (0.77)
1.07*** (0.40)
0.59* (0.36)
0.19 (0.37)
0.04 (0.27)
HO 0.95
(2.26) 0.08
(0.19) 0.42
(0.43) 0.41
(0.64) 0.90* (0.48)
0.08 (0.38)
0.48 (0.32)
-0.20 (0.31)
CAB 8.24
(17.20)
-1.58 (1.69)
-1.59 (1.03)
-1.26 (0.90)
NDEBT -2.69 (1.71)
-1.47 (4.44)
-2.58***
(0.75)
-3.88*** (1.14)
NEQUITY 3.39
(2.29)
-0.62 (2.71)
1.54
(1.72)
-0.23 (1.28)
α9803 -22.2**
(8.9) -13.1 (8.7)
α0308 -3.2 (9.1)
5.4 (10.2)
α 31.3
(78.7) 46
(28.7) -164.7**
(75.8) -131.5* (73.5)
-172.4*** (66.3)
-14.4 (55.4)
-71.1 - (48.7)
4.9 (32.0)
KP LM test 0.49 0.02 0.003 0.05 0.02 0.08 0.002 0.03
K.P. Wald test 0.4 2.1 11.7 1.6 43.2 2.8 51.9 2.1
p – val: 15% 0.80 0.55 0.02 0.66 0.00 0.42 0.00 0.55
p – val: 25% 0.63 0.18 0.00 0.27 0.00 0.10 0.00 0.17
Observations 18 18 26 26 27 27 71 71
Dependent variable is DCREDIT from 2003 to 2008. All columns report results for 2 stage least squares regressions. K.P. LM test refers to the p-value of the Kleibergen-Paap test for under identification. The K.P. Wald test and p-values refer to the Kleibergen-Paap rk Wald statistic for weak identification. p-values calculated based on method outlined in Bazzi and Clemens (2013). For the p-values, the null hypotheses are that that the actual size of the Wald test that the point estimates on the endogenous variables equal zero at the 5 percent significance level is greater than 15 or 25 percent respectively. Robust standard errors in parentheses. ***,**,* denote significance at 1, 5 and 10 percent levels respectively.

33
Table 8: Extended Sample I: OLS
(1)
93-98 (2)
93-98 (3)
98-03 (4)
98-03 (5)
03-08 (6)
03-08 (7)
Pooled (8)
Pooled
CREDIT0 0.20
(0.14) 0.19
(0.17) -0.46***
(0.15) -0.40***
(0.14) 0.23
(0.16) 0.07
(0.07) -0.09 (0.12)
-0.13 (0.10)
Log[GDPPC] -0.05 (0.07)
-0.05 (0.09)
0.20*** (0.05)
0.11** (0.05)
0.05 (0.04)
0.01 (0.03)
0.11*** (0.03)
0.04 (0.03)
CRINDEX 0.17
(0.17) 0.16
(0.19) 0.41
(0.30) 0.29
(0.32) 0.26
(0.36) 0.25
(0.27) 0.27
(0.17) 0.21
(0.16)
HO -0.07 (0.31)
-0.09 (0.34)
0.17 (0.28)
0.25 (0.29)
0.51* (0.28)
0.33 (0.21)
0.24 (0.18)
0.20 (0.17)
CAB -0.83 (1.29)
-0.32 (0.69)
-2.08***
(0.51)
-1.64*** (0.46)
NDEBT -0.36 (1.90)
-1.84** (0.88)
-2.33***
(0.21)
-2.29*** (0.23)
NEQUITY -0.82 (1.96)
2.73* (1.55)
0.50
(0.64)
1.23* (0.70)
α9803 -6.5 (5.9)
-5.2 (5.4)
α0308 -5.7 (5.6)
-4.5 (4.8)
α 0.1
(22.5) 2.8
(23.4) -49.2* (26.6)
-28.8 (26.0)
-67.9* (39.6)
-36.2 (29.4)
-42.0** (21.1)
-17.8 (17.3)
Observations 39 39 48 48 53 53 140 140
R2 0.11 0.09 0.48 0.55 0.51 0.77 0.29 0.46
Dependent variable is DCREDIT from 2003 to 2008. All columns report results for OLS regressions. Robust standard errors in parentheses. ***, **, * denote significance at 1, 5 and 10 percent levels respectively.
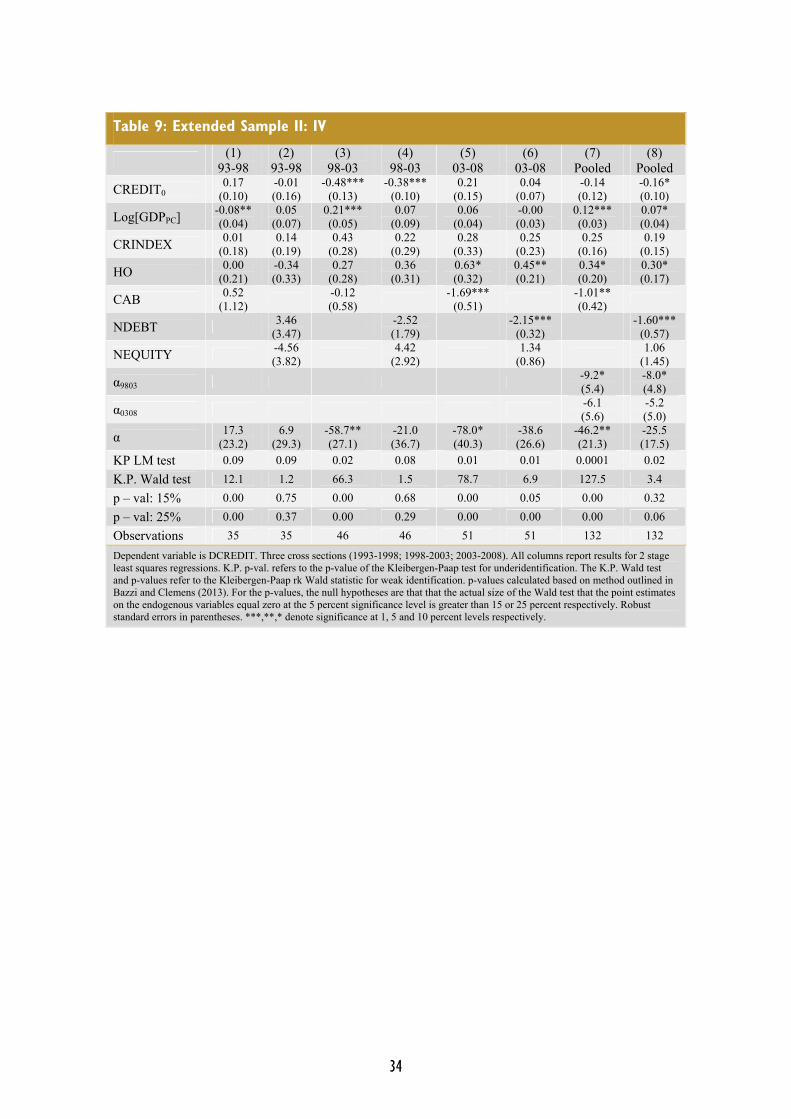
34
Table 9: Extended Sample II: IV
(1)
93-98 (2)
93-98 (3)
98-03 (4)
98-03 (5)
03-08 (6)
03-08 (7)
Pooled (8)
Pooled
CREDIT0 0.17
(0.10) -0.01 (0.16)
-0.48*** (0.13)
-0.38*** (0.10)
0.21 (0.15)
0.04 (0.07)
-0.14 (0.12)
-0.16* (0.10)
Log[GDPPC] -0.08** (0.04)
0.05 (0.07)
0.21*** (0.05)
0.07 (0.09)
0.06 (0.04)
-0.00 (0.03)
0.12*** (0.03)
0.07* (0.04)
CRINDEX 0.01
(0.18) 0.14
(0.19) 0.43
(0.28) 0.22
(0.29) 0.28
(0.33) 0.25
(0.23) 0.25
(0.16) 0.19
(0.15)
HO 0.00
(0.21) -0.34 (0.33)
0.27 (0.28)
0.36 (0.31)
0.63* (0.32)
0.45** (0.21)
0.34* (0.20)
0.30* (0.17)
CAB 0.52
(1.12)
-0.12 (0.58)
-1.69***
(0.51)
-1.01** (0.42)
NDEBT 3.46
(3.47)
-2.52 (1.79)
-2.15***
(0.32)
-1.60*** (0.57)
NEQUITY -4.56 (3.82)
4.42
(2.92)
1.34 (0.86)
1.06
(1.45)
α9803 -9.2* (5.4)
-8.0* (4.8)
α0308 -6.1 (5.6)
-5.2 (5.0)
α 17.3
(23.2) 6.9
(29.3) -58.7** (27.1)
-21.0 (36.7)
-78.0* (40.3)
-38.6 (26.6)
-46.2** (21.3)
-25.5 (17.5)
KP LM test 0.09 0.09 0.02 0.08 0.01 0.01 0.0001 0.02
K.P. Wald test 12.1 1.2 66.3 1.5 78.7 6.9 127.5 3.4
p – val: 15% 0.00 0.75 0.00 0.68 0.00 0.05 0.00 0.32
p – val: 25% 0.00 0.37 0.00 0.29 0.00 0.00 0.00 0.06
Observations 35 35 46 46 51 51 132 132
Dependent variable is DCREDIT. Three cross sections (1993-1998; 1998-2003; 2003-2008). All columns report results for 2 stage least squares regressions. K.P. p-val. refers to the p-value of the Kleibergen-Paap test for underidentification. The K.P. Wald test and p-values refer to the Kleibergen-Paap rk Wald statistic for weak identification. p-values calculated based on method outlined in Bazzi and Clemens (2013). For the p-values, the null hypotheses are that that the actual size of the Wald test that the point estimates on the endogenous variables equal zero at the 5 percent significance level is greater than 15 or 25 percent respectively. Robust standard errors in parentheses. ***,**,* denote significance at 1, 5 and 10 percent levels respectively.

35
Table 10: Alternative Specifications: OLS
(1)
03-08
(2)
Pooled
(3) E30 Peg
03-08
(4) E30 Peg Pooled
(5) Peg
03-08
(6) Peg
Pooled
(7) Non-Peg
03-08
(8) Non-Peg
Pooled
CREDIT0 0.05
(0.08) -0.13 (0.10)
0.14 (0.17)
-0.10 (0.15)
0.22 (0.17)
-0.10 (0.14)
-0.15 (0.14)
-0.16 (0.14)
Log[GDPPC] 0.02
(0.03) 0.04
(0.03) 0.15
(0.11) 0.23** (0.11)
-0.02 (0.06)
0.08 (0.07)
0.03 (0.03)
0.00 (0.04)
CRINDEX 0.24
(0.27) 0.21
(0.16) 1.35*** (0.38)
1.08** (0.39)
0.19 (0.40)
0.53 (0.38)
0.32 (0.38)
0.09 (0.20)
HO 0.24
(0.26) 0.21
(0.19) 0.15
(0.48) 0.12
(0.34) 0.66
(0.56) -0.17 (0.38)
-0.20 (0.35)
0.18 (0.22)
NDEBTNONRES -2.41***
(0.19) -2.27***
(0.25) -4.64***
(0.92) -4.29***
(0.74) -2.27** (0.89)
-3.20*** (0.76)
-2.42*** (0.28)
-1.95*** (0.25)
RESERVES -1.45 (1.26)
-2.54** (1.19)
-9.53 (5.45)
-4.01 (4.40)
0.05 (5.48)
-4.10 (4.07)
0.23 (1.47)
-1.74 (1.21)
NEQUITY 0.50
(0.60) 1.21* (0.70)
-2.29 (1.48)
-1.58 (1.07)
0.99 (1.37)
-0.47 (0.95)
1.50 (1.11)
2.93*** (0.97)
α9803 -5.4 (5.3)
52.9
(31.6)
7.5 (19.0)
-1.5 (6.0)
α0308 -4.8 (5.3)
17.4
(12.4)
2.7 (10.9)
-4.6 (5.9)
α -31.2 (32.6)
-18.2 (17.8)
-172.7** (68.0)
-154.0** (61.6)
-57.6 (58.2)
-32.0 (45.0)
-4.8 (41.8)
1.2 (19.7)
Observations 53 140 20 40 22 47 31 93
R2 0.77 0.46 0.73 0.60 0.62 0.50 0.86 0.48
Dependent variable is DCREDIT from 2003 to 2008. All columns report results for OLS regressions. Robust standard errors in parentheses. ***, **, * denote significance at 1, 5 and 10 percent levels respectively.

36
Table 11: Alternative Specifications: IV
(1)
03-08
(2)
Pooled
(3) E30 Peg
03-08
(4) E30 Peg Pooled
(5) Peg
03-08
(6) Peg
Pooled
(7) Non-Peg
03-08
(8) Non-Peg
Pooled
CREDIT0 0.03
(0.08) -0.16 (0.10)
0.18 (0.18)
-0.15 (0.23)
0.24 (0.20)
-0.06 (0.14)
-0.18 (0.12)
-0.21 (0.16)
Log[GDPPC] -0.00 (0.04)
0.07 (0.04)
-0.02 (0.21)
0.39 (0.28)
-0.07 (0.05)
0.02 (0.08)
0.03 (0.03)
0.07 (0.05)
CRINDEX 0.19
(0.24) 0.22
(0.16) 0.47
(1.00) 1.81
(1.18) -0.16 (0.40)
0.53 (0.37)
0.34 (0.32)
0.10 (0.20)
HO 0.35
(0.31) 0.45** (0.23)
0.13 (0.81)
-0.47 (0.94)
0.74 (0.90)
-0.08 (0.75)
-0.11 (0.37)
0.40 (0.27)
CAB -2.30***
(0.40) -0.88 (1.08)
-4.53** (2.26)
-8.81* (4.49)
-2.83 (2.29)
-3.78 (2.43)
-2.22*** (0.39)
-0.16 (1.24)
NDEBT -1.61 (1.27)
-1.98 (1.27)
-4.26 (11.08)
-12.59 (13.66)
4.56 (6.18)
-2.15 (5.31)
0.07 (1.32)
-2.13 (1.63)
NEQUITY 1.26
(0.87) 1.16
(1.45) 1.43
(4.43) -4.65 (5.79)
3.99** (1.55)
1.75 (1.71)
2.25* (1.27)
2.05 (2.33)
α9803 -10.0**
(4.9)
83.0 (70.2)
7.7
(16.0)
-10.1 (6.5)
α0308 -7.2 (6.1)
38.9
(28.5)
2 (12.0)
-9.5 (7.8)
α -27.8 (30.8)
-36 -22
-47.6 (142.2)
-240.3* (140.6)
-22.3 (95.9)
-27.8 (61.5)
-8.4 (36.3)
-20.9 (24.4)
KP LM test 0.08 0.03 0.18 0.14 0.05 0.04 0.01 0.05
K.P. Wald test 3.2 2.5 1.0 0.8 1.7 1.9 3.7 2.0
p – val: 15% 0.35 0.47 0.80 0.84 0.64 0.60 0.28 0.57
p – val: 25% 0.07 0.13 0.43 0.54 0.24 0.21 0.05 0.20
Observations 50 132 19 37 21 43 30 89
Dependent variable is DCREDIT. Three cross sections (1993-1998; 1998-2003; 2003-2008). All columns report results for 2 stage least squares regressions. K.P. p-val. refers to the p-value of the Kleibergen-Paap test for underidentification. The K.P. Wald test and p-values refer to the Kleibergen-Paap rk Wald statistic for weak identification. p-values calculated based on method outlined in Bazzi and Clemens (2013). For the p-values, the null hypotheses are that that the actual size of the Wald test that the point estimates on the endogenous variables equal zero at the 5 percent significance level is greater than 15 or 25 percent respectively. Robust standard errors in parentheses. ***,**,* denote significance at 1, 5 and 10 percent levels respectively.

37
Table 12: Credit Booms and Capital Flows
DCREDIT CAB NDEBT NEQUITY
Australia 1985-1988 10.0 -10.2 -11.7 -1.4
Brazil 1987-1989 24.7 0.8 0.5 -0.9
Chile 1977-1980 19.7 -6.4 -19.3 -2.1
Denmark 1984-1987 17.6 -11.3 -15.8 2.1
Finland 1987-1990 17.3 -11.1 -17.3 4.4
France 1987-1990 10.9 -1.5 -2.0 2.3
Japan 1987-1990 23.6 6.1 -0.3 5.2
Norway 1984-1987 21.9 -6.5 -13.4 3.0
Switzerland 1986-1989 16.6 12.3 17.9 -0.7
United Kingdom 1986-1989 37.0 -9.8 -14.1 3.0
United States 1985-1988 12.4 -8.4 -6.2 -2.0
Median 17.6 -6.5 -11.7 2.1
Credit boom episodes (T-3,T) where year T is the peak of the boom. Episodes taken from Mendoza and Terrones (2012) and restricted to those with increases in credit/GDP ratio by more than 10 percent of GDP. Singapore excluded due to high errors and omissions in capital flow data.

38
Figure 1: E30; Aggregate Domestic Credit Growth, 1994-2008.
Source: Author's calculations based on Beck et al (2009) data.

39
Figure 2: E30; Cross-Country Standard Deviation of Domestic Credit Growth, 1994-2008.
Source: Author's calculations based on Beck et al (2009) data.

40
Figure 3: E30; Domestic Credit Growth, 2003-2008.
Source: Author's calculations based on Beck et al (2009) data.
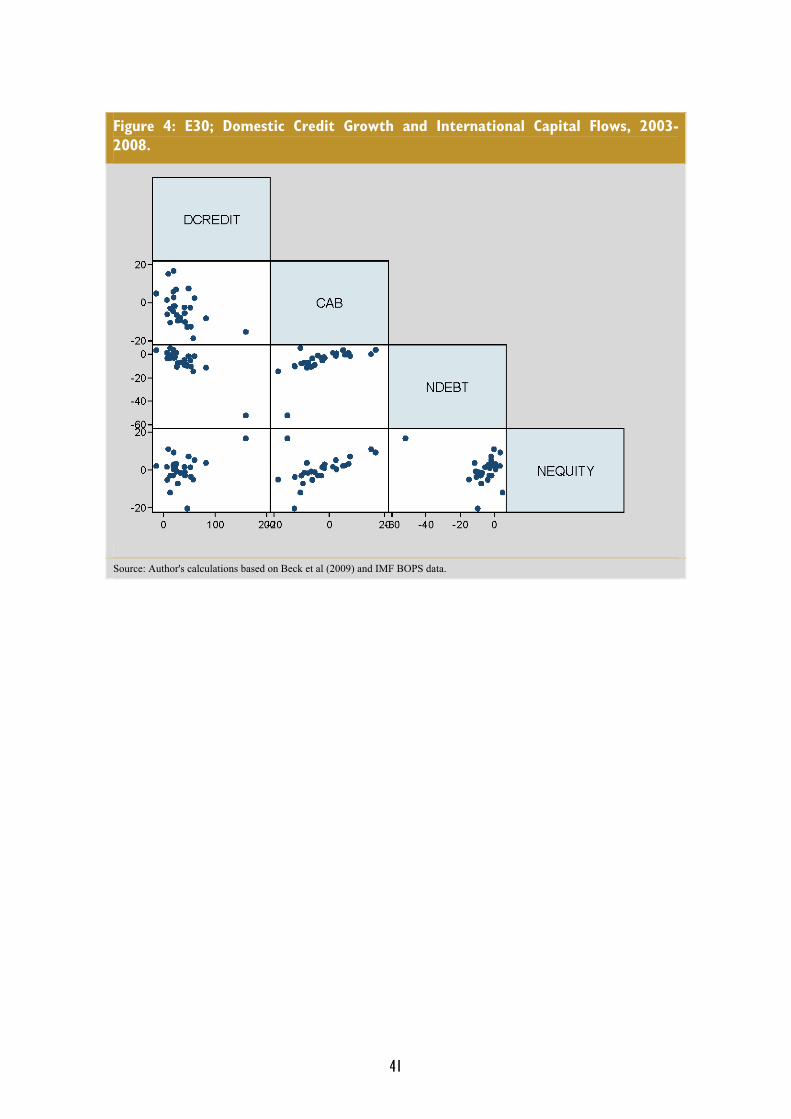
41
Figure 4: E30; Domestic Credit Growth and International Capital Flows, 2003-2008.
Source: Author's calculations based on Beck et al (2009) and IMF BOPS data.
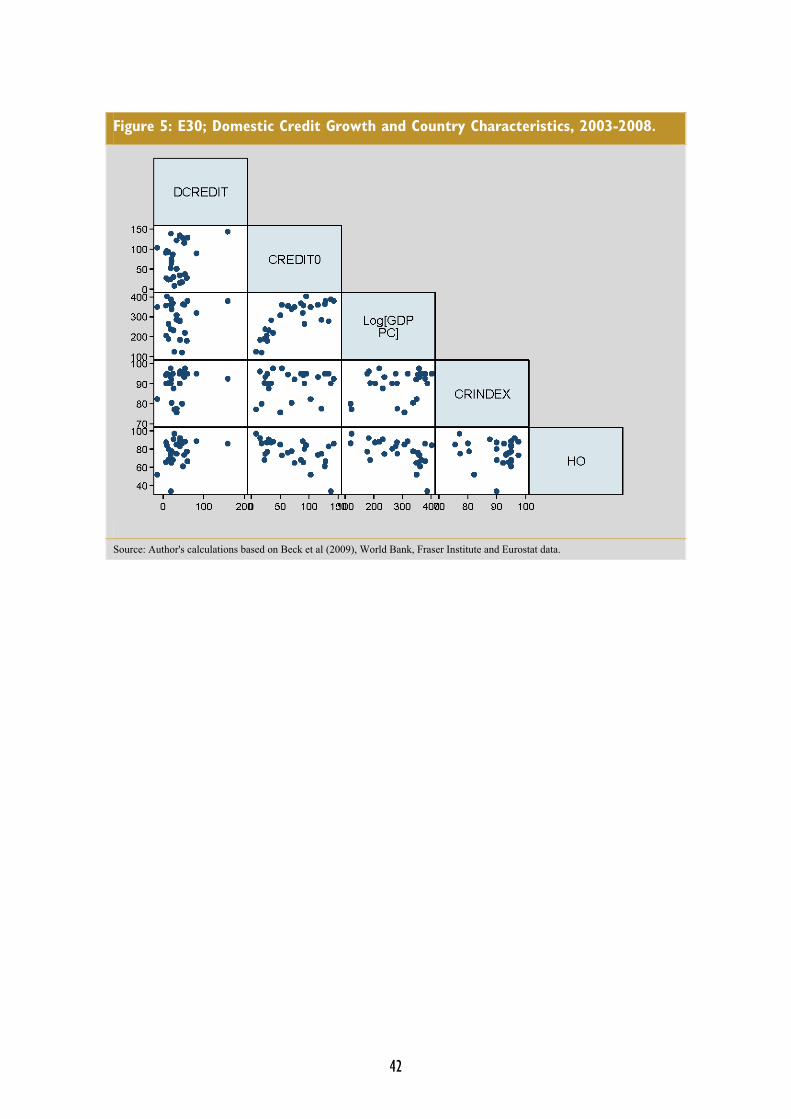
42
Figure 5: E30; Domestic Credit Growth and Country Characteristics, 2003-2008.
Source: Author's calculations based on Beck et al (2009), World Bank, Fraser Institute and Eurostat data.
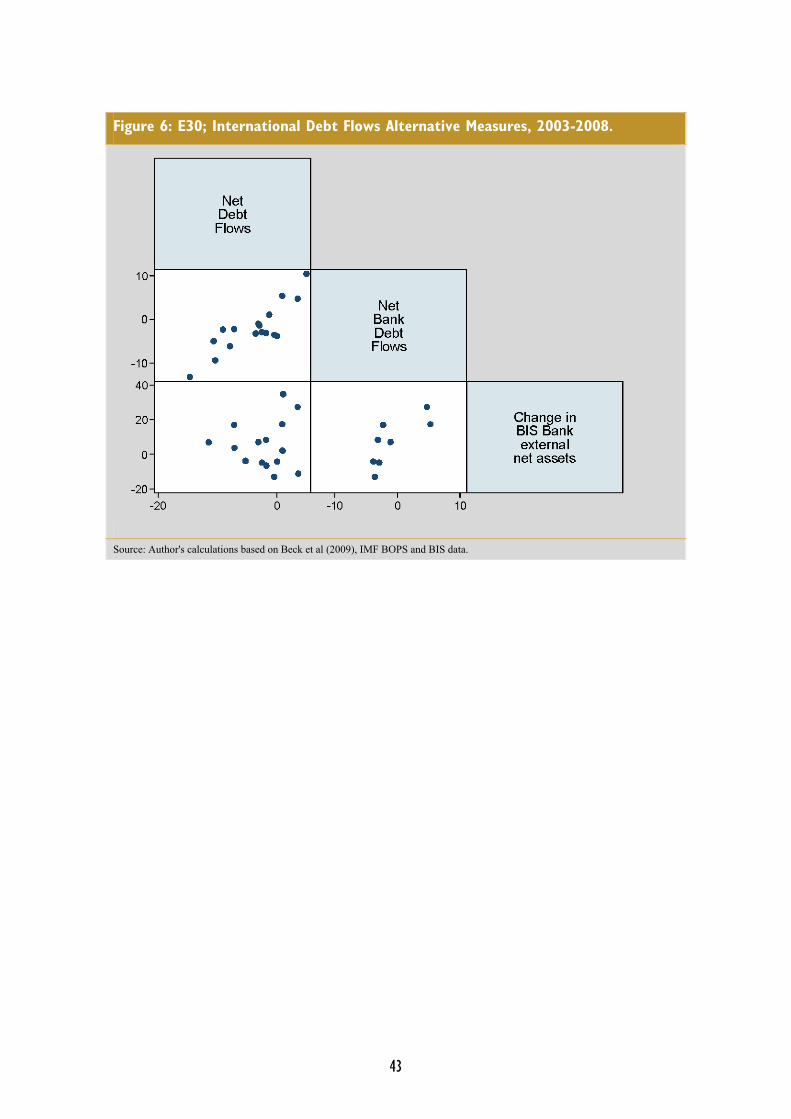
43
Figure 6: E30; International Debt Flows Alternative Measures, 2003-2008.
Source: Author's calculations based on Beck et al (2009), IMF BOPS and BIS data.

44
Figure 7: Extended Sample; Domestic Credit Growth and Net Debt Flows, 2003-2008.
Source: Author's calculations based on Beck et al (2009) and IMF BOPS data. Note: Excludes Iceland.


![Capital Flows and Asset Prices [with Comments]kiyotaki/papers/CapitalFlows09.pdf · both domestic and international, on international capital flows and ... The first strand of literature](https://img.pdfslide.us/doc/110x75/5adb4b417f8b9a6d318ddef5/capital-flows-and-asset-prices-with-comments-kiyotakipaperscapitalflows09pdfboth.jpg)