Embed Size (px)
Citation preview

Benjamín Vargas-Quesadaa, Félix de Moya-Anegóna, Zaida Chinchilla-Rodrígueza and Antonio Gonzalez- Molinab a Grupo SCImago. University of Alcalá, Faculty of Documentation, Aulario María Guzmán, C/ San Cirilo s/n. 28801 Alcalá de Henares, Madrid. Spain b Grupo SCImago. University of Granada, Library and Information Science Faculty, Colegio Máximo de Cartuja. 18071 Granada. Spain.
Domain analysis by means of the visualization of maps of vast scientific domains
Pages: 579-585 Current Research in Information Sciences and Technologies
Multidisciplinary Approaches to Global Information Systems
Vicente P. Guerrero-Bote (Editor)
Proceedings of the I International Conference on Multidisciplinary Information Sciences and Technologies, InSciT2006
Mérida - SPAIN October, 25th-28th, 2006
ISBN-10 CD-ROM: 84-611-3106-1 ISBN-13 CD-ROM: 978-84-611-3106-8 ISBN-10 Whole Edition: 84-611-3103-7 ISBN-13 Whole Edition: 978-84-611-3103-7 ISBN-10 Volume II: 84-611-3105-3 ISBN-13 Volume II: 978-84-611-3105-3
Open Institute of Knowledge (Instituto Abierto del Conocimiento)
Antonio Álvarez 6 06005 Badajoz, SPAIN Phone: +34 924221935 Fax: +34 924221935 http://www.instac.es

Domain analysis by means of the visualization of maps of vast scientific domains Benjamín Vargas-Quesadaa1, Félix de Moya-Anegóna, Zaida Chinchilla-Rodrígueza and Antonio Gonzalez-Molinab a Grupo SCImago. University of Alcalá, Faculty of Documentation, Aulario María Guzmán, C/ San Cirilo s/n. 28801 Alcalá de Henares, Madrid. Spain b Grupo SCImago. University of Granada, Library and Information Science Faculty, Colegio Máximo de Cartuja. 18071 Granada. Spain
Category cocitation and its representation through social networks is proving to be a very adequate technique for the visualization and analysis of great scientific domains. Its combination with PathfinderNetworks using pruning values r = ∞ and q = n – 1 makes manifest the essence of research in the domain represented, or what we might call the “most salient structure”. The possible loss of structural information, caused by agressive pruning in perpheral areas of the networks, is neatly overcome by creating heliocentric maps for each category. The depictions obtained with this procedure become tools of great utility in view of their capacity to reveal the evolution of a given scientific domain over time, to show differences and similarities between different domains, and to suggest possible new lines of development.
Keywords: Information visualization, Domain analysis, Cocitation, Scientific output.
1 INTRODUCTION
In Moya Anegón [et al.] (2004), we proposed the cocitation of ISI categories as a new technique for building maps of vast scientific domains. Later, in Vargas-Quesada, B.(2005), we introduced PFNETS (Schaneveldt,1990) as the pruning algorithm so as to show the most “salient” structure of a domain, as well as using non-normalized cocitation values to give rise to the grouping of ISI categories in great thematic areas, as clusters. More recently, our work has brought us to use this same methodology for the visualiation and analysis of the scientific structure of the worldwide journal publication domain (Moya-Anegón, [et al.], forthcoming), and for the Spanish geographical domain (Moya-Anegón, [et al.], 2006). This allows us to clearly identify the macrostructure, the microstructure and the marrow of research. This methodology, as it evolves, may also be applied to the comparison of domains, to show their evolution and even their developmental trends, as we shall see below.
Category cocitation maps present a series of characteristics that facilitate analysis for the viewer: a) The combination of cocitation and PFNET makes the categories intervening most in research —that
is, the ones sharing more research fronts with the rest, therefore considered more universal—occupy central postions. Contrariwise, those participating less in research output are situated in peripheral positions;
b) PFNET and Factor Analysis (FA) complement each other nicely, one executing the groupings, the other establishing limits;
c) It is insightful to explore the different paths that connect the various thematic areas and the categories that make them up;
d) The categories that pertain to different factors show the points of interaction among the different thematic areas; and
e) The change in thematic assignment of a given category in the different temporal spaces shows the research trends in that category.
2 MATERIAL AND METHODS
For strictly investigative purposes, we downloaded from the ISI Web of Science (The Thompson Corporation, 2005b) and more precisely from the SCI and SSCI databases, all the records for the year 2002 that contained “USA” in the address field. This gave us a total of 316,878 documents (comprising articles, biographical items, book reviews, corrections, editorial materials, letters, meeting abstracts, news items and reviews). Likewise, we downloaded the records of scientific publication involving China for the years 1990 and 2002, obtaining 9,603 and 58,981 documents, respectively. The methodology used to generate maps of great scientific domains is given in Section 1. The heliocentric maps shown in the discussion section were
1 Corresponding Author: [email protected]
Visual Analytics of the Evolution and Diffusion of Scientific Knowledge
579

constructed from the same raw data, but using the methodology put forth in Moya-Anegón, [et al.], 2005.
3 RESULTS
The result of applying our methodology to the ISI data is a network of categories whose form is reminiscent of a human neuron, with a great axon or central neurite. In order to favor interpretation of the scientogram —which is how we prefer to denote this type of representation built from scientometric information— each sphere was labeled with the name of the corresponding JCR Category (The Thomson Corporation, 2005a) it represents, and was given a variable size, directly proportional to the volume of documents it comprises. To help visually establish the relationship between the size of each category and its actual output, in the lower left corner of the scientogram there is a sphere of reference with a size equivalent to the specified number of documents. The lines that connect the different spheres are the most significant relations of cocitation among categories, as the most superfluous ones were eliminated by PFNET pruning. These associations are thicker or thinner depending on the intensity of cocitation: the greater the intensity, the greater the thickness of the link. They represent, then, the consensual opinion of authors of documents as expressed by means of their use of citation.
3.1 Brief description of a domain
The scientogram in Figure 1 shows the synthesis of US Scientific output and its interrelations for the year 2002. Using FA, a total of 14 factors were identified. Each factor or thematic area was assigned a color and a number, listed in the lower left part of the scientogram
. Fig. 1. Scientogram of USA 2002 The US scientogram represents the model of science of a developed nation. The basic features, from a
macro-structural viewpoint, can be summed up as: a central zone featuring what we might call Biomedical Sciences and Earth Sciences; toward the right are grouped the Hard Sciences; and toward the left, the Soft Sciences are configured. This is a domain well advanced in research, with a structure or backbone typical of developed countries with a high level of well-being. Medicine occupies a central position, indicating the
Current Research in Information Sciences and Technologies
580
importance that its research and development hold for the community, sustained on its right side by research in science and technology, and by the social and human sciences to the left. This scheme of vertebration on the macrostructural level of science is a classic arrangement, which as we will see persists in the scientograms of developed countries, and shares little in common with the incipient backbones of other less developed countries.
The way that the different thematic areas are related over category paths is logical, though it also sheds some added light on the scientific structure of a domain. It could even be used to establish differences according to the domain involved. For instance, if we look closely at the way the areas of Biomedicine and Psychology are connected, we see that their path of connection goes from Biochemistry & Molecular Biology
Neurosciences Psychiatry Psychology. This is not the case in China, for the same time span (Fig. 3) where the path of connection runs: Biochemistry & Molecular Biology Neurosciences Clinical Neurology Psychiatry Psychology, making us suppose that in China, research into Psychology is more focused on clinical and pathological studies. Hence, its intermediary link with Clinical Neurology; whereas in the US, the branch is more theoretical, dedicated to the study of the individual psyche.
The categories seen in red reveal the points of confluence among different thematic areas as a result of their multiple adscription. Thus, for example, we distinguish Chemistry Multidisciplinary as a multidisciplinary category or point of interaction among the areas of Biomedicine and Material Sciences and Physics applied, or Biology Miscellaneous, which serves as the point of intersection between the areas of Animal Biology, Ecology, and Biomedicine, among others.
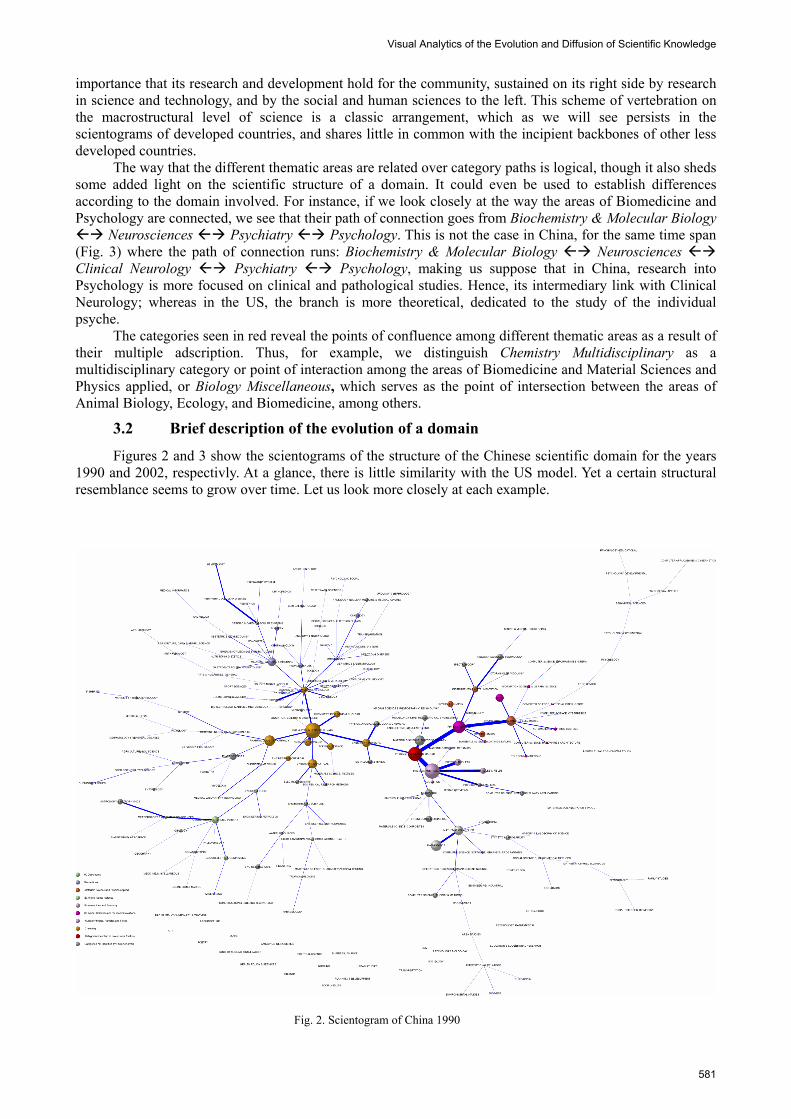
3.2 Brief description of the evolution of a domain
Figures 2 and 3 show the scientograms of the structure of the Chinese scientific domain for the years 1990 and 2002, respectivly. At a glance, there is little similarity with the US model. Yet a certain structural resemblance seems to grow over time. Let us look more closely at each example.
Fig. 2. Scientogram of China 1990
Visual Analytics of the Evolution and Diffusion of Scientific Knowledge
581

The scientogram of 1990 has identified seven thematic areas. Its scheme of vertebration appears quite distinct from the American model, which we had said to be exemplary of developed scientific domains. The center of research is clearly conformed by//around the area of Chemistry, underlining its importance for this time and place. The research into Biomedicine is just emerging. It would seem to be an offshoot from Chemistry rather than an autonomous area of knowledge. This is evidenced by the category Biochemistry and Molecular Biology, the nuclues of Biomedical research in developed domains, which here belongs to the area of Chemistry (not Biomedicine). The research output in Science and Technology is beginning to stand out. There are few catergories involved, and its structure is weak and somewhat disconnected. The materials Sciences appear more closely linked to the area of Computer Science and Telecommunications than to Chemistry or Physics. We find only one multidisciplinary category: Physics Condensed Matters, which is responsible for the interaction among the areas of Materials Sciences, Computer Sciences, and Telecommunications, and Nuclear Physics and Particle Physics.
In the scientogram of 2002 (Fig. 3) a total of eight thematic areas can be identified, one more than in the year 1990 — Soil and Earth Sciences. Its backbone is also quite different from the US model. However, the area Biomedicine has shifted toward a central position, and there is a strong increase in the number of catergories that integrate it. Unlike 1990, the nucleus of research has ceased to be exclusively in the realm of Chemistry, and is now shared by this category and the Material Sciences, making the category denoted Chemistry Physical the point of interconnection or interaction of the two. There are two multidisciplinary categories in this particular year: Physics Condensed Matter, which continues to be the link between the Materials Sciences and Nuclear and Particle Physics; and Plant Sciences, which is here the point of confluence of Biomedicine with Agriculture and Soil and Earth Sciences.
Generally speaking, we can say that the scientific domain of China has evolved toward a model that is structurally similar to that of the United States. That is, it has joined the ranks of the developed countries. Its emphasis on research in the areas of Science and Technology, the nucleus of the scientogram of 2002, and the greater presence of the categories of the biomedical area, point to this evolution.
Fig. 3. Scientogram of China 2002
Current Research in Information Sciences and Technologies
582

3 DISCUSSION
The representation of the predominant scientific structure behind a domain imvolves a process of clearing around the structural elements, eliminating the superfluous information. If we can´t see the forest for the trees, the trees will have to be pruned. The pruning needed to make manifest the most salient structure of the domain (r = ∞ y q = n – 1) is appropriate for the categories situated in the central area of the domain, where greater cocitation is found. This gives rise to bunches or clusters made up of links and categories which, by themselves, supply sufficient information for the analysis and evaluation of a thematic area or even of a given category. However, as we move away from the center of the depiction, toward the periphery, where cocitation is more limited, the pruning tends to be overly aggressive. This makes the analysis of the periphery of the domain less informative and more difficult to interpret. To avoid such a drawback, we resort to heliocentric mapping (Moya-Anegón, [et al.], 2005) which offers a second level of representation that is more detailed, and where the selected category appears in the center, surrounded by its neighbours or “satellites”. For the sake of clarity in the visualization, up to a maximum of twenty nodes are shown. The closer they lie to the central category, or the thicker their link, the greater the relationship of informational interchange between or among categories. To better reflect the thematic areas at a glance, each category is shown with a color (or shade thereof) representing the area of knowledge.
Just as we saw with the scientograms of vast scientific domains, these heliocentric maps can be used for the analysis and comparison of domains, or even to detect patterns of behaviour and trends in interchange from category to category over time.
Figure 4 shows three heliocentric maps for the category Physics, Condensed Matter. The first two maps are of the Chinese domain, and the third shows the US. Now appearing in red is the category that in the Chinese domain had consistently appeared as multidisciplinary. We believe that with the passing of time, its situation will change and it will lose its multithematic character.
China 1990 China 2002 USA 2002
Fig. 4. Heliocentric maps of Physics, Condensed Matter in China and USA
The heliocentric map of 1990 shows a much more detailed form in the interchange of information
between Physics, Condensed Matter and its most akin categories. In it we easily detect a nucleus made up of this category and others from the areas Nuclear Physics, Particles and Fields; Computer Science and Telecommunictions; and Chemistry. Around it, but much more distant, are other categories of Materials Science. This explains its situation and role as “gatekeeper” in the scientogram of 1990. In the map of 2002, meanwhile, we observe how the nucleus is recomposed to consist of a conglomerate of categories of the areas Chemistry; Materials Sciences; y Nuclear Physics, Particles and Fields, with Computer Science and Telecommunications losing a good part of its presence. Moreover, the categories outside the nucleuses are mostly from the areas of Chemistry and Material Science. This new model of interaction of Physics, Condensed Matter is responsible for the less central placement, and is determinant in the domain arrangement as its activity as gatekeeper is reduced. If we now look at the heliocentric map of the US 2002, we see that practically all the categories, whether in the nucleus or orbiting outside it, belong to the area of Material Science. Bearing in mind the evolutive process that Physics, Condensed Matter underwent in the Chinese domain from 1990 to 2002, it is foreseeable that China may take after the US domain in this sense, with progressively less interaction involving categories in the areas of Physics, Particles and Fields; Computer Science and Telecommunications, and even Chemistry; yet a growing interchange with Material Sciences. This would lead to a new rearrangement of the categories and a reconfiguration of the respective
Visual Analytics of the Evolution and Diffusion of Scientific Knowledge
583

scientogram. Figure 5 shows a snapshot of the situation of the category Library Science & Information Systems
(LIS) in China for the year 1990, along with its state in the year 2002, and the likely model to be followed, which would be the heliocentric map of the USA 2002. At first, LIS was only seen to be strongly related with two categories: Computer Science, Information Systems; and Engineering Electrical & Electronic The rest appear quite distant, suggesting a weak relationship of tangential knowledge interchange. In 2002, a significant increase of the categories in the area of Computer Sciences & Telecommunication takes place. In the nucleus, we begin to distinguish categories from the area Business, Law and Economy; and in the periphery, others along Biomedical lines, pointing to the appearance on the scene of bibliometric studies related with these areas —as happens as well on the US map. Again, the US heliocentric map seems to be the point of reference in terms of the evolution of interactions for a category, and therefore, the overall pattern that would tend to predominate in the evolution of a domain scientogram.
China 1990 China 2002 USA 2002
Fig. 5. Heliocentric maps of Library Science & Information Systems in China and USA
4 CONCLUSIONS
With the foundation of a previously developed methodology, we have shown how the scientograms of major scientific domains are very useful tools for the representation, analysis, comparison and evolutionary study of these domains. They can even be used a models to predict the behavior of other ones. The limitations that they entail, as a consequence of pruning the weakest relationships, are compensated by the heliocentric maps —which, in fact, enrich domain analysis.
The remaining weak point of scientograms and heliocentric maps are those inherent to domain analysis. That is, a certain awareness of the philosophy of science is needed, as is familiarity of economic, cultural and socio-political aspects of a domain in order to make a proper analysis and adequate interpretation of the underlying scientific structure. Yet a lack of such knowledge can be overcome to a great extent by the representations themselves. As is the case with scientograms, the heliocentric maps can be used as interfaces to access documents, which are ultimately the elements responsible for establishing the relationships of cocitation among categories, and therefore, the scientific structure of the domain under study. Furthermore, as can be seen in the Atlas of Science (Scimago Group, 2005), they are also the point of access for the generation of new maps of journals or authors, which allow the identification of research fronts within each category.
REFERENCES
[1] Moya-Anegón, F. d., Vargas-Quesada, B., Chinchilla-Rodríguez, Z., Corera-Álvarez, E., Munoz-Fernández, F. J., & Herrero-Solana, V. (2006). Visualización de la estructura científica española: 1990-2005. El Profesional de la Información 15, 258-269. [2] Moya-Anegón, F. d., Vargas-Quesada, B., Herrero-Solana, V., Chinchilla-Rodríguez, Z., Corera-Álvarez, E., & Munoz-Fernández, F. J. (2005). Domain analysis and information retrieval through the construction of heliocentric maps based on ISI-JCR category cocitation. Information Processing & Management, 41 (6), 1520-1533. [3] Moya-Anegón, F. d., Vargas-Quesada, B., Herrero-Solana, V., Chinchilla-Rodríguez, Z., Corera-Álvarez, E., & Munoz-Fernández, F. J. (2004). A new technique for building maps of large scientific domains based on the cocitation of classes and categories. Scientometrics 61(1), 129-145. [4] Schvaneveldt, R.W. (1990). Pathfinder Associative Networks. Norwood, NJ: Ablex. [5] SCImago Group. (2005). Atlas of Science. [Visited: 12/08/2005]. Available at: http://www.atlasofscience.net
Current Research in Information Sciences and Technologies
584

[6] The Thomson Corporation. (2005a). ISI Journal Citation Reports. [Visited: 09/03/2005]. Available at: http://go5.isiknowledge.com/portal.cgi [7] The Thomson Corporation. (2005b). ISI Web of Science. [Visited: 09/03/2005]. Available at: http://go5.isiknowledge.com/portal.cgi [8] Vargas-Quesada, B. (2005). Visualización y análisis de grandes dominios científicos mediante redes pathfinder. Ph. D. Thesis. Granada (Spain): Universidad.
Visual Analytics of the Evolution and Diffusion of Scientific Knowledge
585


![Bridging the gap of domain and visualization experts with ... › ... › simon2015liaison.pdf · edge in an application domain during a design study, e.g. in [SIB 11,SFMB12] (visualization](https://img.pdfslide.us/doc/110x75/5f28a92c39de3c15ca03f0b3/bridging-the-gap-of-domain-and-visualization-experts-with-a-a-simon2015liaisonpdf.jpg)