Embed Size (px)
Citation preview

Supporting Financial Achievement
Navy Federal Credit Union • 2016 Annual ReportFederally insured by NCUA.

Navy Federal Credit Union • 2016 Annual Report 2
Financial Summary
As of December 31 (dollars in millions)
2015 2016
Assets $ 73,286.8 $ 79,817.1
Loans Outstanding $ 53,999.5 $ 60,009.9
Savings, Checking, MMSAs, IRAs $ 36,880.6 $ 41,678.5
Share Certificates $ 11,985.3 $ 14,205.4
Members’ Equity $ 7,701.0 $ 8,727.3
Gross Income $ 4,717.9 $ 5,398.9
Non-interest Expense $ 2,243.0 $ 2,408.8
Dividends $ 387.3 $ 431.4
Mortgage Loans Serviced $ 47,436.5 $ 53,082.0
MEMBERS 5,976,265 6,817,122
Vision StatementBe the most preferred and trusted financial institution serving the military and their families.

Navy Federal Credit Union • 2016 Annual Report 3
—
“Best experience ever buying a vehicle! This is my third vehicle loan from Navy Federal. They have provided me with advantages that no bank can touch!”
Papadaddy
Report of the Chairman & President
Navy Federal had another very strong year in 2016. Our commitment to outstanding member experience helped us continue to set new records and gain national recognition. In 2016, we attracted new members in record-breaking numbers, introduced new services and continued to expand our network of branches. We added Mobile Banking features, increased security, enhanced products and provided financial education tools and resources.
ANOTHER RECORD-BREAKING YEAR We attracted nearly 1.2 million new members, which expanded our total membership to 6.8 million. These new members enthusiastically embraced our products and services, borrowing $3.4 billion and depositing $1.7 billion in savings.
Our strong suite of savings options and above-market rates, coupled with a more robust economy, boosted overall savings by $7 billion. This translated into a record $55.9 billion in total savings. Member investments through our subsidiary, Navy Federal Financial Group (NFFG), which offers financial planning, investments, insurance and trust services, also grew to $2.5 billion.
We set another record with the opening of 1.1 million new checking accounts, bringing our total number to 4.8 million. Members appreciated our variety of no- or low-cost checking accounts, all offering dividends and no monthly fees. Our Active Duty Checking® gives members access to their military pay one business
day early. Our mobile, online and in-branch banking, 24/7 contact center, debit cards and ATMs let members bank when it’s most convenient.
We issued 2.8 million debit cards with an embedded microchip, providing an additional measure of protection against fraud. And, our members made a record-breaking 1 billion purchases with their debit cards, an increase of almost 18 percent over 2015.
CONSUMER LENDING GROWTH In 2016, interest rates remained at historically low levels, and consumer confidence and spending increased, benefitting our members and increasing Navy Federal’s loan portfolio.
Our entire consumer loan portfolio (automobile, boat, motorcycle, personal loans and checking lines of credit) reached $16.8 billion, with members taking out more than 800,000 loans. We were pleased to lower our rate for personal loans from 10.49 percent to a very attractive 6.99 percent for up to 36 months. And, for the first time, members were able to apply for auto and personal loans via mobile. The enthusiastic response resulted in nearly 83,000 loans booked via Mobile Banking, for a total of $383 million. Finally, our U.S. Auto Buying Service generated nearly 11,000 loans for $265 million, and our Overseas Auto Buying Service generated more than 1,400 loans for $42 million.

Navy Federal Credit Union • 2016 Annual Report 4
—
“I’ve been able to travel, pay bills, and assist with daily life because of this cashRewards card. It has made me financially free and improved my credit rating.”
Tyrell85
Credit Cards Our credit card portfolio ended the year with 419,000 new accounts, and sales increased by an impressive $2.5 billion for overall sales of $17.8 billion. Much of this growth can be attributed to our emphasis on card enhancements and continual cardholder education.
In 2016, we enhanced our offerings by introducing a number of new redemption options, allowing members to redeem points for hotels and car rentals and increasing the cash back value for our Visa Signature® Flagship Rewards Card. We completed the transition of our credit card portfolio to chip cards to increase transaction security. At 100 percent migration, we were well ahead of the industry average of 70 percent.
Mortgage and Equity LoansThe growth of the real estate market was good news for the economy and for Navy Federal members. Our mortgage and equity servicing earned high marks in J.D. Power’s 2016 U.S. Primary Mortgage Servicer Satisfaction Study. As our members’ trusted
mortgage advisor, we had our best year ever in 2016, closing 48,000 loans for a total of $12.7 billion. Our 100-percent-financing options performed well, enabling greater numbers of members to enjoy the benefits of homeownership. By the end of the year, our servicing portfolio topped all previous years with a record $53.0 billion.
As property values increased across much of the country, members tapped into their home equity to fund home improvement projects, pay college tuition and consolidate debt. Home Equity Lines of Credit (HELOCs) were the most popular product offering with low, variable rates and a generous 20-year open credit line. Our Fixed-Rate Equity Loan product was the perfect choice for members who preferred the security of a fixed rate and consistent monthly payments. In all, Equity Lending closed approximately 12,000 loans for a total of $726.0 million, a 6.0 percent increase over 2015.
Student LoansCollege students can face a gap between their college costs and the funds they have available from savings, financial aid packages and federal education loans. Navy Federal’s private student loans helped members bridge that gap, financing $105.8 million and ending the year with a student loan portfolio of $145.1 million. In July, we introduced
fixed-rate and multi-term product offerings, which generated $44 million in new loans. Our loans made higher education possible for nearly 8,000 students attending more than 1,300 different colleges and universities.

Navy Federal Credit Union • 2016 Annual Report 5
—
>
>
>
“There is nothing like Navy Federal Credit Union. They have the best customer service ever and the best system in the whole world. They truly take good care of every member and every aspect of any daily transaction you make with them. We feel very secure and satisfied with NFCU.”
LV777
DIGITAL TRENDS AND INNOVATION
Mobile and Online AccessThere were 286,000 new membership accounts opened through digital channels in 2016, an astonishing increase of 40 percent over 2015. Members booked more than $4.5 billion in combined consumer loan and credit card applications (47 percent of total applications) via Mobile and Online Banking. Significantly, mobile deposits became the number-one source of check deposits at Navy Federal.
We were honored to be recognized by Javelin for the 2016 “Best Overall Online Banking Leader” award. Javelin credited Navy Federal “with a combination of features that not only can empower its 6 million members to handle financial chores confidently, but also position the [financial institution] as a guide on a lifelong financial journey.”
Other exciting highlights:
This past year, NFFG launched a new online life insurance platform, offering two convenient options for members looking to purchase life insurance: one specifically designed for military members and the other for all members.
In July, a new feature was released for Mobile and Online Banking that allows members to create a unique username to log into their accounts in place of an Access Number.
In October, we enhanced Online Banking’s transfer functionality to improve the process of transferring money between accounts.
InnovationIn response to the ever-increasing demand for security, flexibility and convenience, Navy Federal continued to seek new ways to improve members’ experiences and increase accessibility. We’re proud to announce that in 2016, two of our innovative User Experience and Design team members were awarded a U.S. patent for a method of executing financial transactions via an electronic device. This new function is designed to simplify the process for users and prevent user errors.
COMMITMENT TO SERVICE AND FINANCIAL EDUCATIONNavy Federal is proud to provide members with educational information that supports sound financial decision making and a variety of tools to help manage their finances. We continued to expand and improve our network and channels of engagement so members could enjoy anytime, anywhere banking.
Expanding Our NetworkWe opened 20 new branches in the U.S., several of which were located on or near military installations, including NAS Whidbey Island, Victory Square near Fort Benning, Kennesaw Mountain near Dobbins Air Reserve Base, Poulsbo near Naval Base Kitsap and Fort Drum. We continued our commitment to adding branches convenient to members by opening new in-store branches at three Walmart retail locations. This brought our total to 294 branches worldwide.

—
Navy Federal Credit Union • 2016 Annual Report 6
LOANS/SAVINGS (dollars in billions)
2015 $54.0/$48.9
2016 $60.0/$55.9
MEMBERS
2015 5,976,265
2016 6,817,122
ASSETS (dollars in billions)
2015 $73.3
2016 $79.8
“Navy Federal has the best customer service! Their app is so convenient that you can do anything online. Highly recommend!!”
Kbernie
24/7 SupportOur Contact Center provides world-class service for members 24 hours a day, seven days a week. Member Service Representatives served more than 3.6 million members, fielding just under 30 million calls, with 95 percent of transactions completed in one call. Members reported outstanding experiences, with 94 percent indicating high satisfaction with the level of courtesy they received.
The ICMI Global Contact Center recognized us as the best of the best with their “Best Social Media Customer Care” award. The Social Care team sent nearly 18,000 responses to members on Facebook and Twitter and averaged a response time of 12 minutes.
MakingCentsOne of our initiatives for 2016 was to increase members’ financial knowledge through the development of a digital resource. In March, we were proud to launch MakingCents, a site that provides easy-to-digest information on personal finance, credit cards, retirement, and navigating major expenditures like automobiles, homes and college. It features interactive calculators, videos, articles and self-paced tracks.
MakingCents drew more than 841,000 unique visitors to the site in its first eight months. Of the six educational tracks, the most popular was the personal finance track, which provides information on budgeting, credit, borrowing and understanding debt. MakingCents received an honorable mention in PR Daily’s Content Marketing Awards 2016 in the Best Content Marketing Strategy category.
DISTINCTIVE SERVICEThis year, Forrester’s 2016 US Customer Experience Index named us number one in “Customer Experience for Full-Service Banking” and number two in “Best-in-Class for Customer Experience.” For the tenth consecutive year, our commitment to excellence was recognized by the Department of the Navy, naming us the “Distinguished Credit Union of the Year.” And, in November, the American Customer Satisfaction Index (ACSI) named us the “Highest Rated Financial Institution for Customer Satisfaction,” citing quality and customer satisfaction. Navy Federal surpassed the industry averages, scoring higher than the nation’s four largest banks. We were selected as a 2016 FORTUNE “100 Best Companies to Work For®.” This is the fifth year in a row and sixth time overall we were selected for this prestigious recognition. We were also selected as a 50 Best Workplaces for Diversity, 100 Best Workplaces for Women, 100 Best Workplaces for Millennials, 30 Best Workplaces to Retire From, and 30 Best Workplaces in Finance and Insurance.
In 2016, we set new records across all products and services, added and enhanced our offerings. We expanded our financial literacy resources, reinforcing our commitment to member satisfaction and their financial well-being. We look forward to continuing to support members’ financial achievements and are proud to serve them wherever life takes them.
John A. Lockard Chairman
Cutler Dawson President

Navy Federal Credit Union • 2016 Annual Report 7
2016 Board of Directors
John A. LockardChairman of the Board
Bruce B. Engelhardt First Vice Chairman
Edward R. Cochrane Jr.Second Vice Chairman
Cutler DawsonTreasurer
Kenneth R. BurnsSecretary
Kirk A. Foster Neil W. T. Hogg William P. Mizerak Henry J. Sanford
Delivering world-class service has been the cornerstone of Navy Federal’s success ever since our founding in 1933.

Navy Federal Credit Union • 2016 Annual Report 8
Supervisory Committee Input for the 2016 Annual Report
Supervisory Committee
Kirk A. Foster Anthony M. Kurta Patrick J. McClanahan
Pasquale M. Tamburrino Jr. Michael C. WholleyChairman, Supervisory Committee
The Supervisory Committee provides the membership with an independent appraisal of the safety and soundness of Navy Federal’s operations and activities. It does so in compliance with the Federal Credit Union Act and Navy Federal’s bylaws. The Committee reviews all audit reports and meets quarterly to discuss audit results, Internal Audit recommendations for strengthening internal controls, and the status of management’s action on all prior Internal Audit recommendations. The Supervisory Committee ensures that Navy Federal’s financial statements provide a fair and accurate presentation of its financial condition and that management establishes and maintains sound internal controls to protect the assets of your credit union.
The Supervisory Committee employs the independent accounting firm of PricewaterhouseCoopers LLP (PwC) to assist in meeting its responsibilities. The Committee meets regularly with PwC to evaluate audit results and to plan future audit work. PwC conducts quarterly procedures related to selected operations, and performs a comprehensive audit of the credit union’s year-end financial statements. PwC’s year-end audit, the Independent Auditor’s Report, appears in this Annual Report.
Acting as your ombudsman, the Supervisory Committee assures that all members are treated fairly by maintaining an open communication with the membership. Throughout the year, the committee reviews and responds in writing to all letters and e-mails it receives from the membership. Both the membership and the management of Navy Federal benefit from this open communication because your individual concerns are addressed on a personal basis and your comments help to ensure that Navy Federal maintains the highest level of service to its members.
The National Credit Union Administration (NCUA), the regulatory agency for all federally chartered credit unions, also performs periodic supervisory examinations. In 2016, a review of certain activities was also performed by the Consumer Financial Protection Bureau (CFPB). Navy Federal’s asset size places it under the regulatory supervision of the CFPB for compliance with Federal consumer financial laws.
Based on the results of the Annual Report of Independent Auditors and the Examination Report of the NCUA, it is the opinion of your Supervisory Committee that Navy Federal continues to be financially strong and well managed, with sound policies and programs.
Michael C. WholleyChairman

Navy Federal Credit Union • 2016 Annual Report 9
Other Committee Members
Annie B. Andrews Edward W. Devinney II
John E. Gumbleton Caral E. Spangler
Not pictured: Kelly K. Harrison
Volunteer Officials
Board of DirectorsJohn A. LockardVice Admiral, USN (Ret.)Chairman of the BoardExecutive Committee
Bruce B. EngelhardtRear Admiral, USN (Ret.)First Vice ChairmanExecutive CommitteeFinancial Strategy and Investment CommitteePlanning and Strategic Direction Committee
Edward R. Cochrane Jr.Second Vice ChairmanExecutive CommitteeFinancial Strategy and Investment Committee Planning and Strategic Direction Committee
Cutler DawsonVice Admiral, USN (Ret.)TreasurerExecutive CommitteeFinancial Strategy and Investment CommitteePlanning and Strategic Direction Committee
Kenneth R. BurnsColonel, USMC (Ret.)SecretaryExecutive CommitteeFinancial Strategy and Investment Committee
Kirk A. FosterRear Admiral, USN (Ret.)Supervisory Committee
Neil W. T. HoggCaptain, USN (Ret.)Financial Strategy and Investment Committee
William P. MizerakColonel, USMC (Ret.)Financial Strategy and Investment CommitteePlanning and Strategic Direction Committee
Henry J. SanfordCaptain, USN (Ret.)Planning and Strategic Direction Committee
Committee MembersAnnie B. AndrewsRear Admiral, USN (Ret.)Planning and Strategic Direction Committee
Edward W. Devinney IICaptain, USNFinancial Strategy and Investment CommitteePlanning and Strategic Direction Committee
John E. GumbletonCaptain, USNFinancial Strategy and Investment Committee
Kelly K. HarrisonCommander, USNFinancial Strategy and Investment Committee
Anthony M. KurtaRear Admiral, USN (Ret.)Financial Strategy and Investment CommitteeSupervisory Committee
Patrick J. McClanahanCaptain, SC, USN (Ret.)Financial Strategy and Investment CommitteeSupervisory Committee
Caral E. SpanglerFinancial Strategy and Investment Committee
Pasquale M. Tamburrino Jr.Financial Strategy and Investment CommitteeSupervisory Committee
Michael C. WholleyBrigadier General, USMC (Ret.)Chairman, Supervisory CommitteePlanning and Strategic Direction Committee

Navy Federal Credit Union • 2016 Annual Report 10
Use of released Department of Defense imagery does not constitute product or organizational endorsement of any kind by the Department of Defense. Message and data rates may apply. Visit navyfederal.org for more information. Apple Pay™ and Touch ID™ are trademarks of Apple, Inc. Android Pay™ is a trademark of Google, Inc. Samsung Pay™ is a trademark of Samsung Electronics Co., Ltd. App StoreSM is a service mark of Apple, Inc. Google Play™ is a trademark of Google, Inc. Amazon, Kindle, Fire and all related logos are trademarks of Amazon.com, Inc. or its affiliates. Registered representatives of and securities offered through Navy Federal® Brokerage Services, LLC (NFBS), member FINRA/SIPC. Investment Advisory Services offered through Navy Federal® Asset Management, LLC (NFAM), an SEC registered investment advisor. Nondeposit investment products are not federally insured, are not obligations of the credit union, are not guaranteed by the credit union or any affiliated entity, involve investment risks, including the possible loss of principal, and may be offered by an employee who serves both functions of accepting member deposits and selling nondeposit investment products. NFBS and NFAM products are not offered, recommended, sanctioned, or encouraged by the federal government. Insurance sold through licensed Insurance Representatives of various companies. Office of Supervisory Jurisdiction, 820 Follin Lane, Vienna, VA 22180; phone 1-877-221-8108; fax 703-206-1510.

Supporting Financial Achievement
Navy Federal Credit UnionConsolidated Financial Statements and Independent Auditor’s Report
December 31, 2016 and 2015
Financial Section 1
2016—Supporting Financial Achievement
Independent Auditor’s Report To the Board of Directors and Supervisory Committee of Navy Federal Credit Union:
We have audited the accompanying consolidated financial statements of Navy Federal Credit Union, which comprise the consolidated statements of financial condition as of December 31, 2016 and December 31, 2015, and the related consolidated statements of income, comprehensive income, changes in members’ equity and of cash flows for the years then ended.
Management’s Responsibility for the Consolidated Financial Statements Management is responsible for the preparation and fair presentation of the consolidated financial statements in accordance with accounting principles generally accepted in the United States of America; this includes the design, implementation, and maintenance of internal control relevant to the preparation and fair presentation of consolidated financial statements that are free from material misstatement, whether due to fraud or error.
Auditors’ Responsibility Our responsibility is to express an opinion on the consolidated financial statements based on our audits. We conducted our audits in accordance with auditing standards generally accepted in the United States of America. Those standards require that we plan and perform the audit to obtain reasonable assurance about whether the consolidated financial statements are free from material misstatement.
An audit involves performing procedures to obtain audit evidence about the amounts and disclosures in the consolidated financial statements. The procedures selected depend on our judgment, including the assessment of the risks of material misstatement of the consolidated financial statements, whether due to fraud or error. In making those risk assessments, we consider internal control relevant to the Company’s preparation and fair presentation of the consolidated financial statements in order to design audit procedures that are appropriate in the circumstances, but not for the purpose of expressing an opinion on the effectiveness of the Company’s internal control. Accordingly, we express no such opinion. An audit also includes evaluating the appropriateness of accounting policies used and the reasonableness of significant accounting estimates made by management, as well as evaluating the overall presentation of the consolidated financial statements. We believe that the audit evidence we have obtained is sufficient and appropriate to provide a basis for our audit opinion.
Opinion In our opinion, the consolidated financial statements referred to above present fairly, in all material respects, the financial position of Navy Federal Credit Union at December 31, 2016 and December 31, 2015, and the results of its operations and its cash flows for the years then ended in accordance with accounting principles generally accepted in the United States of America.
March 24, 2017 McLean, Virginia

Navy Federal Credit Union2Financial Section 3
2016—Supporting Financial Achievement
The accompanying notes are an integral part of these consolidated financial statements.
The accompanying notes are an integral part of these consolidated financial statements.
Consolidated Statements of Financial Condition
(dollars in thousands)
As of December 31,
2016 2015
ASSETS
Cash $ 538,734 $ 500,312
Short-term investments 2,197,535 2,115,248
Available-for-sale securities 13,961,855 13,859,916
Held-to-maturity securities 311,884 314,627
Mortgage loans awaiting sale 1,169,948 708,015
Loans to members, net of allowance for loan losses of $1,125,724 at December 31, 2016 and $965,979 at December 31, 2015 57,714,225 52,325,503
Accounts receivable and accrued interest 834,946 647,199
Property, plant and equipment, net 1,307,796 1,124,119
Investments in FHLBs 588,556 642,846
NCUSIF deposit 495,950 442,480
Mortgage servicing rights 319,527 270,876
Goodwill 58,905 58,905
Other assets 317,227 276,706
Total assets $ 79,817,088 $ 73,286,752
LIABILITIES AND MEMBERS’ EQUITY
Deposit accounts
Checking $ 10,680,341 $ 9,224,313
Savings 13,809,624 12,158,063
Money market savings 11,886,096 10,576,747
Certificates 14,205,395 11,985,314
Individual retirement accounts 5,302,456 4,921,436
Total deposit accounts 55,883,912 48,865,873
Liabilities
Borrowed funds 13,775,439 15,492,837
Accounts payable and accrued expenses 1,009,331 869,028
Other liabilities 421,067 358,012
Total deposit accounts and liabilities 71,089,749 65,585,750
Members’ equity
Equity 9,202,546 8,004,537
Accumulated other comprehensive loss (475,207) (303,535)
Total members’ equity 8,727,339 7,701,002
Total liabilities and members’ equity $ 79,817,088 $ 73,286,752
Consolidated Statements of Income
(dollars in thousands)
For the Year Ended December 31,
2016 2015
Interest income
Loans to members $ 3,705,818 $ 3,264,271
Investment securities 334,509 319,771
Other investments 30,007 21,248
Total interest income 4,070,334 3,605,290
Dividends and interest expense
Dividends on deposits 431,399 387,284
Interest on borrowed funds 298,985 275,272
Total dividends and interest expense 730,384 662,556
Net interest income 3,339,950 2,942,734
Provision for loan losses (1,061,740) (940,116)
Net interest income after provision for loan losses 2,278,210 2,002,618
Non-interest income
Net gain on mortgage loans 226,162 151,730
Net gain on sales of investments 38,573 25,700
Mortgage servicing revenue 95,796 84,839
Interchange income 353,904 294,626
Fee and other income 614,140 555,687
Total non-interest income 1,328,575 1,112,582
Non-interest expense
Salaries and employee benefits 1,158,540 1,058,286
Office operations and equipment 292,990 290,066
Servicing expense 334,847 316,321
Professional and outside services 175,026 102,087
Marketing 123,232 104,550
Depreciation and amortization 100,943 143,061
Other 223,198 228,610
Total non-interest expense 2,408,776 2,242,981
Net income $ 1,198,009 $ 872,219

Navy Federal Credit Union4Financial Section 5
2016—Supporting Financial Achievement
The accompanying notes are an integral part of these consolidated financial statements.
The accompanying notes are an integral part of these consolidated financial statements.
The accompanying notes are an integral part of these consolidated financial statements.
Consolidated Statements of Comprehensive Income
(dollars in thousands)
For the Year Ended December 31,
2016 2015
Net Income $ 1,198,009 $ 872,219
Other comprehensive income/(loss)
Change in unrecognized pension and postretirement amounts (1,339) 11,776
Unrealized net holding losses arising during the period on AFS securities (182,783) (147,744)
Change in unrecognized gains/(losses) in derivatives 12,450 (7,172)
Total other comprehensive loss (171,672) (143,140)
Total comprehensive income $ 1,026,337 $ 729,079
Consolidated Statements of Changes in Members’ Equity
(dollars in thousands)Regular Reserve
Capital Reserve
Undivided Earnings
Accumulated Other Comprehensive Income/(Loss)
Total Members’
Equity
Pension and Postretirement
Amounts
Available-for-Sale Securities Derivatives
Balance at December 31, 2014 $ 349,808 $ 6,732,510 $ 50,000 $ (280,360) $ 153,533 $ (33,568) $ 6,971,923
Other comprehensive income/(loss) — — — 11,776 (147,744) (7,172) (143,140)
Net income — — 872,219 — — — 872,219
Discretionary transfer — 872,219 (872,219) — — — —
Balance at December 31, 2015 $ 349,808 $ 7,604,729 $ 50,000 $ (268,584) $ 5,789 $ (40,740) $ 7,701,002
Other comprehensive (loss)/income — — — (1,339) (182,783) 12,450 (171,672)
Net income — — 1,198,009 — — — 1,198,009
Discretionary transfer — 1,198,009 (1,198,009) — — — —
Balance at December 31, 2016 $ 349,808 $ 8,802,738 $ 50,000 $ (269,923) $ (176,994) $ (28,290) $ 8,727,339
Consolidated Statements of Cash Flows
(dollars in thousands)
For the Year Ended December 31,
2016 2015
Cash flows from operating activities
Net income $ 1,198,009 $ 872,219
Adjustments to reconcile net income to net cash provided by operating activities:
Provision for loan losses 1,061,740 940,116
Depreciation and amortization of property, plant and equipment 100,943 143,061
Loss/(gain) on disposal and non-cash adjustments of property, plant and equipment 14,882 (512)
Net gain on sale of available for sale investment securities (38,069) (25,700)
Amortization of loan origination fees and costs (1,701) 5,546
Loss on valuation of mortgage servicing rights 33,342 28,024
Mortgage loans originated for sale (6,149,023) (5,074,969)
Gains on sale of mortgages (226,162) (151,730)
Mortgage loan sales proceeds 5,929,312 4,853,727
Accretion and amortization of investment securities 65,552 61,790
Change in accounts receivable and accrued interest (187,747) 418,505
Change in mortgage servicing rights (81,993) (63,099)
Change in other assets (83,997) (91,731)
Change in accounts payable and accrued expenses 140,303 77,044
Change in other liabilities 51,545 23,331
Net cash provided by operating activities 1,826,936 2,015,622
Cash flows from investing activities
Net increase in short-term investments (82,287) (1,760,710)
Purchase of AFS investment securities (4,857,380) (4,027,609)
Proceeds from maturities, paydowns, and calls of AFS investment securities 2,178,292 1,697,437
Proceeds from sales of AFS investment securities 2,366,950 1,528,158
Proceeds from maturities, paydowns, and calls of HTM investment securities 2,674 54,456
Net redemptions (purchases) of FHLB stock 54,290 (179,968)
Proceeds from loans sold originated for investment 21,833 36,193
Net increase in loans to members (6,448,602) (7,819,608)
Purchases of property, plant and equipment (293,962) (248,925)
Increase in NCUSIF deposit (53,470) (39,296)
Proceeds from sale of real estate owned 22,507 25,552
Net cash used in investing activities (7,089,155) (10,734,320)
Cash flows from financing activities
Net increase in deposit accounts 7,018,039 4,711,674
Net decrease in securities sold under repurchase agreements (439,982) (749,520)
Proceeds from borrowings 6,143,101 30,372,155
Repayments of borrowings (7,420,517) (25,541,500)
Net cash provided by financing activities 5,300,641 8,792,809
Net increase in cash 38,422 74,111
Cash at beginning of year 500,312 426,201
Cash at end of year $ 538,734 $ 500,312
Supplemental cash flow information:
Interest paid $ 731,741 $ 660,015
Transfers from loans to other assets 21,991 26,015
Loan securitization — 255,545

Navy Federal Credit Union6Financial Section 7
2016—Supporting Financial Achievement
Note 1: Summary of Significant Accounting Policies
OrganizationNavy Federal Credit Union is a member-owned, not-for-profit financial institution formed in 1933 under the provisions of the Federal Credit Union Act to provide a variety of financial services to those individuals in its field of membership, which includes active duty and retired military and civilian personnel who are or were employed by the Department of Defense and their families. Navy Federal is headquartered in Vienna, VA with branch locations around the country and abroad.
Basis of Presentation and Use of EstimatesThe consolidated financial statements have been prepared in accordance with accounting principles generally accepted in the United States of America (GAAP). The preparation of financial statements in accordance with GAAP requires management to make estimates and assumptions that affect the amounts reported in the consolidated financial statements and accompanying notes. These estimates are based on information available at the time the consolidated financial statements are prepared. Actual amounts or results could differ from these estimates.
Navy Federal evaluated subsequent events through March 24, 2017, the date these financial statements were issued.
Principles of ConsolidationThe consolidated financial statements include the accounts of Navy Federal Credit Union and its wholly owned entity. All significant intercompany accounts and transactions are eliminated in consolidation.
Navy Federal Financial Group (NFFG) is a credit union service organization wholly owned by Navy Federal Credit Union that provides investment, insurance and other financial services. Navy Federal Brokerage Services and Navy Federal Asset Management are wholly owned subsidiaries of NFFG. Navy Federal Credit Union and its consolidated entity are referred to as “Navy Federal” herein.
Business Combinations The Financial Accounting Standards Board (FASB) Accounting Standards Codification (ASC) 805-10, Business Combinations, requires all business combinations be accounted for by applying the acquisition method. Accordingly, Navy Federal recognizes assets obtained and liabilities assumed in a business combination at fair value on the acquisition date and includes the results of operations of the acquired entity on its Consolidated Statements of Income from the acquisition date. Navy Federal recognizes as goodwill the excess of acquisition price over the fair value of net assets acquired.
Cash Cash includes cash on hand and balances due from other financial institutions, including minimum cash reserves required to be held at the Federal Reserve. Cash excludes restricted cash, which is included in Other assets in the Consolidated Statements of Financial Condition. See Note 2: Restrictions on Cash for details on restricted cash.
Short-Term InvestmentsShort-term investments include federal funds sold and securities purchased under agreements to resell, all of which have original maturities of 90 days or less. Short-term investments also include cash held at Federal Reserve Bank in excess of the minimum reserves. As of December 31, 2016 and 2015, all short-term investments were carried at cost, which approximated fair value.
Investments Navy Federal’s securities are classified as held-to-maturity (HTM) or available-for-sale (AFS) in accordance with ASC 320-10, Investments—Debt and Equity Securities. Securities classified as HTM are carried at cost, adjusted for the amortization of premiums and accretion of discounts. Management has the ability and intent to hold these securities to maturity. Securities classified as AFS are carried at fair value, with any unrealized gains and losses recorded as accumulated other comprehensive income (AOCI), which is a separate component of members’ equity. See Note 3: Investments for details. Gains and losses on dispositions are computed using the specific identification method and are included in Net gain on sales of investments in the Consolidated Statements of Income. For both HTM and AFS securities, interest income is recognized on an accrual basis, and premiums and discounts are amortized or accreted as an adjustment to interest income using the interest method (effective yield).
Navy Federal evaluates its securities in an unrealized loss position for other-than-temporary impairment (OTTI) in accordance with ASC 320-10, Investments—Debt and Equity Securities. A security is considered impaired when its fair value is less than its amortized cost basis. In order to determine whether an OTTI exists for its securities in an unrealized loss position, Navy Federal assesses whether it (a) has the intent to sell the security, (b) is a debt security, where it is more likely than not that it will be required to sell the security before recovering its amortized cost basis, or (c) does not expect to recover the entire amortized cost basis of the security even if it does not intend to sell the security. In order to determine whether the entire amortized cost basis of the security can be recovered (condition (c) above), Navy Federal compares the present value of cash flows expected to be collected from the security with its amortized cost basis and considers (1) the length of time and the extent to which the fair value has been less than cost, (2) adverse conditions specifically related to the security or specific industry, (3) the volatility of the security and its expected cash flows, and (4) changes in ratings of the issuer. Declines in fair value deemed OTTI-attributable to credit quality are recognized in earnings, and declines in fair value related to other factors are recognized in AOCI.
In accordance with ASC 860-10, Transfers and Servicing, repurchase agreements and reverse repurchase agreements are recorded at historical cost and accounted for as secured financings or investments. Navy Federal transfers title to the collateral sold or purchased under repurchase (reverse repurchase) agreements and monitors the fair value of the underlying securities, which are primarily U.S. government and federal agency securities. Some of Navy Federal’s repurchase agreements and reverse repurchase agreements are subject to legally enforceable master netting agreements, which allow Navy Federal to settle positive and negative positions held with the same counterparty on a net basis. See Note 10: Balance Sheet Offsetting for details.
Loans The Navy Federal loan portfolio consists of consumer, credit card and real estate loans. Consumer loans consist of auto loans, signature loans, checking lines of credit and education loans. Real estate loans consist of mortgage and equity loans. At origination, all consumer, credit card and equity loans are classified as held for investment, and mortgage loans are classified as either mortgage loans held for investment or mortgage loans awaiting sale (MLAS) based on management’s intent and ability to hold or sell the loans.
In accordance with ASC 310, Receivables, loans, except for MLAS, are carried at the amount of unpaid principal balance (UPB) adjusted for net deferred loan fees and costs, less an allowance for loan losses. Interest is accrued on loans using the interest method on the UPB on a daily basis except for credit card loans, for which interest is calculated by applying the periodic rate to the average daily balance outstanding on the member’s monthly statement date.
Navy Federal Credit Union8Financial Section 9
2016—Supporting Financial Achievement
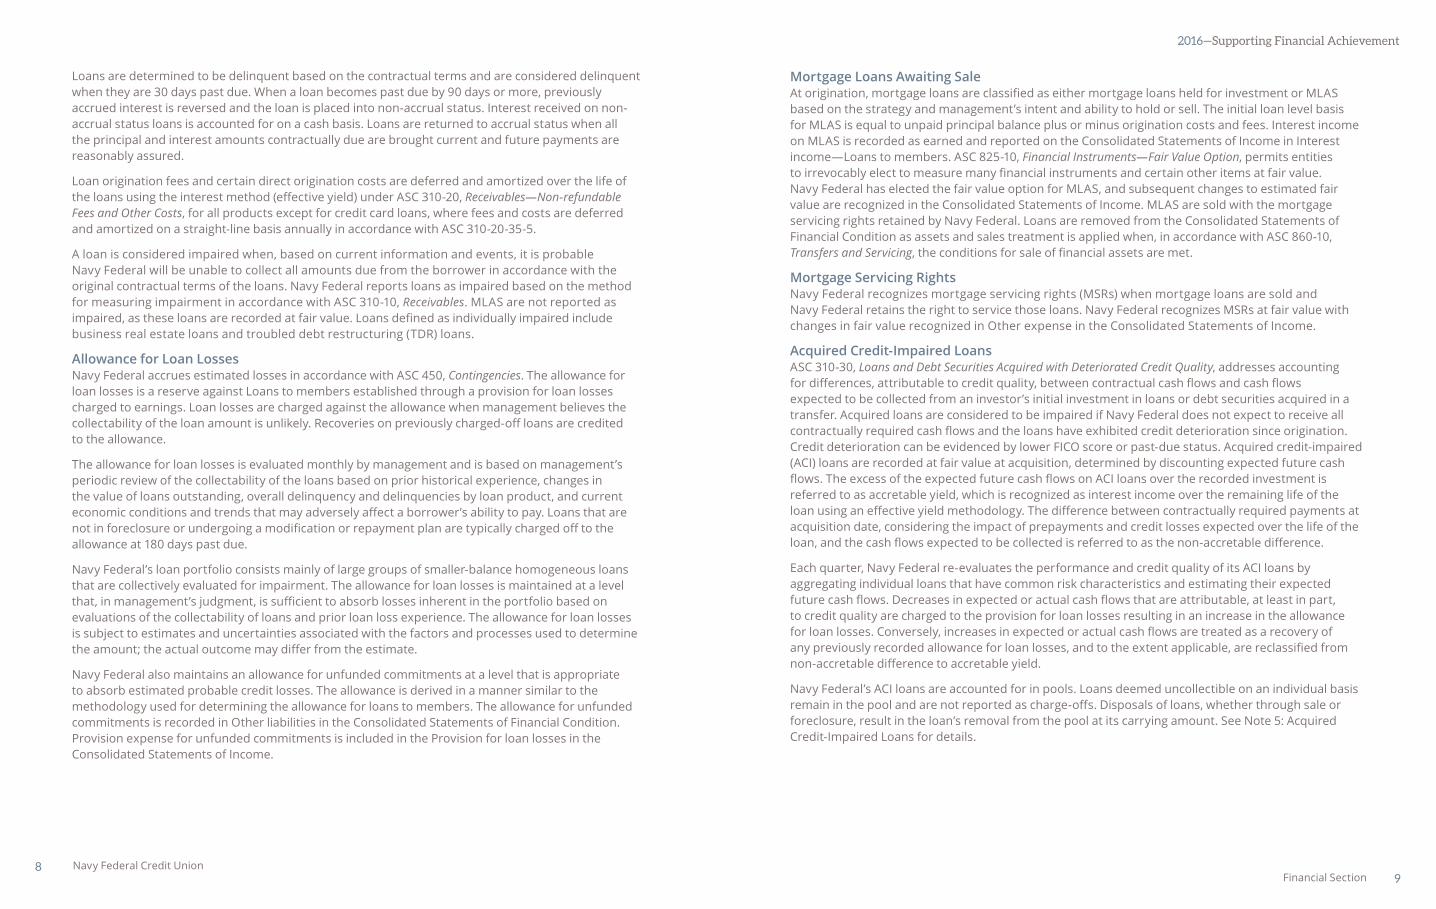
Loans are determined to be delinquent based on the contractual terms and are considered delinquent when they are 30 days past due. When a loan becomes past due by 90 days or more, previously accrued interest is reversed and the loan is placed into non-accrual status. Interest received on non-accrual status loans is accounted for on a cash basis. Loans are returned to accrual status when all the principal and interest amounts contractually due are brought current and future payments are reasonably assured.
Loan origination fees and certain direct origination costs are deferred and amortized over the life of the loans using the interest method (effective yield) under ASC 310-20, Receivables—Non-refundable Fees and Other Costs, for all products except for credit card loans, where fees and costs are deferred and amortized on a straight-line basis annually in accordance with ASC 310-20-35-5.
A loan is considered impaired when, based on current information and events, it is probable Navy Federal will be unable to collect all amounts due from the borrower in accordance with the original contractual terms of the loans. Navy Federal reports loans as impaired based on the method for measuring impairment in accordance with ASC 310-10, Receivables. MLAS are not reported as impaired, as these loans are recorded at fair value. Loans defined as individually impaired include business real estate loans and troubled debt restructuring (TDR) loans.
Allowance for Loan Losses Navy Federal accrues estimated losses in accordance with ASC 450, Contingencies. The allowance for loan losses is a reserve against Loans to members established through a provision for loan losses charged to earnings. Loan losses are charged against the allowance when management believes the collectability of the loan amount is unlikely. Recoveries on previously charged-off loans are credited to the allowance.
The allowance for loan losses is evaluated monthly by management and is based on management’s periodic review of the collectability of the loans based on prior historical experience, changes in the value of loans outstanding, overall delinquency and delinquencies by loan product, and current economic conditions and trends that may adversely affect a borrower’s ability to pay. Loans that are not in foreclosure or undergoing a modification or repayment plan are typically charged off to the allowance at 180 days past due.
Navy Federal’s loan portfolio consists mainly of large groups of smaller-balance homogeneous loans that are collectively evaluated for impairment. The allowance for loan losses is maintained at a level that, in management’s judgment, is sufficient to absorb losses inherent in the portfolio based on evaluations of the collectability of loans and prior loan loss experience. The allowance for loan losses is subject to estimates and uncertainties associated with the factors and processes used to determine the amount; the actual outcome may differ from the estimate.
Navy Federal also maintains an allowance for unfunded commitments at a level that is appropriate to absorb estimated probable credit losses. The allowance is derived in a manner similar to the methodology used for determining the allowance for loans to members. The allowance for unfunded commitments is recorded in Other liabilities in the Consolidated Statements of Financial Condition. Provision expense for unfunded commitments is included in the Provision for loan losses in the Consolidated Statements of Income.
Mortgage Loans Awaiting Sale At origination, mortgage loans are classified as either mortgage loans held for investment or MLAS based on the strategy and management’s intent and ability to hold or sell. The initial loan level basis for MLAS is equal to unpaid principal balance plus or minus origination costs and fees. Interest income on MLAS is recorded as earned and reported on the Consolidated Statements of Income in Interest income—Loans to members. ASC 825-10, Financial Instruments—Fair Value Option, permits entities to irrevocably elect to measure many financial instruments and certain other items at fair value. Navy Federal has elected the fair value option for MLAS, and subsequent changes to estimated fair value are recognized in the Consolidated Statements of Income. MLAS are sold with the mortgage servicing rights retained by Navy Federal. Loans are removed from the Consolidated Statements of Financial Condition as assets and sales treatment is applied when, in accordance with ASC 860-10, Transfers and Servicing, the conditions for sale of financial assets are met.
Mortgage Servicing Rights Navy Federal recognizes mortgage servicing rights (MSRs) when mortgage loans are sold and Navy Federal retains the right to service those loans. Navy Federal recognizes MSRs at fair value with changes in fair value recognized in Other expense in the Consolidated Statements of Income.
Acquired Credit-Impaired LoansASC 310-30, Loans and Debt Securities Acquired with Deteriorated Credit Quality, addresses accounting for differences, attributable to credit quality, between contractual cash flows and cash flows expected to be collected from an investor’s initial investment in loans or debt securities acquired in a transfer. Acquired loans are considered to be impaired if Navy Federal does not expect to receive all contractually required cash flows and the loans have exhibited credit deterioration since origination. Credit deterioration can be evidenced by lower FICO score or past-due status. Acquired credit-impaired (ACI) loans are recorded at fair value at acquisition, determined by discounting expected future cash flows. The excess of the expected future cash flows on ACI loans over the recorded investment is referred to as accretable yield, which is recognized as interest income over the remaining life of the loan using an effective yield methodology. The difference between contractually required payments at acquisition date, considering the impact of prepayments and credit losses expected over the life of the loan, and the cash flows expected to be collected is referred to as the non-accretable difference.
Each quarter, Navy Federal re-evaluates the performance and credit quality of its ACI loans by aggregating individual loans that have common risk characteristics and estimating their expected future cash flows. Decreases in expected or actual cash flows that are attributable, at least in part, to credit quality are charged to the provision for loan losses resulting in an increase in the allowance for loan losses. Conversely, increases in expected or actual cash flows are treated as a recovery of any previously recorded allowance for loan losses, and to the extent applicable, are reclassified from non-accretable difference to accretable yield.
Navy Federal’s ACI loans are accounted for in pools. Loans deemed uncollectible on an individual basis remain in the pool and are not reported as charge-offs. Disposals of loans, whether through sale or foreclosure, result in the loan’s removal from the pool at its carrying amount. See Note 5: Acquired Credit-Impaired Loans for details.

Navy Federal Credit Union10Financial Section 11
2016—Supporting Financial Achievement
Troubled Debt RestructuringsA troubled debt restructuring (TDR) is a loan for which Navy Federal has granted a concession it would not otherwise consider because that member is experiencing financial difficulty. The types of concessions Navy Federal grants in a TDR primarily include term extensions and interest rate reductions. TDR loans are accounted for in accordance with ASC 310-40, Troubled Debt Restructurings by Creditors. See Note 4: Loans and Allowance for Loan and Lease Losses for details.
Real Estate OwnedNavy Federal obtains real estate owned (REO) through foreclosure proceedings or when a delinquent borrower chooses to transfer a mortgaged property in lieu of foreclosure. REO is initially recorded at fair value less estimated costs to sell and is included in Other assets in the Consolidated Statements of Financial Condition. After acquisition, REO is carried at the lower of cost or fair value less costs to sell. Holding period maintenance costs are expensed as incurred. Valuation adjustments, holding period maintenance costs and gains/losses on disposal are included in Other expense in the Consolidated Statements of Income.
Property, Plant and EquipmentLand is carried at cost. Buildings, furniture, fixtures, equipment, computer software and capitalized information technology (IT) projects are carried at cost less accumulated depreciation and amortization, which are computed on a straight-line basis over the assets’ estimated useful lives. Leasehold improvements are carried at cost less accumulated amortization and are amortized over the lesser of useful life or the remaining fixed non-cancelable lease term. Useful lives for each asset category are estimated as follows:
Useful Life
Buildings 40 years
Equipment, furniture and fixtures 5 to 7.5 years
Computer equipment 2 to 3 years
Computer software 5 years
Capitalized IT projects 5 years
Gains or losses upon disposition are reflected in earnings and included in Other expense in the Consolidated Statements of Income.
Navy Federal uses the straight-line method to account for its operating leases. Under this method, Navy Federal divides the total contractual rent by the total term of the lease. The average monthly rent is recorded as rent expense, and the remaining rent amount is deferred. Navy Federal reviews its operating leases annually for the existence of asset retirement obligations that are accrued, when material, pursuant to ASC 410-20, Asset Retirement Obligations.
NCUSIF DepositThe deposit in the National Credit Union Share Insurance Fund (NCUSIF) is in accordance with the Federal Credit Union Act and the National Credit Union Administration (NCUA) regulations, which requires the maintenance of a deposit by each credit union in an amount equal to 1% of its insured shares. The deposit would be refunded to Navy Federal if its insurance coverage is terminated or the operations of the fund are transferred from the NCUA Board.
Goodwill Goodwill represents the excess of purchase price over the fair value of net assets acquired in business combinations. ASC 350-20, Intangibles—Goodwill and Other, provides that intangible assets with finite useful lives be amortized and that goodwill and intangible assets with indefinite lives be evaluated at least annually for impairment. Navy Federal evaluates goodwill for impairment annually or more frequently should events or changes in circumstances occur that would more likely than not reduce fair value to below carrying value. Impairment exists when the carrying amount of goodwill exceeds its implied fair value. See Note 14: Goodwill for details.
Derivative Financial InstrumentsDerivative financial instruments are financial contracts that derive their value from underlying changes in assets, rates or indices. Derivatives are used to protect or hedge changes in prices or interest rate movements that could adversely affect the value of certain assets or liabilities and future cash flows.
Navy Federal accounts for its derivative financial instruments in accordance with ASC 815, Derivatives and Hedging, which requires all derivative instruments to be carried at fair value in the Consolidated Statements of Financial Condition. Navy Federal executes certain derivative contracts over-the-counter and clears these transactions through a derivative clearing organization (DCO). Some of Navy Federal’s derivatives are subject to legally enforceable master netting agreements, which allow Navy Federal to settle positive and negative positions and offset cash collateral held with the same counterparty on a net basis. Navy Federal does not utilize a net presentation for derivative instruments in its Consolidated Statements of Financial Condition. See Note 9: Derivative Instruments and Hedging Activities for details.
Economic HedgesNavy Federal enters into mortgage loan commitments, also called interest rate lock commitments (IRLCs), in connection with its mortgage banking activities to fund residential mortgage loans at specified times in the future. The IRLCs that relate to mortgage loans Navy Federal intends to sell are considered derivative instruments under applicable accounting guidance. IRLCs expose Navy Federal to the risk that the price of the loans underlying the commitments may decline between the inception of the rate lock and the funding date of the loan. Navy Federal is exposed to further price risk after the funding date up to the time the mortgage loan is sold. To protect against price risk, Navy Federal utilizes forward sales contracts. The IRLCs, forward sales contracts and mortgage loans Navy Federal intends to sell are recorded at fair value with changes in fair value included in Net gain on mortgage loans in the Consolidated Statements of Income.
Accounting HedgesUnder the provisions of ASC 815, Derivatives and Hedging, derivative instruments can be designated as fair value hedges or cash flow hedges.
Fair value hedges are used to protect against changes in the fair value of assets and liabilities that are attributable to interest rate volatility. Navy Federal uses interest rate swaps as fair value hedges against the value of its fixed-rate AFS securities.
Cash flow hedges are used primarily to minimize the variability in cash flows of assets or liabilities or forecasted transactions caused by interest rate fluctuations. Navy Federal uses interest rate swaps to hedge against the variability in cash flows of its floating-rate debt payments and forecasted replacement debt.

Navy Federal Credit Union12Financial Section 13
2016—Supporting Financial Achievement
At the inception of hedge relationships, Navy Federal formally documents the hedged item, the particular risk management objective, the nature of the risk being hedged, the derivative being used, how effectiveness of the hedge will be assessed and how ineffectiveness of the hedge will be measured. Navy Federal primarily uses regression analysis at the inception of a hedge and for each reporting period thereafter to assess whether the derivative used in a hedging transaction is expected to be, and has been, highly effective in offsetting changes in the fair value or cash flows of a hedged item.
Navy Federal discontinues hedge accounting when it is determined the derivative is not expected to be or has ceased to be highly effective as a hedge; the derivative expires or is sold, terminated or exercised; the derivative is de-designated; or for a cash flow hedge, it is no longer probable that the forecasted transaction will occur by the end of the originally specified time frame. Subsequent to discontinuing a fair value or cash flow hedge, the derivative will continue to be recorded on the balance sheet at fair value, with changes in fair value included in earnings. For a discontinued fair value hedge, the previously hedged item is no longer adjusted for changes in fair value. For a discontinued cash flow hedge that is discontinued because the forecasted transaction is no longer probable to occur, the previously unrealized gain or loss in AOCI is recognized in earnings immediately; otherwise, for the other discontinuing type events, the unrealized gain or loss continues to be deferred in AOCI until the forecasted transaction affects earnings. Navy Federal did not discontinue hedge accounting for any hedges in either 2016 or 2015.
All derivative financial instruments are recognized at fair value and classified as Other assets or Other liabilities in the Consolidated Statements of Financial Condition. See Note 9: Derivative Instruments and Hedging Activities for details.
Pension Accounting and Retirement Benefit PlansNavy Federal has a defined benefit pension plan, 401(k) defined contribution and 457(b) savings plans, and a non-qualified supplemental retirement plan. Navy Federal also provides a postretirement medical plan for certain retired employees. Navy Federal accounts for its defined benefit pension plans in accordance with ASC 715, Compensation—Retirement Benefits. See Note 17: Retirement Benefit Plans for details.
Advertising CostsAdvertising costs are expensed as incurred and are included in the Marketing expense in the Consolidated Statements of Income.
Income TaxesPursuant to the Federal Credit Union Act, Navy Federal is exempt from the payment of federal and state income taxes. NFFG is a limited liability corporation and thus an entity “disregarded for federal tax purposes” under an Internal Revenue Service revenue ruling.
DividendsDividend rates on deposit accounts are set by Navy Federal’s Board of Directors, and dividends are charged to expense. Dividends on all share products are paid monthly.
ReclassificationsCertain amounts in the prior year’s financial statements have been reclassified to conform to the current year presentation.
New Accounting PronouncementsIn February 2016, the FASB issued Accounting Standards Update (ASU) 2016-02, Leases (Topic 842), effective for annual reporting periods beginning after December 15, 2019. Under the new guidance, a lessee will be required to recognize assets and liabilities for leases with lease terms of more than 12 months. Consistent with current GAAP, the recognition, measurement and presentation of expenses and cash flows arising from a lease by a lessee primarily will depend on its classification as a finance or operating lease. However, unlike current GAAP, which requires only capital leases to be recognized on the balance sheet, the new ASU will require both types of leases to be recognized on the balance sheet. The ASU will also require disclosures to help financial statement users better understand the amount, timing and uncertainty of cash flows arising from leases. These disclosures include qualitative and quantitative requirements providing additional information about the amounts recorded in the financial statements. This ASU is not expected to materially impact Navy Federal’s consolidated financial statements.
In January 2016, the FASB issued ASU 2016-01, Financial Instruments-Overall (Subtopic 825-10): Recognition and Measurement of Financial Assets and Financial Liabilities, effective for annual reporting periods beginning after December 15, 2018. This ASU requires equity investments (except those accounted for under the equity method of accounting or those that result in consolidation of the investee) to be measured at fair value with changes in fair value recognized in net income. However, an entity may choose to measure equity investments that do not have readily determinable fair values at cost minus impairment, if any, plus or minus changes resulting from observable price changes in orderly transactions for the identical or a similar investment of the same issuer. This ASU is not expected to materially impact Navy Federal’s consolidated financial statements.
In May 2014, the FASB issued ASU 2014-09, Revenue from Contracts with Customers (Topic 606), which requires an entity to recognize revenue to depict the transfer of promised goods or services to customers in an amount that reflects the consideration to which the company expects to be entitled in exchange for those goods or services. The guidance should be applied either retrospectively to each prior reporting period presented or retrospectively with the cumulative effect of initially applying this guidance recognized at the date of initial application. The ASU is effective for the annual reporting periods beginning after December 15, 2018. Navy Federal is currently assessing the impact on its consolidated financial statements.
In June 2016, the FASB issued ASU 2016-13, Financial Instruments-Credit Losses, effective for annual reporting periods beginning after December 15, 2020. This ASU replaces the incurred loss impairment methodology in current GAAP with methodology that reflects lifetime expected credit losses and requires consideration of a broader range of reasonable and supportable information to inform credit loss estimates. While it is expected that the adoption of this ASU will increase the provision for credit losses, Navy Federal is currently assessing the full impact on its consolidated financial statements.
Note 2: Restrictions on Cash
Navy Federal has $23.0 million in restricted cash as of December 31, 2016, related to restitution to members as a result of a regulatory action. Navy Federal’s wholly owned entity, NFFG, had $0 and $2.6 million in restricted cash at December 31, 2016 and 2015, respectively. Restricted cash amounts are included in Other assets in the Consolidated Statements of Financial Condition.

Navy Federal Credit Union14Financial Section 15
2016—Supporting Financial Achievement
Note 3: Investments
Navy Federal’s HTM and AFS securities as of December 31, 2016 and 2015 were as follows:
(dollars in thousands) December 31, 2016
Amortized Cost
Gross Unrealized Gains
Gross Unrealized (Losses)
Fair Value
Held-to-maturity securities
U.S. government and federal agency securities $ 307,740 $ 1,666 $ — $ 309,406
Residential mortgage-backed securities 4,144 13 (1) 4,156
Total held-to-maturity securities 311,884 1,679 (1) 313,562
Available-for-sale debt securities
U.S. government and federal agency securities 5,174,314 48,007 (140,988) 5,081,333
Residential mortgage-backed securities
Agency 5,323,200 28,767 (66,579) 5,285,388
Non-agency 643,581 659 (15,856) 628,384
Commercial mortgage-backed securities 478,076 1,909 (9,135) 470,850
Bank notes and corporate bonds 1,953,534 11,708 (35,445) 1,929,797
Municipal securities 262,590 3,321 (2,339) 263,572
Non U.S. government securities 153,795 — (8,967) 144,828
Total available-for-sale debt securities 13,989,090 94,371 (279,309) 13,804,152
Available-for-sale equity securities 149,999 7,704 — 157,703
Total available-for-sale securities 14,139,089 102,075 (279,309) 13,961,855
Total securities $ 14,450,973 $ 103,754 $ (279,310) $ 14,275,417
(dollars in thousands) December 31, 2015
Amortized Cost
Gross Unrealized Gains
Gross Unrealized (Losses)
Fair Value
Held-to-maturity securities
U.S. government and federal agency securities $ 307,808 $ 1,235 $ (232) $ 308,811
Residential mortgage-backed securities 6,819 26 — 6,845
Total held-to-maturity securities 314,627 1,261 (232) 315,656
Available-for-sale debt securities
U.S. government and federal agency securities 4,923,422 79,376 (37,316) 4,965,482
Residential mortgage-backed securities
Agency 5,543,216 39,642 (53,103) 5,529,755
Non-agency 782,073 674 (21,182) 761,565
Commercial mortgage-backed securities 288,739 185 (3,604) 285,320
Bank notes and corporate bonds 1,952,958 11,021 (5,634) 1,958,345
Municipal securities 263,924 1,798 (3,556) 262,166
Total available-for-sale debt securities 13,754,332 132,696 (124,395) 13,762,633
Available-for-sale equity securities 99,999 — (2,716) 97,283
Total available-for-sale securities 13,854,331 132,696 (127,111) 13,859,916
Total securities $ 14,168,958 $ 133,957 $ (127,343) $ 14,175,572
Navy Federal sold $2.4 billion and $1.5 billion of AFS securities during the years ended December 31, 2016 and 2015, respectively. Gross proceeds from those sales totaled $2.4 billion and $1.5 billion for the years ended December 31, 2016 and 2015, respectively. Gross realized gains of $39.9 million and gross realized losses of $1.9 million were included in earnings for the year ended December 31, 2016. Gross realized gains of $30.4 million and gross realized losses of $4.7 million were included in earnings for the year ended December 31, 2015.
The contractual maturities of Navy Federal’s HTM and AFS debt securities as of December 31, 2016 and 2015 were as follows:
(dollars in thousands)
December 31, 2016
Amortized Cost Fair Value
Held-to-maturity securities
Due in one year or less $ 7,710 $ 7,725
Due after one year through five years 301,155 302,809
Due after five years through ten years 2,216 2,224
Due after ten years 803 804
Total held-to-maturity securities 311,884 313,562
Available-for-sale debt securities
Due in one year or less 1,127,478 1,136,522
Due after one year through five years 1,533,939 1,553,232
Due after five years through ten years 4,134,974 4,046,018
Due after ten years 7,192,699 7,068,380
Total available-for-sale debt securities 13,989,090 13,804,152
Total debt securities $ 14,300,974 $ 14,117,714
(dollars in thousands)
December 31, 2015
Amortized Cost Fair Value
Held-to-maturity securities
Due in one year or less $ — $ —
Due after one year through five years 260,562 261,233
Due after five years through ten years 52,805 53,160
Due after ten years 1,260 1,263
Total held-to-maturity securities 314,627 315,656
Available-for-sale debt securities
Due in one year or less 810,779 814,789
Due after one year through five years 2,800,415 2,847,818
Due after five years through ten years 3,164,925 3,177,030
Due after ten years 6,978,213 6,922,996
Total available-for-sale debt securities 13,754,332 13,762,633
Total debt securities $ 14,068,959 $ 14,078,289

Navy Federal Credit Union16Financial Section 17
2016—Supporting Financial Achievement
Navy Federal held $588.6 million and $642.8 million of stock in the Federal Home Loan Bank (FHLB) of Atlanta as of December 31, 2016 and 2015, respectively. FHLB stock is a restricted investment carried at cost and evaluated for impairment. As a member of the FHLB system, Navy Federal has access to a $19.5 billion line of credit.
All securities in an unrealized loss position were reviewed individually to determine whether those losses were caused by an other-than-temporary decline in fair value. Navy Federal makes a determination of whether unrealized losses are other-than-temporary based on the following factors: whether Navy Federal intends to sell or hold the security until its costs can be recovered, the nature of the security, the portion of unrealized losses that are attributable to credit losses and the financial condition of the issuer of the security. Navy Federal does not intend to sell nor would Navy Federal be, more likely than not, required to sell these securities before recovering its amortized cost basis. The unrealized losses associated with these investments are not a result of a change in the credit quality of the issuer; rather, the losses are reflective of changing market interest rates. Therefore, Navy Federal expects to recover the entire cost basis of these securities.
Navy Federal held 247 and 183 AFS securities in an unrealized loss position at December 31, 2016 and 2015, respectively. Navy Federal held two HTM securities and one HTM security in an unrealized loss position at December 31, 2016 and December 31, 2015, respectively. The following tables present these investments at fair value and their associated gross unrealized losses broken down by the amount of time the investments have been in a loss position:
(dollars in thousands) December 31, 2016
Less than 12 months 12 months or longer Total
Fair Value
Gross Unrealized
(Losses)
Fair Value
Gross Unrealized
(Losses)
Fair Value
Gross Unrealized
(Losses)
Held-to-maturity securities
Residential mortgage-backed securities $ 529 $ (1) $ — $ — $ 529 $ (1)
Total held-to-maturity securities 529 (1) — — 529 (1)
Available-for-sale debt securities
U.S. government and federal agency securities 2,774,488 (140,988) 1 — 2,774,489 (140,988)
Residential mortgage-backed securities
Agency 3,354,606 (60,167) 221,243 (6,412) 3,575,849 (66,579)
Non-agency 325,081 (6,319) 202,862 (9,537) 527,943 (15,856)
Commercial mortgage-backed securities 239,739 (9,135) — — 239,739 (9,135)
Bank notes and corporate bonds 1,165,825 (35,303) 49,859 (142) 1,215,684 (35,445)
Municipal securities 117,171 (2,339) — — 117,171 (2,339)
Non U.S. government securities 144,829 (8,967) — — 144,829 (8,967)
Total available-for-sale debt securities 8,121,739 (263,218) 473,965 (16,091) 8,595,704 (279,309)
Available-for-sale equity securities — — — — — —
Total available-for-sale securities 8,121,739 (263,218) 473,965 (16,091) 8,595,704 (279,309)
Total securities $ 8,122,268 $ (263,219) $ 473,965 $ (16,091) $ 8,596,233 $ (279,310)
(dollars in thousands) December 31, 2015
Less than 12 months 12 months or longer Total
Fair Value
Gross Unrealized
(Losses)
Fair Value
Gross Unrealized
(Losses)
Fair Value
Gross Unrealized
(Losses)
Held-to-maturity securities
U.S. government and federal agency securities $ 100,285 $ (232) $ — $ — $ 100,285 $ (232)
Total held-to-maturity securities 100,285 (232) — — 100,285 (232)
Available-for-sale debt securities
U.S. government and federal agency securities 1,682,199 (37,316) — — 1,682,199 (37,316)
Residential mortgage-backed securities
Agency 2,421,966 (27,772) 834,960 (25,331) 3,256,926 (53,103)
Non-agency 537,916 (8,774) 178,687 (12,408) 716,603 (21,182)
Commercial mortgage-backed securities 251,535 (3,604) — — 251,535 (3,604)
Bank notes and corporate bonds 659,628 (4,478) 98,742 (1,156) 758,370 (5,634)
Municipal securities 107,474 (2,845) 19,486 (711) 126,960 (3,556)
Total available-for-sale debt securities 5,660,718 (84,789) 1,131,875 (39,606) 6,792,593 (124,395)
Available-for-sale equity securities 97,283 (2,716) — — 97,283 (2,716)
Total available-for-sale securities 5,758,001 (87,505) 1,131,875 (39,606) 6,889,876 (127,111)
Total securities $ 5,858,286 $ (87,737) $ 1,131,875 $ (39,606) $ 6,990,161 $ (127,343)
During the years ended December 31, 2016 and 2015, there were no declines in the fair value of securities held by Navy Federal that were considered other-than-temporary.
As of December 31, 2016 and 2015, Navy Federal had $0.3 billion and $0.7 billion, respectively, in AFS investments pledged as collateral for borrowed funds under repurchase agreements. See Note 16: Borrowed Funds for associated liability.

Navy Federal Credit Union18Financial Section 19
2016—Supporting Financial Achievement
Note 4: Loans and Allowance for Loan and Lease Losses
The Navy Federal loan portfolio consists of consumer, credit card and real estate loans. Consumer loans consist of auto loans, signature loans, checking lines of credit and education loans. Real estate loans consist of mortgage and equity loans. The composition of loans by portfolio and delinquency status of Navy Federal’s loans to members as of December 31, 2016 and 2015 was as follows:
(dollars in thousands)
December 31, 2016
Current1 to < 2 Months
Delinquent
2 to < 6 Months
Delinquent
>= 6 Months
Delinquent
Total Delinquent
Loans
Amortized Cost/
(Deferred Income)
Total Loans
Consumer loans $ 16,385,581 $ 197,516 $ 233,345 $ 2,971 $ 433,832 $ 28,624 $ 16,848,037
Credit card loans 12,171,287 121,199 206,930 110 328,239 1,776 12,501,302
Mortgage loans 26,915,677 171,002 98,234 56,425 325,661 (162,298) 27,079,040
Equity loans 2,347,646 28,136 14,872 9,472 52,480 11,444 2,411,570
Total loans to members $ 57,820,191 $ 517,853 $ 553,381 $ 68,978 $ 1,140,212 $ (120,454) $ 58,839,949
(dollars in thousands)
December 31, 2015
Current1 to < 2 Months
Delinquent
2 to < 6 Months
Delinquent
>= 6 Months
Delinquent
Total Delinquent
Loans
Amortized Cost/
(Deferred Income)
Total Loans
Consumer loans $ 15,359,538 $ 159,793 $ 203,789 $ 3,355 $ 366,937 $ 21,920 $ 15,748,395
Credit card loans 10,509,044 93,433 157,931 38 251,402 486 10,760,932
Mortgage loans 24,270,556 125,985 61,183 49,069 236,237 (139,545) 24,367,248
Equity loans 2,349,495 29,210 14,928 13,099 57,237 8,175 2,414,907
Total loans to members $ 52,488,633 $ 408,421 $ 437,831 $ 65,561 $ 911,813 $ (108,964) $ 53,291,482
Credit QualityNavy Federal closely monitors the credit quality of its loan portfolio based on economic conditions, loan performance trends, and certain risk attributes, and utilizes such information to evaluate the appropriateness of the allowance for credit losses. Credit quality indicators are obtained and updated quarterly. The following tables present credit quality indicators by loan product type: consumer loans, credit card loans, mortgage loans and equity loans.
The risk in our consumer lending portfolio correlates to broad trends in the economic environment. Additionally, Navy Federal monitors the performance of the consumer loans portfolio by evaluating borrowers’ risk attributes. Navy Federal uses collateral type and the most recent FICO score as indicators of credit quality for consumer loans, which consisted of the following as of December 31, 2016 and 2015:
(dollars in thousands)
December 31, 2016
FICO Score
Collateral Type Less than 610 Greater than or equal to 610 Total(1)
Auto $ 2,716,122 $ 8,824,136 $ 11,540,258
Unsecured 864,389 2,566,745 3,431,134
Other collateral 242,432 688,379 930,811
Total $ 3,822,943 $ 12,079,260 $ 15,902,203 (1)Excludes fair value adjustments associated with the ACI portfolio (See Note 5) of $1.5 million, deferred costs of $28.6 million,other adjustments of $(7.2) million, business loans of $46.6 million, checking line of credit of $438.1 million, pre-approved consumer loans of $13.2 million, overdrawn member accounts of $41.3 million and education loans of $384.0 million.
(dollars in thousands)
December 31, 2015
FICO Score
Collateral Type Less than 610 Greater than or equal to 610 Total(1)
Auto $ 2,612,327 $ 8,343,467 $ 10,955,794
Unsecured 790,354 2,307,519 3,097,873
Other collateral 236,942 630,898 867,840
Total $ 3,639,623 $ 11,281,884 $ 14,921,507 (1)Excludes fair value adjustments associated with the ACI portfolio (See Note 5) of $1.6 million, deferred costs of $21.9 million, other adjustments of $(7.7) million, business loans of $44.5 million, checking line of credit of $399.8 million, pre-approved consumer loans of $12.7 million, overdrawn member accounts of $32.7 million and education loans of $321.6 million.
Similar to consumer loans, the risk in the credit card portfolio correlates to broad trends in the economic environment. Additionally, Navy Federal monitors performance of the credit card portfolio by several different attributes. Navy Federal uses delinquency status and FICO score as indicators of credit quality for credit card loans, which consisted of the following as of December 31, 2016 and 2015:
(dollars in thousands)
December 31, 2016
FICO Score
Delinquency Status Less than 610 Greater than or equal to 610 Total(1)
<=60 days $ 2,280,472 $ 10,007,738 $ 12,288,210
>60 days 203,373 8,064 211,437
Total $ 2,483,845 $ 10,015,802 $ 12,499,647 (1)Excludes deferred cost of $1.8 million and other adjustment of $(0.1) million.
(dollars in thousands)
December 31, 2015
FICO Score
Delinquency Status Less than 610 Greater than or equal to 610 Total(1)
<=60 days $ 1,945,912 $ 8,652,473 $ 10,598,385
>60 days 155,311 6,972 162,283
Total $ 2,101,223 $ 8,659,445 $ 10,760,668 (1)Excludes deferred cost of $0.5 million and other adjustment of $(0.2) million.

Navy Federal Credit Union20Financial Section 21
2016—Supporting Financial Achievement
Navy Federal monitors a number of credit quality and risk indicators that may affect the default experience on the mortgage loans portfolio, such as changes in home prices in various geographic locations. Navy Federal also closely monitors mortgage loan performance by various loan attributes such as vintage, product and property type. Navy Federal uses estimated current loan-to-value (LTV) ratios and FICO score as indicators of credit quality for mortgage loans held for investment, which consisted of the following as of December 31, 2016 and 2015:
(dollars in thousands)
December 31, 2016
FICO Score
Estimated Current LTV Less than 610 Greater than or equal to 610 Total(1)
<80% $ 323,586 $ 14,014,569 $ 14,338,155
80%-100% 619,274 11,050,197 11,669,471
100+% 40,580 850,417 890,997
LTV not available(2) 277,180 53,098 330,278
Total $ 1,260,620 $ 25,968,281 $ 27,228,901 (1)Excludes fair value adjustments associated with the ACI portfolio (See Note 5) of $(8.5) million, deferred income, net of $(162.3) million, other adjustments of $(12.1) million and loans in process of $33.0 million.
(2)For this category, 79% of the loan balances are associated with purchased participation loans and acquired loans.
(dollars in thousands)
December 31, 2015
FICO Score
Estimated Current LTV Less than 610 Greater than or equal to 610 Total(1)
<80% $ 525,132 $ 11,681,949 $ 12,207,081
80%–100% 547,472 10,114,872 10,662,344
100+% 84,699 1,272,426 1,357,125
LTV not available(2) 214,914 61,493 276,407
Total $ 1,372,217 $ 23,130,740 $ 24,502,957 (1)Excludes fair value adjustments associated with the ACI portfolio (See Note 5) of $(9.9) million, deferred income, net of $(139.5) million, other adjustments of $(15.0) million and loans in process of $28.7 million.
(2)For this category, 75% of the loan balances are associated with purchased participation loans and acquired loans.
Navy Federal monitors a number of credit quality and risk indicators that may affect the default experience on the equity loans portfolio, such as changes in home prices in various geographic locations. Navy Federal also closely monitors equity loan performance by various loan attributes such as vintage, product type and property type. Navy Federal uses delinquency status and FICO score as indicators of credit quality for equity loans, which consisted of the following as of December 31, 2016 and 2015:
(dollars in thousands)
December 31, 2016
FICO Score
Delinquency Status Less than 610 Greater than or equal to 610 Total(1)
Performing $ 150,154 $ 2,235,671 $ 2,385,825
60+ days & foreclosure 18,980 6,653 25,633
Total $ 169,134 $ 2,242,324 $ 2,411,458 (1)Excludes fair value adjustments associated with the ACI portfolio (See Note 5) of $(3.4) million, deferred costs of $11.4 million, other adjustments of $(8.8) million and loans in process of $0.9 million.
(dollars in thousands)
December 31, 2015
FICO Score
Delinquency Status Less than 610 Greater than or equal to 610 Total(1)
Performing $ 210,524 $ 2,173,836 $ 2,384,360
60+ days & foreclosure 19,302 9,162 28,464
Total $ 229,826 $ 2,182,998 $ 2,412,824 (1)Excludes fair value adjustments associated with the ACI portfolio (See Note 5) of $(3.4) million, deferred costs of $8.2 million, other adjustments of $(3.1) million and loans in process of $0.4 million.
Allowance for Loan and Lease Losses Changes in the allowance for loan and lease losses during the years ended December 31, 2016 and 2015 were as follows:
(dollars in thousands) December 31, 2016Allowance for credit losses: Consumer Credit Cards Real Estate Total
Balance, beginning of year $ 428,624 $ 440,876 $ 96,479 $ 965,979
Provision expense 454,567 593,761 13,412 1,061,740
Loans charged off (492,801) (476,238) (28,539) (997,578)
Recoveries 67,866 27,189 8,210 103,265
Net change in allowance for unfunded commitments (41) (7,641) — (7,682)
Balance, end of year $ 458,215 $ 577,947 $ 89,562 $ 1,125,724
Ending balance: loans individually evaluated for impairment
$ 98,069 $ 96,602 $ 73,133 $ 267,804
Ending balance: loans collectively evaluated for impairment $ 357,580 $ 481,345 $ 14,304 $ 853,229
Ending balance: loans acquired with deteriorated credit quality $ 2,566 $ — $ 2,125 $ 4,691
Loan amount (excluding allowance):
Ending balance: loans individually evaluated for impairment
$ 537,950 $ 318,391 $ 887,675 $ 1,744,016
Ending balance: loans collectively evaluated for impairment $ 16,305,272 $ 12,182,911 $ 28,584,197 $ 57,072,380
Ending balance: loans acquired with deteriorated credit quality $ 4,815 $ — $ 18,738 $ 23,553

Navy Federal Credit Union22Financial Section 23
2016—Supporting Financial Achievement
(dollars in thousands) December 31, 2015Allowance for credit losses: Consumer Credit Cards Real Estate Total
Balance, beginning of year $ 297,632 $ 335,343 $ 119,860 $ 752,835
Provision expense 471,271 463,288 5,557 940,116
Loans charged off (389,400) (374,974) (34,448) (798,822)
Recoveries 50,141 20,790 5,510 76,441
Net change in allowance for unfunded commitments (1,020) (3,571) — (4,591)
Balance, end of year $ 428,624 $ 440,876 $ 96,479 $ 965,979
Ending balance: loans individually evaluated for impairment
$ 71,675 $ 62,994 $ 76,184 $ 210,853
Ending balance: loans collectively evaluated for impairment $ 354,199 $ 377,883 $ 17,584 $ 749,666
Ending balance: loans acquired with deteriorated credit quality $ 2,749 $ — $ 2,711 $ 5,460
Loan amount (excluding allowance):
Ending balance: loans individually evaluated for impairment
$ 456,863 $ 286,212 $ 757,898 $ 1,500,973
Ending balance: loans collectively evaluated for impairment $ 15,285,760 $ 10,474,720 $ 26,000,379 $ 51,760,859
Ending balance: loans acquired with deteriorated credit quality $ 5,772 $ — $ 23,878 $ 29,650
The net change in the allowance for unfunded commitments was as follows:
(dollars in thousands) 2016 2015
Balance, beginning of period $ 21,494 $ 16,903
Net change in allowance for unfunded commitments 7,682 4,591
Balance, end of period $ 29,176 $ 21,494
Non-performing Loans When payments of principal or interest are past due by 90 days or more, Navy Federal discontinues the accrual of interest on those loans and reverses the previously recognized interest. Interest income is recorded on cash basis until the loan returns to accrual status. Loans are returned to accrual status when all the principal and interest amounts contractually due are brought current. The UPB of loans on non-accrual status by portfolio type as of December 31, 2016 and 2015 were as follows:
(dollars in thousands) 2016 2015
Consumer $ 148,269 $ 136,153
Credit card 141,260 107,866
Real estate 125,306 105,088
Total $ 414,835 $ 349,107
Troubled Debt Restructurings TDRs are individually evaluated for impairment beginning in the month of restructuring. Impairment is measured as the difference between the net carrying amount of the loan (less any fees received to affect the restructuring) and the modified future expected cash flows discounted at the loan’s effective interest rate. Loans that have been discharged in Chapter 7 bankruptcy are classified as TDRs. Non-performing Chapter 7 bankruptcy TDRs are measured for impairment based on the value of the underlying collateral.
The following tables summarize the financial impact, by concession type, of loans that became TDRs during the years ended December 31, 2016 and 2015:
(dollars in thousands)
Troubled Debt Restructurings During the Year Ended December 31, 2016(1)
(1)Excludes loans that were classified as TDRs in prior years and re-modified during the year.
Interest Rate Reduction & Term
Extension
Interest Rate Reduction Term Extension Other(2) Total
Consumer $ 6,422 $ 10,693 $ 22,917 $ 4,965 $ 44,997
Credit card — 53,697 — 3,667 57,364
Real estate 6,027 74 1,287 2,410 9,798
Total $ 12,449 $ 64,464 $ 24,204 $ 11,042 $ 112,159
(2)Includes TDR loans resulting from actions taken by a bankruptcy court, such as the reduction of the loan’s contractual principal or interest, or where the borrower has been released from personal liability, and mortgage deferrals.
(dollars in thousands)
Troubled Debt Restructurings During the Year Ended December 31, 2015(1)
(1)Excludes loans that were classified as TDRs in prior years and re-modified during the year.
Interest Rate Reduction & Term
Extension
Interest Rate Reduction Term Extension Other(2) Total
Consumer $ 4,376 $ 6,465 $ 12,385 $ 2,717 $ 25,944
Credit card — 32,518 — 14 32,532
Real estate 5,327 464 1,539 4,547 11,877
Total $ 9,703 $ 39,447 $ 13,924 $ 7,278 $ 70,353
(2)Includes TDR loans resulting from actions taken by a bankruptcy court, such as the reduction of the loan’s contractual principal or interest, or where the borrower has been released from personal liability, and mortgage deferrals.
In subsequent periods, income is recognized based on a loan’s modified expected cash flows and revised effective interest rate. Additional impairment is recognized for TDRs that exhibit further credit deterioration after modification.
For the year ended December 31, 2016, TDRs that were more than 90 days delinquent within the first 12 months after modification totaled $139.1 million, which included $68.2 million of consumer loans, $46.6 million of credit card loans and $24.3 million of real estate loans.
For the year ended December 31, 2015, TDRs that were more than 90 days delinquent within the first 12 months after modification totaled $123.6 million, which included $60.6 million of consumer loans, $44.3 million of credit card loans and $18.7 million of real estate loans.

Navy Federal Credit Union24Financial Section 25
2016—Supporting Financial Achievement
At December 31, 2016 and 2015, there were no unfunded commitments related to loans that had previously been modified as TDRs.
Impaired LoansLoans defined as individually impaired include business real estate loans and TDR loans. The following table represents information about our impaired loans as of, and for, the years ended December 31, 2016 and 2015:
(dollars in thousands)
December 31, 2016
Loan Amount
Associated Allowance
Average Balance
Interest Income (accrual basis)
Interest Income (cash basis)
Impaired loans with an associated allowance
Consumer $ 535,417 $ 98,069 $ 495,780 $ 39,447 $ 41,255
Credit card 308,380 96,602 296,518 23,606 25,522
Real estate 542,976 73,071 517,068 18,972 19,798
Business real estate 8,289 62 6,952 42 169
Total impaired loans with an associated allowance $ 1,395,062 $ 267,804 $ 1,316,318 $ 82,067 $ 86,744
Impaired loans without an associated allowance
Consumer $ 2,534 $ — $ 1,627 $ 207 $ 274
Credit card 10,011 — 5,784 1,371 1,458
Real estate 80,705 — 69,793 2,111 2,676
Business real estate 255,704 — 228,974 8,559 8,368
Total impaired loans without an associated allowance $ 348,954 $ — $ 306,178 $ 12,248 $ 12,776
Total impaired loans $ 1,744,016 $ 267,804 $ 1,622,496 $ 94,315 $ 99,520
(dollars in thousands)
December 31, 2015
Loan Amount
Associated Allowance
Average Balance
Interest Income (accrual basis)
Interest Income (cash basis)
Impaired loans with an associated allowance
Consumer $ 456,143 $ 71,675 $ 429,397 $ 45,724 $ 43,974
Credit card 284,656 62,994 271,226 24,196 28,851
Real estate 491,160 76,056 524,193 19,968 19,988
Business real estate 5,615 127 3,083 14 271
Total impaired loans with an associated allowance $ 1,237,574 $ 210,853 $ 1,227,899 $ 89,902 $ 93,084
Impaired loans without an associated allowance
Consumer $ 720 $ — $ 1,282 $ 490 $ 684
Credit card 1,556 — 1,691 239 262
Real estate 58,880 — 33,839 2,301 2,695
Business real estate 202,244 — 170,575 7,941 7,453
Total impaired loans without an associated allowance $ 263,400 $ — $ 207,386 $ 10,971 $ 11,094
Total impaired loans $ 1,500,973 $ 210,853 $ 1,435,285 $ 100,873 $ 104,178
Note 5: Acquired Credit-Impaired Loans
The carrying value of Navy Federal’s acquired credit-impaired (ACI) loans is included in Loans to members in the Consolidated Statements of Financial Condition, and the related outstanding balances as of December 31 were as follows:
(dollars in thousands) 2016 2015
Outstanding balance $ 46,382 $ 51,018
Carrying amount 18,861 24,190
For the years ended December 31, 2016 and 2015, Navy Federal recorded provision expense of $0.1 million and $0.7 million, respectively, due to decreases in cash flows expected to be received on ACI loans, which resulted in an increase in allowance for loan losses.
During 2016 and 2015, previously established allowances were reduced by $0.9 million and $1.7 million, respectively, because either cash flows received were significantly greater than previously expected or it was probable there would be a significant increase in expected cash flows.
Accretable yield activity for ACI loans for the years ended December 31, 2016 and 2015 was as follows:
(dollars in thousands)
Accretable Yield
2016 2015
Balance, beginning of period $ 15,834 $ 17,444
Accretion (2,457) (3,000)
Net reclassification(1) (378) 1,433
Removals 43 (43)
Balance, end of period $ 13,042 $ 15,834 (1)Includes transfers between accretable yield and non-accretable yield.
Note 6: Loan Sales and Continuing Involvement in Assets Transferred
In the normal course of business, Navy Federal originates and transfers qualifying residential mortgage loans in securitization or sales transactions in which we have continuing involvement. Loans are sold to Federal National Mortgage Association (FNMA) and Federal Home Loan Mortgage Corporation (FHLMC), who generally securitize the loans into mortgage-backed securities that are sold to third-party investors in the secondary market or retained by Navy Federal for investment purposes. Navy Federal, as an authorized Government National Mortgage Association (GNMA) issuer/servicer, pools qualifying Federal Housing Administration (FHA) and Department of Veterans Affairs (VA) insured loans into mortgage-backed securities that are either sold to third-party investors in the secondary market or retained by Navy Federal for investment purposes. Navy Federal may also sell loans that were previously retained for investment to private third-party investors.
Navy Federal originated $12.7 billion and $12.3 billion, and sold/securitized $5.8 billion and $5.0 billion, of first mortgage loans during the years ended December 31, 2016 and 2015, respectively.
During the year ended December 31, 2016, Navy Federal reclassified $21.4 million of mortgage loans from held for investment to MLAS. The loans were transferred to MLAS at fair value and were subsequently measured at fair value until the loans were sold as part of a whole loan sale to private

Navy Federal Credit Union26Financial Section 27
2016—Supporting Financial Achievement
investors for cash proceeds of $21.8 million and an MSR of $0.1 million. During the year ended December 31, 2015, Navy Federal reclassified $35.9 million of mortgage loans from held for investment to MLAS. The loans were transferred to MLAS at fair value and were subsequently measured at fair value until the loans were sold as part of a whole loan sale to private investors for cash proceeds of $36.2 million and an MSR of $0.3 million.
Gains and losses on the sale of MLAS are classified in the Consolidated Statements of Income as Net gain on mortgage loans and totaled $226.2 million and $173.0 million for the years ended December 31, 2016 and 2015, respectively. Navy Federal recorded $3.5 million and $9.7 million of changes in MLAS fair value for the years ended December 31, 2016 and 2015, respectively, which are classified as Net gain on mortgage loans in the Consolidated Statements of Income.
Navy Federal’s continuing involvement in loans transferred includes ongoing servicing, repurchasing previously transferred loans under certain conditions, loss share agreements, holding of mortgage-backed securities issued by securitization and obligations related to standard representations and warranties. Navy Federal may also incur incremental obligations related to various forms of credit enhancements afforded to third-party investors for securities partially backed by the transferred loans.
Servicing: Navy Federal retains mortgage servicing rights on loans transferred in sale transactions and securitizations. Mortgage servicing rights are recognized at fair value on the date of sale or securitization. See Note 7: Mortgage Servicing Rights for details. As of December 31, 2016 and 2015, the amount of loans serviced by Navy Federal for outside investors was $24.7 billion and $22.3 billion, respectively.
Navy Federal earns servicing and other ancillary fees for our role as servicer. Navy Federal’s servicing fees are priced based on parameters set by FNMA, FHLMC and the GNMA. During the years ended December 31, 2016 and 2015, Navy Federal’s servicing revenue was $95.8 million and $84.8 million, respectively, for mortgage loan servicing fees, which is included in Mortgage servicing revenue in the Consolidated Statements of Income. During the years ended December 31, 2016 and 2015, Navy Federal received $1.7 million and $1.5 million, respectively, of late charges and miscellaneous fees, which is included in Fee and other income in the Consolidated Statements of Income.
Navy Federal’s responsibilities as servicer typically include collecting and remitting monthly principal and interest payments, maintaining escrow deposits, performing loss mitigation and foreclosure activities, and in certain instances, funding servicing advances that have not yet been collected from the borrower. Navy Federal recognizes servicing advances that are reimbursable as Accounts receivable and accrued interest in its Consolidated Statements of Financial Condition. Servicing advances as of December 31, 2016 and 2015 were as follows:
(dollars in thousands) 2016 2015
Escrow advances $ 20,455 $ 17,003
Principal and interest advances 737 806
Other advances(1) 4,124 6,323
Total $ 25,316 $ 24,132 (1)Includes recoverable advances related to mortgage defaults, such as bankruptcy attorney fees and foreclosure costs.
The following table provides a summary of the cash flows exchanged between Navy Federal and transferees on all loans transferred during the years ended December 31, 2016 and 2015:
(dollars in thousands) 2016 2015
Cash from sale of mortgage loans and mortgage-backed securities $ 5,951,145 $ 5,145,466
Repurchase of previously transferred loans 16,880 6,599
Contractual servicing fees received 95,796 84,839
The following table provides the outstanding and delinquent loan balances of transferred loans for which Navy Federal retains servicing rights. These amounts are excluded from the Consolidated Statements of Financial Position as they meet the definition of sale under ASC 860-10, Transfers and Servicing.
(dollars in thousands) 2016 2015
Principal balances of loans serviced $ 24,716,509 $ 22,321,616
Delinquent loans(1) 169,128 162,581
(1)Serviced delinquent loans are 60 days or more past due.
Retained investment in GNMA Securities: GNMA securities backed by Navy Federal loans may be retained as investments by Navy Federal and classified as AFS securities. AFS investments are carried at fair value with changes in fair value recognized in AOCI. See Note 3: Investments for details.
In accordance with ASC 860-20, Secured Borrowing and Collateral, the effect of two negative changes in each of the key assumptions used to determine the fair value of Navy Federal’s investment in GNMA securities must be disclosed. The negative effect of each key assumption change must be calculated independently, holding all other assumptions constant. The first table below details the key assumptions used in Navy Federal’s analysis—specifically, constant prepayment rate (CPR), anticipated credit losses and weighted-average life. The second table below details the potential impacts of a 10% and 20% adverse change to the CPR on the fair value of the securities.
GNMA Securities
2016 2015
Weighted-average constant prepayment rate (CPR)(1) 9.2% 9.1%
Anticipated credit losses(2) 0 0
Weighted-average life 5.03 years 5.36 years(1)CPR is based on the average of the CPR for all GNMA securities.
(2)GNMA securities are collateralized by government-insured loans and there is no anticipation of significant credit losses.
GNMA Securities
(dollars in thousands) 2016 2015
Constant prepayment rate
Decline in fair value from 10% adverse change $ 825 $ 1,306
Decline in fair value from 20% adverse change 1,594 2,549

Navy Federal Credit Union28Financial Section 29
2016—Supporting Financial Achievement
The sensitivities in the table above are hypothetical and may not be indicative of actual results. The effect of a variation in a particular assumption on the fair value is calculated independently of changes in other assumptions. Further, changes in fair value based on variations in assumptions generally cannot be extrapolated because the relationship of the change in assumption on the fair value may not be linear.
Fair value of GNMA securities held by Navy Federal was $0.9 billion and $1.2 billion as of December 31, 2016 and 2015, respectively.
GNMA Early Pool Buyback Program: Navy Federal has the option to repurchase pooled loans out of GNMA securities when members fail to make payments for three consecutive months (pursuant to the GNMA Early Pool Buyback Program). Since Navy Federal has the unilateral ability to repurchase these delinquent loans, its effective control over the loans has been regained. Navy Federal recognizes an asset and a corresponding liability regardless of whether it has the actual intent to repurchase the loans. At December 31, 2016 and 2015, unpaid principal balances recognized in MLAS and Other liabilities associated with the Early Pool Buyback Program totaled $68.5 million and $52.5 million, respectively.
Financial Guarantees Related to Recourse Provided in Assets Transferred Representations and Warranties: For mortgage loans transferred in sale transactions or securitizations to FNMA, FHLMC and GNMA, Navy Federal has made representations and warranties that the loans meet their requirements. These requirements typically relate to collateral, underwriting standards, validation of certain borrower representations in connection with the loan and the use of standard legal documentation. In connection with the sale of loans to FNMA, FHLMC and GNMA, Navy Federal may be required to repurchase loans or indemnify the respective entity for losses due to breaches of these representations and warranties.
Navy Federal recognizes a liability for estimated losses related to representations and warranties from the inception of the obligation when the loans are sold. This liability is included in Other liabilities in the Consolidated Statements of Financial Condition. In the Consolidated Statements of Income, the related expense is included as an offset to Net gain on mortgage loans for loans sold during the current period, or in Servicing expense for re-measurement of the liability on loans sold in prior periods. Navy Federal’s estimated representations and warranties liability at December 31, 2016 and 2015 was $32.9 million and $33.2 million, respectively.
Management believes the recognized liability for representations and warranties appropriately reflects the estimated probable losses on indemnification and repurchase claims for all loans sold and outstanding as of December 31, 2016 and 2015. In making these estimates, Navy Federal considers the losses expected to be incurred over the life of the sold loans. While management seeks to obtain all relevant information in estimating this liability, the estimation process is inherently uncertain and imprecise and, accordingly, it is reasonably possible future losses could be more or less than Navy Federal’s established liability. At December 31, 2016, Navy Federal estimates it is reasonably possible it could incur additional losses in excess of its accrued liability of up to approximately $76.8 million.
The total UPB subject to representations and warranties was $24.0 billion and $22.1 billion as of December 31, 2016 and 2015, respectively.
FHLMC Loss-Sharing Agreements: Navy Federal sold mortgage loans to FHLMC under loss-sharing agreements from years 2011 to 2016, whereby Navy Federal must indemnify FHLMC for losses related to loans with higher LTV ratios and no private mortgage insurance that occur during a period of three to four years from the applicable settlement date. The following table summarizes the outstanding balance of loans sold and payments made for losses under these agreements during the years ended December 31, 2016 and 2015:
FHLMC
(dollars in thousands)
Outstanding UPB of Loans Sold to FHLMC
as of 12/31
Maximum Future Exposure Under Loss- Sharing Agreements
Losses Paid to FHLMC During the Year Ended 12/31
Liability for Estimated Losses
as of 12/31
2016 $ 344,998 $ 8,792 $ 9 $ 47
2015 527,765 10,930 140 71
The liability recognized for estimated losses related to these loss-sharing agreements is included in Other liabilities in the Consolidated Statements of Financial Condition. In the Consolidated Statements of Income, the related expense is included as an offset to Net gain on mortgage loans for loans sold during the current period, or in Servicing expenses for any re-measurement of the liability related to loans sold in prior years.
FNMA Loss-Sharing Agreements: Navy Federal sold mortgage loans to FNMA under loss-sharing agreements from years 2006 to 2008, whereby Navy Federal agreed to indemnify FNMA for loans having high LTV ratios through the life of the loans and for losses related to other loans, with higher LTV ratios and no private mortgage insurance, that occur during a period of three years from the applicable settlement date. The following table summarizes the outstanding balance of loans sold and payments made for losses under these agreements during the years ended December 31, 2016 and 2015:
FNMA
(dollars in thousands)
Outstanding UPB of Loans Sold to FNMA
as of 12/31
Maximum Future Exposure Under Loss- Sharing Agreements
Losses Paid to FNMA During the Year Ended 12/31
Liability for Estimated Losses
as of 12/31
2016 $ 714,797 $ 119,675 $ 12,062 $ 35,034
2015 525,138 107,586 14,029 27,277
This liability is included in Other liabilities in the Consolidated Statements of Financial Condition. In the Consolidated Statements of Income, the related expense is included as an offset to Net gain on mortgage loans for loans sold during the current year, or in Servicing expenses for any re-measurement of the liability related to loans sold in prior years.

Navy Federal Credit Union30Financial Section 31
2016—Supporting Financial Achievement
Note 7: Mortgage Servicing Rights
MSRs do not trade in an active, open market with readily observable prices. Navy Federal determines the fair value of its MSRs by discounting projected net servicing cash flows of Navy Federal’s servicing portfolio, taking into consideration actual and expected loan prepayment rates, discount rates, servicing costs and other economic factors. During 2016, Navy Federal transitioned from using an external third-party static valuation to an internally managed stochastic model. The internal model’s underlying assumptions are corroborated by values received from independent third parties and comparisons to market transactions. The fair value of MSRs is primarily affected by changes in mortgage interest rates since rate changes cause the loan prepayment acceleration factors to increase or decrease.
The changes in fair value of MSRs during 2016 and 2015 were as follows:
(dollars in thousands) 2016 2015
Balance, beginning of period $ 270,876 $ 235,801
Additions from loans sold with servicing retained 81,993 63,099
Change in fair value due to:
Payoffs/maturities(1) (35,687) (32,083)
Gain(2) 2,345 4,059
Balance, end of period $ 319,527 $ 270,876 (1)Represents MSR value changes resulting from passage of time, including the impact from scheduled loan principal payments and loans that were paid down or paid off during the period.
(2)Represents MSR value changes resulting primarily from market-driven changes in interest rates.
MSR valuation is sensitive to interest rate and prepayment risk. A sensitivity analysis of the hypothetical effect on the fair value of MSRs to adverse changes in key assumptions is presented below. Changes in fair value generally cannot be extrapolated because the relationship of the change in the assumption to the change in fair value may not be linear. Also, the effect of a variation in a particular assumption on the fair value of the MSRs is calculated independently without changing any other assumptions. Changes in one assumption may affect changes in another, which could either magnify or counteract the sensitivities.
The key economic assumptions used in determining the fair value of MSRs and the sensitivity analysis of the hypothetical effect on the fair value of the MSRs to immediate adverse changes of 10% and 20% in those assumptions at December 31, 2016 and 2015 were as follows:
(dollars in thousands) 2016 2015
Weighted-average life (years) 7.08 6.20
Weighted-average prepayment rate 8.66% 11.56%
Decline in fair value from 10% adverse change $ 9,650 $ 11,258
Decline in fair value from 20% adverse change 18,714 21,755
Weighted-average discount rate (1) N/A 9.86%
Decline in fair value from 10% adverse change N/A $ 9,437
Decline in fair value from 20% adverse change N/A 18,261
Option adjusted spread(1) 10.45% N/A
Decline in fair value from 10% adverse change $ 11,246 N/A
Decline in fair value from 20% adverse change 21,709 N/A
(1)In 2016, Navy Federal transitioned from a third-party static valuation using weighted-average discount rate to an internal stochastic valuation using option adjusted spread.
Note 8: Real Estate Owned
Navy Federal obtains REO through foreclosure proceedings or when a delinquent borrower chooses to transfer a mortgaged property in lieu of foreclosure. REO represents held-for-sale assets carried at lower of cost or fair value less costs to sell. Navy Federal generally expects to dispose of REO held within one year or less, and the holding costs such as insurance, maintenance, taxes and utility costs are expensed as incurred. REO, which we report in our Consolidated Statements of Financial Condition under Other assets, totaled $18.2 million and $19.1 million as of December 31, 2016 and 2015, respectively.
Mortgage loans for which formal foreclosure proceedings were in process amounted to $49.9 million and $38.8 million as of December 31, 2016 and 2015, respectively.
Note 9: Derivative Instruments and Hedging Activities
Navy Federal’s risk management strategies include the use of derivatives as economic hedges and derivatives designated as qualifying accounting hedges. The goal of these strategies is to mitigate market risk so that movements in interest rates do not adversely affect the value of Navy Federal’s assets or liabilities, or its earnings and future cash flows. Navy Federal executes derivative contracts over-the-counter and clears these transactions through a derivative clearing organization (DCO). The following table identifies derivative instruments in a gain position included in Other assets as well as derivative instruments in a loss position included in Other liabilities in the Consolidated Statements of Financial Condition at December 31, 2016 and 2015.
(dollars in thousands)
December 31, 2016 December 31, 2015
Notional or Contractual
Amount
Derivatives at Fair Value Notional or Contractual
Amount
Derivatives at Fair Value
Asset Liability Asset Liability
Derivatives not designated as accounting hedges:
Interest rate lock commitments $ 1,259,969 $ 25,476 $ 609 $ 924,445 $ 18,570 $ 19
Forward sales contracts 1,860,000 10,957 10,659 1,321,000 1,385 688
Total derivatives not designated as accounting hedges
$ 3,119,969 $ 36,433 $ $11,268 $ 2,245,445 $ 19,955 $ 707
Derivatives designated as accounting hedges:
Interest rate contracts:
Fair value interest rate contracts $ 10,000 $ 235 $ — $ 10,000 $ 194 $ —
Cash flow interest rate contracts 950,000 1,169 29,462 950,000 162 40,918
Total derivatives designated as accounting hedges
$ 960,000 $ 1,404 $ 29,462 $ 960,000 $ 356 $ 40,918
Total derivatives $ 4,079,969 $ 37,837 $ 40,730 $ 3,205,445 $ 20,311 $ 41,625

Navy Federal Credit Union32Financial Section 33
2016—Supporting Financial Achievement
The forward sales contracts in the table above settle within a three-month period, and their note rates range between 2% and 3%. Management has the intent and ability to fill the incremental amount of forward sales contracts in excess of open IRLCs. Navy Federal had $1.2 billion and $708.0 million as of December 31, 2016 and 2015, respectively, of mortgage loans classified as MLAS in the Consolidated Statements of Financial Condition to meet these commitments.
Derivatives Accounted For as Economic HedgesNavy Federal is an active participant in the production of mortgage loans that are sold to investors in the secondary market. These loans are classified as MLAS in Navy Federal’s Consolidated Statements of Financial Condition. The value of Navy Federal’s IRLCs is exposed to the risk of adverse changes in interest rates between the time of commitment and the time Navy Federal funds the loan at origination. Navy Federal is also exposed to the risk of adverse changes in value after funding the loan up until the time when the loan is delivered to the investor. To offset this exposure, Navy Federal enters into forward sales contracts to deliver mortgage loans to investors at specified prices in the “To Be Announced” market (TBA securities). These forward sales contracts act as an economic hedge against the risk of changes in the value of both the IRLCs and the funded loans. Navy Federal does not account for these derivatives as qualifying accounting hedges and therefore accounts for them as economic hedges. As required by ASC 815, Derivatives and Hedging, Navy Federal records IRLCs and forward sales contracts as derivative instruments at fair value in its Consolidated Statements of Financial Condition and records changes in the fair value of those derivative instruments in current earnings.
The table below presents gains (losses) on these derivatives for 2016 and 2015. These gains (losses) are largely offset by the income or expense that is recorded on the IRLCs and funded loans in Net gain on mortgage loans in the Consolidated Statements of Income.
Gain/(Loss) Recognized in Income
(dollars in thousands) 2016 2015
Interest Rate Lock Commitments
Gains $ 25,476 $ 18,570
(Losses) (609) (19)
Total $ 24,867 $ 18,551
Forward Sales Contracts
Gains $ 10,957 $ 1,385
(Losses) (10,659) (688)
Total 298 697
Grand Total $ 25,165 $ 19,248
Derivatives Accounted For as Qualifying Accounting HedgesUnder the provisions of ASC 815, Derivatives and Hedging, derivative instruments may be designated as a qualifying fair value or cash flow hedge.
Fair Value Accounting HedgesNavy Federal uses qualifying fair value hedges to protect certain fixed-rate investments against the adverse changes in fair value attributable to changes in interest rates. For derivative instruments that are designated and qualify as a fair value hedge under ASC 815, Derivatives and Hedging, the gain or
loss on the derivative instrument and the gain or loss on the hedged item attributable to the hedged risk are recognized in current earnings. When interest rate fluctuations cause changes in the fair value of fixed-rate investments, the gains or losses on the derivative instruments are expected to be highly effective in providing an offset. Navy Federal includes the unrealized gains or losses on its fair value hedge derivatives with the unrealized gain or loss on the hedged instrument in Fee and other income in the Consolidated Statements of Income.
The table below summarizes gains and losses recognized in earnings related to Navy Federal’s derivatives designated as fair value hedges during the years ended December 31, 2016 and 2015.
(dollars in thousands)
(Loss) Recognized in Income on Derivative
Gain Recognized in Income on Hedged Item
2016 2015 2016 2015
Interest rate contracts $ (51) $ (297) $ 149 $ 354
Navy Federal recognized $2.0 thousand in net losses and $0.5 thousand in net losses, in income representing the ineffectiveness of fair value hedges for the years ended December 31, 2016 and 2015, respectively.
Cash Flow Accounting HedgesNavy Federal funds a portion of its operations with variable rate obligations. Navy Federal uses pay-fixed interest rate swaps to hedge the variability in cash flows related to existing and anticipated replacement funding that reprices based on LIBOR. For derivative instruments that are designated and qualify as cash flow hedges under ASC 815, Derivatives and Hedging, the effective portion of the hedge on the derivative instrument is reported as a component of other comprehensive income and reclassified into earnings in the same period or periods that the hedged transaction affects earnings. The ineffective portion is recognized in current earnings in the Consolidated Statements of Income.
During the next 12 months, net losses in AOCI of approximately $13.5 million on derivative instruments that qualify as cash flow hedges are expected to be reclassified into earnings. The table below summarizes gains and losses recognized in earnings related to Navy Federal’s derivatives designated as cash flow hedges during the years ended December 31, 2016 and 2015.
For open or future cash flow hedges, the maximum length of time over which forecasted transactions are or will be hedged is approximately 10 years.
(dollars in thousands)
(Loss) Recognized in Other
Comprehensive Income
(Loss) Reclassified from Other Comprehensive Income
to Income
Gain/(Loss) Recognized in Income (Ineffective portion)
2016 2015 2016 2015 2016 2015
Interest rate contracts $ (5,713) $ (27,342) $ (18,163) $ (20,170) $ 17 $ (21)
Navy Federal clears its fair value and cash flow hedge interest rate swap trades through a DCO, which requires the initial and ongoing posting of margin collateral. Additional collateral is required for trades either in a net loss or net gain position. These margin requirements significantly reduce Navy Federal’s exposure to counterparty risk. As of December 31, 2016 and 2015, Navy Federal had margin collateral with brokers in the amount of $55.4 million and $65.9 million, respectively.

Navy Federal Credit Union34Financial Section 35
2016—Supporting Financial Achievement
Note 10: Balance Sheet Offsetting
Navy Federal has entered into legally enforceable master netting agreements with various counterparties that govern the purchase, sale, execution, clearing and carrying of its derivatives and repurchase agreements. These agreements, in addition to separate margining provisions that require collateral to be exchanged based on the direction and level of interest rates, reduce Navy Federal’s exposure to counterparty risk. Under the master netting agreements, each of the counterparties and Navy Federal agree to perform all of their respective obligations with respect to all transactions and agree that upon failure to perform any of those obligations, all obligations under all transactions become due and payable. Each party to the master netting agreement has the right to offset what is owed to them by closing out, liquidating or netting any or all open positions, including collateral.
Navy Federal presents its derivative assets and liabilities on a gross basis in its Consolidated Statements of Financial Condition. The following tables disclose the amounts eligible for offset in Navy Federal’s Statements of Financial Condition as of December 31, 2016 and 2015:
(dollars in thousands)
As of December 31, 2016
Gross Amounts
Recognized
Gross Amounts Offset in the Statements of Financial Condition
Net Amounts Presented in
the Statements of Financial Condition
Gross Amounts Not Offset in the Statements of Financial Condition
Net Amount
Financial Instruments(1)
Cash Collateral Pledged/
(Received)(2)
Financial Assets
Interest Rate Lock Commitments $ 25,476 $ — $ 25,476 $ — $ — $ 25,476
Forward Sales Contracts
10,957 — 10,957 (6,464) (4,494) —
Interest Rate Contracts
FV Interest Rate Contracts 235 — 235 — (184) 50
CF Interest Rate Contracts 1,169 — 1,169 (191) (978) —
Total 37,837 — 37,837 (6,655) (5,656) 25,526
Financial Liabilities
Interest Rate Lock Commitments 609 — 609 — — 609
Forward Sales Contracts 10,659 — 10,659 (6,464) — 4,195
Interest Rate Contracts
FV Interest Rate Contracts — — — — — —
CF Interest Rate Contracts 29,462 — 29,462 (191) (29,271) —
Total Derivatives 40,730 — 40,730 (6,655) (29,271) 4,804
Securities sold under repurchase agreements 280,000 — 280,000 (280,000) — —
Total $ 320,730 $ — $ 320,730 $ (286,655) $ (29,271) $ 4,804 (1)Includes offset by same counterparty where legally enforceable under master netting agreement.(2)These amounts are limited to the derivative asset/liability balance and, accordingly, do not include excess collateral received/pledged.
(dollars in thousands)
As of December 31, 2015
Gross Amounts
Recognized
Gross Amounts Offset in the Statements of Financial Condition
Net Amounts Presented in
the Statements of Financial Condition
Gross Amounts Not Offset in the Statements of Financial Condition
Net Amount
Financial Instruments(1)
Cash Collateral Pledged/
(Received)(2)
Financial Assets
Interest Rate Lock Commitments $ 18,570 $ — $ 18,570 $ — $ — $ 18,570
Forward Sales Contracts
1,385 — 1,385 (522) — 863
Interest Rate Contracts
FV Interest Rate Contracts 194 — 194 — — 194
CF Interest Rate Contracts
162 — 162 (162) — —
Total 20,311 — 20,311 (684) — 19,628
Financial Liabilities
Interest Rate Lock Commitments 19 — 19 — — 19
Forward Sales Contracts
688 — 688 (522) — 166
Interest Rate Contracts
FV Interest Rate Contracts — — — — — —
CF Interest Rate Contracts 40,918 — 40,918 (162) (40,279) 477
Total Derivatives 41,625 — 41,625 (684) (40,279) 662
Securities sold under repurchase agreements 719,982 — 719,982 (719,982) — —
Total $ 761,607 $ — $ 761,607 $ (720,666) $ (40,279) $ 662 (1)Includes offset by same counterparty where legally enforceable under master netting agreement.(2)These amounts are limited to the derivative asset/liability balance and, accordingly, do not include excess collateral received/pledged.
Note 11: Contingencies
Navy Federal is party to various legal and regulatory actions normally associated with financial institutions, the aggregate effect of which, in the opinions of management and legal counsel, would not be material to the financial condition or results of operations of Navy Federal.
Note 12: Commitments
In the normal course of business, Navy Federal enters into conditional commitments to extend credit and makes financial guarantees to help meet the financing needs of its members. Unfunded loan commitments are amounts Navy Federal has agreed to lend a member generally as long as the member remains in good standing on existing loans. Commitments generally have fixed expiration dates or other termination clauses. Navy Federal uses the same credit policies in making commitments as it does for all loans to members, and accordingly, at December 31, 2016 and 2015, the potential credit risk related to these commitments could be similar to existing loans, if these commitments became funded loans.

Navy Federal Credit Union36Financial Section 37
2016—Supporting Financial Achievement
Commitment balances as of December 31, 2016 and 2015 were as follows:
(dollars in thousands) 2016 2015
Credit cards $ 15,999,532 $ 13,631,267
Home equity lines of credit 1,097,793 1,041,070
Checking lines of credit 1,031,431 963,131
Pre-approved loans 487,857 431,665
Other 35,272 26,013
Total $ 18,651,885 $ 16,093,146
Note 13: Property, Plant and Equipment
The following is a summary of Navy Federal’s property, plant and equipment:
(dollars in thousands) 2016 2015
Land and buildings $ 1,189,076 $ 991,204
Equipment, furniture and fixtures 451,812 419,665
Computer software and capitalized IT projects 360,700 359,781
Leasehold improvements 145,470 128,272
Subtotal 2,147,058 1,898,922
Less: Accumulated depreciation (839,262) (774,803)
Total $ 1,307,796 $ 1,124,119
Navy Federal has obligations under a number of non-cancelable operating leases for premises. The future minimum payments under the terms of the leases as of December 31, 2016 were:
(dollars in thousands) Amount
2017 $ 24,631
2018 18,794
2019 13,405
2020 8,903
2021 6,481
Thereafter 10,306
Total $ 82,520
Rent expense was $26.3 million and $25.1 million for the years ended December 31, 2016 and 2015, respectively.
Note 14: Goodwill
Navy Federal recognizes net assets acquired and liabilities assumed of acquired entities at estimated fair value as of the acquisition date, subject to refinement as information relative to the fair values at the date of acquisition becomes available. Navy Federal recorded $43.7 million of goodwill related to its acquisition of USAFCU on October 1, 2010. In accordance with ASC 350-20, Goodwill and Other, goodwill is evaluated for impairment annually and upon any changes in circumstances that could likely result in reducing the fair value of a reporting unit below its carrying amount. Navy Federal performed a qualitative assessment of its goodwill as of September 30, 2016 and 2015, pursuant to ASU 2011-08, Testing Goodwill for Impairment, and concluded it was not likely the fair value of any reporting unit was below its carrying amount, and therefore did not recognize any impairment charges.
The following table summarizes the carrying amount of goodwill:
(dollars in thousands) Carrying Value of Goodwill
December 31, 2014 $ 58,905
Adjustments during 2015 —
December 31, 2015 58,905
Adjustments during 2016 —
December 31, 2016 $ 58,905
Note 15: Deposit Accounts
Interest rates on deposit share accounts are set by the Board of Directors and are based on an evaluation of current and future market conditions. Interest on deposit accounts is based on available earnings for each interest period and is not guaranteed by Navy Federal. In claims against the assets of Navy Federal, such as in the event of its liquidation, Navy Federal deposit accounts are subordinate to other liabilities of Navy Federal.
The aggregate amount of time deposits, consisting of share certificates and IRA certificates that meet or exceed $250,000, was $2.3 billion and $1.8 billion at December 31, 2016 and 2015, respectively.
At December 31, 2016, scheduled maturities of time deposits, consisting of share certificates and IRA certificates, were as follows:
(dollars in thousands) Amount
2017 $ 8,401,839
2018 4,795,893
2019 1,767,233
2020 901,015
2021 1,570,908
Thereafter 1,054,350
Total $ 18,491,238

>
>
Navy Federal Credit Union38Financial Section 39
2016—Supporting Financial Achievement
Note 16: Borrowed Funds
Navy Federal’s borrowings at December 31, 2016 and 2015 were as follows:
(dollars in thousands)
As of December 31, 2016
Amount Outstanding Coupon Fixed/Float Payment Maturities
FHLB borrowing $ 685,000 0.54% Fixed At Maturity 2017
FHLB borrowing 4,800,800 0.58%–5.06% Fixed Monthly 2017–2036
FHLB borrowing 3,859,639 0.76%–6.04% Fixed Quarterly 2017–2036
FHLB borrowing 4,150,000 0.51%–1.16% Float Quarterly 2017–2021
Total FHLB borrowings $ 13,495,439
Securities sold under repurchase agreements $ 30,000 0.85% Fixed At Maturity 2017
Securities sold under repurchase agreements 200,000 1.42% Float Quarterly 2019
Securities sold under repurchase agreements 50,000 1.88% Fixed Quarterly 2019
Total securities sold under repurchase agreements $ 280,000
Total borrowed funds $ 13,775,439
(dollars in thousands)
As of December 31, 2015
Amount Outstanding Coupon Fixed/Float Payment Maturities
FHLB borrowing $ 7,748,916 0.26%–5.10% Fixed Monthly 2016–2035
FHLB borrowing 3,073,939 0.86%–6.04% Fixed Quarterly 2016–2033
FHLB borrowing 3,950,000 0.34%–0.63% Float Quarterly 2016–2021
Total FHLB borrowings $ 14,772,855
Securities sold under repurchase agreements $ 469,982 0.12%–0.80% Fixed At Maturity 2016
Securities sold under repurchase agreements 200,000 1.02% Float Quarterly 2019
Securities sold under repurchase agreements 50,000 1.88% Fixed Quarterly 2019
Total securities sold under repurchase agreements $ 719,982
Total borrowed funds $ 15,492,837
The following table displays the amount of borrowed funds by maturity for each of the next five years and thereafter as of December 31, 2016:
(dollars in thousands) Amount
2017 $ 5,595,500
2018 2,171,700
2019 1,898,800
2020 964,439
2021 900,000
Thereafter 2,245,000
Total $ 13,775,439
At December 31, 2016, Navy Federal had $19.5 billion pledged as collateral for FHLB borrowings, which comprised $4.0 million in investments and $19.5 billion in mortgage loans held for investment. At December 31, 2015, Navy Federal had $17.6 billion pledged as collateral for FHLB borrowings, which comprised $6.6 million in investments and $17.6 billion in mortgage loans held for investment.
Navy Federal had the following unused lines of credit as of December 31:
(dollars in thousands) 2016 2015
Federal Reserve Bank $ 16,298,181 $ 15,027,866
FHLB 5,864,796 2,843,749
Fed Funds 272,500 272,500
Total $ 22,435,477 $ 18,144,115
Note 17: Retirement Benefit Plans
Navy Federal Credit Union Employees’ Retirement PlanNavy Federal’s Employees’ Retirement Plan is a defined benefit retirement plan with benefits based on set formulas. Navy Federal transitioned to a Cash Balance design as of January 1, 2001, but retained the Traditional design for those employees who opted to remain under the Traditional formula. The following describes how the benefits are calculated:
Cash Balance—This design provides either a single sum payment upon retirement or a monthly annuity. The annuity option is available for each Cash Balance Plan participant who has a benefit value of more than $5,000.
Traditional—This structure is designed to provide a lifetime of monthly retirement benefits, determined by a set formula. The formula is based on the final average earnings (an average of the three highest consecutive years of income) multiplied by 2%, times the length of employee service.
Retiree Medical Plan Navy Federal provides, to employees hired prior to January 1, 2009, postretirement benefits to offset the cost of medical insurance premiums or out-of-pocket medical expenses. The plan provides a lump sum, notionally credited, to a health reimbursement account equal to $75 or $100 (depending on the retiree’s age on September 1, 2008), multiplied by the number of years of continuous service the retiree provided Navy Federal, multiplied by a lump sum factor.

Navy Federal Credit Union40Financial Section 41
2016—Supporting Financial Achievement
The following table sets forth the reconciliation of the changes in the projected benefit obligation for the pension and retiree medical plans as well as the plan assets for the pension plan:
(dollars in thousands)
Pension Retiree Medical
2016 2015 2016 2015
Accumulated benefit obligation at year end $ 1,014,300 $ 926,048 $ — $ —
Projected benefit obligation at beginning of year $ 1,029,185 $ 1,076,088 $ 50,473 $ 54,522
Employer service cost 32,595 32,593 1,765 2,002
Interest cost 48,231 45,802 2,359 2,276
Actuarial loss/(gain) 57,229 (86,720) 1,860 (4,784)
Plan participants’ contributions — — 285 1,147
Benefits paid (39,251) (37,143) (2,895) (4,690)
Administrative expenses paid (1,514) (1,435) — —
Plan changes — — — —
Projected benefit obligation at year end $ 1,126,475 $ 1,029,185 $ 53,847 $ 50,473
Fair value of plan assets at beginning of year $ 1,180,946 $ 1,217,582 $ — $ —
Actual return on plan assets 116,699 (23,058) — —
Employer contributions 25,000 25,000 2,610 3,543
Plan participants’ contributions — — 285 1,147
Benefits paid (39,251) (37,143) (2,895) (4,690)
Administrative expenses paid (1,514) (1,435) — —
Fair value of plan assets at year end $ 1,281,880 $ 1,180,946 $ — $ —
Over/(under) funded status $ 155,405 $ 151,761 $ (53,847) $ (50,473)
Amount recognized on the Consolidated Statements of Financial Condition:
Other assets $ 155,405 $ 151,761 — —
Other liabilities — — $ 53,847 $ 50,473
The weighted-average assumptions used to determine the projected benefit obligation for the pension and retiree medical benefit plans were as follows:
Pension Retiree Medical
2016 2015 2016 2015
Discount rate 4.20% 4.60% 4.25% 4.60%
Rate of compensation increase 4.40% 4.41% N/A N/A
Assumed health care cost trend rate
Initial trend N/A N/A 7.00% 7.00%
Ultimate trend N/A N/A 5.00% 5.00%
Year ultimate trend reached N/A N/A 2022 2022
The following table sets forth the components of net periodic benefit cost (income) for the benefit plans:
(dollars in thousands)
Pension Retiree Medical
2016 2015 2016 2015
Benefit Cost:
Service cost $ 32,595 $ 32,593 $ 1,765 $ 2,002
Interest cost 48,231 45,802 2,359 2,276
Expected return on plan assets (75,335) (77,530) — —
Net prior service cost/(credit) amortization 4,050 5,161 240 554
Net loss/(gain) amortization 11,842 14,540 254 606
Total benefit cost/(income) $ 21,383 $ 20,566 $ 4,618 $ 5,438
The weighted-average assumptions used to determine the net periodic benefit cost for the pension and retiree medical benefit plans were:
Pension Retiree Medical
2016 2015 2016 2015
Discount rate: for benefit cost/(income) 4.60% 4.15% 4.60% 4.15%
Expected return on plan assets 6.50% 6.50% N/A N/A
Rate of compensation increase 4.40% 4.25% N/A N/A
Assumed health care cost trend rate
Initial trend N/A N/A 7.00% 7.00%
Ultimate trend N/A N/A 5.00% 5.00%
Year ultimate trend reached N/A N/A 2022 2022
The long-term rate of return assumption represents the expected average rate to be earned on plan assets and future plan contributions to provide for the benefits included in the benefit obligations. The assumption is based on several factors, including the anticipated long-term asset allocation of plan assets, historical market index and plan returns, and a forecast of future expected asset returns.
The amounts in Accumulated other comprehensive income (loss) that have not yet been recognized as components of net periodic benefit cost as of December 31 are:
(dollars in thousands)
Pension Retiree Medical
2016 2015 2016 2015
Accumulated other comprehensive loss:
Net prior service cost (credit) $ 23,311 $ 27,361 $ 1,549 $ 1,788
Net loss/(gain) 235,661 231,639 9,402 7,796
Other comprehensive loss $ 258,972 $ 259,000 $ 10,951 $ 9,584

>
Navy Federal Credit Union42Financial Section 43
2016—Supporting Financial Achievement
The amounts recognized in Accumulated other comprehensive income (loss) for the years ended December 31, 2016 and 2015 consist of:
(dollars in thousands)
Pension Retiree Medical
2016 2015 2016 2015
Other Changes in Plan Assets and Benefit Obligations Recognized in Other Comprehensive Income (Loss):
Amounts amortized during the year
Net prior service (cost)/credit $ (4,050) $ (5,161) $ (240) $ (554)
Net (loss)/gain (11,842) (14,540) (254) (606)
Amounts arising during the year
Net prior service (cost)/credit — — — —
Net (loss)/gain 15,864 13,869 1,860 (4,784)
Total recognized in other comprehensive income (loss) $ (28) $ (5,832) $ 1,366 $ (5,944)
The amounts in Accumulated other comprehensive income (loss) expected to be recognized as a component of net periodic benefit cost during 2017 are as follows:
(dollars in thousands) Pension Retiree Medical
Expected Amortization Amounts in 2017:
Net loss $ 10,412 $ 320
Prior service cost 4,023 239
Total $ 14,435 $ 559
The following table discloses the benefits expected to be paid:
(dollars in thousands) Pension Retiree Medical
2017 $ 48,263 $ 2,531
2018 51,594 2,532
2019 55,407 2,608
2020 59,367 2,717
2021 63,035 2,827
2022-2026 368,280 15,907
Total $ 645,946 $ 29,122
The anticipated employer contribution for 2017 is $25.0 million for the pension plan and $2.5 million for the retiree medical benefit plan. The measurement date for the pension and retiree medical benefit plan for 2016 and 2015 was December 31.
The investment strategy of the Navy Federal Credit Union Employees’ Retirement Plan is to employ an investment approach, whereby a mix of equity and fixed-income investments are used to maximize the long-term return of plan assets at a prudent level of risk that includes consideration of benefit obligation volatility. The intent of this strategy is to keep the Plan well-funded over the long
run. Risk tolerance is established through careful consideration of plan liabilities and plan-funded status. Investment risk is measured and monitored on an ongoing basis through annual liability measurements, periodic asset/liability studies and regular investment portfolio reviews.
At December 31, 2016, the target allocation of plan assets was 25% U.S. equity securities, 40% global equity securities and 35% fixed-income securities. Most of the U.S. equity assets are invested in a large company index fund with the balance invested in mid- and small-company equity securities. Most of the global equity allocation is in developed markets around the world, with the balance in emerging markets. The fixed-income allocation comprises a small allocation to cash to provide liquidity for benefit and expense payments, with the balance invested in intermediate- and long-term bonds, the majority of which are investment-grade.
The fair values of the Navy Federal Employees’ Retirement Plan assets, disclosed within their respective fair value hierarchy (as described further in Note 21: Fair Value Measurement) at December 31 were as follows:
(dollars in thousands) Fair Value Measurements as of December 31, 2016
Asset Category Level 1 Level 2 Level 3 Total
U.S. equity securities $ 65,440 $ 251,598 $ — $ 317,038
Global equity securities 502,712 — — 502,712
Intermediate-term fixed-income securities 95,292 142,134 — 237,426
Long-term fixed-income securities 191,540 — — 191,540
Cash 33,165 — — 33,165
Total $ 888,149 $ 393,732 $ — $ 1,281,881
(dollars in thousands) Fair Value Measurements as of December 31, 2015
Asset Category Level 1 Level 2 Level 3 Total
U.S. equity securities $ 53,648 $ 240,390 $ — $ 294,038
Global equity securities 468,399 — — 468,399
Intermediate-term fixed-income securities 86,488 138,718 — 225,206
Long-term fixed-income securities 172,188 — — 172,188
Cash 21,115 — — 21,115
Total $ 801,838 $ 379,108 $ — $ 1,180,946
The following is a description of the valuation methodologies used for the Plan’s financial instruments measured at fair value:
U.S. Equity Securities (Level 2)—During the years ended December 31, 2016 and 2015, the Plan invested in one common collective trust. The trust is valued at net asset value, which is calculated based on the fair value of the underlying investments of the trust. Most of the underlying investments in this trust are traded in markets that are considered to be active, but the trust itself is not actively publicly traded, as it is marketed principally to institutional investors. For those underlying investments that are not considered actively traded, the values are based on quoted market prices, dealer quotations or valuations from pricing sources supported by observable inputs. As such, the trust is classified within Level 2 of the fair value hierarchy.

>
Navy Federal Credit Union44Financial Section 45
2016—Supporting Financial Achievement
Interest in the trust can generally be purchased and redeemed daily with two days’ advance notice. Trades are usually settled no later than three business days after the trade date.
Intermediate-Term Fixed-Income Securities (Level 2)—The intermediate-term fixed-income securities are generally valued using benchmark yields, reported trades and broker/dealer quotes for similar assets in an active market. In addition, as of December 31, 2016 and 2015, the Plan invested in one intermediate-term fixed-income security common collective trust. Most of the underlying investments in this trust are traded in markets that are considered to be active, but the trust itself is not actively publicly traded, as it is marketed principally to institutional investors. As such, the trust is classified within Level 2 of the fair value hierarchy. Interest in the trust can generally be purchased and redeemed daily with advance written notice of one business day. Settlement of redemptions of more than $1 million will occur 10 business days following the trade date.
There were no significant concentrations of risk within plan assets at December 31, 2016 and 2015, as equity and fixed-income assets are broadly diversified.
Navy Federal 401(k) Savings PlanThe Navy Federal 401(k) savings plan is a defined contribution plan where employees can contribute up to the statutory limits to a 401(k) retirement account and receive employer matching contributions. The matching contribution percentage is based on the formula the employee receives in the defined benefit retirement plan. Employees eligible for the Cash Balance benefit receive a 100% employer match on the first 7% of pay they contribute to their 401(k) account up to IRS limits and are vested after completing two years of service. The employees eligible for the Traditional benefit receive an employer match of 50% on the first 7% of pay they contribute to their 401(k) account up to IRS limits.
The cost recognized for the 401(k) Plan, including matching contributions and administrative costs, was $44.2 million and $39.4 million for the years ended December 31, 2016 and 2015, respectively.
Deferred Compensation PlanThe Navy Federal 457(b) deferred compensation plan is a non-qualified plan that offers a before-tax savings opportunity to highly compensated employees. The annual deferral amount allowed mirrors the 401(k) Plan limits, and contributions held by Navy Federal earn monthly interest based on Navy Federal’s monthly gross income divided by average earnings on assets (loans and investments).
Non-Qualified Supplemental Retirement Plans The non-qualified supplemental retirement plans are primarily designed to “make up” for benefits not paid through the qualified retirement plans as a result of IRS limitations. Internal Revenue Code Section 401(a)(17) limits the amount of compensation that can be used in a qualified retirement plan calculation, and Internal Revenue Code Section 415 limits the amount of monthly annuity that can be paid from a defined benefit plan.
All benefits are paid from Navy Federal’s assets and are in compliance with all federal laws and regulations. As of December 31, 2016 and 2015, total liability related to these plans was $10.7 million and $10.3 million, respectively.
Note 18: Related Party Transactions
In the normal course of business, Navy Federal extends loans and receives deposits from credit union officials. Credit union officials are defined as volunteer members of the Board of Directors and board committees, and employees with the title of Vice President and above. The total outstanding loan balances extended to officials as of December 31, 2016 and 2015 were $38.3 million and $37.3 million, respectively. Total deposit balances received from officials as of December 31, 2016 and 2015 were $18.0 million and $10.9 million, respectively. Loans were made at the same rates and terms as those available to all other members of the Credit Union. Deposit accounts earned interest at the same rates provided to all other members of the Credit Union.
Note 19: Accumulated Other Comprehensive Income/(Loss)
Details of accumulated other comprehensive income (loss) are as follows:
(dollars in thousands)
Year Ended December 31, 2016
Unrecognized Net Pension and Postretirement
Amounts
Unrealized Net Gains (Losses) on Available-for-Sale
Securities
Unrealized Net Gains (Losses) on Cash Flow Derivatives
Total
Balance, beginning of period $ (268,584) $ 5,789 $ (40,740) $ (303,535)
OCI before reclassifications (17,724) (200,599) (5,713) (224,036)
Amounts reclassified from AOCI to:
Salaries and employee benefits 16,385 — — 16,385
Net gain on sales of investments — 17,816 — 17,816
Interest on borrowed funds — — 18,163 18,163
Net change in AOCI (1,339) (182,783) 12,450 (171,672)
Balance, end of period $ (269,923) $ (176,994) $ (28,290) $ (475,207)
(dollars in thousands)
Year Ended December 31, 2015
Unrecognized Net Pension and Postretirement
Amounts
Unrealized Net Gains (Losses) on Available-for-Sale
Securities
Unrealized Net Gains (Losses) on Cash Flow Derivatives
Total
Balance, beginning of period $ (280,360) $ 153,533 $ (33,568) $ (160,395)
OCI before reclassifications (9,085) (126,359) (27,342) (162,786)
Amounts reclassified from AOCI to:
Salaries and employee benefits 20,861 — — 20,861
Net gain on sales of investments — (21,385) — (21,385)
Interest on borrowed funds — — 20,170 20,170
Net change in AOCI 11,776 (147,744) (7,172) (143,140)
Balance, end of period $ (268,584) $ 5,789 $ (40,740) $ (303,535)

Navy Federal Credit Union46Financial Section 47
2016—Supporting Financial Achievement
>
>
>
>
>
Note 20: Regulatory Matters
Navy Federal is subject to regulatory capital requirements administered by the NCUA. Failure to meet minimum capital requirements can initiate certain mandatory and possible additional discretionary actions by regulators that, if undertaken, could have a direct material effect on Navy Federal’s consolidated financial statements. Under capital adequacy regulations and the regulatory framework for prompt corrective action, Navy Federal must meet specific capital requirements that involve quantitative measures of Navy Federal’s assets, liabilities and certain commitments as calculated under GAAP. Navy Federal’s capital amounts and net worth classification are also subject to qualitative judgments by its regulators about components, risk weightings and other factors.
Quantitative measures established by regulation to ensure capital adequacy require Navy Federal to maintain minimum amounts and ratios of net worth to total assets. Credit unions are also required to calculate a risk-based net worth (RBNW) requirement that establishes whether the credit union will be considered “complex” under the regulatory framework. A credit union is defined as “complex” if the credit union’s quarter-end total assets exceed fifty million dollars ($50,000,000) and its RBNW requirement exceeds 6%. Navy Federal’s RBNW requirement as of December 31, 2016 and 2015 was 6.12% and 5.73%, respectively. Based on the RBNW requirement, Navy Federal would be considered “complex” as of December 31, 2016. There is no impact to Navy Federal based on the complex designation because its statutory net worth ratio qualifies Navy Federal as “well capitalized” by NCUA standards, and its statutory net worth exceeds its RBNW requirement.
The NCUA categorized Navy Federal as “well capitalized” under the regulatory framework for prompt corrective action with a net worth-to-assets ratio of 11.53% and 10.94% as of December 31, 2016 and 2015, respectively. Net worth for this calculation is defined as undivided earnings plus regular and capital reserves. To be categorized as “well capitalized,” Navy Federal must maintain a minimum net worth ratio of 7%. The components of Navy Federal’s capital are stable, and the occurrence of factors that could significantly affect capital adequacy is considered to be remote and limited to extraordinary regulatory or economic events. There are no conditions or events that have occurred since December 31, 2016 that management believes would have changed Navy Federal’s categorization.
The Federal Reserve requires us to maintain a cash reserve balance with the Federal Reserve Bank (FRB). At December 31, 2016 and 2015, the balance outstanding at the FRB was $0 and $106.9 million, respectively.
Note 21: Fair Value Measurement
ASC 820-10, Fair Value Measurements and Disclosures, requires Navy Federal to determine the fair values of its financial instruments based on the fair value hierarchy established in that standard, which requires an entity to maximize the use of quoted prices and observable inputs when measuring fair value. A description of the fair value hierarchy is as follows:
Level 1—Valuation is based upon quoted prices for identical instruments traded in active markets.
Level 2—Valuation is based upon observable inputs such as quoted prices for similar instruments in active markets, quoted prices for identical or similar instruments in markets that are not active and model-based valuation techniques for which all significant assumptions are observable in the market.
Level 3—Valuation is based upon unobservable inputs that are supported by little or no market activity and are significant to the fair value of the instrument. Valuation is typically performed using pricing models, discounted cash flow methodologies or similar techniques, which incorporate management’s own estimates of assumptions that market participants would use in pricing the instrument, or valuations that require significant management judgment or estimation.
Financial Assets Accounted For at Fair Value on a Recurring BasisThe following is a description of the valuation methodologies used by Navy Federal for its assets and liabilities measured at fair value on a recurring basis:
Available-for-Sale SecuritiesNavy Federal receives pricing for AFS securities from a third-party pricing service. These securities are classified as Level 2 in the fair value hierarchy.
Residential and Commercial Mortgage-Backed Securities—Residential and commercial mortgage-backed securities include agency and non-agency securities, and are valued either based on similar assets in the marketplace and the vintage of the underlying collateral, or at the closing price reported in the active market in which the individual security is traded.
Federal Agency Securities, Treasury Securities, Municipal Securities, Corporate Bonds and Bank Notes—Federal agency securities, treasury securities, municipal securities, corporate bonds and bank notes are valued based on similar assets in the marketplace and the vintage of the underlying collateral, or at the closing price reported in the active market in which the individual security is traded.
Mortgage Servicing RightsMSRs are carried at fair value on a recurring basis. MSRs do not trade in an active, open market with readily observable prices. Fair value of MSRs is determined by discounting projected net servicing cash flows of Navy Federal’s servicing portfolio, taking into consideration actual and expected loan prepayment rate, discount rate, servicing costs and other economic factors. During 2016, Navy Federal transitioned from using an external third-party static valuation to an internally managed stochastic model. The internal model’s underlying assumptions are corroborated by values received from independent third parties and comparisons to market transactions. The fair value of MSRs is primarily affected by changes in mortgage interest rates since rate changes cause the loan prepayment acceleration factors to increase or decrease. The valuation is based on unobservable inputs and therefore classified within Level 3 of the fair value hierarchy.
The key economic assumptions used in determining the fair value of MSRs at December 31, 2016 and 2015 were as follows:
2016 2015
Weighted-average life (years) 7.08 6.20
Prepayment rate 8.66% 11.56%
Yield-to-maturity discount rate N/A 9.86%
Option adjusted spread 10.45% N/A

Navy Federal Credit Union48Financial Section 49
2016—Supporting Financial Achievement
Derivative Assets and LiabilitiesFair values of Navy Federal’s interest rate swaps designated as cash flow and fair value hedges are determined based on third-party models that calculate the net present value of future cash flows discounted using the Overnight Indexed Swap (OIS) rate. Counterparty non-performance risk is considered by discounting future cash flows using OIS rates adjusted for credit quality. Navy Federal also uses an internal process to further evaluate the risk of counterparty default. These derivatives are classified as Level 2 in the fair value hierarchy.
Fair values of Navy Federal’s IRLCs are determined based on an evaluation of best execution forward contract prices sourced from the TBA market, adjusted by a factor that represents the probability it will settle and become MLAS. IRLCs are classified as Level 3 in the fair value hierarchy.
Fair values of Navy Federal’s forward sales contracts on TBA securities are determined based on an evaluation of best execution forward contract prices sourced from the TBA market, by agency. As such, TBA hedges are classified as Level 2 in the fair value hierarchy.
Mortgage Loans Awaiting Sale MLAS comprise those loans Navy Federal intends either to sell or to securitize. The initial loan level basis is equal to unpaid principal balance plus or minus origination costs and fees. Navy Federal has elected the fair value option for MLAS. The fair value of MLAS is determined based on an evaluation of best execution forward sales contract prices sourced from the TBA market, by agency (e.g., GNMA, FHLMC, FNMA). As such, MLAS are classified as Level 2 in the fair value hierarchy.
The tables below present the items recognized at fair value in the Consolidated Statements of Financial Condition on a recurring basis at December 31:
(dollars in thousands)
Fair Value Measurements on Recurring Basis as of December 31, 2016
Level 1 Level 2 Level 3 Total
Available-for-sale securities
U.S. government and federal agency securities $ — $ 5,081,333 $ — $ 5,081,333
Residential mortgage-backed securities
Agency — 5,285,388 — 5,285,388
Non-agency — 628,384 — 628,384
Commercial mortgage-backed securities — 470,850 — 470,850
Bank notes and corporate bonds — 1,929,797 — 1,929,797
Municipal securities — 263,572 — 263,572
Non U.S. government securities — 144,828 — 144,828
Equity securities 157,703 — — 157,703
Total available-for-sale securities 157,703 13,804,152 — 13,961,855
Mortgage loans awaiting sale — 1,169,948 — 1,169,948
Mortgage servicing rights — — 319,527 319,527
Derivatives — 12,361 25,476 37,837
Total assets at fair value on a recurring basis $ 157,703 $ 14,986,461 $ 345,003 $ 15,489,167
Derivatives $ — $ 40,121 $ 609 $ 40,730
Total liabilities at fair value on a recurring basis $ — $ 40,121 $ 609 $ 40,730
(dollars in thousands)
Fair Value Measurements on Recurring Basis as of December 31, 2015
Level 1 Level 2 Level 3 Total
Available-for-sale securities
U.S. government and federal agency securities $ — $ 4,965,482 $ — $ 4,965,482
Residential mortgage-backed securities
Agency — 5,529,755 — 5,529,755
Non-agency — 761,565 — 761,565
Commercial mortgage-backed securities — 285,320 — 285,320
Bank notes and corporate bonds — 1,958,345 — 1,958,345
Municipal securities — 262,166 — 262,166
Equity securities 97,283 — — 97,283
Total available-for-sale securities 97,283 13,762,633 — 13,859,916
Mortgage loans awaiting sale — 708,015 — 708,015
Mortgage servicing rights — — 270,876 270,876
Derivatives — 1,741 18,570 20,311
Total assets at fair value on a recurring basis $ 97,283 $ 14,472,389 $ 289,446 $ 14,859,118
Derivatives $ — $ 41,606 $ 19 $ 41,625
Total liabilities at fair value on a recurring basis $ — $ 41,606 $ 19 $ 41,625
There were no transfers of Level 3 assets in the period. The following tables summarize the changes in fair value for items measured at Level 3 fair value on a recurring basis using significant unobservable inputs at December 31:
(dollars in thousands)
Reconciliation of Level 3 Assets and Liabilities as of December 31, 2016
Mortgage Servicing Rights
Interest Rate Lock Commitments—
Asset
Interest Rate Lock Commitments—
Liability
Balance, beginning of year $ 270,876 $ 18,570 $ 19
Realized/unrealized gain (loss) included in earnings 2,345 38,168 1,591
Issuances/purchases 81,993 256,968 435
Settlements/sales (35,687) (288,230) (1,436)
Balance, end of year $ 319,527 $ 25,476 $ 609
Net unrealized gains (losses) related to assets still held at December 31, 2016
$ (33,342) $ 25,476 $ 609

Navy Federal Credit Union50Financial Section 51
2016—Supporting Financial Achievement
(dollars in thousands)
Reconciliation of Level 3 Assets and Liabilities as of December 31, 2015
Mortgage Servicing Rights
Interest Rate Lock Commitments—
Asset
Interest Rate Lock Commitments—
Liability
Balance, beginning of year $ 235,801 $ 8,771 $ 3
Realized/unrealized gain (loss) included in earnings 4,059 19,515 37
Issuances/purchases 63,099 167,791 25
Settlements/sales (32,083) (177,507) (46)
Balance, end of year $ 270,876 $ 18,570 $ 19
Net unrealized gains (losses) related to assets still held at December 31, 2015
$ (28,024) $ 18,570 $ 19
Financial Assets Accounted For at Fair Value on a Non-recurring BasisCertain assets and liabilities may be required to be measured at fair value on a non-recurring basis. These non-recurring fair value measurements usually result from the application of the lower of cost or market accounting or the write-down of individual assets due to impairment.
The following is a description of the valuation methodologies used by Navy Federal for its assets measured at fair value on a non-recurring basis:
Real Estate Owned REO is recorded at the lower of cost or fair value less costs to sell. Navy Federal utilizes Broker Price Opinions (BPOs) or home appraisals to estimate the fair market value of REO. A BPO considers the value of similar surrounding properties, sales trends in the neighborhood and/or an estimate of any of the costs associated with getting the property ready for sale. A home appraisal involves a certified, state-licensed professional to determine the value of the property by doing an interior and exterior inspection of the subject property and a comparison to comparable home sales. Fair value less costs to sell is an estimated value based on relevant recent historical data that are considered unobservable inputs, and as such, REO is classified as Level 3 in the fair value hierarchy and valued on a non-recurring basis.
During the holding period, updated BPOs are obtained periodically to reflect changes in fair value. Navy Federal markets the REO properties for sale to the public and generally does not hold properties for longer than one year.
The tables below present the items measured at fair value in the Consolidated Statements of Financial Condition on a non-recurring basis where assets that are measured at the lower of cost or fair value less costs to sell were recognized at fair value less costs to sell at December 31, 2016 and 2015:
(dollars in thousands)
Fair Value Measurements as of December 31, 2016
Level 1 Level 2 Level 3 Total
Other Real Estate Owned $ — $ — $ 18,219 $ 18,219
(dollars in thousands)
Fair Value Measurements as of December 31, 2015
Level 1 Level 2 Level 3 Total
Other Real Estate Owned $ — $ — $ 19,132 $ 19,132
Note 22: Fair Values of Financial Instruments
ASC 825-10, Fair Value of Financial Instruments—Disclosure, requires disclosure of estimated fair values of financial instruments, including those financial instruments for which Navy Federal did not elect fair value treatment. The financial instruments that are accounted for under ASC 820-10, Fair Value Measurement, are disclosed separately in Note 21: Fair Value Measurement. Navy Federal discloses fair value information for its financial instruments, whether recognized at fair value in the Consolidated Statements of Financial Condition or not, and for which it is practical to estimate that value. In cases where quoted market prices are not available, fair values are based on estimates using present value or other valuation techniques. Those techniques are significantly affected by the assumptions used, including the discount rate and estimates of future cash flows. In that regard, the derived fair value cannot be substantiated by comparison to independent markets and, in many cases, could not be realized in immediate settlement of the instrument. Certain financial instruments and all non-financial instruments are excluded from these disclosure requirements. Accordingly, the aggregate fair value amounts presented do not necessarily represent the underlying fair value of Navy Federal. The following methods and assumptions were used in estimating the fair values disclosed for financial instruments:
Financial Instruments Accounted For Under Fair Value Option:Mortgage Loans Awaiting Sale (MLAS)
(dollars in thousands)
Fair value and aggregate unpaid principal balance for MLAS are as follows:
Fair Value Unpaid Principal Balance Difference
December 31, 2016
MLAS $ 1,169,948 $ 1,156,718 $ 13,230
December 31, 2015
MLAS $ 708,015 $ 692,368 $ 15,647
Additional Fair Value Information Related to Other Financial Instruments:CashThe reported carrying amount of Cash approximates fair value for vault cash and demand balances from other financial institutions.
Investments, Including Mortgage-Backed SecuritiesFair value is based on quoted market prices, if available. If a quoted market price is not available, fair value is estimated using quoted market prices for similar securities. The carrying amount reported for FHLB investments approximates fair value and is included in Investments in FHLBs on the Consolidated Statements of Financial Condition.
Loans to MembersFor residential mortgages, fair value is estimated using the quoted market prices for securities backed by similar loans. The fair value of other loan types, including consumer and equity loans, is estimated by discounting expected principal and interest cash flows (net of defaults) using market rates and adjustments related to non-interest income and expense. Loans that are individually impaired are carried at the lower of cost or fair value of the underlying collateral, less estimated cost to sell.

Navy Federal Credit Union52Financial Section 53
2016—Supporting Financial Achievement
Deposit AccountsFor deposit accounts, the fair value is estimated by discounting expected future cash flows using market rates. For accounts with no defined maturity, such as Savings, Money Market Savings, Checking and IRA share accounts, a final maturity of ten years is assumed.
Derivative Instruments and Hedging ActivitiesFair values of Navy Federal’s IRLCs are determined based on an evaluation of best execution forward contract prices sourced from the TBA market. The fair value of forward sales contracts on MLAS that Navy Federal intends to sell is based on the quoted market price of contracts with similar characteristics. It is the established practice of Navy Federal to only purchase forward contracts to cover mortgage loans in process, which are anticipated to close for delivery into these forward contracts. Accordingly, the cost to terminate existing contracts, which is based on current market prices, is not material to Navy Federal.
Navy Federal uses pay-fixed interest rate swaps to protect certain fixed-rate investments against the adverse changes in fair value attributable to changes in interest rates, as well as to hedge the variability in cash flows related to existing and anticipated replacement funding for floating rate liabilities that reprice based on LIBOR.
Navy Federal has elected to use the income approach to value its interest rate swaps, using observable Level 2 market expectations at the measurement date. A standard valuation technique is used to convert future cash flow amounts to a single present amount (discounted), assuming participants are motivated but not compelled to transact. The future cash flows are discounted to present value using the OIS rate at measurement date. The OIS curve, which is considered a risk-free curve, is used for discounting because the swaps are fully collateralized with liquid collateral.
Mortgage Servicing Rights (MSRs)MSRs do not trade in an active, open market with readily observable prices. Navy Federal determines the fair value of its MSRs by discounting projected net servicing cash flows of Navy Federal’s servicing portfolio, taking into consideration actual and expected loan prepayment rate, discount rate, servicing costs and other economic factors.
Securities Sold Under Repurchase Agreements and Other Borrowings, Including FHLB Borrowed FundsThe fair values of FHLB borrowings and securities sold under repurchase agreements are based on discounted expected cash flows using FHLB and market rates, respectively.
The estimated fair values of financial instruments at December 31 were:
(dollars in thousands) December 31, 2016
Carrying Amount
Estimated Fair Value
Total Level 1 Level 2 Level 3
Financial assets:
Cash $ 538,734 $ 538,734 $ 538,734
Short-term investments 2,197,535 2,197,535 2,167,235 $ 30,300
Available-for-sale securities 13,961,855 13,961,855 157,703 13,804,152
Held-to-maturity securities 311,884 313,562 313,562
Mortgage loans awaiting sale 1,169,948 1,169,948 1,169,948
Loans to members, net of allowance for loan losses 57,714,225 63,789,319 27,238,150 $ 36,551,169
Investments in FHLBs 588,556 588,556 588,556
Mortgage servicing rights 319,527 319,527 319,527
Other assets 39,637 39,637 12,360 27,277
Financial liabilities:
Deposit accounts 55,883,912 51,469,587 51,469,587
Securities sold under repurchase agreements 280,000 282,347 282,347
Notes payable 13,495,439 13,656,529 13,656,529
Other liabilities 40,730 40,730 40,121 609
(dollars in thousands) December 31, 2015
Carrying Amount
Estimated Fair Value
Total Level 1 Level 2 Level 3
Financial assets:
Cash $ 500,312 $ 500,312 $ 500,312
Short-term investments 2,115,248 2,115,248 2,084,848 $ 30,400
Available-for-sale securities(1) 13,859,916 13,859,916 97,283 13,762,633
Held-to-maturity securities 314,627 315,656 315,656
Mortgage loans awaiting sale 708,015 708,015 708,015
Loans to members, net of allowance for loan losses 52,325,503 59,391,427 25,575,793 $ 33,815,634
Investments in FHLBs 642,846 642,846 642,846
Mortgage servicing rights 270,876 270,876 270,876
Other assets 22,444 22,444 1,741 20,703
Financial liabilities:
Deposit accounts 48,865,873 45,470,678 45,470,678
Securities sold under repurchase agreements 719,982 723,397 723,397
Notes payable 14,772,855 15,032,199 15,032,199
Other liabilities 41,625 41,625 41,606 19 (1)Includes a correction of $97.3 million of previously disclosed amounts related to equity securities between level 2 and level 1. This misclassification is not material to the consolidated financial statements.

Navy Federal Credit Union54
ASC 825-10, Fair Value of Financial Instruments—Disclosure, also requires the disclosure of all significant concentrations of credit risk arising from financial instruments, whether from an individual counterparty or groups of counterparties. Navy Federal has assessed the counterparty credit risk on its financial instruments and has determined that it is not material to the financial statements.

navyfederal.org
Federally insured by NCUA. © 2017 Navy Federal NFCU 8010-F (3-17)