Embed Size (px)
Citation preview

doi:10.1093/brain/awl055 Brain (2006), 129, 1164–1176
Asymmetries of the planum temporale andHeschl’s gyrus: relationship to languagelateralization
Raquel Dorsaint-Pierre,1 Virginia B. Penhune,3 Kate E. Watkins,5 Peter Neelin,2 Jason P. Lerch,4
Marc Bouffard1 and Robert J. Zatorre1
1Neuropsychology and Cognitive Neuroscience Unit and 2Brain Imaging Center, Montreal Neurological Institute,McGill University, 3Department of Psychology, Concordia University, Montreal, 4Mouse Imaging Center, Hospital forSick Children, Toronto, Canada and 5Department of Experimental Psychology and FMRIB Center,University of Oxford, Oxford, UK
Correspondence to: Raquel Dorsaint-Pierre, Montreal Neurological Institute, Neuropsychology/Cognitive NeuroscienceUnit, 3801 University Street, Room 276, Montreal, Quebec, Canada H3A 2B4E-mail: [email protected]
Morphological asymmetries favouring the left hemisphere in the planum temporale (PT) and Heschl’s gyrus(HG) have both been presumed to relate to the typical left-hemisphere dominance for language functions.However, a direct link between structure and function has not been clearly established. The present studyinvestigates this issue by measuring the volume of the PT and HG on the MRI scans of epilepsy patients classifiedinto three groups: left speech group (LSG; n = 20), right speech group (RSG; n = 11) and bilateral speech group(BSG; n = 13), as assessed by the intracarotid Sodium Amytal procedure. Additionally, an automatic voxel-based morphometry (VBM) analysis was performed to explore collateral structural asymmetries. Althoughleftward structural asymmetries were found in the PT, consistent with the literature, they did not relate tolanguage lateralization. For HG we also replicated asymmetries favouring the left side; interestingly, three ofthe individuals within the RSG showed a strongly reversed asymmetry, but as a whole the structure–functionrelationship for HG was not obligatory. The VBM analysis revealed a grey-matter concentration difference inthe posterior part of the inferior frontal gyrus (pars opercularis, corresponding functionally to Broca’s area),which favoured the left hemisphere in the LSG, and the right hemisphere in the RSG. The findings suggest thatthis frontal cortical region bears a direct relationship to language lateralization, which may be related touse-dependent plasticity in patients with language reorganization.
Keywords: hemispheric specialization; Heschl’s gyrus; planum temporale; structural MRI; voxel-based morphometry
Abbreviations: BSG = bilateral speech group; HG = Heschl’s gyrus; IAP = intracarotid Amytal procedure; LSG = left speechgroup; PP = planum parietale; PT = planum temporale; RSG = right speech group; SF = sylvian fissure; VBM = voxel-basedmorphometry
Received December 3, 2005. Revised February 6, 2006. Accepted February 10, 2006. Advance Access publication March 14, 2006
IntroductionThe functional specialization of the left cerebral hemisphere
for language functions in most individuals has received ample
confirmation. There is also much neuroanatomical evidence
suggesting that structural differences between the two hemi-
spheres exist. However, a clear structure–function relation-
ship remains unproven. The present study was conducted to
investigate this question systematically. More specifically, the
relationship between structural asymmetries in the auditory
cortices, the planum temporale (PT) and Heschl’s gyrus
(HG), and language lateralization was examined in epilepsy
patients with known left- or right-hemisphere language
lateralization as determined via intracarotid Sodium Amytal
testing.
In their original study, Geschwind and Levitsky (1968)
reported that the PT, a region found on the superior temporal
plane and part of the classical Wernicke’s area, was larger in
# The Author (2006). Published by Oxford University Press on behalf of the Guarantors of Brain. All rights reserved. For Permissions, please email: [email protected]
size on the left hemisphere relative to the right. This finding
was interpreted as providing the first clear neuroanatomical
evidence for the left hemisphere’s specialization for speech.
Many studies have since then confirmed the PT asymmetry,
which was found to be present pre- and peri-natally
(e.g. Witelson and Pallie, 1973; Wada et al., 1975; Chi
et al., 1977), strengthening the hypothesis that language
lateralization is innately determined.
Although most researchers have agreed on the presence
of an asymmetry in the PT, the nature of that asymmetry
is controversial. One problem was that the incidence of left-
hemisphere PT asymmetry (about 60–80%) was always
much lower than the incidence of left-hemisphere language
lateralization in the population (estimated to be 96% or
higher). Another controversy relates to the nature of the
measurement. Originally, Geschwind and Levitsky’s post-
mortem study, as well as others (e.g. Witelson and Pallie,
1973; Wada et al., 1975) had interpreted the PT asymmetry
as one related to size, whereas other studies demonstrated
that the asymmetry was related to shape or angulation
(e.g. Rubens et al., 1976; Loftus et al., 1993; Binder et al.,
1996; Westbury et al., 1999). One reason for this discrepancy
is the lack of a clear consensus of what constitutes the borders
of the PT (Shapleske et al., 1999; Westbury et al., 1999),
particularly the posterior border. The use of the so-called
knife-cut method has contributed to this problem.
According to Rubens et al. (1976), previous researchers
excluded cortical areas above the bottom end-point of the
posterior ascending ramus from PT measurements
(see Fig. 1B), believing that these areas pertained not to
the PT, but rather to a region named planum parietale
(PP) (Binder et al., 1996). Many subsequent researchers
have, however, argued that there is little evidence to support
the claim that the PT and PP are cytoarchitectonically
(Witelson et al., 1995) or functionally different (e.g.
Steinmetz et al., 1989; Binder et al., 1996), thus making
the distinction a spurious one. Furthermore, several studies
have clearly demonstrated that when the PT and PP are
combined, a shape rather than a size asymmetry is observable
(Rubens et al., 1976; Loftus et al., 1993; Binder et al., 1996;
Honeycutt et al., 2000). Whereas the horizontal portion of the
left PT is found to be longer than the right PT (see Fig. 1A),
the right PT curves more anteriorly and extends vertically
much more than the left PT (see Fig. 1B). According to many
authors (e.g. Rubens et al., 1976; Loftus et al., 1993; Binder
et al., 1996; Westbury et al., 1999) the PT size asymmetry
observed by previous investigators is more of a by-product
‘of the more anterior upswing of the sylvian fissure [and the
PT] on the right rather than a manifestation of functionally
significant increase in size on the left’ (Loftus et al., 1993,
p. 354). Thus, on the basis of this conclusion, the present
study will measure the PT using both the knife-cut method
and the combined PT and PP method (Westbury method)
(Westbury et al., 1999), and will consider size as well as shape
differences.
Another structural asymmetry of interest is found in HG
(e.g. von Economo and Horn, 1930; Rademacher et al., 1993;
Kulynych et al., 1994; Penhune et al., 1996; Penhune et al.,
A B
Fig. 1 (A) Illustration of the left PT. Sagittal view of a post-mortem brain. The horizontal portion (from the green to the blue arrow) of theleft PT is found to be longer than the right PT (seen in B from the green to the pink arrow). (B) Illustration of the right PT. Sagittal view of apost-mortem brain. The pink arrow points out the posterior ending of the horizontal portion (also referred to as the bottom end-point ofthe posterior ascending ramus) of the SF and PT, whereas the blue arrow points to the actual ending of the PT. The region between thepink and blue arrows has been traditionally excluded from PT measurements, as this region was believed to pertain to the PP or theposterior ascending ramus. Overall the right PT (from the green to the blue arrow) curves more anteriorly and extends more verticallythan the left PT (seen in A) Original illustrations A and B reproduced with permission from Rubens AB, Mahowald MW, Hutton JT.Asymmetry of the lateral (sylvian) fissures in man. Neurology 1976; 26: 620–4.
Auditory cortex asymmetries Brain (2006), 129, 1164–1176 1165

2003), which contains primary auditory cortex (PAC)
(Rademacher et al., 1993, 2001). In an MR-based study,
Penhune et al. (1996) found that the left HG was associated
with a larger white matter volume than was the right HG.
It was hypothesized that this white-matter asymmetry was
related to more efficient processing of rapidly changing
temporal information, which is relevant for speech (Tallal
et al., 1993; Zatorre et al., 2002). Other asymmetries have
been found at the cellular level (Seldon, 1981a, b, 1982;
Hutsler and Gazzaniga, 1996). Several anatomical and
MR-based studies have reported a more widespread leftward
asymmetry of white matter in posterior temporal areas
(Anderson et al., 1999), and in frontal, parietal and temporal
regions (Pujol et al., 2002). Thus, the present study will also
examine the possible relationship between the white-matter
asymmetry in HG and hemispheric specialization of speech
functions.
The few studies that have attempted to investigate the
relationship between structural and functional asymmetries
have yielded mixed results (e.g. Steinmetz et al., 1991; Jancke
and Steinmetz, 1993; Foundas et al., 1994; Tzourio et al.,
1998; Josse et al., 2003; Dos Santos Sequeira et al., 2006;
Eckert et al., 2006; also see Witelson and Kigar, 1988, for a
review). A number of investigators (e.g. Di Chiro, 1962;
McRae et al., 1968; Ratcliff et al., 1980; Strauss et al.,
1985) have tried to describe the relationship between mor-
phological asymmetries and speech lateralization as deter-
mined via the intracarotid Amytal procedure (IAP),
implemented to determine language lateralization in epilepsy
patients (Branch et al., 1964). Of most direct relevance,
Ratcliff et al. (1980) measured the angulation of the posterior
branch of the middle cerebral artery from the angiograms
of epilepsy patients who had undergone the IAP. This angle
was compared between the two hemispheres serving as an
index of the sylvian fissure (SF) shape asymmetry. Ratcliff
et al.’s main findings were that patients who had left-
hemisphere speech showed an asymmetry of the measured
angle between the two hemispheres. Those who had bilateral
or right-hemisphere speech showed a reduced asymmetry
between the two hemispheres.
Foundas et al. (1994) were among the first to attempt to
relate the PT asymmetry directly to speech lateralization, mea-
sured via the IAP. Using MR morphometry to measure PT
length, they found that when speech was lateralized to
the left hemisphere, the left PT was longer than the right
PT, and, conversely, when speech was lateralized to the right
hemisphere, the right PT was longer than the left PT.
Unfortunately, only one subject was included in the right-
hemisphere speech group, making it difficult to conclude
whether these results would generalize to a larger sample of
right speech individuals. Taken together, the existing data
provide some support for the structure–function link;
however, the evidence remains scarce and unconvincing.
The purpose of the present study was to investigate more
systematically the morphological asymmetries in HG and PT,
via MR analysis, in a series of epilepsy patients with known
language lateralization as determined from the IAP,
considered to be the most valid method for identifying
hemispheric dominance (Perria et al., 1961; Branch et al.,
1964; Risse et al., 1997). The following dissociation was
predicted: (i) individuals with speech represented in the
left hemisphere would show a leftward volume asymmetry
in both HG and PT (measured via the knife-cut method), as
well as a right–left angulation difference for the PT (measured
via the Westbury method); and (ii) individuals with speech
represented in the right hemisphere or bilaterally would show
a reduced structural asymmetry in both structures (Ratcliff
et al., 1980). To test this prediction, we examined three groups
of patients with speech represented in the left hemisphere
(left speech group: LSG), the right hemisphere (right speech
group: RSG), or bilaterally (bilateral speech group: BSG).
Two different but complementary methodologies were
used to investigate the structural asymmetries. The first
involved manual labelling and volume measurement of the
individual structures using three-dimensional computerized
MR (Penhune et al., 1996; Westbury et al., 1999). The second,
voxel-based morphometry (VBM) (Ashburner and Friston,
2000), is an exploratory whole-brain analysis that has the
advantage of being reproducible and automated. This
technique measures the distribution of grey matter and
white matter, thus giving a comprehensive assessment of
anatomical differences throughout the brain. The goal of
using the automatic procedure was not only to confirm
the manual labelling results in auditory regions but also to
explore structural asymmetries elsewhere in the brain that
could possibly relate to language lateralization.
MethodsSubjectsThe subjects who participated in the present study were patients
who suffered from intractable epilepsy, and who had come to the
Montreal Neurological Institute (MNI) for surgery. The subjects
gave their consent, according to the Declaration of Helsinki and
through the applicable ethical committees of the MNI, to undergo
both the IAP and MRI scanning, both procedures being part of their
pre-surgical work-up. Demographic and clinical details of these
patients are given in Table 1.
The intracarotid Amytal procedure (IAP)The IAP procedure consists in anaesthetizing one hemisphere at a
time using sodium amobarbital (Amytal) and evaluating the
speech potential of the contralateral ‘awake’ hemisphere. Each
hemisphere is tested on a separate day. After being tested on
both sides, the patient is classified as having speech represented
in the left hemisphere, the right hemisphere or bilaterally according
to the criteria that include the presence of speech arrest and variable
degrees of errors on speech tasks (e.g. naming, serial speech, com-
prehension, reading, spelling) when the dominant hemisphere is
injected, and the absence of these speech difficulties when the oppo-
site hemisphere is injected (Perria et al., 1961; Branch et al., 1964;
Zatorre, 1989; Jones-Gotman, 1997). In cases where speech is repre-
sented bilaterally, a few possible scenarios can be observed, ranging
1166 Brain (2006), 129, 1164–1176 R. Dorsaint-Pierre et al.

from the patient showing no apparent speech disturbances from
injection of either hemisphere to the patient showing considerable
speech disturbances after injection of both hemispheres. In this
study all bilateral speech cases were merged to form a single speech
group (BSG). On the basis of the IAP’s criteria mentioned above,
20 patients were classified as having speech functions in the left
hemisphere (LSG), 11 patients were classified as having speech
functions in the right hemisphere (RSG) and 13 patients were
classified as having speech represented bilaterally (BSG).
MR scanningA total of 47 patients were initially selected for the present study on
the basis of availability of adequate MR scans and data on the IAP;
however, 3 were excluded because they were found to have structural
lesions or tumours located in proximity to the speech areas of
interest; the remaining subjects were free of gross structural abnorm-
alities. Pre-operative scans were used in 42 cases. In two cases only
post-operative scans were available. These patients had undergone a
selective amygdalo-hippocampectomy with some resection in the
anterior temporal lobe; however, they were included in the study
as they did not reveal any important lesions near the temporal
speech regions of interest. Thus, 44 patients were included in the
volumetric analysis. For the VBM analysis one additional patient’s
scan was excluded (from the RSG) because it was of insufficient
technical quality.
Volumetry analysisMR image acquisition and analysisAll but one MRI scans were obtained on a Phillips Gyroscan system
with a 1.5 T superconducting magnet. The remaining MRI scan was
obtained on a Siemens 1.5 T system. Three-dimensional fast field
echo T1-weighted images [with TR (repetition time) range =
18–27 ms, TE (echo time) range = 6–10 ms and the flip angle
range = 30–45o, with 145–180 contiguous sagittal slices and 1 · 1
· 1 mm3 voxels] were acquired. The MR images were transformed
into standardized MNI stereotaxic space (Talairach and Tournoux,
1988) using an automatic nine-parameter linear algorithm (Collins
et al., 1994) based on the MNI 305 target. This procedure system-
atizes the orientation of orthogonal planes of section and permits
control over overall brain-size differences, while also allowing for
direct voxel-by-voxel comparisons across individual scans.
Operational identification of the borders of HG and the PTHG and the PT were identified and labelled using methods and
criteria developed by Penhune et al. (1996) and Westbury et al.
(1999) respectively (see Fig. 2). For the PT, volume was measured
two ways: including all tissue pertaining to the temporal plane
(Westbury method), as well as using the more conventional
knife-cut method, to allow better comparison of the results with
those of earlier ones (see Fig. 3).
Procedure and analysisHG and PT were manually labelled on all MR scans using DISPLAY
software (MacDonald et al., 1994). Both HG and PT were labelled by
a single rater (R.D.P.) who was blind to both speech group and
hemisphere (half the scans were randomly flipped across the x-axis
to ensure no bias in labelling of each hemisphere). Only grey-matter
voxels were labelled for the PT, while both grey and white-matter
voxels were labelled for HG. Volumes of labelled structures were
calculated by summing all labelled voxels. For HG, grey and white
matter were segmented using an automatic tissue classification
algorithm, which operates on an artificial neural network classifier
(Zijdenbos et al., 1996). Additionally for the PT, angulation slope, an
index of shape, was computed by fitting the labelled structure into a
three-dimensional bounding box, from which the minimum and
maximum x, y, z coordinates were extracted (see Westbury et al.,
1999, for further details). The slope was computed by taking the
height-over-length ratio.
VBM analysisThe second technique used to complement the manual labelling
analysis was VBM (Ashburner and Friston, 2000). This methodology
is described in greater detail elsewhere (see Paus et al., 1999;
Ashburner and Friston, 2000; Good et al., 2001; Watkins et al.,
2001). After stereotaxic normalization and tissue classification,
the binary grey-matter maps were smoothed using a Gaussian
smoothing kernel of 10-mm full-width at half-maximum, resulting
in three-dimensional maps of tissue concentration. We used VBM to
examine interhemispheric structural asymmetries across the whole
brain on a voxel-wise level; we therefore adopted a symmetrical
template as the target to which all individual volumes were regis-
tered. Using an asymmetric (i.e. standard) template could enhance
the asymmetries of the original data set (Watkins et al., 2001), but
the symmetrical template bypasses this problem. To investigate
interhemispheric asymmetries, we created image scans representing
the differences in the amounts of grey matter between left and right
hemispheres; thus the images were flipped across the midline (x = 0)
and subtracted from the unflipped images. A positive voxel value
on the left side of the final image corresponded to a higher signal
(i.e. more grey-matter concentration) on the left hemisphere than on
the right, and vice-versa; these final difference image scans were
then statistically analysed at each voxel producing t-statistic
Table 1 Clinical and demographic information for the three speech groups: LSG, RSG and BSG
Group Agemean (range)
Full-scale IQmean (range)
Handedness Gender Seizure onset(age range)
Seizure focus
R L MIX M F L R BI N/A
LSG (n = 20) 37 (20–61) 89 (72–112) 15 4 1 9 11 1–50 years 5 9 1 5RSG (N = 11) 36 (10–54) 81 (67–98) 4 6 1 4 7 1 month–25 years 8 0 1 2BSG (N = 13) 35 (11–48) 84 (67–100) 5 8 0 6 7 Birth–25 years 7 2 2 2
IQ was defined from the WAIS-R; handedness was based on a standard questionnaire; seizure focus was determined from side ofpredominant EEG abnormality; BI = bilateral, N/A = could not be determined. LSG = left speech group;RSG = right speech group; BSG = bilateral speech group.
Auditory cortex asymmetries Brain (2006), 129, 1164–1176 1167

maps, following a similar procedure to that used for functional data
(Worsley et al., 1996).
Two sets of analyses were performed. For the first analysis, the
difference maps were averaged across all three speech groups, to
look at the overall grey-matter concentration differences between
the two hemispheres irrespective of group. To correct for multiple
comparisons involved in searching across a brain volume a threshold
of t > 5.5, a P-significance level <0.05, 42 degrees of freedom (df), a
voxel size equal to 1 mm3, a smoothing kernel of 10 mm and a
standard volume of interest of 1000 cc were used (Worsley et al.,
1996). For the second analysis, the difference maps of the two uni-
lateral speech groups, RSG and LSG, were contrasted with one
another. We believed that any possible interhemispheric grey-
matter differences that existed would be best revealed by examining
these two particular speech groups since they demonstrated opposite
functional lateralization patterns; a threshold of t > 6.1 and df = 28
were used.
ResultsVolumetry analysisHeschl’s gyrusA repeated-measures ANOVA (analysis of variance) was per-
formed on the segmented grey- and white-matter HG labelled
volumes. The speech group (LSG/RSG/BSG) was the
between-subjects variable, and the hemisphere and tissue
type were the within-subjects variables. The analysis revealed
an overall leftward asymmetry that was significant for both
tissue types, Fgrey(1, 41) = 23.50, P < 0.0001; Fwhite(1, 41) =
24.16, P < 0.0001. Although there was no group · hemisphere
interaction, planned comparisons showed an asymmetry
favouring the left for both the LSG [Fgrey(1,41) = 15.22, P
< 0.001; Fwhite(1,41) = 13.33, P < 0.001] and the BSG
[Fgrey(1,41) = 13.24, P < 0.001; Fwhite(1,41) = 14.84,
P < 0.001] but not the RSG [Fgrey (1,41) = 1.60, P > 0.05;
Fwhite(1,41) = 1.84, P > 0.05]. These results are consistent
with those of Penhune et al. (1996) performed on normal
right-handed control subjects (presumably equivalent to the
LSG in this study). Importantly, the volumes of HG in the
patient population in the present study were within a com-
parable range as those of Penhune et al.’s normal control
subjects (see Fig. 4), and did not differ significantly (Pgrey= 0.34; Pwhite = 0.98) from them. A scatter plot displaying
total left and right HG volume for all individuals within each
of the three groups showed that three RSG subjects had a
pronounced right larger than left volume difference, larger
than that for any of the other subjects (see Fig. 5). These
results contributed to the lack of overall L > R volume
difference in the RSG.
Planum temporaleA repeated-measures ANOVA was performed on the PT
volumes labelled using the Westbury method. Speech
group was the between-subjects variable, and hemisphere
was the within-subjects variable. The analysis showed no
significant interhemispheric differences in PT volume across
the three speech groups, F(1,41) = 0.06, P > 0.05. There was
also no group · hemisphere interaction. Westbury et al.,
(1999) found similar results for a normal control group of
subjects (equivalent to the LSG in this study). Again, the
PT
H2
H1
PT
H2 H1 H1
PTPT PT
H1 H1 H2
PT
H2
H1 PT
H2 H1 H1
PT
Sagittal (x = -58) Horizontal (z = 8) Coronal (y = -16)
PT PT
H1 H1H2
Fig. 2 Identification and labelling of HG and PT. If two HGi were observed, the second HG was included as part of the PT. H1 = firstHeschl’s gyrus; H2 = second Heschl’s gyrus; PT = planum temporale.
1168 Brain (2006), 129, 1164–1176 R. Dorsaint-Pierre et al.

patients’ PT volumes were similar to the volumes of
Westbury et al.’s normal control subjects (see Fig. 6A). A
total of 22 subjects showed an L > R asymmetry and likewise
22 subjects showed an R > L asymmetry.
A similar analysis performed after the knife-cut method
was applied revealed a marginally significant interhemi-
spheric difference in PT volume across all three groups,
F(1,41) = 3.02, P = 0.09. Again there was no group · hemi-
sphere interaction. Previously, Westbury et al., (1999) did
show a significant interhemispheric difference for normal
control subjects using this method; here a similar trend
was apparent (see Fig. 6B). A total of 27 subjects showed
an L > R asymmetry, of whom 11 were from the LSG, whereas
17 subjects showed an R > L asymmetry, of whom nine were
from the LSG.
Finally, the ANOVA for the PT angulation measure
revealed a significant interhemispheric difference such that
the right side had a steeper slope across all three groups,
F(1,41) = 7.8, P < 0.01, confirming the findings of
Westbury et al. (1999), for normal control subjects (see
Fig. 6C). A total of 31 subjects showed an R > L asymmetry
whereas 13 subjects showed an L > R asymmetry. No group ·hemisphere interaction was found.
X = 55
Knife-cut line
SF
PT
HG
X= 55
Fig. 3 Illustration of how the knife-cut method was implementedon an MRI scan. Sagittal view of the labelled volume in the righthemisphere. A projection line (knife-cut line) mimicking the knifetrajectory along the SF was imagined and the labels falling abovethat line (blue dash lines) were removed. PT = planum temporale;HG = Heschl’s gyrus; SF = sylvian fissure.
A
0
500
1000
1500
2000
NC LSG RSG BSG
NC LSG RSG BSG
Lab
elle
d v
olu
me
(mm
3)
LH
RH
* *
0
200
400
600
800
1000
1200
Lab
elle
d v
olu
me
(mm
3)
LH
RH
***B
Fig. 4 Mean interhemispheric volume difference (6SE) measuredfor HG for the three speech groups compared with a normalcontrol group from the study of Penhune et al. (1996). (A)Grey-matter volumes. (B) White-matter volumes. NC = normalcontrol group; LSG = left speech group; RSG = right speech group;BSG = bilateral speech group; LH = left hemisphere; RH = righthemisphere. The asterisk (*) = significantinterhemispheric differences, P < 0.0001.
0
500
1000
1500
2000
2500
3000
3500
4000
4500
0 1000 2000 3000 4000
Right hemisphere volume (mm3)
Lef
t h
emis
ph
ere
volu
me
(mm
3)
LSG
RSG
BSG
U-RSG
Fig. 5 Scatterplot displaying the labelled volumes for HG (greyand white matter summed together) for the three speech groups,showing in particular the three RSG subjects (unusual-RSG:U-RSG) who had a more pronounced right larger than leftvolume difference.
Auditory cortex asymmetries Brain (2006), 129, 1164–1176 1169

VBM analysisIn the first VBM analysis the hemispheric difference maps
of the subjects across all three groups were averaged, yielding
the mean interhemispheric difference in grey-matter
concentration. Some of the most significant peaks obtained
were located in regions comparable with those previously
discussed in Watkins et al. (2001) (see Tables 2 and 3 in
supplementary section at Brain online). These include the
right frontal (x = 10, y = 61, z = 25) and left occipital (x
= �15, y = �86, z = 37) petalia, the right superior temporal
sulcus (x = 48, y =�23, z =�6 ) and the caudate nucleus (x =
15, y = 15, z = 17). Of greatest interest is the PT result, which
showed that there was more grey matter on average in the left
hemisphere compared with the right one in this region; the
statistical peak found at coordinates x = �44, y = �30, z = 12
(corresponding to BA 42 and/or BA 22) was significant,
t = 7.91, P < 0.05 (see Fig. 7A). The voxel value at that peak’s
coordinates was then extracted from the average map for each
subject across the three groups and these values were analysed
to better investigate the group distributions. All three speech
groups showed a similar distribution pattern (see Fig. 7B),
with most subjects showing a positive voxel value, indicative
of more grey matter on the left side than on the right. There
were no significant group differences found on a one-way
ANOVA, F(2,40) = 0.35, P > 0.05. Thus, the voxel-based
analysis was consistent with the manual PT labelling results
in showing an overall asymmetry that was identical across
all three speech groups.
In the second VBM analysis, the maps of the LSG and the
RSG were contrasted to give the mean interhemispheric
difference map of grey-matter concentration between those
two groups. An important finding was revealed in the left
posterior–inferior frontal cortex, functionally corresponding
to Broca’s area. The result showed that at this one point
there was more grey matter in the left hemisphere for the
LSG, whereas there was more grey matter in the right
hemisphere for the RSG. The statistical peak corresponding
approximately to BA 44 (Tomaiuolo et al., 1999)
(coordinates: x = �49, y = 8, z = 18; Fig. 8A) was the peak
with the highest t-value in this analysis, although it did not
reach conventional levels of significance correcting for multi-
ple comparisons (t = 4.51, Pcorrected > 0.1; Puncorrected <
0.00001). The voxel values were again extracted at that
peak’s coordinates and plotted to show the group distribu-
tions. Most of the LSG subjects showed a positive voxel value,
indicative of more grey matter in the left hemisphere, whereas
every single RSG subject showed a negative voxel value, indi-
cative of more grey matter in the right hemisphere
(see Fig. 8B).
A one-way ANOVA on these data, with speech group
the between-subjects variable and voxel-value difference
between left and right hemispheres the dependent variable,
revealed a significant speech group difference, F(2,40) =
11.30, P < 0.001. A Tukey HSD post hoc pairwise comparison
showed that the RSG was significantly different from both the
LSG (mean difference =�0.13, P = 0.002) and the BSG (mean
difference = �0.17, P < 0.001), but the LSG was not sig-
nificantly different from the BSG (mean difference =
�0.043, P = 0.38).
0
1000
2000
3000
4000
5000
6000
NC LSG RSG BSG
Lab
elle
d v
olu
me
(mm
3)
A
0.00
0.20
0.40
0.60
0.80
1.00
1.20
1.40
NC LSG RSG BSG
An
gu
lati
on
slo
pe
LH
RH
LH
RH
LH
RH
* ** *C
0
1000
2000
3000
4000
5000
NC LSG RSG BSG
Lab
elle
d v
olu
me
(mm
3) *
B
Fig. 6 Mean interhemispheric volume difference (6SE) measuredfor the PT. (A) Westbury method. (B) Knife-cut method.(C) Mean interhemispheric angulation difference (6SE) measuredfor the PT. All comparisons are between the three speech groupsand a normal control group from the study of Westburyet al. (1999). In B the asterisk (*) = significant interhemisphericdifferences, P < 0.05. In C the asterisk (*) = significantinterhemispheric differences, P < 0.05 (for NC) and 0.01(for LSG, RSG and BSG). Abbreviations as in Fig. 4.
1170 Brain (2006), 129, 1164–1176 R. Dorsaint-Pierre et al.

DiscussionVolumetry analysisHeschl’s gyrusThe volumetric results showed the expected asymmetries
favouring the left hemisphere for both HG white matter
and grey matter. More specifically, interhemispheric differ-
ences were found for the LSG and the BSG, but not for the
RSG. This was largely due to three RSG cases that had a
reverse asymmetry more pronounced than any other subjects.
This finding brings up an important issue related to the
RSG, which is whether these patients had right speech
representation innately or due to an early injury to the left
hemisphere that caused speech functions to reorganize to the
right hemisphere.
Earlier studies suggested that for speech to shift in the case
of early injury, the left-sided injuries need to have happened
before approximately the age of five years old, and quite large
areas within primary speech zones need to have suffered the
damage (Branch et al., 1964; Rasmussen and Milner, 1977).
However, more recent research modifies these claims. Studies
on aphasic patients showed that following left hemisphere
damage, language functions can reorganize to the right hemi-
sphere (e.g. Cappa and Vallar, 1992; Cappa et al., 1997;
Thulborn et al., 1999) even in older adults. Similarly, a func-
tional MRI (fMRI) study by Liegeois et al. (2004) showed that
speech did not necessarily reorganize to the right hemisphere
when lesions, however extensive, affected the primary speech
areas.
It could be hypothesized that the three unusual RSG cases
suffered some degree of atrophy in the left HG, resulting in
the right HG appearing larger. However, only one of the three
RSG cases had a slightly smaller than usual left volume.
-0.2
-0.15
-0.1
-0.05
0
0.05
0.1
0.15
0.2
0.25
0.3
0.35
Vo
xel v
alu
e (L
-R)
LSG RSG BSG
L>R
R>L
B
13.4
11.0
8.6
6.1
3.7
A
X = -44 Y = -30 Z = 12
t
Fig. 7 (A) Sagittal view of the left hemisphere. Voxel-based morphometric statistical map averaged across the three speech groupssuperimposed on the MRI scan of a single subject. A statistical peak in the region of the PT is shown here (arrow), which reveals aninterhemispheric asymmetry in grey-matter concentration in the PT across all three speech groups. (B) Distribution of the voxel valuesextracted at the statistical peak corresponding to the Talairach coordinates of the PT (�44, �30, 12) for the three speech groups. L > R =more grey-matter concentration in the left hemisphere; R > L = more grey-matter concentration in theright hemisphere. Other abbreviations as in Fig. 4.
Auditory cortex asymmetries Brain (2006), 129, 1164–1176 1171
The other two RSG cases were well within the normal range
for both left and right volumes. Thus, on average, atrophy per
se cannot explain the present findings. Conversely, it could be
that these three individuals represent a native reversal of the
typical structural asymmetry and that the others in the RSG
who show the typical HG pattern have retained the usual
structural asymmetry favouring the left hemisphere, while
undergoing functional reorganization of language functions
to the right hemisphere. It was difficult, on the basis of the
patients’ history to determine with any certainty whether the
right speech cases were due to innate or due to pathological
factors. The patients included in the analysis did not have
gross or extended morphological anomalies and the epilep-
togenic tissue was most often localized in the hippocampal
region relatively far from lateral cortical speech areas, arguing
against a lesion-driven reorganization. We conclude that
right speech representation appears to be a consequence of
a complex process where genetic, pathological, and environ-
mental factors may interact such that structural and func-
tional asymmetries can be dissociated in certain cases.
Planum temporaleAs expected, no interhemispheric PT volume differences were
found when the Westbury method was implemented, but
there was a clear PT angulation difference, such that the
right PT was more steeply angled than the left, corroborating
the findings of Westbury et al. (1999). In early papers (e.g.
Geschwind and Levitsky, 1968; Witelson and Pallie, 1973) it
was speculated that a relationship existed between PT size
asymmetry and functional asymmetry. But some later
researchers have argued against this original thought and
have suggested that PT shape asymmetry would relate to
functional asymmetry. The present findings bring more
evidence against the early speculation by showing that,
when the PP was included in the PT measurement, there
were no PT size or volume asymmetries, even in the LSG.
However, a relationship between PT shape or angulation
asymmetry and functional asymmetry was expected but
also failed to be observed; all three speech groups showed
the same rightward PT angulation difference. Previously,
interhemispheric asymmetry in PT volume was obtained
4.0
3.4
4.5
-0.25
-0.2
-0.15
-0.1
-0.05
0
0.05
0.1
0.15
0.2
0.25
Vo
xel v
alu
e (L
-R)
LSG RSG BSG
L>R
R>L
B
2.9
t A
X = -49 Y = 8 Z = 18 2.3
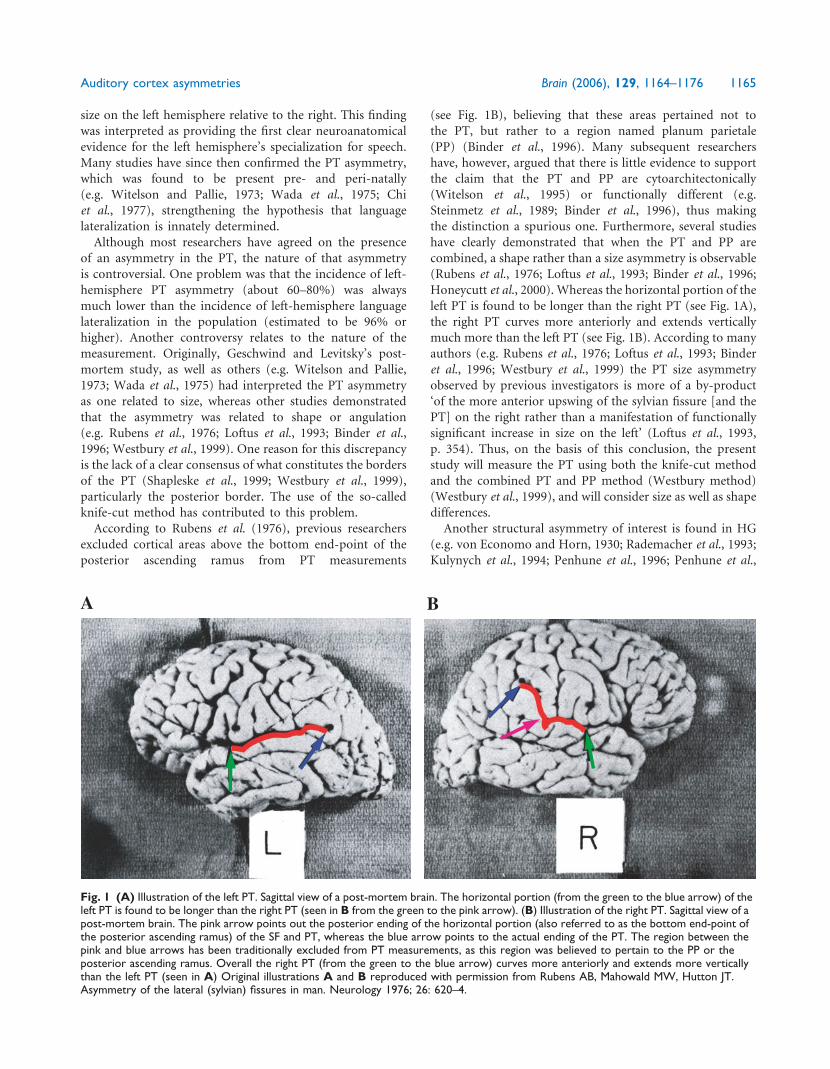
Fig. 8 (A) Sagittal view of the left hemisphere. Voxel-based morphometric statistical difference map contrasting the two speech groups,LSG and RSG, superimposed on the MRI scan of a single subject. A statistical peak in the pars opercularis, functionally known as Broca’sarea, is shown here (arrow), and it reveals an interhemispheric asymmetry where LSG had more grey matter in the left hemisphere thanRSG. (B) Distribution of the voxel values extracted at the statistical peak corresponding to the Talairach coordinates of the parsopercularis (�49, 8, 18) for the three speech groups. L > R = more grey-matter concentration in the left hemisphere;R > L = more grey-matter concentration in the right hemisphere. Other abbreviations as in Fig. 4.
1172 Brain (2006), 129, 1164–1176 R. Dorsaint-Pierre et al.

when the knife-cut method was used, but this PT difference
did not reach significance in the present study, although a
trend in the right direction was evident. In any case, since all
three speech groups showed the same apparent trend, it is
safe to conclude that neither with nor without the knife-cut
approach is the PT asymmetry related to language lateral-
ization. Taken together, these new findings suggest that
although PT morphological asymmetries are clearly evident,
they appear to bear no direct relationship to language
lateralization.
This conclusion is inconsistent with some prior studies that
have observed a different pattern of structural asymmetry in
the different speech groups. Ratcliff et al. (1980) found that
the right and BSGs had a reduced angiographic asymmetry
compared with the LSG, while Foundas et al. (1994) found a
reversal of the PT asymmetry in one right speech patient
compared with the left speech patients. However, Foundas
et al. only had one right speech patient, and the present
results suggest that when a larger sample is used, on average,
the RSG shows a similar asymmetry pattern as does the LSG.
Ratcliff et al.’s study had similar sample sizes to the present
one, and thus had sufficient power, but they measured only
the asymmetry in the SF indirectly via measuring the angle of
the middle cerebral artery. Thus, it can be speculated that
structural changes at the level of the artery are not necessarily
and directly reflected in the SF and consequently in the PT.
The present findings are, however, consistent with more
recent structural and functional studies that have forwarded
the notion that PT asymmetry may not relate to language
lateralization in any direct way (e.g. Binder et al., 1996;
Tzourio et al., 1998; Josse et al., 2003; Dos Santos Sequeira
et al., 2006; Eckert et al., 2006). Of direct relevance, two recent
studies, one by Eckert et al. (2006) and the other by Dos
Santos Sequeira et al. (2006), investigated whether the asym-
metry of the PT related to language lateralization in normal
individuals. Using an fMRI single-word comprehension task
and a dichotic listening task, respectively, to measure
language lateralization, both studies observed a leftward
PT asymmetry, but neither of them found that it corres-
ponded to language lateralization, reinforcing the present
findings.
Griffiths and Warren (2002) have reviewed many func-
tional imaging studies that have found activation in the
PT relative to different types of sound-processing tasks,
and these authors presented a model whereby the PT was
conceptualized as a region involved more generally in analy-
zing complex spectrotemporal patterns. Thus, the PT may
play a more general role in auditory processing rather than
a specific role in language-related processes, and thus may
not relate specifically to language lateralization as initially
conceived.
VBM analysisThe goal behind using the VBM analysis in the present study
was to (i) confirm the volumetric data and (ii) explore other
possible structural asymmetries in the brain that could relate
to language lateralization. Consistent with the volumetric
measures, the VBM results revealed an interhemispheric
difference favouring the left hemisphere in grey-matter con-
centration for the PT. Earlier VBM studies have also found
a clear left–right asymmetry in the PT in normal subjects
(Good et al., 2001; Watkins et al., 2001) and interpreted it
as one related to interhemispheric volume difference. Since
VBM detected an interhemispheric difference in the PT, and
we know from the volumetric analysis that volumes were not
significantly different across hemispheres, we are tempted to
conclude that the grey-matter concentration differences seen
in the VBM analysis are related to the shape differences
observed between the PTs, rather than to a volume difference.
Also, it should be mentioned that VBM failed to detect the
grey- and white-matter volume differences found via the
volumetric analysis in HG. Taken together, these findings
suggest that, although VBM is sensitive to morphologically
based differences between the two hemispheres, these differ-
ences need not be related solely to volume (see also Tisserand
et al., 2004). Insofar as the VBM findings were similar across
all three speech groups, we again conclude that inter-
hemispheric PT differences, whether due to shape or not,
do not relate directly to speech lateralization.
The more relevant finding obtained via VBM was an inter-
hemispheric difference in grey-matter concentration in
the posterior part of the inferior frontal gyrus (i.e. pars
opercularis, corresponding functionally to Broca’s area),
between the LSG, who showed a greater left than right-
hemisphere grey-matter concentration, and the RSG, who
showed the opposite asymmetry. Since this was the statistical
peak of highest significance in the present analysis, and given
that this is a strongly predictable region, the interhemispheric
difference in the pars opercularis can be clearly considered a
reliable finding. Furthermore, the analysis at the voxel-value
level showed that all the individuals within the RSG had more
grey-matter concentration favouring the right hemisphere,
whereas most LSG subjects had grey-matter concentration
favouring the left hemisphere. These results suggest that
the structural asymmetry in the pars opercularis may repre-
sent an important neuroanatomical substrate for language
lateralization.
An important question is whether the grey-matter concen-
tration difference observed in the pars opercularis is one
related to volume or to shape differences, as discussed earlier
for the PT-related findings. Tomaiuolo et al. (1999) found no
significant interhemispheric differences in this region using
volumetry, but other studies did observe a left–right
asymmetry in this region, favouring the left hemisphere
(Foundas et al., 1998; Amunts et al., 1999). Although these
studies measured volume, they did not consider whether
shape differences existed. Thus, from the present state of
results, it is not possible to clearly attribute the observed
grey-matter concentration differences in the present data
as a difference in the shape or volume of the pars opercularis.
Since these interhemispheric differences appear to bear some
Auditory cortex asymmetries Brain (2006), 129, 1164–1176 1173

relationship to speech lateralization, further research of this
region is definitely warranted.
Methodological issuesOne important limiting factor in the present study is that
measures were taken in epileptic patients who may have
atypical brain anatomy due to atrophy or other factors.
Thus, the present structural and VBM findings should be
considered with caution. Nonetheless, given that two recent
studies (Eckert et al., 2006; Dos Santos Sequeira et al., 2006)
found similar structural results in normal individuals, it
seems unlikely that the present results apply exclusively to
the epilepsy population. Also, there does not appear to be any
evidence for atrophy in the regions measured, since the
distributions of volumes of the relevant structures were
comparable with those of normal control samples from
previous studies (Penhune et al., 1996; Westbury et al.,
1999). Thus, it is unlikely that atrophy per se of the structures
of interest played any role in the results. It should also be
noted that these subjects’ volumes were transformed into
standardized stereotaxic space, whose main advantage is to
correct for overall volume differences (see Westbury et al.,
1999). Thus, the interhemispheric differences observed are
related to the concerned region of interest and uncontami-
nated by possible total volume differences. Another metho-
dological point is that the volumes were measured blind, such
that no bias could have been introduced, a precaution not
always taken in such studies.
Structure–function relationship related tospeech processingFrom the results based on the volumetric and VBM analyses,
two regions have been found to bear at least some relation-
ship with language lateralization: HG and Broca’s area. Two
hypotheses can be proposed to explain this possible
structure–function relationship. For HG, it was seen that
only three RSG subjects showed a right larger than left
volume asymmetry; the other eight RSG individuals had
the same left larger than right volume asymmetry as the
LSG and the BSG subjects. This suggests that the anatomical
asymmetry does not necessarily follow the direction of the
functional asymmetry. In other words, the structure–function
relationship is not obligatory in HG. The fact that deaf
subjects also showed the expected left larger than right
volume differences in the absence of auditory stimulation
(Emmorey et al., 2003; Penhune et al., 2003) provides further
evidence to suggest that morphological asymmetries in the
auditory cortex regions may be predetermined at an early
developmental stage. Nonetheless, these auditory regions
may still interact to some extent with environmental
input. For example, Schneider et al., (2002) showed that
professional musicians displayed larger Heschl’s gyri than
non-musicians.
On the other hand, for the pars opercularis, it was seen that
every one of the individuals within the RSG had a right
greater than left difference of grey-matter concentration.
Thus, the anatomical asymmetries in this region seem to
be more closely related to the functional asymmetry. This
relationship may reflect a use-dependent reorganization.
The left pars opercularis is related to speech production
and is close to motor and premotor cortices. Many VBM
studies have found volume increases in motor regions related
to use-dependent factors. For example, Schlaug (2001)
showed that the motor cortex region of musicians revealed
grey-matter volume changes corresponding to the hand use
of these musicians. Also, Penhune et al. (2003) found that
deaf subjects, who use the right hand for signing, showed
an increase of grey-matter density in their left motor hand
region. Thus, we speculate that the morphological asymme-
tries observed here in the LSG, and its right-hemisphere
homologue in the RSG, may also be use-dependent. In
other words, patients with right-hemisphere speech may
employ more the right motor-related regions in the
expression of speech functions, and, conversely, patients
with left-hemisphere speech may employ more the left
motor-related regions.
Thus, in conclusion, whereas HG morphological asymme-
try may be predetermined and more resistant to change, the
pars opercularis morphological asymmetry may be related to
use-dependent factors. Asymmetries in these two regions
appear to bear a stronger relationship to language laterali-
zation than the PT.
Supplementary materialSupplementary data are available at Brain Online.
AcknowledgementsWe wish to thank Dr Alan Evans for making available the
brain-imaging center facilities. We also thank Dr Marilyn
Jones-Gotman for providing information on the Sodium
Amytal data, and the staff of the Neuropsychology Unit
for carrying out the IAP testing. This research work was
supported by grants from the CIHR (Canadian Institutes
of Health Research) and the McDonnell-Pew Cognitive
Neuroscience program awarded to R.J.Z. as well as a
FCAR (Formation de Chercheurs et l’Aide a la Recherche)
scholarship to the first author.
References
Amunts K, Schleicher A, Burgel U, HarmutM, Uylings HBM, Zilles K. Broca’s
region revisited: cytoarchitecture and intersubject variability. J Comp
Neurol 1999; 412: 319–41.
Anderson B, Southern BD, Powers RE. Anatomic asymmetries of the posterior
superior temporal lobes: a postmortem study. Neuropsychiatry Neurop-
sychol Behav Neurol 1999; 12: 247–54.
Ashburner J, Friston K. Voxel-based morphometry—the methods. Neuro-
image 2000; 11: 805-21.
Binder J, Frost J, Hammeke T, Rao S, Cox R. Function of the left planum
temporale in auditory and linguistic processing. Brain 1996; 119: 1239–47.
1174 Brain (2006), 129, 1164–1176 R. Dorsaint-Pierre et al.

Branch C, Milner B, Rasmussen T. Intracarotid sodium Amytal for the
lateralization of cerebral speech dominance: observations in 123 patients.
J Neurosurg 1964; 21: 399–405.
Cappa SF, Perani D, Grassi F, Bressi S, Alberoni M, Franceschi M, et al. A PET
follow up study of recovery after stroke in acute aphasics. Brain Lang 1997;
56: 55–67.
Cappa SF, Vallar G. The role of the left and right hemispheres in recovery from
aphasia. Aphasiology 1992; 6: 359–72.
Chi JG, Dooling EC, Gilles FH. Left-right asymmetries of the temporal speech
areas of the human fetus. Arch Neurol 1977; 34: 346–8.
Collins D, Neelin P, Peters T, Evans A. Automatic 3D intersubject registration
of MR volumetric data in standardized Talairach space. J Comput Assist
Tomogr 1994; 18: 192–205.
Di Chiro G. Angiographic patterns of cerebral convexity veins and superficial
dural sinuses. Am J Roentgenol Radium Ther Nucl Med 1962; 87: 308–21.
Dos Santos Sequeira S, Woerner W, Walter C, Kreuder F, Lueken U,
Westerhausen R, et al. Handedness, dichotic-listening ear advantage,
and gender effects on planum temporale asymmetry—a volumetric inves-
tigation using structural magnetic resonance imaging. Neuropsychologia
2006; 44: 622–36.
Eckert MA, Leonard CM, Possing ET, Binder JR. Uncoupled leftward
asymmetries for planum morphology and functional language processing.
Brain and Language 2006. In press.
Emmorey K, Allen JS, Bruss J, Schenker N, Damasio H. A morphometric
analysis of auditory brain regions in congenitally deaf adults. Proc Natl
Acad Sci USA 2003; 100: 10049–54.
Foundas A, Leonard C, Gilmore R, Fennell E, Heilman K. Planum temporale
asymmetry and language dominance. Neuropsychologia 1994; 32: 1225–31.
Foundas AL, Eure KF, Luevano LF, Weinberger DR. MRI asymmetries of
Broca’s area: the pars triangularis and pars opercularis. Brain Lang 1998; 64:
282–96.
Geschwind N, Levitsky W. Human brain: left-right asymmetries in the
temporal speech region. Science 1968; 161: 186–7.
Good CD, Johnsrude I, Ashburner J, Henson RNA, Friston KJ, Frackowiak
RSJ. Cerebral asymmetry and the effects of sex and handedness on brain
structure: a voxel-basedmorphometric analysis of 465 normal adult human
brains. Neuroimage 2001; 14: 685–700.
Griffiths T, Warren J. The planum temporale as a computational hub. Trends
Neurosci 2002; 25: 348–53.
Honeycutt NA, Musick A, Barta PE, Pearlson GD. Measurement of the
planum temporale (PT) on magnetic resonance imaging scans: temporal
PT alone and with parietal extension. Psychiatry Res Neuroimaging 2000;
98: 103–16.
Hutsler J, Gazzaniga M. Acetylcholinesterase staining in human auditory and
language cortices—regional variation of structural features. Cereb Cortex
1996; 6: 260–70.
Jancke L, Steinmetz H. Auditory lateralization and planum temporale
asymmetry. Neuroreport 1993; 5: 169–72.
Jones-Gotman M. Intracarotid amobarbital testing in presurgical evaluation
of patients with epilepsy. Rev Neuropsychol 1997; 7: 171–84.
Josse G, Mazoyer B, Crivello F, Tzourio-Mazoyer N. Left planum temporale:
an anatomical marker on left hemispheric specialization for language
comprehension. Cognitive Brain Res 2003; 18: 1–14.
Kulynych JJ, Vladar K, Jones DW, Weinberger DR. Gender differences in the
normal lateralization of the supratemporal cortex: MRI surface-rendering
morphometry of Heschl’s gyrus and the planum temporale. Cereb Cortex
1994; 4: 107–18.
Liegeois F, Connelly A, Cross JH, Boyd SG, Gadian DG, Vargha-Khadem F,
et al. Language reorganization in children with early-onset lesions of the left
hemisphere: an fMRI study. Brain 2004; 127: 1229–36.
Loftus W, Tramo M, Thomas C, Green R, Nordgren R, Gazzaniga M. Three-
dimensional quantitative analysis of hemispheric asymmetry in the human
superior temporal region. Cereb Cortex 1993; 3: 348–55.
MacDonald J, Avis D, Evans A. Multiple surface identification and matching
in magnetic resonance images. Proc Soc Vis Biomed Comput 1994; 2359:
160–9.
McRae DL, Branch CL, Milner B. The occipital horns and cerebral
dominance. Neurology 1968; 18: 95–8.
Paus T, Zijdenbos A, Worsley K, Collins DL, Blumenthal J, Giedd JN, et al.
Structural maturation of neural pathways in children and adolescents: in
vivo study. Science 1999; 283: 1908–11.
Penhune VB, Cismaru R, Dorsaint-Pierre R, Petitto L-A, Zatorre RJ.
The morphometry of auditory cortex in the congenitally deaf measured
using MRI. Neuroimage 2003; 20: 1215–25.
Penhune VB, Zatorre RJ, MacDonald JD, Evans AC. Interhemispheric
anatomical differences in human primary auditory cortex: probabilistic
mapping and volume measurement from magnetic resonance scans.
Cereb Cortex 1996; 6: 661–72.
Perria L, Rosadini G, Rossi G. Determination of side of cerebral dominance
with amobarbital. Arch Neurol 1961; 4: 173–81.
Pujol J, Lopez-Sala A, Deus J, Cardoner N, Sebastian-Galles N, Conesa G, et al.
The lateral asymmetry of the human brain studied by volumetric magnetic
resonance imaging. Neuroimage 2002; 17: 670–9.
Rademacher J, Caviness VS, Steinmetz H, Galaburda AM. Topographical
variation of the human primary cortices: implications for neuroimaging,
brain mapping and neurobiology. Cereb Cortex 1993; 3: 313–29.
Rademacher J, Morosan P, Schormann T, Schleicher A,Werner C, FreundHJ,
et al. Probabilistic mapping and volume measurement of human primary
auditory cortex. Neuroimage 2001; 13: 669–83.
Rasmussen T, Milner B. The role of early left-brain injury in determining
lateralization of cerebral speech functions. Ann NY Acad Sci 1977; 299:
355–69.
Ratcliff G, Dila C, Taylor L, Milner B. The morphological asymmetry of the
hemispheres and cerebral dominance for speech: a possible relationship.
Brain Lang 1980; 11: 87–98.
Risse GL, Gates JR, Fangman MC. A reconsideration of bilateral language
representation based on the intracarotid amobarbital procedure. Brain
Cogn 1997; 33: 118–32.
Rubens AB, Mahowald MW, Hutton JT. Asymmetry of the lateral (sylvian)
fissures in man. Neurology 1976; 26: 620–4.
Schlaug G. The brain of musicians. A model for functional and structural
adaptation. Ann NY Acad Sci 2001; 930: 281–99.
Schneider P, Scherg M, Dosch HG, Specht HJ, Gutschalk A, Rupp A.
Morphology of Heschl’s gyrus reflects enhanced activation in the auditory
cortex of musicians. Nat Neurosci 2002; 5: 688–94.
Seldon HL. Structure of human auditory cortex I: cytoarchitectonics and
dendritic distributions. Brain Res 1981a; 229: 277–94.
Seldon HL. Structure of human auditory cortex II: axon distributions and
morphological correlates of speech perception. Brain Res 1981b; 229:
295–310.
Seldon HL. Structure of human auditory cortex III: statistical analysis of
dendritic trees. Brain Res 1982; 249: 211–21.
Shapleske J, Rossell SL, Woodruff PWR, David AS. The planum temporale: a
systematic, quantitative review of its structural, functional and clinical
significance. Brain Res Brain Res Rev 1999; 29: 26–49.
Steinmetz H, Rademacher J, Huang Y, Hefter H, Zilles K, Thron A, et al.
Cerebral asymmetry: MR planimetry of the human planum temporale.
J Comput Assist Tomogr 1989; 13: 996–1005.
Steinmetz H, Volkmann J, Jancke L, Freund H-J. Anatomical left-right
asymmetry of language-related temporal cortex is different in left- and
right-handers. Ann Neurol 1991; 29: 315–19.
Strauss E, LaPointe JS, Wada JA, Gaddes W, Kosaka B. Language dominance:
correlation of radiological and functional data. Neuropsychologia 1985; 23:
415–20.
Talairach J, Tournoux P. Co-planar stereotaxic atlas of the human brain. New
York: Thieme Medical Publishers, Inc.; 1988.
Tallal P, Miller S, Fitch R. Neurobiological basis of speech: a case for the
pre-eminence of temporal processing. Ann NY Acad Sci 1993; 682: 27–47.
Thulborn KR, Carpenter PA, Just MA. Plasticity of language-related brain
function during recovery from stroke. Stroke 1999; 30: 749–54.
Tisserand DJ, van Boxtel MP, Pruessner JC, Hofman P, Evans AC, Jolles J.
A voxel- based morphometric study to determine individual differences in
Auditory cortex asymmetries Brain (2006), 129, 1164–1176 1175

gray matter density associated with age and cognitive change over time.
Cereb Cortex 2004; 14: 966–73.
Tomaiuolo F, MacDonald JD, Caramanos Z, Posner G, Chiavaras M,
Evans AC, et al. Morphology, morphometry and probability mapping of
the pars opercularis of the inferior frontal gyrus: an in vivo MRI analysis.
Eur J Neurosci 1999; 11: 3033–46.
Tzourio N, Nkanga-Ngila B, Mazoyer B. Left planum temporale surface
correlates with functional dominance during story listening. Neuroreport
1998; 9: 829–33.
von Economo C, Horn L. Uber Windungsrelief, masse und Rindenarchitek-
tonik der Supratemporalflache, ihre individuellen und ihre Seitenun-
terschiede. Z Neurol Psychiat 1930; 130: 678–757.
Wada JA, Clarke R, Hamm A. Cerebral hemispheric asymmetry in humans:
cortical speech zones in 100 adult and 100 infant brains. Arch Neurol 1975;
32: 239–46.
Watkins KE, Paus T, Lerch JP, Zijdenbos A, Collins DL, Neelin P, et al.
Structural asymmetries in the human brain: a voxel-based statistical
analysis of 142 MRI scans. Cereb Cortex 2001; 11: 868–77.
Westbury CF, Zatorre RJ, Evans AC. Quantifying variability in the planum
temporale: a probability map. Cereb Cortex 1999; 9: 392–405.
Witelson S, Pallie W. Left hemisphere specialization for language in
the newborn: neuroanatomical evidence of asymmetry. Brain 1973; 96:
641–6.
Witelson SF, Glezer II, Kigar DL. Women have a greater density of neurons in
the posterior temporal cortex. J Neurosci 1995; 15: 3418–28.
Witelson SF, Kigar DL. Asymmetry in brain function follows asymmetry
in anatomical form: gross, microscopic, postmortem and imaging studies.
In: Boller F, Grafman J, editors. Handbook of neuropsychology. Vol 1.
Amsterdam: Elsevier Science BV; 1988. p. 111–42.
Worsley K, Marrett S, Neelin P, Vandal A, Friston K, Evans A. A unified
statistical approach for determining significant signals in images of cerebral
activation. Neuroimage 1996; 4: 58–73.
Zatorre RJ. Perceptual asymmetry on the dichotic fused words test and
cerebral speech lateralization determined by the carotid sodium Amytal
test. Neuropsychologia 1989; 27: 1207–19.
Zatorre RJ, Belin P, Penhune VB. Structure and function of auditory cortex:
music and speech. Trends Cogn Sci 2002; 6: 37–46.
Zijdenbos A, Evans A, Riahi F, Sled J, Chui H-C, Kollokian V. Automatic
quantification of multiple sclerosis lesion volume using stereotaxic space.
Proc Int Conf Visual Biomed Comput 1996: 439–48.
1176 Brain (2006), 129, 1164–1176 R. Dorsaint-Pierre et al.