Embed Size (px)
Citation preview
Journal of Science and Sustainable Development (JSSD), 2019, 7(1), 20-31Copyright © Ambo UniversityISSN: 2304-2702 (print); 2414-4479 (online)DOI: https://doi.org/10.20372/au.jssd.7.1.2019.093 [20]
Journal of Science and Sustainable Development (JSSD), 2019, 7(1), 20-31 ISSN: 2304-2702 (print)
Agronomic Performance of Food Barley (Hordeum vulgare L.) Varieties and Their Response to Seed Rate at Elfeta District, West Showa Zone, Oromia National Regional State
Teferi Tolesa1, Habtamu Ashagre2, Tolera Abera3
1Elfeta Agriculture and Natural Resource Office, Elfeta, West Showa Zone 2Ambo University, College of Agriculture and Veterinary Sciences, Department of Plant Sciences
3Ambo Research Centre, Ambo, Ethiopia Corresponding author E-mail: [email protected]
Abstract
Barley is one of the most important, economically valuable and widely used cereal crops in Ethiopia. However, barley yield and productivity is constrained by lack of improved varieties, use of unimproved production packages among which seed rate is major one. Hence, an experiment was conducted to identify better performing food barley variety and determine the optimal seed rate at Elfeta district of West Showa Zone of Oromia National Regional State in 2017 main cropping season. The experiment was laid out in a Randomized Complete Block Design with three replications. The treatments were factorial combination of three improved (Cross41/98, HB19/65, HB19/66 varieties) and one local cultivar, and four seed rates (75, 100, 125 and 150 kg ha-1). The result of the study revealed that food barley varieties significantly differ in phonological parameters, such as days to 90% heading, grain filling period, and days to 90% maturity. Yield and yield components of barley including plant height, spike length, thousand seed weight and harvest index were significantly (p<0.01) influenced by the main effect of variety and seed rate. However, total number of tillers, number of effective tillers, grains per spike, and grain, straw, and biomass yields were significantly (p<0.01) influenced by interaction effect of variety and seed rate. Variety HB19/66 and seed rate of 125 kg ha-
1gave significantly high grain yield (6.23 tons ha-1). The highest net benefit of ETB 38,923 ha-
1 with marginal rate of return of 933% and value to cost ratio of ETB 27 per unit investment was obtained from use of 125 kg ha-1 seeding rate for food barley. Therefore, use of HB19/66 variety with 125 kg ha-1 seeding rate is profitable and recommended to the study area.
Key words: Barley varieties, seed rate, yield, yield component
Introduction
Barley (Hordeum vulgare L.) is one of the most important, economically valuable and widely used cereal crops. It is the oldest cultivated crops and has been grown in the highland parts of Ethiopia and various sources agree that it has been in cultivation for at least the past 5000 years and it is cultivated in all regions of the country (Kemelew and Alemayehu, 2011; Girma, 2014). According to Hadado et al. (2010), landraces represent over 90% of the cultivated barley diversity of Ethiopia and reflect deeply rooted and ancient relationship between barley and Ethiopian farmers.
Barley is the fourth most important cereal crop in the world after wheat, maize and rice (FAO, 2017) and is among the top ten crop plants in the world. Ethiopia is ranked 21th in the world in terms of barley production with a share of 1.2%
of the world’s total production and the second largest barley producer in Africa, next to Morocco and followed by Algeria, accounting about 25% of the total barley production in the continent (Samuel, 2016). In Ethiopia, barely is a dependable source of food in the highlands as it is produced during the main and short rainy seasons as well as under residual moisture (Malle et al., 2015). The main cropping season in most parts of Ethiopia is from June to September in the south western and central parts of Ethiopia (Wosene et al., 2015). There are two types of barley in Ethiopia: food barley for human consumption and malt barley which can be converted into malt.
During 2016 /2017, cropping season barley covered 959,273.36 ha of land which is about 7.63% of the total land devoted to cereal and about 2, 024,921.68 tons of production, equivalent to 6.97% of the total cereal
Teferi et al. [21]
Journal of Science and Sustainable Development (JSSD), 2019, 7(1), 20-31 ISSN: 2304-2702 (print)
production in the country and produce average yield of 2.11 ton ha-1 (CSA, 2017). In Oromia National Regional State, its area coverage was 454,662.78 ha with total production of 1,093,944.81 ton and average yield of 2.41 tons ha-1 (CSA, 2017). Although West Showa Zone represents a significant barley producing area, it was cultivated in more than 62,064.53 ha with a total annual production of 145,136.32 tons, with an average yield of 2.34 tons ha-1 (CSA, 2017). In Elfeta district, where the experiment was conducted, barley is the first most important cereal crop in area coverage and second in terms of production next to maize. It covers 4346 ha with a total production of 11,338.8 tons, and 2.61 tons ha-1 average productivity (EANRO, 2016).
Despite its importance and cultivation, the yield and productivity of barley in the country is low compared to its potential (Berhane et al., 1996). Several abiotic and biotic factors have contributed to low productivity, such as poor crop management practices, use of inappropriate seed rate, use of low yielding cultivars, limited availability of improved varieties, poor soil fertility, pests and the inherently low yield potential of the existing local varieties (Woldeyesus and Chilot, 2002; Bayehe and Stefania, 2011).
Seeding rate is one of the most important factors in crop production. Higher grain yield with better quality requires appropriate seeding rate (Soomro et al., 2009; Ali et al., 2010). Increase in seed rate above optimum level may only enhance production cost without any increase in grain yield (Sajjad et al., 2010). The optimum seed rate depends on different factors, the most important factors include: location, climatic conditions, soil, sowing time, and varieties. Since cultivars genetically differ for yield components, individual varieties need to be tested at a wide range of seeding rates to determine their optimum seeding rate (Wiersma, 2002). Therefore, the objectives of this study were to identify the better performing barley variety and to determine the economic optimum level of seed rate for barley production in the study area.
Materials and methods Description of the study area
The study was conducted at Elfeta district, West Showa Zone of Oromia National Regional State, on farmer’s training center during 2017 cropping season. Elfeta district is located 126 km far from Addis Ababa towards the West and 68km from Ambo to the North. The research was conducted at Falecha kebele which is 12 km far from Beke town in South West direction. The annual minimum and maximum temperatures of Elfeta area were 13 and 27 oC, respectively, with average temperature of 20 oC (EANRO, 2015). The main rainy season starts early June and goes up to end of September with total annual rainfall of 900 -1300 mm (EANRO, 2015). Geographical location of the study site lies between 8-9oN latitude and 37-38oE longitude at an altitude ranging from 1900–3100 m.a.s.l. Its soil type is Nitosol.
Treatments and Experimental Design
The experiment consisted of three food barley varieties (Cross 41/98, HB19/65, and HB19/66) and one local cultivar, and four seed rates (75, 100, 125, and 150 kg ha-1). The treatment was laid out in Randomized Complete Block Design (RCBD) in factorial arrangement with three replications. Fertilizer was applied at the rate of 100 kg of NPS and 75 kg N/ha as per the recommendation of Ethiopia Ministry Agriculture (EMA, 2011). The full dose of NPS (18-38-7.5) and one third of N in the form of urea was applied at planting time close to seed drilling line. The remaining 2/3 of the nitrogen was applied at tillering stage (Getachew et al., 2011). The fertilizer was applied uniformly to all plots. The plot size was 3 m * 2 m (6 m2) consisting of 10 rows of which one row is left as a border row on both sides of the plot to reduce the border effects. The yield data was collected from the eight central rows with a net plot size of 4.8 m2, while other growth parameters were recorded from randomly selected pre-tagged 5 plants fro those central rows in each plot. The spacing between rows and plots were 0.2 and 0.5 m, respectively. All agronomic practices were done following improved food barley production system.
Data collection and measurements
Data was collected on days to 50% of emergence, total number of tillers per plants, number of effective tillers per plants, days to
Agronomic Performance of Food Barley (Hordeum vulgare L.) Varieties [22]
Journal of Science and Sustainable Development (JSSD), 2019, 7(1), 20-31 ISSN: 2304-2702 (print)
90% heading, grain filling period, days to 90% maturity, plant height, spike length, number of grains per spike, thousand seed weight, straw yield, biomass yield, grain yield and harvest index.
Statistical Analysis
The data was subjected to analysis of variance following Generalized Linear Model procedure of SAS software version 9.0 (SAS, 2004) and the interpretation was made following the procedure of Gomez and Gomez (1984). Significance differences between treatments were separated using the (LSD) test (Steel and Torrie, 1980) at 5% level of significance. Further analysis like correlation analysis was made to determine relations between phenological growth parameter, and yield and yield components.
Economic Analysis
The partial budget analysis was done following CIMMYT (1988) to determine the economic feasibility of seed rates of food barley varieties.
The average yield was adjusted downward by 10% to reflect the difference between the experimental yield and the yield farmers could expect from the same agronomic practices (CIMMYT, 1988). The analysis was done using the prevailing market prices for inputs at planting and for the output at the time of crop harvest. The net benefit was calculated as the difference between the gross field benefit (EB ha-1) and the total costs (EB ha-1) that varied.
Results and discussion
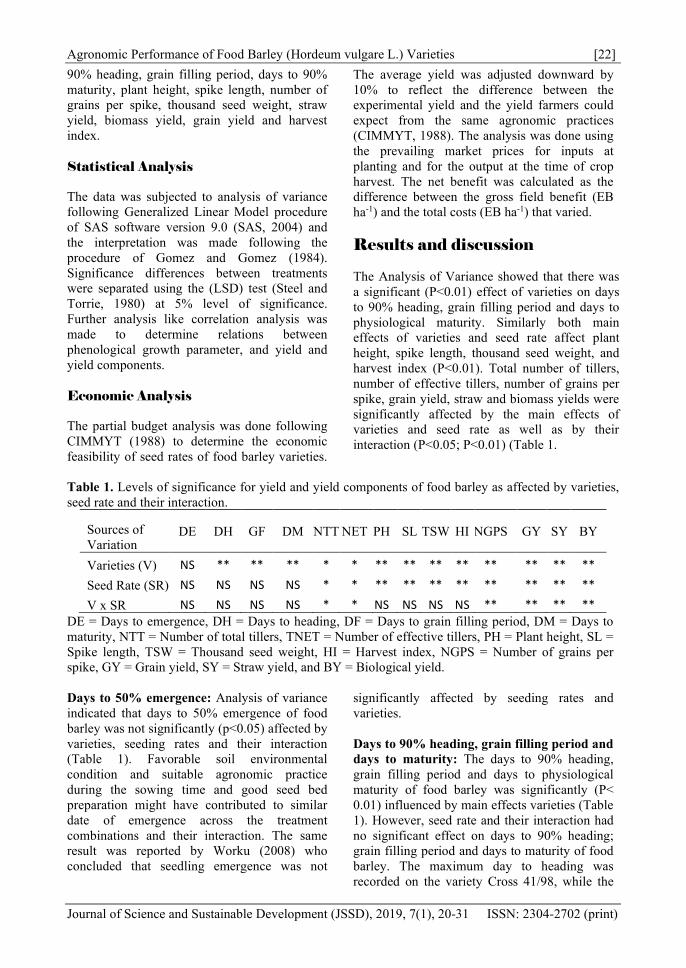
The Analysis of Variance showed that there was a significant (P<0.01) effect of varieties on days to 90% heading, grain filling period and days to physiological maturity. Similarly both main effects of varieties and seed rate affect plant height, spike length, thousand seed weight, and harvest index (P<0.01). Total number of tillers, number of effective tillers, number of grains per spike, grain yield, straw and biomass yields were significantly affected by the main effects of varieties and seed rate as well as by their interaction (P<0.05; P<0.01) (Table 1.
Table 1. Levels of significance for yield and yield components of food barley as affected by varieties, seed rate and their interaction.
Sources of Variation
DE DH GF DM NTT NET PH SL TSW HI NGPS GY SY BY
Varieties (V) NS ** ** ** * * ** ** ** ** ** ** ** ** Seed Rate (SR) NS NS NS NS * * ** ** ** ** ** ** ** ** V x SR NS NS NS NS * * NS NS NS NS ** ** ** **
DE = Days to emergence, DH = Days to heading, DF = Days to grain filling period, DM = Days to maturity, NTT = Number of total tillers, TNET = Number of effective tillers, PH = Plant height, SL = Spike length, TSW = Thousand seed weight, HI = Harvest index, NGPS = Number of grains per spike, GY = Grain yield, SY = Straw yield, and BY = Biological yield.
Days to 50% emergence: Analysis of variance indicated that days to 50% emergence of food barley was not significantly (p<0.05) affected by varieties, seeding rates and their interaction (Table 1). Favorable soil environmental condition and suitable agronomic practice during the sowing time and good seed bed preparation might have contributed to similar date of emergence across the treatment combinations and their interaction. The same result was reported by Worku (2008) who concluded that seedling emergence was not
significantly affected by seeding rates and varieties.
Days to 90% heading, grain filling period and days to maturity: The days to 90% heading, grain filling period and days to physiological maturity of food barley was significantly (P< 0.01) influenced by main effects varieties (Table 1). However, seed rate and their interaction had no significant effect on days to 90% heading; grain filling period and days to maturity of food barley. The maximum day to heading was recorded on the variety Cross 41/98, while the
Teferi et al. [23]
Journal of Science and Sustainable Development (JSSD), 2019, 7(1), 20-31 ISSN: 2304-2702 (print)
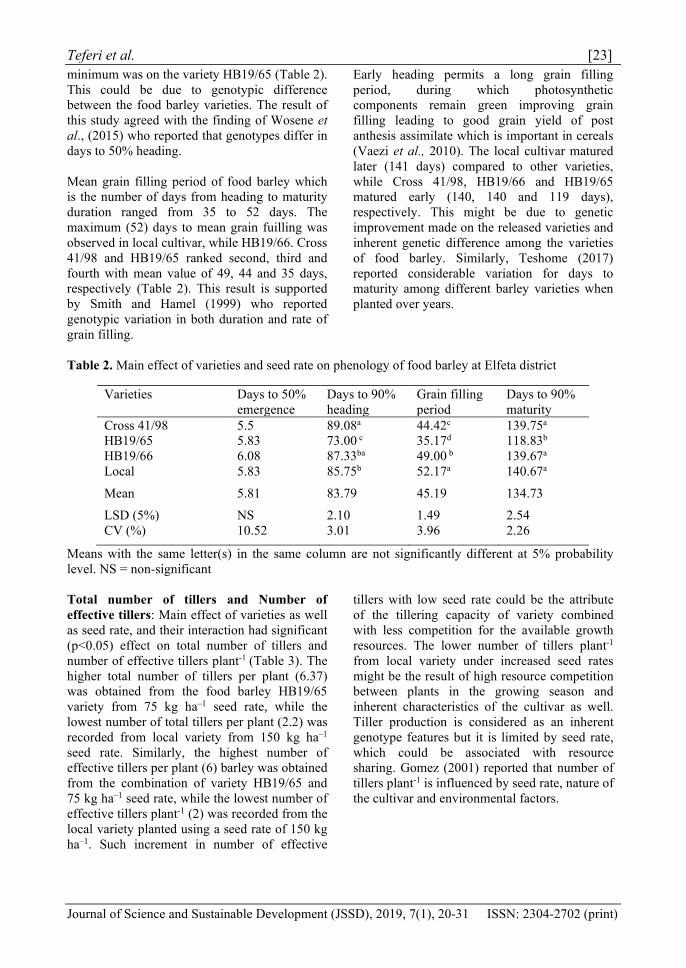
minimum was on the variety HB19/65 (Table 2). This could be due to genotypic difference between the food barley varieties. The result of this study agreed with the finding of Wosene et al., (2015) who reported that genotypes differ in days to 50% heading.
Mean grain filling period of food barley which is the number of days from heading to maturity duration ranged from 35 to 52 days. The maximum (52) days to mean grain fuilling was observed in local cultivar, while HB19/66. Cross 41/98 and HB19/65 ranked second, third and fourth with mean value of 49, 44 and 35 days, respectively (Table 2). This result is supported by Smith and Hamel (1999) who reported genotypic variation in both duration and rate of grain filling.
Early heading permits a long grain filling period, during which photosynthetic components remain green improving grain filling leading to good grain yield of post anthesis assimilate which is important in cereals (Vaezi et al., 2010). The local cultivar matured later (141 days) compared to other varieties, while Cross 41/98, HB19/66 and HB19/65 matured early (140, 140 and 119 days), respectively. This might be due to genetic improvement made on the released varieties and inherent genetic difference among the varieties of food barley. Similarly, Teshome (2017) reported considerable variation for days to maturity among different barley varieties when planted over years.
Table 2. Main effect of varieties and seed rate on phenology of food barley at Elfeta district
Varieties Days to 50% emergence
Days to 90% heading
Grain filling period
Days to 90% maturity
Cross 41/98 5.5 89.08a 44.42c 139.75a HB19/65 5.83 73.00 c 35.17d 118.83b HB19/66 6.08 87.33ba 49.00 b 139.67a Local 5.83 85.75b 52.17a 140.67a
Mean 5.81 83.79 45.19 134.73 LSD (5%) NS 2.10 1.49 2.54 CV (%) 10.52 3.01 3.96 2.26
Means with the same letter(s) in the same column are not significantly different at 5% probability level. NS = non-significant
Total number of tillers and Number of effective tillers: Main effect of varieties as well as seed rate, and their interaction had significant (p<0.05) effect on total number of tillers and number of effective tillers plant-1 (Table 3). The higher total number of tillers per plant (6.37) was obtained from the food barley HB19/65 variety from 75 kg ha–1 seed rate, while the lowest number of total tillers per plant (2.2) was recorded from local variety from 150 kg ha–1 seed rate. Similarly, the highest number of effective tillers per plant (6) barley was obtained from the combination of variety HB19/65 and 75 kg ha–1 seed rate, while the lowest number of effective tillers plant-1 (2) was recorded from the local variety planted using a seed rate of 150 kg ha–1. Such increment in number of effective
tillers with low seed rate could be the attribute of the tillering capacity of variety combined with less competition for the available growth resources. The lower number of tillers plant-1 from local variety under increased seed rates might be the result of high resource competition between plants in the growing season and inherent characteristics of the cultivar as well. Tiller production is considered as an inherent genotype features but it is limited by seed rate, which could be associated with resource sharing. Gomez (2001) reported that number of tillers plant-1 is influenced by seed rate, nature of the cultivar and environmental factors.

Agronomic Performance of Food Barley (Hordeum vulgare L.) Varieties [24]
Journal of Science and Sustainable Development (JSSD), 2019, 7(1), 20-31 ISSN: 2304-2702 (print)
Table 3. Interaction effects of variety and seed rate on total number of tillers and effective tillers of food barley varieties at Elfeta district
Varieties Seed rate (kg ha-1) Total number of tillers Number of effective tillers 75 100 125 150 Mean 75 100 125 150 Mean
Cross 41/98
6.23ab 5.73de 5.3ef 4.53g 5.45 5.73b 5.53bc 4.4fe 3.8hg 4.87
HB19/65 6.37a 5.8ba 5.6bc 5.2f 5.74 6.2a 5.2dc 4.8de 4.13fg 5.08
HB19/66 6bc 5.47def 4.77g 4.13h 5.09 5.8ab 4.93d 4.27f 3.4hi 4.60 Local 3.63i 3.3i 2.6j 2.2k 2.93 3i 2.4j 2kj 1.67k 2.27 Mean 5.56 5.08 4.57 4.02 5.18 4.51 3.87 3.24 LSD (5%)
0.34 0.44
CV (%) 4.18 6.31 Means with the same letter(s) are not significantly different at 5% probability level
Plant height: The analysis of variance indicated that both variety and seeding rate had highly significant (p<0.01) effect on plant height of food barley varieties (Table 4). Whereas, the interaction effect of variety and seed rates did not show significant effect on plant height. Variations of plant heights were observed among different varieties of food barley. The difference in mean plant height of food barley varieties was attributed to difference in their genetic makeup and seeding rate. The tallest plant height was recorded on the local variety (103 cm) followed by HB19/66 (97 cm), Cross 41/98 (94 cm) while HB19/65 was relatively the shortest (81 cm) in plant height. This finding agrees with El-banna et al., (2011) who reported variations in plant height in different barley and
wheat genotypes. As seeding rate increased from the lowest (75 kg ha-1) to the highest (150 kg ha-1), the height of the food barley correspondingly increased from 90 to 97 cm (Table 4). When seeding rate was increased competition was also increased leading too weaker and taller stems. Similarly, Soomro et al., (2009) noted that high seeding rate produced greater plant height compared to low seeding rate.
Table 4. Mean performances of varieties for seed rate on plant height of food barley at Elfeta district
Varieties Plant height (cm) Seed Rate (kg ha-1)
Plant height (cm)
Cross 41/98 94.15c 75 90.35b
HB19/65 80.93d 100 91.93b
HB19/66 96.9b 125 95.00a
Local 102.55a 150 97.25a
Mean 96.63 Mean 93.63
LSD (5%) = 2.63 CV (%) = 3.37 Means with the same letter(s) in the same column of the trait are not significantly different at 5% probability level.

Teferi et al. [25]
Journal of Science and Sustainable Development (JSSD), 2019, 7(1), 20-31 ISSN: 2304-2702 (print)
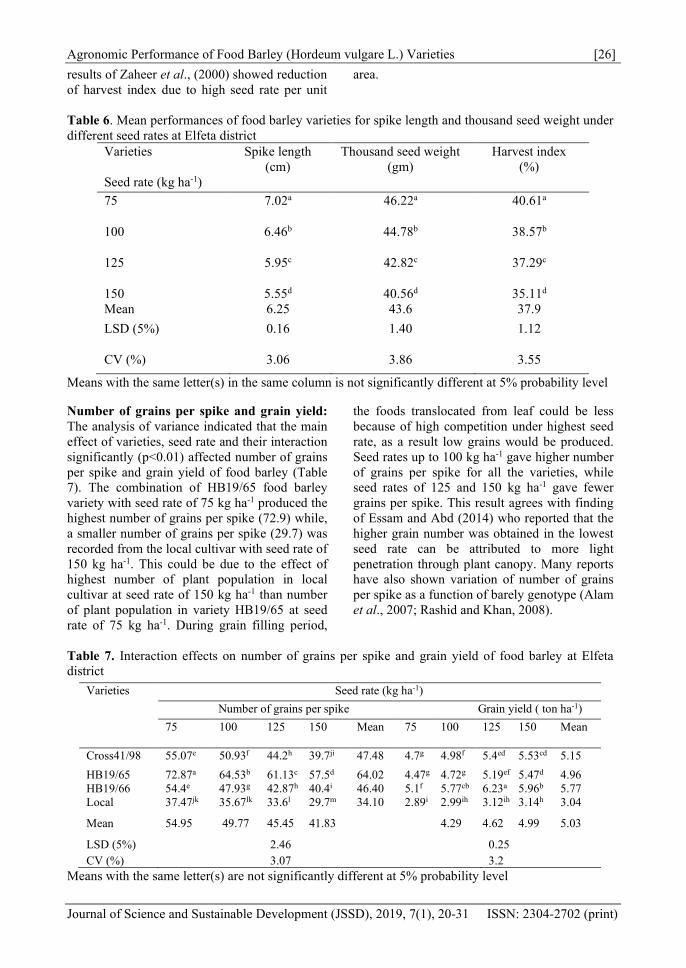
Spike length, thousand seed weight and Harvest index: The analysis of variance indicates that spike length, thousand seed weight and harvest index of food barley were significantly (p<0.01) affected by varieties and seeding rates but their interaction was non-significant (Table 5 and Table 6). HB19/65 variety ranked first followed by Cross 41/98, HB19/66 and local cultivar by producing 8, 7, 6 and 5 cm spike length, respectively. Likewise, Khan et al., (2002) reported that varieties have different genetic potential regarding the spike length. The maximum spike length (7cm) was recorded from those plots which received seeding rate of 75 kg ha-1 while minimum spike length (6cm) was obtained from plots which received seed rate of 150 kg ha-1 (Table 6). This might be due to more free space between plants at the lower seed rates and less intra-plot competition among plants for available resources that resulted in higher spike length. The cpresent result is agreement with the finding by Gafaar (2007) who stated that increasing sowing density significantly decreased spike length.
The present results also revealed the presence of variation in thousand seed weight among the varieties. The highest and lowest mean thousand seed weights were obtained from HB19/66 (49 g) and HB19/65 (38 g) barley varieties,respectively (Table 5). This may be due to thegenetic behavior of HB19/66 variety favored byenvironmental factors which might led to anincreased photosynthesis process andaccumulations of carbohydrate in the grain toproduce heavy seed and attributed to theirinherent potential. The highest thousand seedweight (46 g) was recorded for seed sown at theseeding rate of 75 kg ha-1 whereas the lowestthousand seed weight (41 g) was recorded at theseeding rate of 150 kg ha-1 (Table 6). The resultshowed that when seeding rate increased from75 to 100, 75 to 125 and 75 to 150 kg ha-1, itdecreased thousand seed weights by 3.12, 7.36and 12.25%, respectively. This might beattributed to increased competition for resourceswithin and between plants due to increasednumber of plants per unit area. Similarly,Baloch et al. (2010) reported that thousand seedweight decreased with increase in seeding rate.
Table 5. Mean performances of food barley varieties for spike length and thousand seed weight at Elfeta district.
Treatments Spike length (cm)
Thousand seed weight (gm)
Harvest index (%)
Cross 41/98 6.89b 39.55c 40.20a
HB19/65 7.59a 38.20c 37.22b
HB19/66 5.83c 49.42a 41.22a
Local 4.66d 47.21b 32.94c Mean 6.24 43.6 37.9
LSD (5%) 0.16 1.40 1.12
CV (%) 3.06 3.86 3.55
Means with the same letter(s) in the same column is not significantly different at 5% probability level
Variety HB19/66 and Cross 41/98 had the highest (41.22 and 40.20 %) harvest index relative to other genotypes while the local cultivar showed the lowest harvest index (32.94%) (Table 5). The presence of highest harvest index in variety HB19/66 revealed its capacity to efficiently distribute the dry matter produced to sink organ compared to other varieties. Harvest index is an indicator of plant efficiency to distribute dry matter in grain
(Shahryari and Mollasadeghi, 2011). Seed rates of 75 and 150 kg ha-1 produced the maximum (40.6%), and minimum (35.11%) harvest index, respectively (Table 6). This could be due to competition of resource at high plant population under high seed rated treatments. The present result was in line with Zeng and Shannon (2000) who reported that at high density carbohydrate supply was limited, and thus resulted in the reduction of harvest index. Similarly, previous
Agronomic Performance of Food Barley (Hordeum vulgare L.) Varieties [26]
Journal of Science and Sustainable Development (JSSD), 2019, 7(1), 20-31 ISSN: 2304-2702 (print)
results of Zaheer et al., (2000) showed reduction of harvest index due to high seed rate per unit
area.
Table 6. Mean performances of food barley varieties for spike length and thousand seed weight under different seed rates at Elfeta district
Varieties Spike length (cm)
Thousand seed weight (gm)
Harvest index (%)
Seed rate (kg ha-1) 75 7.02a 46.22a 40.61a
100 6.46b 44.78b 38.57b
125 5.95c 42.82c 37.29c
150 5.55d 40.56d 35.11d Mean 6.25 43.6 37.9 LSD (5%) 0.16 1.40 1.12
CV (%) 3.06 3.86 3.55
Means with the same letter(s) in the same column is not significantly different at 5% probability level
Number of grains per spike and grain yield: The analysis of variance indicated that the main effect of varieties, seed rate and their interaction significantly (p<0.01) affected number of grains per spike and grain yield of food barley (Table 7). The combination of HB19/65 food barley variety with seed rate of 75 kg ha-1 produced the highest number of grains per spike (72.9) while, a smaller number of grains per spike (29.7) was recorded from the local cultivar with seed rate of 150 kg ha-1. This could be due to the effect of highest number of plant population in local cultivar at seed rate of 150 kg ha-1 than number of plant population in variety HB19/65 at seed rate of 75 kg ha-1. During grain filling period,
the foods translocated from leaf could be less because of high competition under highest seed rate, as a result low grains would be produced. Seed rates up to 100 kg ha-1 gave higher number of grains per spike for all the varieties, while seed rates of 125 and 150 kg ha-1 gave fewer grains per spike. This result agrees with finding of Essam and Abd (2014) who reported that the higher grain number was obtained in the lowest seed rate can be attributed to more light penetration through plant canopy. Many reports have also shown variation of number of grains per spike as a function of barely genotype (Alam et al., 2007; Rashid and Khan, 2008).
Table 7. Interaction effects on number of grains per spike and grain yield of food barley at Elfeta district
Means with the same letter(s) are not significantly different at 5% probability level
Varieties Seed rate (kg ha-1) Number of grains per spike Grain yield ( ton ha-1)
75 100 125 150 Mean 75 100 125 150 Mean
Cross41/98 55.07e 50.93f 44.2h 39.7ji 47.48 4.7g 4.98f 5.4ed 5.53cd 5.15 HB19/65 72.87a 64.53b 61.13c 57.5d 64.02 4.47g 4.72g 5.19ef 5.47d 4.96 HB19/66 54.4e 47.93g 42.87h 40.4i 46.40 5.1f 5.77cb 6.23a 5.96b 5.77 Local 37.47jk 35.67lk 33.6l 29.7m 34.10 2.89i 2.99ih 3.12ih 3.14h 3.04
Mean 54.95 49.77 45.45 41.83 4.29 4.62 4.99 5.03
LSD (5%) 2.46 0.25 CV (%) 3.07 3.2
Teferi et al. [27]
Journal of Science and Sustainable Development (JSSD), 2019, 7(1), 20-31 ISSN: 2304-2702 (print)
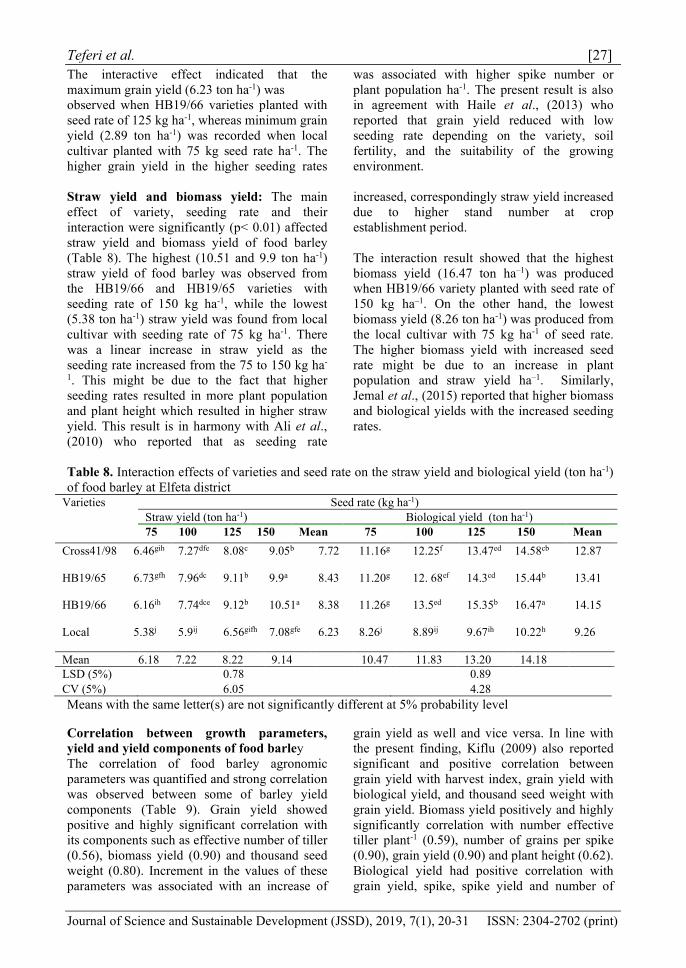
The interactive effect indicated that the maximum grain yield (6.23 ton ha-1) was observed when HB19/66 varieties planted with seed rate of 125 kg ha-1, whereas minimum grain yield (2.89 ton ha-1) was recorded when local cultivar planted with 75 kg seed rate ha-1. The higher grain yield in the higher seeding rates
was associated with higher spike number or plant population ha-1. The present result is also in agreement with Haile et al., (2013) who reported that grain yield reduced with low seeding rate depending on the variety, soil fertility, and the suitability of the growing environment.
Straw yield and biomass yield: The main effect of variety, seeding rate and their interaction were significantly (p< 0.01) affected straw yield and biomass yield of food barley (Table 8). The highest (10.51 and 9.9 ton ha-1) straw yield of food barley was observed from the HB19/66 and HB19/65 varieties with seeding rate of 150 kg ha-1, while the lowest (5.38 ton ha-1) straw yield was found from local cultivar with seeding rate of 75 kg ha-1. There was a linear increase in straw yield as the seeding rate increased from the 75 to 150 kg ha-
1. This might be due to the fact that higherseeding rates resulted in more plant populationand plant height which resulted in higher strawyield. This result is in harmony with Ali et al.,(2010) who reported that as seeding rate
increased, correspondingly straw yield increased due to higher stand number at crop establishment period.
The interaction result showed that the highest biomass yield (16.47 ton ha–1) was produced when HB19/66 variety planted with seed rate of 150 kg ha–1. On the other hand, the lowest biomass yield (8.26 ton ha-1) was produced from the local cultivar with 75 kg ha-1 of seed rate. The higher biomass yield with increased seed rate might be due to an increase in plant population and straw yield ha–1. Similarly, Jemal et al., (2015) reported that higher biomass and biological yields with the increased seeding rates.
Table 8. Interaction effects of varieties and seed rate on the straw yield and biological yield (ton ha-1) of food barley at Elfeta district
Varieties Seed rate (kg ha-1) Straw yield (ton ha-1) Biological yield (ton ha-1) 75 100 125 150 Mean 75 100 125 150 Mean
Cross41/98 6.46gih 7.27dfe 8.08c 9.05b 7.72 11.16g 12.25f 13.47ed 14.58cb 12.87
HB19/65 6.73gfh 7.96dc 9.11b 9.9a 8.43 11.20g 12. 68ef 14.3cd 15.44b 13.41
HB19/66 6.16ih 7.74dce 9.12b 10.51a 8.38 11.26g 13.5ed 15.35b 16.47a 14.15
Local 5.38j 5.9ij 6.56gifh 7.08gfe 6.23 8.26j 8.89ij 9.67ih 10.22h 9.26
Mean 6.18 7.22 8.22 9.14 10.47 11.83 13.20 14.18 LSD (5%) 0.78 0.89 CV (5%) 6.05 4.28 Means with the same letter(s) are not significantly different at 5% probability level
Correlation between growth parameters, yield and yield components of food barley The correlation of food barley agronomic parameters was quantified and strong correlation was observed between some of barley yield components (Table 9). Grain yield showed positive and highly significant correlation with its components such as effective number of tiller (0.56), biomass yield (0.90) and thousand seed weight (0.80). Increment in the values of these parameters was associated with an increase of
grain yield as well and vice versa. In line with the present finding, Kiflu (2009) also reported significant and positive correlation between grain yield with harvest index, grain yield with biological yield, and thousand seed weight with grain yield. Biomass yield positively and highly significantly correlation with number effective tiller plant-1 (0.59), number of grains per spike (0.90), grain yield (0.90) and plant height (0.62). Biological yield had positive correlation with grain yield, spike, spike yield and number of

Agronomic Performance of Food Barley (Hordeum vulgare L.) Varieties [28]
Journal of Science and Sustainable Development (JSSD), 2019, 7(1), 20-31 ISSN: 2304-2702 (print)
grains per spike (Shahryari and Mollasadeghi, 2011). Straw yield was highly and positively correlated with biomass yield (0.91) and plant height (0.65) (Table 7). Similarly, harvest index was positively and highly significantly correlated with grain yield (0.61), effective
number of tiller (0.80) and straw yield (0.57). In agreement with the present finding, Riggs (1981) reported highly meaningful and positive correlation between harvest index and grain yield in barley.
Table 9. Correlation between yield and yield component of food barley at Elfeta. district GY NET BY NGPS SL PH HI TSW SY
GY NET 0.56** BY 0.90** 0.59** NGPS 0.37 -0.84** 0.90**SL 0.41 0.89** 0.29 0.93** PH -0.28 -0.71** 0.62** -0.92** -0.86**HI 0.61** 0.80** 0.27 0.48 0.57** -0.31 TSW 0.80** -0.20 -049 -0.38 -0.48 0.51 0.15 SY -0.63** 0.56* 0.91** 0.09 0.12 0.53* -0.09 -0.63**
GY = Grain yield, NET = Number of effective tillers, BY = Biological yield, SL = Spike length, PH = Plant height, NGPS = Number of grains per spike, HI = Harvest index, TSW = Thousand seed weight, and SY = Straw yield.
Effects of seed rates on economic feasibility of food barley production The partial budget analysis result indicated that the highest net benefit ETB 38,976 ha-1 with marginal rate return of 18% and with the cost-benefit ratio of 22 ETB per unit of investment was obtained from of 150 kg ha-1 seed rate of food barley (Table 10). The second higher net
benefit of ETB 38,923 ha-1 with marginal rate of return (933 %) and cost-benefit ratio of ETB 27 per unit investment was obtained from the use of 125 kg ha-1 seeding rate for food barley. Therefore, use of 125 kg ha-1 seeding rate for food barley was profitable and recommended for food barley production.
Table 10. Partial budget analysis of seed rate for food barley production at Elfeta district
Seed rate (kg ha-1)
Grain yield (kg ha-1)
Adjusted grain yield (kg ha-1)
Gross field benefit (EB ha-1)
Total variable cost (EB ha-1)
Net benefit (EB ha-1)
Value to cost ratio
Marginal rate of return (%)
75 4289 3860 34743 869 33874 39 _
100 4614 4153 37375 1159 36216 31 888 125 4984 4486 40372 1449 38923 27 933 150 5027 4524 40715 1739 38976 22 18
Cost of improved seed (14.68 birr/kg), local seed (8.5 birr/kg) and average cost of seed 11.59 birr/kg; 9 birr/kg was the value of barley at harvesting on local markets.
Conclusion and Recommendation
This study showed that there were large variations among improved food barley varieties in almost all the agronomic performances. However, variety and seed rate significantly affected plant height, spike length, thousand
seed weight and harvest index of food barley. Number of effective tillers, number of grains per spikes, grain and biological yields of food barley were highly influenced by the interaction effect of variety and seeding rate. HB19/66 variety gave maximum grain yield (6.23 ton ha-1) in the present study area and hence can be

Teferi et al. [29]
Journal of Science and Sustainable Development (JSSD), 2019, 7(1), 20-31 ISSN: 2304-2702 (print)
recommended for farmers to use at Elfeta district. Seed rate of 125 kg ha-1 exhibited better agronomic performance and economic feasible, and hence it can be promoted to increase grain yield of improved food barley in the study area.
References
Alam, M.Z. Haider, S.A. and Pau, N.K. (2007). Yield and yield components of barley cultivars in relation to nitrogen fertilizer. J App Sci Res, 3(10), 1022-1026.
Ali, M. Ali, L. Sattar, M. and Ali, M.A. (2010). Improvement in wheat (Triticum aestivum L.) Yield by manipulating seed rate and row spacing in Vehari zone. Adaptive Research Farm, Vehari. J Ani Plant sci, 20(4), 225-230.
Baloch, S. M. Shah, I. T. Nadim, M. A. Khan, M. I. and Khakwani. A. A. (2010). Effectof seeding density and planting time ongrowth and yield attributes of wheat. JAni Plant Sci, 20, 239-240.
Bayehe Mulatu and Stefania Grando. (2011). Barley Research and Development in Ethiopia. Proceedings of the 2nd National Barley Research and Development Review Workshop.28-30 November 2006, HARC, Holetta, Ethiopia. ICARDA, Aleppo, Syria, pp: 1-126.
Berhane Lakew, Hailu Gebre and Fekadu Alemayehu. (1996). Barley production and research. pp 1–8, in: Hailu Gebre and J.A.G. van Leur (eds.). Barley Research in Ethiopia: Past Work and Future Prospects. Proceedings of the 1st Barley Research Review Workshop, 16–19 October 1993, AddisAbaba.IAR/ICARDA, Addis Ababa, Ethiopia.
CIMMYT. (1988). Farm Agronomic data to farmers’ recommendations: Economic training manual. Completely revised. CIMMYT (International Maize and Wheat Center), Mexico, pp 1-124.
CSA (Central Statistical Agency). (2017). Area and production of major crops (private peasant holdings, meher season). V1. Statistical Bulletin. Addis Ababa, Ethiopia.
El-banna, M.N. EL-Gawad Nassir, M.A.A. Mohammed, M.N. and EL-Azeem Boseely, M.A. (2011). Evaluation of 16 barley genotypes under calcareous soil
conditions in Egypt. J Agri Sci, 3(1), 105-121.
Elfeta Agricultural and Natural Resource office. (2015). Annual report. pp1-30. Unpublished.
Elfeta Agricultural and Natural Resource office. (2016). Annual report. pp1-42. Unpublished.
Essam A. El-Lattief Abd. (2014). Determining the optimization seeding rate for improved productivity of wheat under Southern Egypt conditions. Inter J Agro Agri Res, 4(1), 47-57.
Ethiopia Ministry Agricultural (EMA), 2011.Training manual Addis Ababa, Ethiopia pp1-25. Unpublished.
FAO (Food and Agriculture Organization). (2017). Food and Agriculture Organization of the United Nations. Estimates of world production and harvested area. Pp, 1-254
Gafaar, N.A. (2007). Response of some bread wheat varieties grown under different levels of planting density and nitrogen fertilizer. Minu J Agri, 32, 165-183.
Getachew Agegnehu, Minale Liben, Adamu Molla, Abraham Feyissa, Agdew Bekele and Fite Getaneh. (2011). Research achievements in soil fertility management in relation to barley in Ethiopia. pp 137-153. In: Baye Mulatu and GrandoStefania. (Eds.). Barley Research andDevelopment in Ethiopia. Proceedings ofthe 2nd National Barley Research andDevelopment Review Workshop. 28-30November 2006, HARC, Holetta,Ethiopia. ICARDA, PO Box 5466,Aleppo, Syria. pp xiv + 391.
Girma Megersa. (2014). Genetic erosion of barley in North Shewa Zone of Oromiya Region, Ethiopia. Inter J Biodi Cons, 6(3), 280-289.
Gomez-Macpherson, H. (2001). Hordeum vulgare. EcoPort Entity 1232, http://www.ecoport.org. 22 Jun 2017.
Gomez, K.A. and Gomez, A.A. (1984). Statistical Procedures for agricultural research (2nded.). John Willey & Sons, New York. pp. 680.
Hadado, T.T. Rau, D. Bitocchi, E. and Papa, R. (2010). Adaptation and diversity along an altitudinal gradient in Ethiopian barley (Hordeum vulgare L.) landraces revealed
Agronomic Performance of Food Barley (Hordeum vulgare L.) Varieties [30]
Journal of Science and Sustainable Development (JSSD), 2019, 7(1), 20-31 ISSN: 2304-2702 (print)
by molecular analysis. Bio Med Central Plant Bio, 10(121), 1–20.
Haile Deressa, Nigussie Dechassa, Abdo, W. and Girma Fayisa. (2013). Seeding rate and genotype effects on agronomic performance and grain protein content of durum wheat (Triticum turgidum L. var. durum) in south-eastern Ethiopia. Afri J Agri Nutr Deve, 13(3), 7695- 7710.
Jemal Abdulkerim, Tamado Tana and Firdissa Eticha. (2015). Response of Bread Wheat (Triticum aestivum L.) Varieties to Seeding Rates at Kulumsa, South Eastern Ethiopia. Asian J Pla Sci, 14, 50-58.
Kemelew Muhe and Alemayehu Assefa. (2011). Diversity and agronomic potential of barley (Hordeum vulgare L.) Landraces in variable production system, Ethiopia: Wor J Agri Sci, 7(5), 599-603.
Khan, A.Z. Khan, H. Khan, R. Adel Ghoneim, and Ebid, A. (2002). Effect of sowing dates and seed rates on yield and yield components of wheat. App Sci Rese, 2, 529-534.
Kiflu Abera. (2009). Agronomic evaluation of Ethiopian barley (Hordeum vulgare L.) land race populations under drought stress conditions in low rainfall areas of Ethiopia. An MSC Thesis Submitted to Swedish Biodiversity center.
Malle Tilahun, Asfaw Azanaw and Getachew Tilahun. (2015). Participatory evaluation and promotion of improved food barley varieties in the highlands of north western Ethiopia. Wudpecker J Agri Rese, 4(3), 050 – 053.
Rashid, A. and Khan, R.U. (2008). Comparative Effect of Varieties and Fertilizer Levels on Barley (Hordeum vulgare L.). Inter J Agri Bio, 10(1), 124-126.
Riggs, T.J. Hanson, P.R. Start, N.D. Miles, D.M. Morgan, C.L. and Ford, M.A.(1981). Comparison of spring barleyvarieties in England and Wales between1880 and 1980. J Agri sci, 97, 599-610.
Sajjad, M.R. Rashid, M. Akram, M. Ahmad, M.J. Hussain, R. Akram, M. and Razzaq,A. (2010). Optimum seed rate of wheat inavailable soil moisture under rainfedconditions. J Agri Rese, 47, 143-151.
Samuel Weldeyohanis Kifle. (2016). Review on Barley Production and Marketing in Ethiopia. J Econ Susta Devel, 7(9), 91-100.
Shahryari, R. and Mollasadeghi, V. (2011). Correalation study of some traits affecting yield and yield components of wheat genotypes interims of normal irrigation and end drought stress. Adva Envi Bio, 5(3), 523-527.
Smith, D. L. and Hamel, C. (1999). Crop yield physiology and processes, Springer Verlag Heidelberg, Germany. pp. 174.
Soomro, U.A. Rahman, M.U. Odhano, E.A. Gul, S. and Tareen, A.Q. (2009). Effects of sowing method and seed rate on growth and yield of wheat (Triticum aestivumL.). World J Agri Sci, 5, 159-162.
Statistical Analysis system (SAS). (2004). SAS 9.0 user’s guide, Cary, NC.: SAS Institute Inc. United States of America.
Steel, R.G.D. and Torrie, J.H. (1980). Principles and procedures of statistics: a biometrical approach. 2nd Edition. Mc Graw-Hill. New York. pp. 631.
Teshome Mamo. (2017). Evaluation of Improved Food Barley (Hordeum vulgare L.) Varieties in the Highland Areas of Kaffa Zone, Southwestern Ethiopia. Agri For Fish, 6(5), 161-165.
Vaezi, B. Bavei, V. and Shiran, B. (2010). Screening of barley genotypes for drought tolerance by agro-physiological traits in field condition. Afri J Agri Rese, 5(9), 881-892.
Wiersma, J.J. 2002. Determining an optimum seeding rate for spring wheat in Northwest Minnesota.Crop Manag, 18, 1-7.
Woldeyesus Sinebo and Chilot Yirga. (2002). Participatory client-orientation of research in lowinput cropping systems of Ethiopia. pp 27–43. In: Gemechu Kenini, Yohannes Gojjam, Kiflu Bedane, ChilotYirga and Asgelil Dibabe (eds.). Towards Farmer Participatory Research: Attempts and Achievements in the Central Highlands of Ethiopia. Proceedings of a Client-Oriented Research Evaluation Workshop.Holetta Agricultural Research Centre, Holeta, Ethiopia.
Worku Awdie. (2008). Effects of nitrogen and seed rates on yield and yield components of bread wheat (Triticum aestivum L.) in Yelmanadensa district, north western Ethiopia. M.Sc. Thesis. The School of
Teferi et al. [31]
Journal of Science and Sustainable Development (JSSD), 2019, 7(1), 20-31 ISSN: 2304-2702 (print)
Graduate Studies of Haramaya University. Harar, Ethiopia.
Wosene G/Abtew, Berhane Lakew, Bettina, I. G. Haussmann and Schmid, K. J. (2015).Ethiopian barley landraces show higheryield stability and comparable yield toimproved varieties in multi-environmentfield trials. J Plant Bre Crop Sci, 7(8), 1-17.
Zaheer, A. Kisana, N.S. Mujaih, M.Y. Iftkhar, A. Mustafa, S.Z. Majid, A. (2000): Effectof density on yield and yield componentsof wheat. Paki J Bio Sci, 3(9), 1389-1390.
Zemede Asfaw. (1996). Barley in Ethiopia: the link between botany and tradition. pp 182– 192, in: Hailu Gebre and van Leur J.A.G. (eds.). Barley Research in Ethiopia: Past Work and Future Prospects. Proceedings of the 1st Barley Research Review Workshop, 16–19 October 1993, AddisAbaba.IAR/ICARDA, Addis Ababa, Ethiopia.
Zeng, L. and Shannon, M.C. (2000). Effects of salinity on grain yield and yield components of rice at different seeding densities. Agro J, 92, 418-423.