Embed Size (px)
Citation preview
IJoFCS (2016) 1, 46-55
_____________________________
The International Journal of FORENSIC COMPUTER SCIENCE _____________________________
www.IJoFCS.org
DOI: 10.5769/J201601004 or http://dx.doi.org/10.5769/J201601004
___________________________________ Paper submitted on: September 18
th, 2016
Proportional analysis of Soft Handover & Hard Handover over metro city in UMTS
Shipra Jain1, Deepak Sinwar
2
(1) B.R.C.M. college, Behal, india. Email:[email protected]
(2) B.R.C.M. college, Behal, india, Email: [email protected]
Abstract: Mobile communication with the new technology is the quickest growing space with often
accrued information rates and coverage areas. The future challenge is to form the simplest attainable use of the obtainable different types of network .For connecting mobile heterogeneous networks handover is critical. Uninterrupted quality service is the main advantage of mobile cellular systems. Handover could be a key idea to achieving quality. The event begins once user starts moving to different base station and leaves the earlier base station conjointly attainable for a user to travel from one cell to a different, with no interrupt that’s better-known as seamless association. In this paper, OPNET MODELER does the proportional analysis of soft & hard handover over metro cities operating environment like as Delhi, Mumbai, and Chennai etc. Here ten mobiles square measure playing handover within the logical space at the intervals of soft & hard limits and evaluating the performance which handover offers better which handover offers better outcome. This paper also tests how the performance of network improved with the soft handover.
Key words: UMTS, QOS (Quality of service), RNC, GGSN, SGSN, Node B, Soft Handover, Hard
Handover, UE.
I. Introduction
Universal mobile telecommunication system (UMTS) is a third generation wireless system. It’s a region of the IMT-2000 family of 3G mobile communication system. The UMTS network is additionally known as international System for Mobile communications (GSM) as a result of it evolved from that system and the air interface (WCDMA) for the UMTS network which relies on band Code Division Multiple Access (WCDMA). UMTS includes the High Speed Packet Access (HSPA) specification. This design is as in step with the third generation project (3GP) needs.
The UMTS network may be split into 3 different parts: the User instrumentality domain (UE), the UMTS Terrestrial Radio Access Network (UTRAN) and the Core network half. UMTS supported low price, high ability mobile communication and it conjointly offers the info rate up to two mbps. The worldwide accessible bands are: 450 MHz, 700 MHz, 850 MHz, 900 MHz, 1700 MHz, 1800 MHz, 1900 MHz, 2100 MHz and 2600 MHz [13] however because the signals propagate at low frequencies, therefore UMTS at 850 MHz and 900 MHz square measure a lot of economical bands for the low dense inhabited areas.
_____________________________________________________________ Shipra Jain and Deepak Sinwar 47
In mobile communication, handover is a method once a user switches to a different channel with no interruption. Handover is the fundamental suggests that of providing quality in cellular architectures. In UMTS systems, there are differing kinds of handovers to be introduced to cope up additionally with alternative necessities as load management, coverage provisioning and providing quality of services.
Reasons of Handover process:
• The functionality of user equipment/cell phone is incredibly quick. •The user’s instrumentality from one cell associate cell to another throughout a current session. •Degrading signal Quality and frequent fluctuations. • Traffic primarily based, load based • Reception Quality, BER
1. Soft handover A
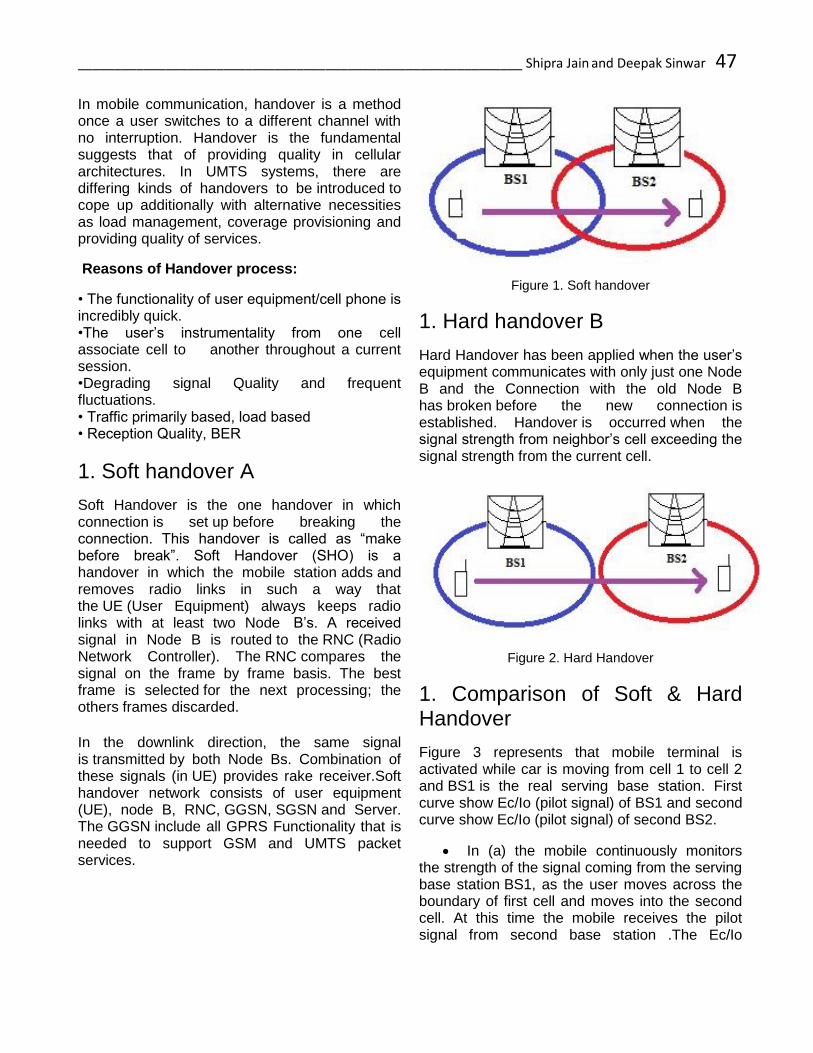
Soft Handover is the one handover in which connection is set up before breaking the connection. This handover is called as “make before break”. Soft Handover (SHO) is a handover in which the mobile station adds and removes radio links in such a way that the UE (User Equipment) always keeps radio links with at least two Node B’s. A received signal in Node B is routed to the RNC (Radio Network Controller). The RNC compares the signal on the frame by frame basis. The best frame is selected for the next processing; the others frames discarded.
In the downlink direction, the same signal is transmitted by both Node Bs. Combination of these signals (in UE) provides rake receiver.Soft handover network consists of user equipment (UE), node B, RNC, GGSN, SGSN and Server. The GGSN include all GPRS Functionality that is needed to support GSM and UMTS packet services.
Figure 1. Soft handover
1. Hard handover B
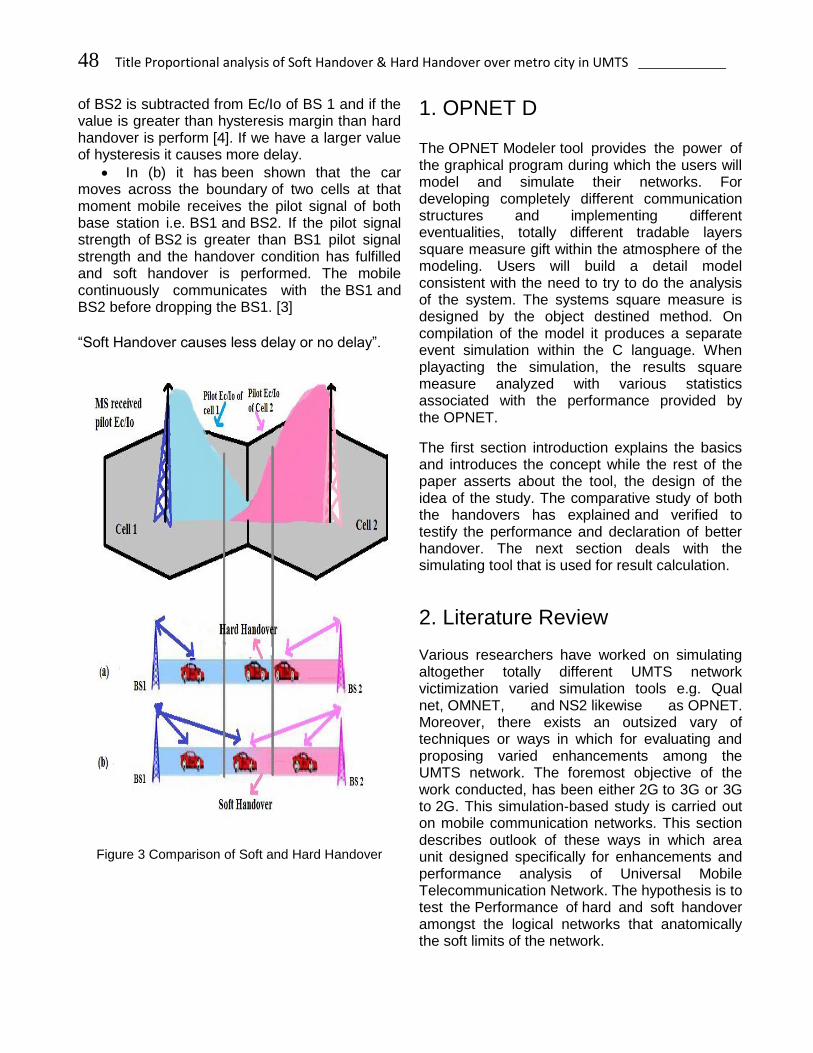
Hard Handover has been applied when the user’s equipment communicates with only just one Node B and the Connection with the old Node B has broken before the new connection is established. Handover is occurred when the signal strength from neighbor’s cell exceeding the signal strength from the current cell.
Figure 2. Hard Handover
1. Comparison of Soft & Hard Handover
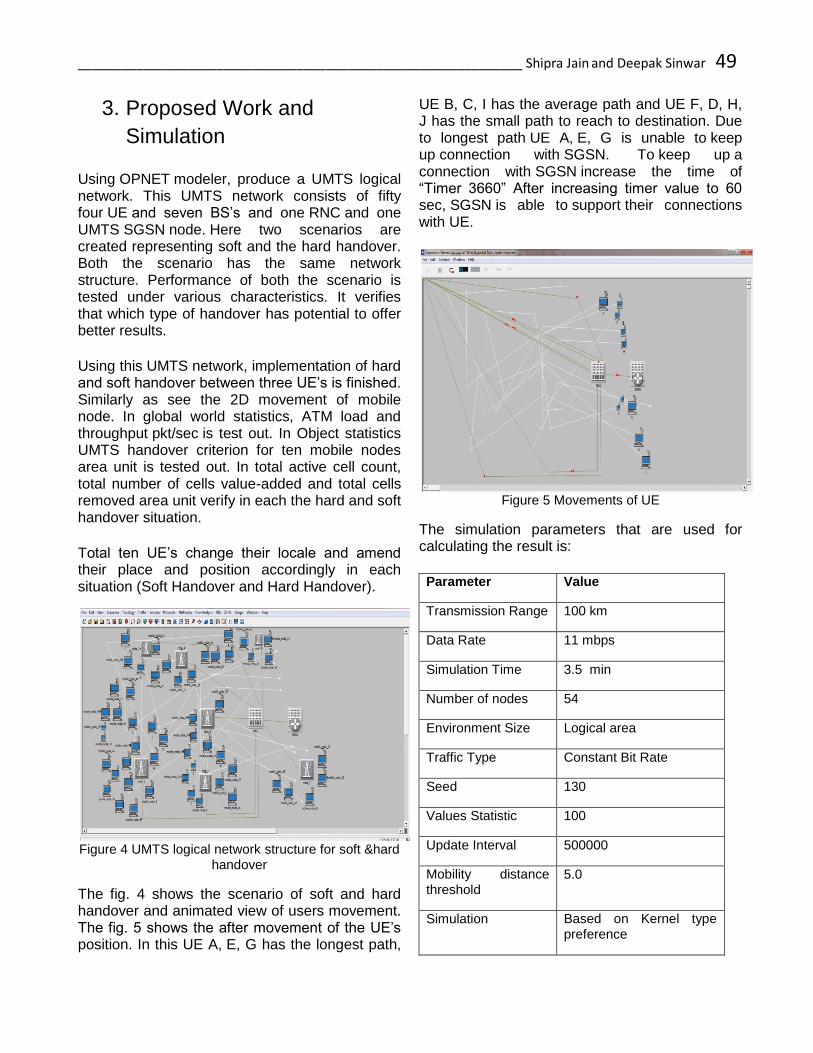
Figure 3 represents that mobile terminal is activated while car is moving from cell 1 to cell 2 and BS1 is the real serving base station. First curve show Ec/Io (pilot signal) of BS1 and second curve show Ec/Io (pilot signal) of second BS2.
In (a) the mobile continuously monitors the strength of the signal coming from the serving base station BS1, as the user moves across the boundary of first cell and moves into the second cell. At this time the mobile receives the pilot signal from second base station .The Ec/Io
48 Title Proportional analysis of Soft Handover & Hard Handover over metro city in UMTS ___________
of BS2 is subtracted from Ec/Io of BS 1 and if the value is greater than hysteresis margin than hard handover is perform [4]. If we have a larger value of hysteresis it causes more delay.
In (b) it has been shown that the car moves across the boundary of two cells at that moment mobile receives the pilot signal of both base station i.e. BS1 and BS2. If the pilot signal strength of BS2 is greater than BS1 pilot signal strength and the handover condition has fulfilled and soft handover is performed. The mobile continuously communicates with the BS1 and BS2 before dropping the BS1. [3]
“Soft Handover causes less delay or no delay”.
Figure 3 Comparison of Soft and Hard Handover
1. OPNET D
The OPNET Modeler tool provides the power of the graphical program during which the users will model and simulate their networks. For developing completely different communication structures and implementing different eventualities, totally different tradable layers square measure gift within the atmosphere of the modeling. Users will build a detail model consistent with the need to try to do the analysis of the system. The systems square measure is designed by the object destined method. On compilation of the model it produces a separate event simulation within the C language. When playacting the simulation, the results square measure analyzed with various statistics associated with the performance provided by the OPNET.
The first section introduction explains the basics and introduces the concept while the rest of the paper asserts about the tool, the design of the idea of the study. The comparative study of both the handovers has explained and verified to testify the performance and declaration of better handover. The next section deals with the simulating tool that is used for result calculation.
2. Literature Review
Various researchers have worked on simulating altogether totally different UMTS network victimization varied simulation tools e.g. Qual net, OMNET, and NS2 likewise as OPNET. Moreover, there exists an outsized vary of techniques or ways in which for evaluating and proposing varied enhancements among the UMTS network. The foremost objective of the work conducted, has been either 2G to 3G or 3G to 2G. This simulation-based study is carried out on mobile communication networks. This section describes outlook of these ways in which area unit designed specifically for enhancements and performance analysis of Universal Mobile Telecommunication Network. The hypothesis is to test the Performance of hard and soft handover amongst the logical networks that anatomically the soft limits of the network.
_____________________________________________________________ Shipra Jain and Deepak Sinwar 49
3. Proposed Work and
Simulation
Using OPNET modeler, produce a UMTS logical network. This UMTS network consists of fifty four UE and seven BS’s and one RNC and one UMTS SGSN node. Here two scenarios are created representing soft and the hard handover. Both the scenario has the same network structure. Performance of both the scenario is tested under various characteristics. It verifies that which type of handover has potential to offer better results.
Using this UMTS network, implementation of hard and soft handover between three UE’s is finished. Similarly as see the 2D movement of mobile node. In global world statistics, ATM load and throughput pkt/sec is test out. In Object statistics UMTS handover criterion for ten mobile nodes area unit is tested out. In total active cell count, total number of cells value-added and total cells removed area unit verify in each the hard and soft handover situation.
Total ten UE’s change their locale and amend their place and position accordingly in each situation (Soft Handover and Hard Handover).
Figure 4 UMTS logical network structure for soft &hard handover
The fig. 4 shows the scenario of soft and hard handover and animated view of users movement. The fig. 5 shows the after movement of the UE’s position. In this UE A, E, G has the longest path,
UE B, C, I has the average path and UE F, D, H, J has the small path to reach to destination. Due to longest path UE A, E, G is unable to keep up connection with SGSN. To keep up a connection with SGSN increase the time of “Timer 3660” After increasing timer value to 60 sec, SGSN is able to support their connections with UE.
Figure 5 Movements of UE
The simulation parameters that are used for calculating the result is:
Parameter Value
Transmission Range 100 km
Data Rate 11 mbps
Simulation Time 3.5 min
Number of nodes 54
Environment Size Logical area
Traffic Type Constant Bit Rate
Seed 130
Values Statistic 100
Update Interval 500000
Mobility distance threshold
5.0
Simulation Based on Kernel type preference
50 Title Proportional analysis of Soft Handover & Hard Handover over metro city in UMTS ___________
Packets per interval 2
Trajectory Inf. Random
Area of Movement Within soft limits of the logical network
Events 819003
Speed 51,139(event/sec)
No. of runs 8
Host Local Host
Port Offset 0
Timeout (sec) 4
Table 1.Simulation Parameters
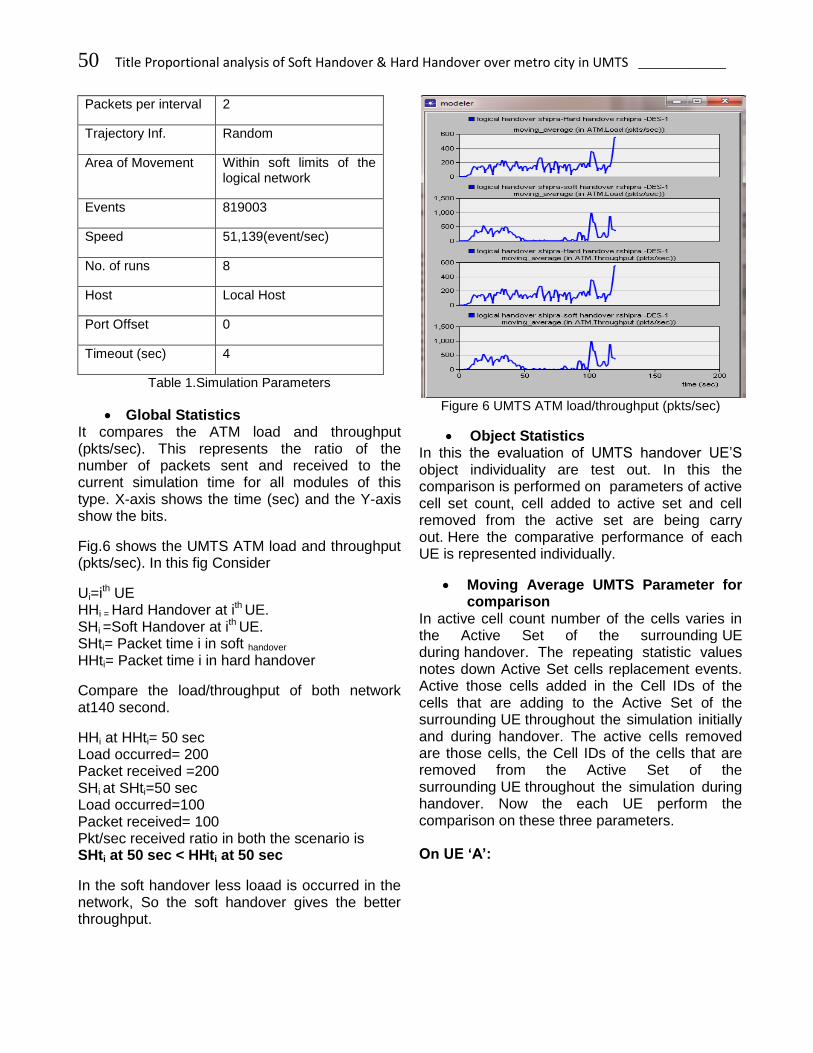
Global Statistics It compares the ATM load and throughput (pkts/sec). This represents the ratio of the number of packets sent and received to the current simulation time for all modules of this type. X-axis shows the time (sec) and the Y-axis show the bits.
Fig.6 shows the UMTS ATM load and throughput (pkts/sec). In this fig Consider
Ui=ith UE HHi = Hard Handover at ith UE. SHi =Soft Handover at ith UE. SHti= Packet time i in soft handover HHti= Packet time i in hard handover
Compare the load/throughput of both network at140 second.
HHi at HHti= 50 sec Load occurred= 200 Packet received =200 SHi at SHti=50 sec Load occurred=100 Packet received= 100 Pkt/sec received ratio in both the scenario is SHti at 50 sec < HHti at 50 sec
In the soft handover less loaad is occurred in the network, So the soft handover gives the better throughput.
Figure 6 UMTS ATM load/throughput (pkts/sec)
Object Statistics In this the evaluation of UMTS handover UE’S object individuality are test out. In this the comparison is performed on parameters of active cell set count, cell added to active set and cell removed from the active set are being carry out. Here the comparative performance of each UE is represented individually.
Moving Average UMTS Parameter for comparison
In active cell count number of the cells varies in the Active Set of the surrounding UE during handover. The repeating statistic values notes down Active Set cells replacement events. Active those cells added in the Cell IDs of the cells that are adding to the Active Set of the surrounding UE throughout the simulation initially and during handover. The active cells removed are those cells, the Cell IDs of the cells that are removed from the Active Set of the surrounding UE throughout the simulation during handover. Now the each UE perform the comparison on these three parameters. On UE ‘A’:
_____________________________________________________________ Shipra Jain and Deepak Sinwar 51
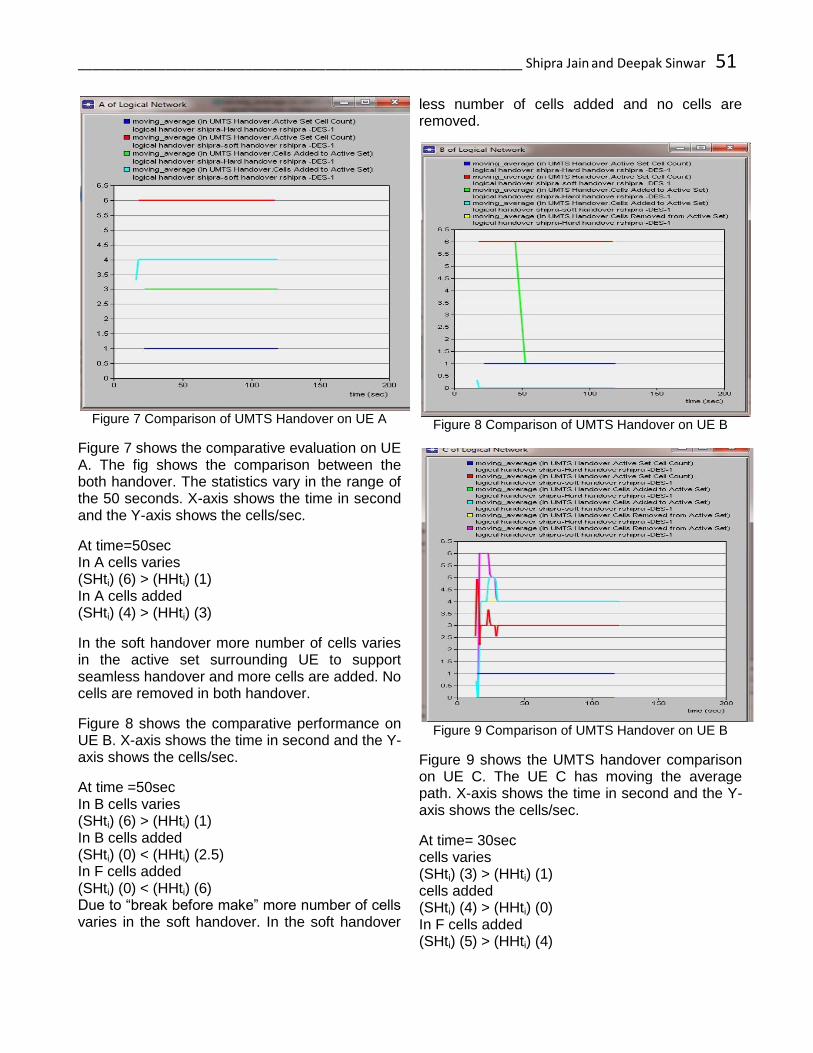
Figure 7 Comparison of UMTS Handover on UE A
Figure 7 shows the comparative evaluation on UE A. The fig shows the comparison between the both handover. The statistics vary in the range of the 50 seconds. X-axis shows the time in second and the Y-axis shows the cells/sec.
At time=50sec In A cells varies (SHti) (6) > (HHti) (1) In A cells added (SHti) (4) > (HHti) (3)
In the soft handover more number of cells varies in the active set surrounding UE to support seamless handover and more cells are added. No cells are removed in both handover.
Figure 8 shows the comparative performance on UE B. X-axis shows the time in second and the Y-axis shows the cells/sec.
At time =50sec In B cells varies (SHti) (6) > (HHti) (1) In B cells added (SHti) (0) < (HHti) (2.5) In F cells added (SHti) (0) < (HHti) (6) Due to “break before make” more number of cells varies in the soft handover. In the soft handover
less number of cells added and no cells are removed.
Figure 8 Comparison of UMTS Handover on UE B
Figure 9 Comparison of UMTS Handover on UE B
Figure 9 shows the UMTS handover comparison on UE C. The UE C has moving the average path. X-axis shows the time in second and the Y-axis shows the cells/sec.
At time= 30sec cells varies (SHti) (3) > (HHti) (1) cells added (SHti) (4) > (HHti) (0) In F cells added (SHti) (5) > (HHti) (4)
52 Title Proportional analysis of Soft Handover & Hard Handover over metro city in UMTS ___________
Here more cells are added and removed in the soft handover as compare to hard handover.
Figure 10 shows the comparative performance on UE D. It is running the small path. X-axis shows the time in second and the Y-axis shows the cells/sec.
Figure 10 Comparison of UMTS Handover on UE D
At time =50sec Cells varies (SHti) (6) > (HHti) (1) Cells added (SHti) (3) > (HHti) (0) Cells added (SHti) (0) < (HHti) (5) Here both handover perform good. Due to short path no cells are removed in soft handover.
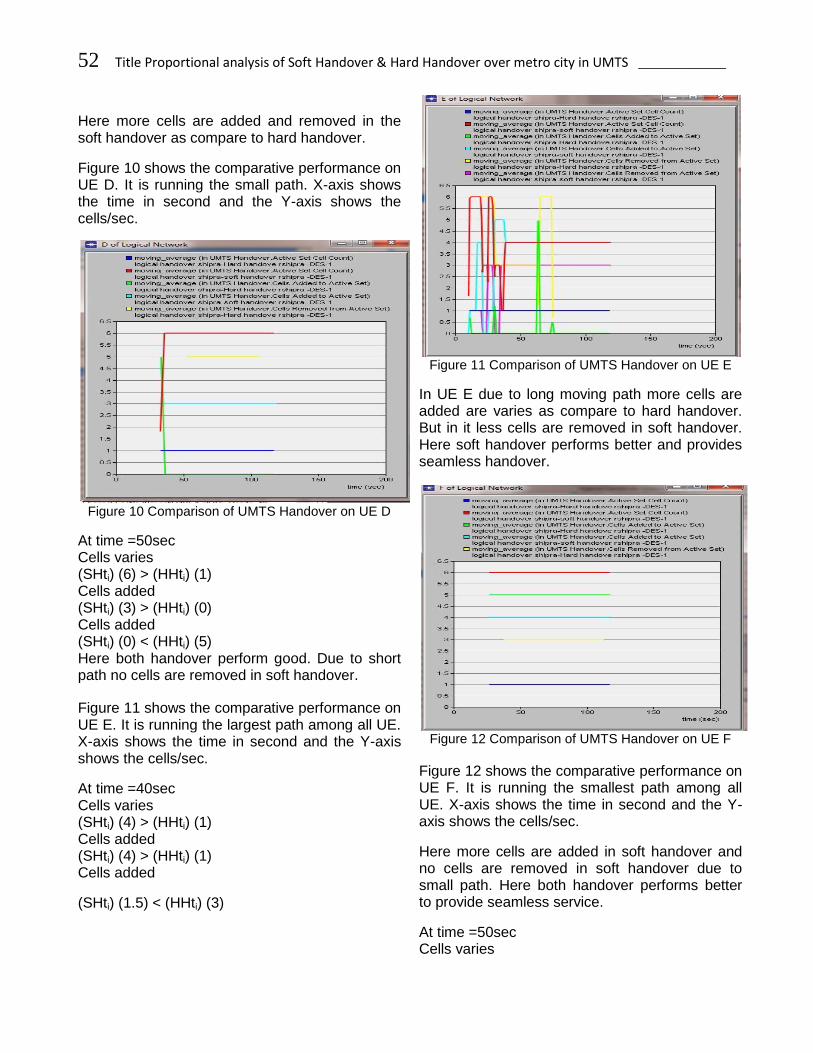
Figure 11 shows the comparative performance on UE E. It is running the largest path among all UE. X-axis shows the time in second and the Y-axis shows the cells/sec.
At time =40sec Cells varies (SHti) (4) > (HHti) (1) Cells added (SHti) (4) > (HHti) (1) Cells added
(SHti) (1.5) < (HHti) (3)
Figure 11 Comparison of UMTS Handover on UE E
In UE E due to long moving path more cells are added are varies as compare to hard handover. But in it less cells are removed in soft handover. Here soft handover performs better and provides seamless handover.
Figure 12 Comparison of UMTS Handover on UE F
Figure 12 shows the comparative performance on UE F. It is running the smallest path among all UE. X-axis shows the time in second and the Y-axis shows the cells/sec.
Here more cells are added in soft handover and no cells are removed in soft handover due to small path. Here both handover performs better to provide seamless service.
At time =50sec Cells varies
_____________________________________________________________ Shipra Jain and Deepak Sinwar 53
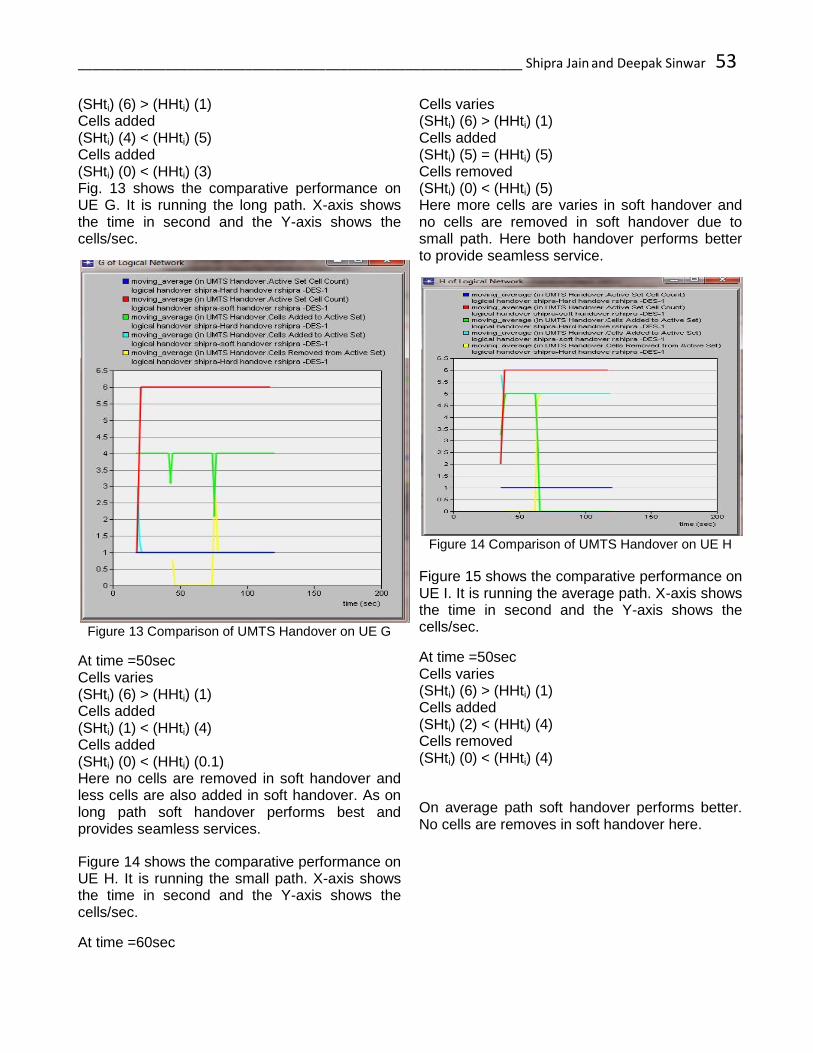
(SHti) (6) > (HHti) (1) Cells added (SHti) (4) < (HHti) (5) Cells added (SHti) (0) < (HHti) (3) Fig. 13 shows the comparative performance on UE G. It is running the long path. X-axis shows the time in second and the Y-axis shows the cells/sec.
Figure 13 Comparison of UMTS Handover on UE G
At time =50sec Cells varies (SHti) (6) > (HHti) (1) Cells added (SHti) (1) < (HHti) (4) Cells added (SHti) (0) < (HHti) (0.1) Here no cells are removed in soft handover and less cells are also added in soft handover. As on long path soft handover performs best and provides seamless services.
Figure 14 shows the comparative performance on UE H. It is running the small path. X-axis shows the time in second and the Y-axis shows the cells/sec.
At time =60sec
Cells varies (SHti) (6) > (HHti) (1) Cells added (SHti) (5) = (HHti) (5) Cells removed (SHti) (0) < (HHti) (5) Here more cells are varies in soft handover and no cells are removed in soft handover due to small path. Here both handover performs better to provide seamless service.
Figure 14 Comparison of UMTS Handover on UE H
Figure 15 shows the comparative performance on UE I. It is running the average path. X-axis shows the time in second and the Y-axis shows the cells/sec.
At time =50sec Cells varies (SHti) (6) > (HHti) (1) Cells added (SHti) (2) < (HHti) (4) Cells removed (SHti) (0) < (HHti) (4)
On average path soft handover performs better. No cells are removes in soft handover here.
54 Title Proportional analysis of Soft Handover & Hard Handover over metro city in UMTS ___________
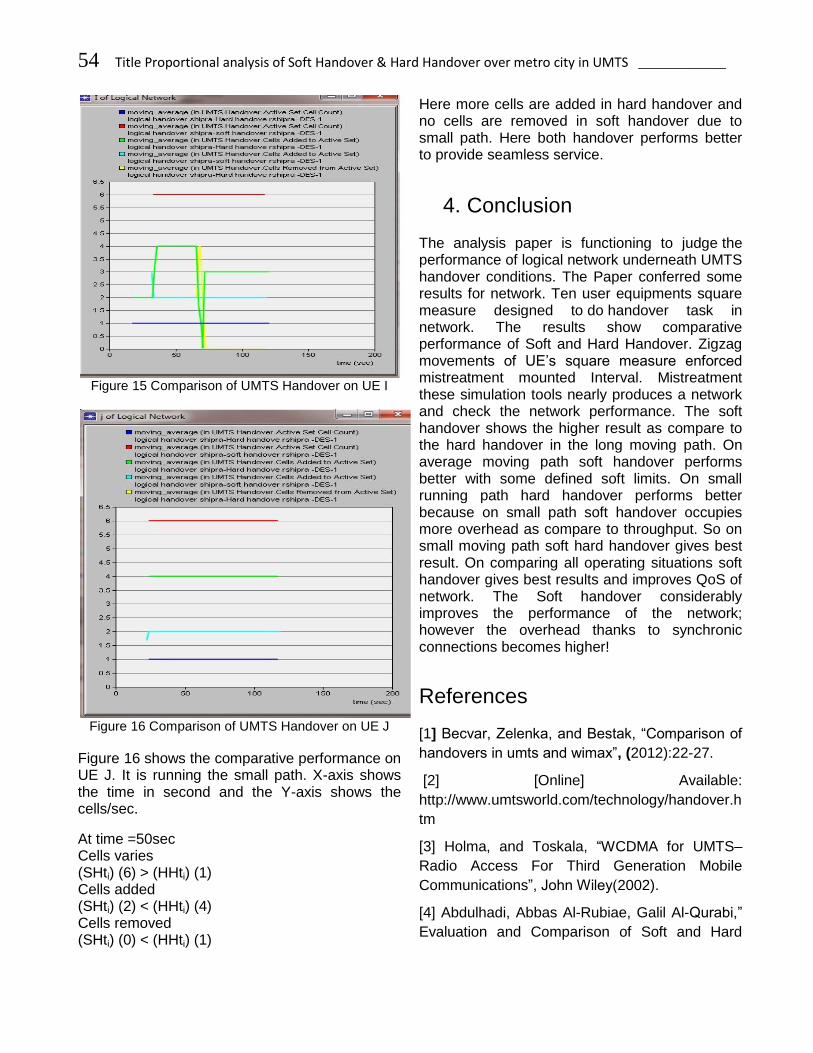
Figure 15 Comparison of UMTS Handover on UE I
Figure 16 Comparison of UMTS Handover on UE J
Figure 16 shows the comparative performance on UE J. It is running the small path. X-axis shows the time in second and the Y-axis shows the cells/sec.
At time =50sec Cells varies (SHti) (6) > (HHti) (1) Cells added (SHti) (2) < (HHti) (4) Cells removed (SHti) (0) < (HHti) (1)
Here more cells are added in hard handover and no cells are removed in soft handover due to small path. Here both handover performs better to provide seamless service.
4. Conclusion
The analysis paper is functioning to judge the performance of logical network underneath UMTS handover conditions. The Paper conferred some results for network. Ten user equipments square measure designed to do handover task in network. The results show comparative performance of Soft and Hard Handover. Zigzag movements of UE’s square measure enforced mistreatment mounted Interval. Mistreatment these simulation tools nearly produces a network and check the network performance. The soft handover shows the higher result as compare to the hard handover in the long moving path. On average moving path soft handover performs better with some defined soft limits. On small running path hard handover performs better because on small path soft handover occupies more overhead as compare to throughput. So on small moving path soft hard handover gives best result. On comparing all operating situations soft handover gives best results and improves QoS of network. The Soft handover considerably improves the performance of the network; however the overhead thanks to synchronic connections becomes higher!
References
[1] Becvar, Zelenka, and Bestak, “Comparison of
handovers in umts and wimax”, (2012):22-27.
[2] [Online] Available:
http://www.umtsworld.com/technology/handover.h
tm
[3] Holma, and Toskala, “WCDMA for UMTS–
Radio Access For Third Generation Mobile
Communications”, John Wiley(2002).
[4] Abdulhadi, Abbas Al-Rubiae, Galil Al-Qurabi,”
Evaluation and Comparison of Soft and Hard
_____________________________________________________________ Shipra Jain and Deepak Sinwar 55
Handovers in Universal Mobile
Telecommunication (UMTS) Networks”, Kerbala
University(2010): 8-11.
[5] Ramamurthy, Mortazawimolu,” Handover
between GSM (2G), UMTS (3G) and Wireless
Local Area Networks (WLANs)”.Deep Study
Report for Advanced Telecommunications
(2008):22-27.
[6] Sher Ali, Nasir Saleem, and Tayyaba Tareen, “Measuring the Performance of Handover Mechanisms in UMTS for Diverse Traffic Services Classes to Improve QoS”,International Journal of Computer Applications(2012): 0975 – 8887.
[7] Mobile Communications by Jochen Schiller.
[8] Tero Isotalo, Jarno Niemelä, Jakub Borkowski
and Jukka Lempiäinen “Impact of Pilot Pollution
on SHO Performance”
[Online]Available:http://www.cs.tut.fi/tlt/RNG/publi
cations/docs/topology/SHOpPP pDT.pdf
[9]Thomas Neubauer “UMTS – Universal Mobile
Telecommunications System”, Research Group
Mobile Communications, Technical University
[Online] Available
http://www.nt.tuwien.ac.at/mobile/projects/UMTS/
en/
[10] Chia and Warburton, “ Handover Criteria for
a City Microcellular Radio System,” in Proc 40th
IEEE (2002): 276-278.
[11] Junaid Ahmed Zubairi and Mike Zuber “suny
fredonia campus network simulation and
performance analysis using OPNET”
[Online].Available
http://www.cs.fredonia.edu/zubairi/opnet/op2k_jz.
pdf
[12] Benedičič, and. Korošec, “Balancing
downlink and uplink computational intelligence
Brisban(2012).
[13] chawal gupta , Comparative Study of Various
Handover Scenarios in WiMAX Network
,”International Journal of Advanced Research in
Electrical”, Electronics and Instrumentation
Engineering(2011).
[14] Dilprit. Sarddar et. all, "Minimization of
Handoff Failure by Introducing a New Cell
Coverage Area in the Handoff Region" ,IJCSI
International Journal of Computer Science
Issues,(2008):27-32.
[15] Van Quang, Venkatesha Prasadand and
Niemegeer, “A Survey on Handoffs - Lessons for
60 GHz based Wireless Systems”, Delft
University of Technology Mekelweg (2013):4-8.
[16] Birle,” Automated Call Transfer Technique for
Heterogeneous MANET”, International Journal of
Advanced Research in Computer Science and
Software Engineering ,(2012):6-9.
[17] Review Of Research Journal, Vol 2 Issue 8
May 2013, ISSN No : 2249-894X.
[18] Charu Rawal et. all ,” Implementation of soft
handover in 3G network using OPNET”, 2nd IEEE
conference (2013).