Embed Size (px)
Citation preview
The University of San FranciscoUSF Scholarship: a digital repository @ Gleeson Library |Geschke Center
Master's Projects and Capstones Theses, Dissertations, Capstones and Projects
Winter 12-12-2014
Does thorium have a place in the future U.S.electricity mix?Danny WestUniversity of San Francisco, [email protected]
Follow this and additional works at: https://repository.usfca.edu/capstone
Part of the Energy Policy Commons, Oil, Gas, and Energy Commons, and the Science andTechnology Studies Commons
This Project/Capstone is brought to you for free and open access by the Theses, Dissertations, Capstones and Projects at USF Scholarship: a digitalrepository @ Gleeson Library | Geschke Center. It has been accepted for inclusion in Master's Projects and Capstones by an authorized administratorof USF Scholarship: a digital repository @ Gleeson Library | Geschke Center. For more information, please contact [email protected].
Recommended CitationWest, Danny, "Does thorium have a place in the future U.S. electricity mix?" (2014). Master's Projects and Capstones. 101.https://repository.usfca.edu/capstone/101
i
Abstract
Thorium is an alternative fuel source for nuclear energy. Coupled with its use in a new
reactor design, called a Liquid Fluoride Thorium Reactor, the two have the ability to disrupt
the nuclear industry and power sector. Nuclear energy is a clean and reliable source of
energy; however, it generates hazardous waste that must be stored away for hundreds of
thousands of years and power plants are at risk of a catastrophic incident that can lead to a
wide scale release of radiation. These drawbacks to nuclear energy can be mitigated using
thorium in a Liquid Fluoride Thorium Reactor. These reactors have inherent safety features
that eliminate the chance of a nuclear meltdown, operate under safer conditions, and
prevent atmospheric exposure in the event of a reactor breach. Furthermore, using
thorium instead of uranium eliminates the need to enrich and fabricate fuel and generates
less waste that only needs to be stored for 300 years. The barriers that lay in the way of
developing thorium fuel cycles and Liquid Fluoride Thorium Reactors stems from a mature
industry and lack of governmental support for R&D programs. However, through an
assessment of different forecast scenarios, the benefits and effects of a new reactor design
and fuel cycle can be illustrated.
ii
Does thorium have a place in the future U.S. electricity mix? by Danny West
Table of Contents
Abstract ............................................................................................................................................. i List of Tables and Figures ........................................................................................................... iv List of Acronyms and Abbreviations ....................................................................................... v Chapter 1 Introduction ................................................................................................. 1
1.1 Nuclear Energy .......................................................................................................... 2 1.1.1 WWII and the Manhattan Project ...................................................................... 2 1.1.2 Post WWII Nuclear .................................................................................................. 4
1.2 Current State of the Nuclear Sector .................................................................. 5 1.2.1 Global ............................................................................................................................. 5 1.2.2 U.S. .................................................................................................................................. 6
1.3 Benefits and Drawbacks of Nuclear Energy ................................................. 7 1.3.1 Benefits ......................................................................................................................... 7 1.3.2 Drawbacks ................................................................................................................... 12 1.3.3 Nuclear Disasters ..................................................................................................... 15
1.4 Chapter Summary .................................................................................................... 18 Chapter 2 Thorium as a Nuclear Fuel ...................................................................... 19
2.1 Nuclear Fuel Cycles ................................................................................................. 19 2.1.1 Uranium-‐Plutonium Fuel Cycle .......................................................................... 19 2.1.2 Thorium-‐Uranium Fuel Cycle .............................................................................. 21
2.2 Uses in the Current U.S. Reactor Fleet ............................................................. 22 2.3 Liquid Fluoride Thorium Reactor ..................................................................... 23
2.3.1 How it Works ............................................................................................................. 24 2.3.2 Advantages of a Fluid System ............................................................................. 24 2.3.3 Current Research on MSRs ................................................................................... 27
2.4 Chapter Summary .................................................................................................... 28 Chapter 3 U.S. LFTR Fleet: Market Potential and Scenarios ............................. 29
3.1 Methods and Analysis ............................................................................................. 30 3.1.1 Theoretical Market Potential .............................................................................. 30 3.1.2 Scenarios ...................................................................................................................... 36
3.2 Results ........................................................................................................................... 42 3.2.1 Base Case ...................................................................................................................... 43 3.2.2 Nuclear After 2030 .................................................................................................. 44 3.2.3 Accelerated Retirements ....................................................................................... 45
iii
3.2.4 50 by 50 ........................................................................................................................ 46 3.3 Limitations .................................................................................................................. 47
3.3.1 Market Conditions .................................................................................................... 47 3.3.2 Reliance on the EIA AEO2014 ............................................................................. 47 3.3.3 Technological Readiness ....................................................................................... 47
Chapter 4 Benefits of a LFTR Fleet in the U.S. ....................................................... 49 4.1 Emissions ..................................................................................................................... 49 4.2 Waste Management ................................................................................................. 52 4.3 Safety ............................................................................................................................. 53 4.4 Costs ............................................................................................................................... 55 4.5 Chapter Summary .................................................................................................... 56
Chapter 5 Challenges to LFTR Development ......................................................... 57 5.1 Technical ...................................................................................................................... 57
5.1.1 Fission Product Removal ...................................................................................... 57 5.1.2 Corrosion ..................................................................................................................... 57 5.1.3 Proliferation ............................................................................................................... 58 5.1.4 Availability of Fuel ................................................................................................... 58
5.2 Political ......................................................................................................................... 59 5.3 Economic ...................................................................................................................... 59
Chapter 6 Conclusions and Recommendations .................................................... 61 6.1 Conclusions ................................................................................................................. 61 6.2 Recommendations ................................................................................................... 63
6.2.1 Acquire Funds ............................................................................................................ 63 6.2.2 Build Prototype and Small Test Reactor ........................................................ 64 6.2.3 Continued Research ................................................................................................ 64 6.2.4 Carbon Tax .................................................................................................................. 64 6.2.5 Waste Disposal Policy ............................................................................................ 65
Chapter 7 Literature Cited ........................................................................................... 66
iv
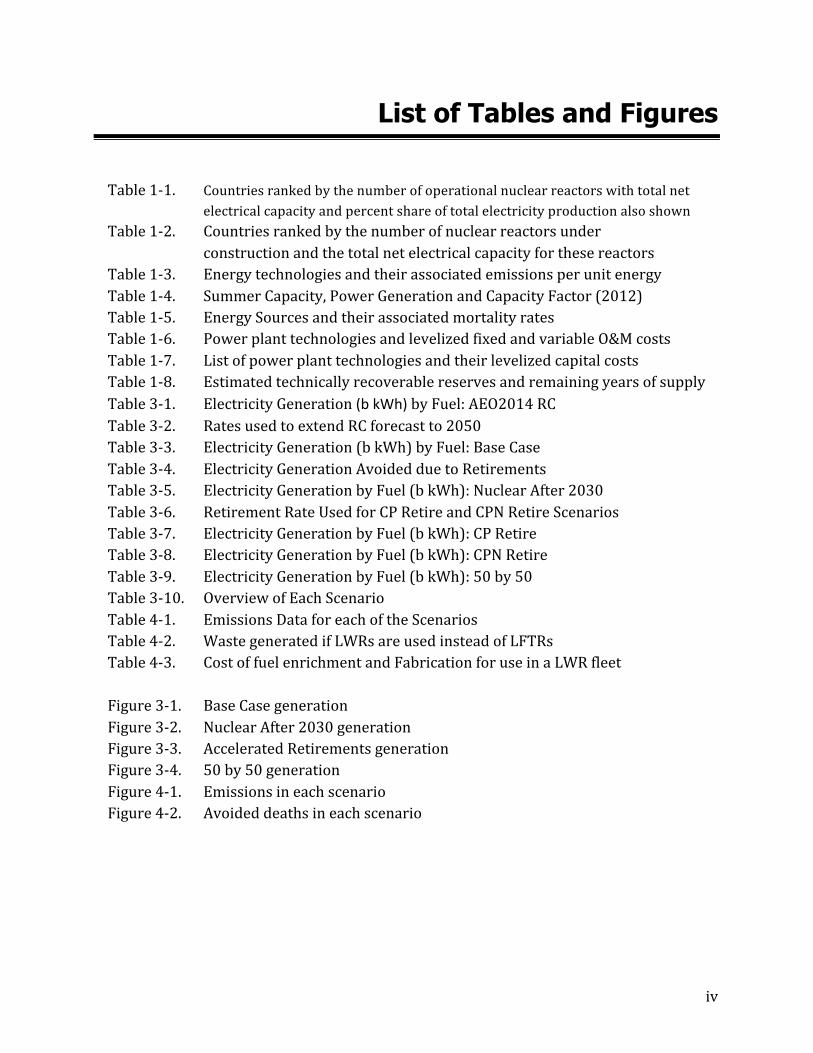
List of Tables and Figures Table 1-‐1. Countries ranked by the number of operational nuclear reactors with total net
electrical capacity and percent share of total electricity production also shown Table 1-‐2. Countries ranked by the number of nuclear reactors under
construction and the total net electrical capacity for these reactors Table 1-‐3. Energy technologies and their associated emissions per unit energy Table 1-‐4. Summer Capacity, Power Generation and Capacity Factor (2012) Table 1-‐5. Energy Sources and their associated mortality rates Table 1-‐6. Power plant technologies and levelized fixed and variable O&M costs Table 1-‐7. List of power plant technologies and their levelized capital costs Table 1-‐8. Estimated technically recoverable reserves and remaining years of supply Table 3-‐1. Electricity Generation (b kWh) by Fuel: AEO2014 RC Table 3-‐2. Rates used to extend RC forecast to 2050 Table 3-‐3. Electricity Generation (b kWh) by Fuel: Base Case Table 3-‐4. Electricity Generation Avoided due to Retirements Table 3-‐5. Electricity Generation by Fuel (b kWh): Nuclear After 2030 Table 3-‐6. Retirement Rate Used for CP Retire and CPN Retire Scenarios Table 3-‐7. Electricity Generation by Fuel (b kWh): CP Retire Table 3-‐8. Electricity Generation by Fuel (b kWh): CPN Retire Table 3-‐9. Electricity Generation by Fuel (b kWh): 50 by 50 Table 3-‐10. Overview of Each Scenario Table 4-‐1. Emissions Data for each of the Scenarios Table 4-‐2. Waste generated if LWRs are used instead of LFTRs Table 4-‐3. Cost of fuel enrichment and Fabrication for use in a LWR fleet
Figure 3-‐1. Base Case generation Figure 3-‐2. Nuclear After 2030 generation Figure 3-‐3. Accelerated Retirements generation Figure 3-‐4. 50 by 50 generation Figure 4-‐1. Emissions in each scenario Figure 4-‐2. Avoided deaths in each scenario
v
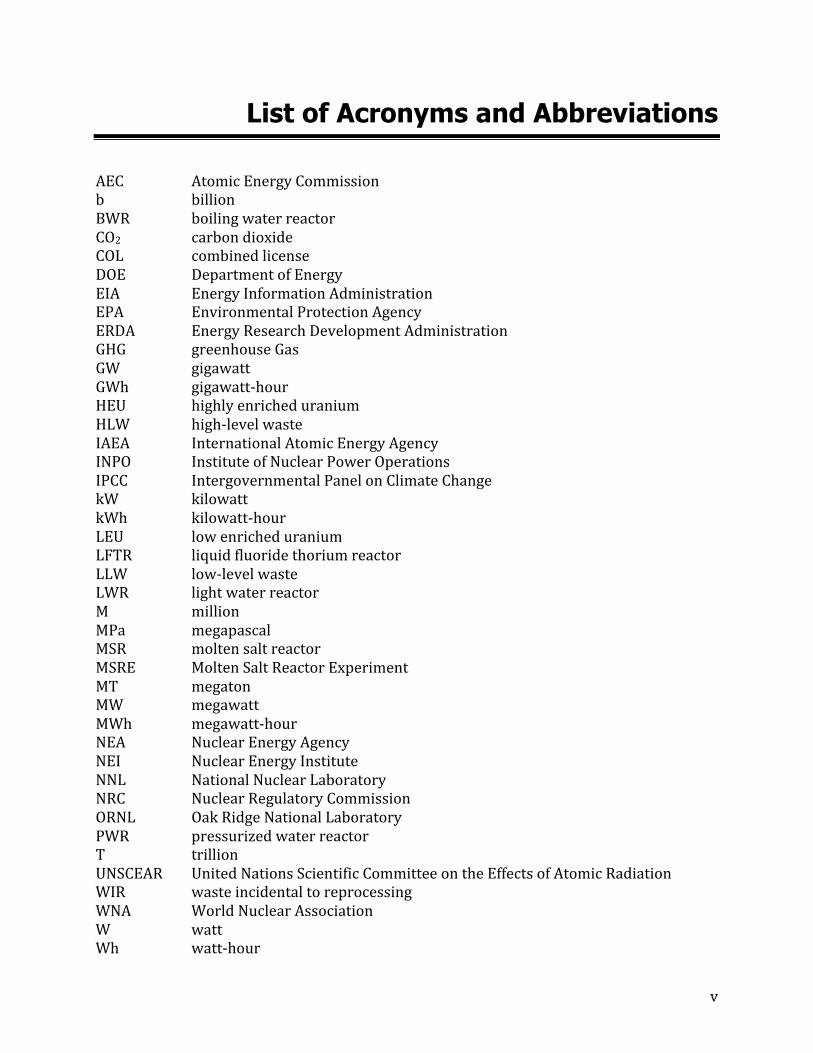
List of Acronyms and Abbreviations AEC Atomic Energy Commission b billion BWR boiling water reactor CO2 carbon dioxide COL combined license DOE Department of Energy EIA Energy Information Administration EPA Environmental Protection Agency ERDA Energy Research Development Administration GHG greenhouse Gas GW gigawatt GWh gigawatt-‐hour HEU highly enriched uranium HLW high-‐level waste IAEA International Atomic Energy Agency INPO Institute of Nuclear Power Operations IPCC Intergovernmental Panel on Climate Change kW kilowatt kWh kilowatt-‐hour LEU low enriched uranium LFTR liquid fluoride thorium reactor LLW low-‐level waste LWR light water reactor M million MPa megapascal MSR molten salt reactor MSRE Molten Salt Reactor Experiment MT megaton MW megawatt MWh megawatt-‐hour NEA Nuclear Energy Agency NEI Nuclear Energy Institute NNL National Nuclear Laboratory NRC Nuclear Regulatory Commission ORNL Oak Ridge National Laboratory PWR pressurized water reactor T trillion UNSCEAR United Nations Scientific Committee on the Effects of Atomic Radiation WIR waste incidental to reprocessing WNA World Nuclear Association W watt Wh watt-‐hour
1
Chapter 1 Introduction
Average global temperatures have steadily risen over the past few decades, which can
be linked to a rise in CO2 levels. CO2 is a greenhouse has (GHG) and as the concentration of
CO2 in the atmosphere increases, there are several consequences that follow. GHGs trap
heat in the atmosphere, which subsequently raises global temperatures. As a result
mountain glaciers around the world are receding, threatening fresh water supply for
millions of people. Coral reefs, rich in species diversification and home to a fourth of all
species found in the ocean, are threatened by rising temperatures and ocean acidification
due to increased CO2 concentrations. (Hansen, 2014) These are just some of the many
examples of the detrimental effects of global warming.
In the U.S., the power sector makes up the largest share of GHG emissions at 32%. (EPA,
2014) Reliance on fossil fuels has contributed significantly to global GHG emissions, which
through combustion, releases significant amounts of CO2. The demand for electricity is
projected to grow by 0.9% a year over the next 25 years; therefore, added capacity is
needed to meet the demand. In order to mitigate the negative effects of power generation,
the U.S. must take careful consideration when choosing a source of energy to add to the
electricity grid: one that is cheap, safe, reliable, clean, and efficient.
Current energy production is dominated by fossil fuels, mainly coal and natural gas,
which make up 67% of the total generation mix. (AEO2014, 2014) The emissions from
burning fossil fuels have well known adverse health effects on human, biological and
environmental life. Alternative energies such as renewables and nuclear must be sought
after instead. Renewables are somewhat limited in that they are intermittent and depend
on specific weather conditions. Furthermore, they can only be placed in specific geographic
locations that are suited to their needs. Therefore, nuclear energy is an option worth
exploring.
2
The remainder of the chapter takes the reader through the discovery of nuclear energy
to the current status of the nuclear industry, and provides an explanation of the advantages
and disadvantages of nuclear energy.
1.1 Nuclear Energy
Nuclear energy is the result of an atom splitting apart, or what is called the process of
fission. Within an atom is a tremendous amount of stored energy and when it fissions, it
releases this energy mainly in the form of heat. That heat is used to boil water, producing
steam, which drives a turbine and generates electricity. There are only two known atoms
naturally found on earth that are suitable for use in a nuclear reactor: uranium and
thorium.
Uranium exists in nature predominantly as two isotopes: 99.3% 238U and 0.7% 235U. The 238U isotope is fertile, while the 235U isotope is fissile. A fertile isotope, or nuclide, is one
that can be converted into a fissile isotope by absorbing a neutron. A fissile nuclide is
capable of undergoing fission after absorbing a neutron. Thorium exists in nature solely as
the fertile isotope 232Th.
1.1.1 WWII and the Manhattan Project
The energy potential of uranium and thorium were both discovered in the years leading
up to World War II, which plays a crucial role in the development of the two elements as an
energy source. Just a month after Hitler declared war on Europe, Albert Einstein wrote a
letter to Franklin D. Roosevelt, then president of the U.S., alerting him that it was possible
to create very powerful bombs by harnessing the power produced from a uranium chain
reaction. Roosevelt, worried about the Germans pursuing this technology, responded by
establishing the Uranium Committee, which later evolved into the Manhattan Project, a U.S.
government funded project aimed at creating an atomic bomb. (Gosling, 2010)
Around that time, Glenn Seaborg, a scientist at the University of California, Berkeley,
and his graduate student John Gofman, began experimenting with thorium. Seaborg
theorized that if 232Th were bombarded with neutrons it might decay into a new
3
radioactive isotope. By April of 1941, Seaborg and Gofman had confirmed that a new
radioisotope, 233U, was indeed created during neutron absorption of 232Th. More
importantly, they had discovered that 233U could potentially be used as a nuclear fuel
source. On April 23, Seaborg wrote in his journal:
“Of special importance is our demonstration through these results that U-‐233 is sufficiently long-‐lived to be a practical source of nuclear energy should it be found to be fissionable with slow neutrons and should methods for its large scale production be developed.” (Seaborg, 1976)
It was earlier that year, however, that Seaborg and a different team of scientists had
discovered a new element, which was formed through neutron absorption of 238U. This new
element would later be named plutonium (Pu). Within the next few months, they
discovered that 239Pu was fissile (Sorenson, 2014) and furthermore, that it was 1.7 times
more likely to fission than 235U. (Gosling, 2010) Up until this point, 235U was the only other
material that was known to be fissile and had been the focal point around the U.S. military’s
effort to develop a nuclear weapon. Additionally, it was an extremely laborious and
expensive task to separate (enrich) 235U from 238U. (Gosling, 2010) The discovery that 239Pu was fissile allowed scientists an alternative pathway to obtain fissile material; instead
of trying to separate 235U from 238U, they could build a nuclear reactor where the fission of 235U would release neutrons that could be absorbed by 238U to create 239Pu. (Sorensen,
2014) This type of reactor, one that creates more fuel than is consumed, is known as a
breeder reactor.
Seaborg continued to research the thorium fuel cycle, specifically, determining if 233U
was fissile. (Sorensen, 2014) Then on December 7, 1941, the Japanese attacked Pearl
Harbor and the U.S. officially became involved in the war. Seaborg joined a group of
scientists at the University of Chicago working on a 239Pu breeder reactor. This project was
a branch of the Manhattan Project code named the Metallurgical Laboratory (Met Lab).
(Gosling, 2010) By February of 1942, Seaborg’s team had discovered that 233U was a fissile
material and later discovered that it was better than 235U at slow neutron fission.
(Sorensen, 2014) However, the uranium-‐plutonium fuel cycle had over a year’s worth of
4
research and was in full development by this time. And although 233U had similar fissile
properties as 239Pu, plutonium was the preferred choice for creating a nuclear weapon. This
is because the parent material for 233U, 232Th, is not fissile and thus needs 233U, 235U, or 239Pu to achieve a chain reaction. The purpose of the Met Lab was to create fissile material,
thus using any in the process of making more would be counterproductive. (Sorensen,
2014)
Although Seaborg continued his efforts in understanding thorium and its nuclear
properties, it was deemed an unsuitable material for making a weapon and the rest of the
scientific community focused on the development of plutonium, while thorium research
became less and less important. (Sorensen, 2014) Over the next few years, the first
plutonium breeder reactors were built, leading to the creation of the first atomic bombs,
which were later used to end the war.
1.1.2 Post WWII Nuclear
After the war, the nuclear industry began focusing on developing breeder reactors that
could also generate electricity. In 1946, the U.S. Congress created the Atomic Energy
Commission (AEC) whose mission was to promote and control peaceful applications of
nuclear science. Nevertheless, the U.S. government was still determined in obtaining
plutonium for the weapons program; thus, the uranium-‐plutonium cycle was chosen for
use in these new power reactors. The AEC authorized the construction of an experimental
reactor that would be used to generate electricity, which came online in the end of 1951.
Soon after, there was a large push for the development of a commercial reactor and in
1957, the first large-‐scale nuclear power plant was completed in Shippingport,
Pennsylvania and within a few months, the reactor reached its operational capacity,
supplying electricity to the Pittsburg area.
With the success in Shippingport, utility companies saw nuclear energy as a cheap
means of generating electricity and the nuclear industry saw tremendous growth
throughout the 60s. However, concerns arose regarding the environmental and public
health effects nuclear waste may cause. The AEC’s regulatory policies came under heavy
fire and under the Energy Reorganization Act of 1974, the AEC was divided into two
5
agencies, the Energy Research and Development Administration (ERDA), to carry out
research and development, and the Nuclear Regulatory Commission (NRC), to regulate
nuclear power. New regulations and a decrease in the demand for electricity slowed
growth during the 70s. In 1979, there was a partial meltdown at Three Mile Island, which
created a public uproar. Seven years later in 1986, there was a complete meltdown and
explosion at the Chernobyl power plant. The last and most recent major incident occurred
in 2011 at the Fukushima Daiichi power plant in Japan, which further tarnished the public
opinion of nuclear energy.
1.2 Current State of the Nuclear Sector 1.2.1 Global
Since the first commercial reactor went online in 1957, there has been a steady increase
in the number of operational reactors as well as installed capacity available for the
electrical grid. As of October 2014, the International Atomic Energy Agency (IAEA) reports
that there are 437 reactors in operation in 30 countries with another 72 under
construction in 15 countries. The total installed capacity for the operational reactors is
379.5 GW with another 71.7 GW in construction. (IAEA3, 2014; IAEA2, 2014) The U.S. has
nearly twice as many operational reactors as any other country. The following tables show
the countries ranked by the number of operational reactors and the number of reactors
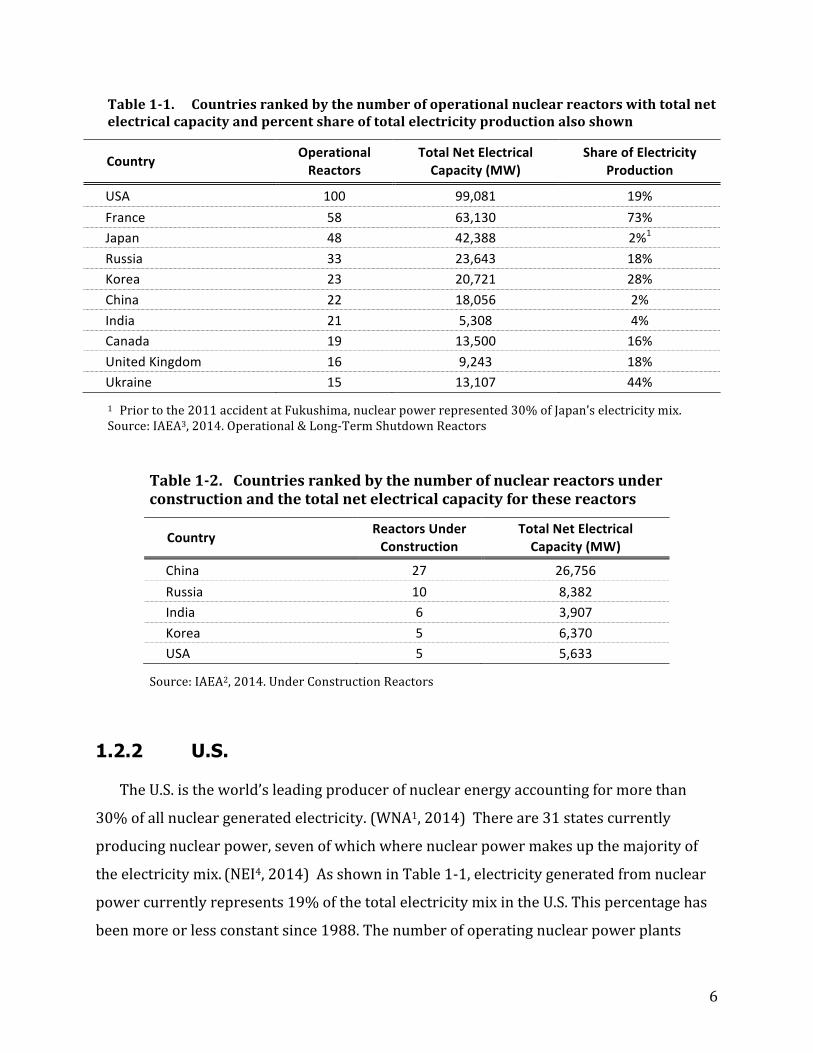
under construction. Looking at Table 1-‐1, you see that although the U.S. leads the way in
the number of reactors, France clearly has the largest share of electricity produced from
nuclear power at 73%. From Table 1-‐2, it is evident that China is aggressively pursuing
nuclear energy and has more capacity under construction than currently installed.
6
Table 1-‐1. Countries ranked by the number of operational nuclear reactors with total net electrical capacity and percent share of total electricity production also shown
Country Operational Reactors
Total Net Electrical Capacity (MW)
Share of Electricity Production
USA 100 99,081 19% France 58 63,130 73% Japan 48 42,388 2%1 Russia 33 23,643 18% Korea 23 20,721 28% China 22 18,056 2% India 21 5,308 4% Canada 19 13,500 16% United Kingdom 16 9,243 18% Ukraine 15 13,107 44%
1 Prior to the 2011 accident at Fukushima, nuclear power represented 30% of Japan’s electricity mix. Source: IAEA3, 2014. Operational & Long-‐Term Shutdown Reactors
Table 1-‐2. Countries ranked by the number of nuclear reactors under construction and the total net electrical capacity for these reactors
Country Reactors Under Construction
Total Net Electrical Capacity (MW)
China 27 26,756 Russia 10 8,382 India 6 3,907 Korea 5 6,370 USA 5 5,633
Source: IAEA2, 2014. Under Construction Reactors 1.2.2 U.S.
The U.S. is the world’s leading producer of nuclear energy accounting for more than
30% of all nuclear generated electricity. (WNA1, 2014) There are 31 states currently
producing nuclear power, seven of which where nuclear power makes up the majority of
the electricity mix. (NEI4, 2014) As shown in Table 1-‐1, electricity generated from nuclear
power currently represents 19% of the total electricity mix in the U.S. This percentage has
been more or less constant since 1988. The number of operating nuclear power plants
7
peaked in 1991 at 112. Regulations imposed by the NRC have made it difficult to obtain a
combined license (COL) to build and operate a new facility. Since the Three Mile Incident in
1979, the NRC has only granted 4 new construction permits, all in 2012. There are
currently 100 reactors still operational, with 5 more currently under construction, four
new and one that has resumed construction after getting temporarily shut down in the 80s.
(IAEA1, 2014) Every reactor in the U.S. fleet is a light water reactor (LWR): 65 of which are
pressurized water reactors (PWRs) and 35 boiling water reactors (BWRs).
1.3 Benefits and Drawbacks of Nuclear Energy
There are several benefits of using nuclear energy. For more than half a century,
nuclear power has been a reliable, efficient, and clean means of generating electricity. As is
the case with any method of generating electricity, nuclear power has its drawbacks as
well. While these drawbacks have serious implications for the future of the nuclear
industry and need to be answered, the public perception of nuclear power has been
tarnished by less than a handful of incidents and many of the concerns with nuclear power
are unwarranted. The following section will explore the benefits and drawbacks of nuclear
energy using uranium as a fuel source and when possible compare it to other generating
technologies.
1.3.1 Benefits 1.3.1.1 Environmental
Nuclear energy is one of the cleanest forms of energy; i.e. nuclear reactors do not
generate GHG emissions while creating electricity. The only emissions from nuclear power
come from the upstream and downstream activities (mining, construction, fuel processing,
etc.) The construction of a nuclear power plant requires a significant amount of resources
and energy input, which in turn generates GHGs; however, this is a relatively small
proportion compared to the energy output of the power plant once it is operational. The
most appropriate way to compare GHG emissions across the different forms of energy is
8
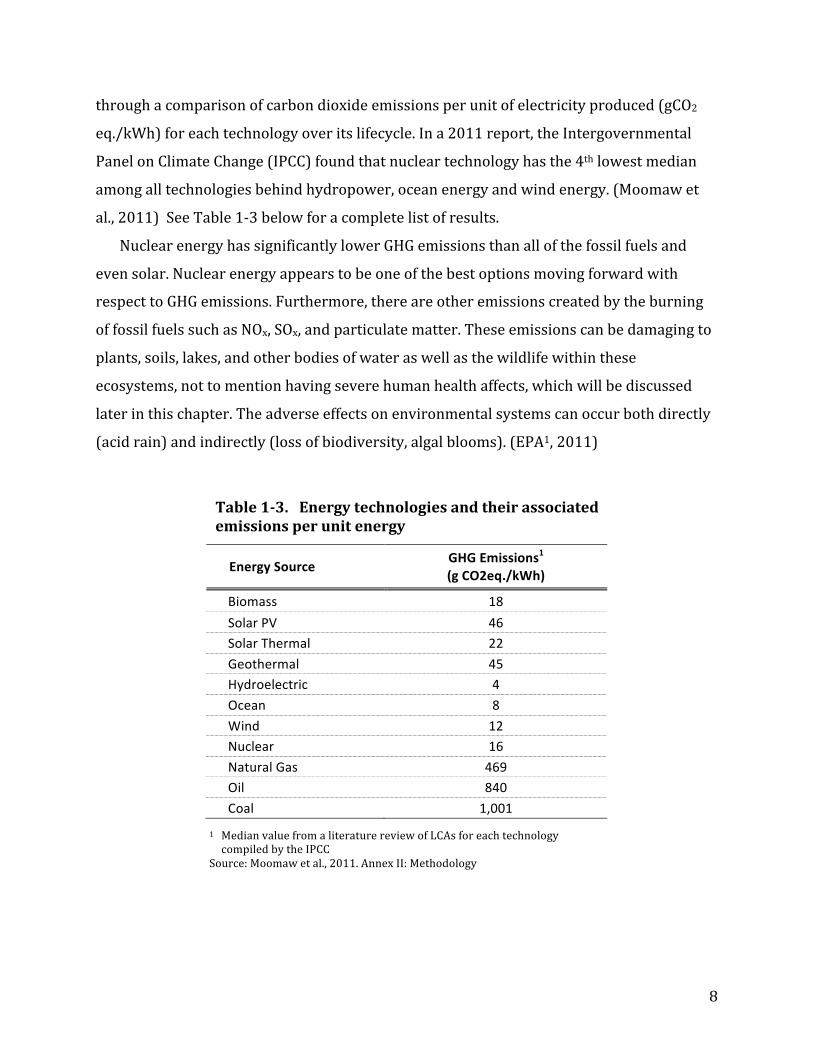
through a comparison of carbon dioxide emissions per unit of electricity produced (gCO2
eq./kWh) for each technology over its lifecycle. In a 2011 report, the Intergovernmental
Panel on Climate Change (IPCC) found that nuclear technology has the 4th lowest median
among all technologies behind hydropower, ocean energy and wind energy. (Moomaw et
al., 2011) See Table 1-‐3 below for a complete list of results.
Nuclear energy has significantly lower GHG emissions than all of the fossil fuels and
even solar. Nuclear energy appears to be one of the best options moving forward with
respect to GHG emissions. Furthermore, there are other emissions created by the burning
of fossil fuels such as NOx, SOx, and particulate matter. These emissions can be damaging to
plants, soils, lakes, and other bodies of water as well as the wildlife within these
ecosystems, not to mention having severe human health affects, which will be discussed
later in this chapter. The adverse effects on environmental systems can occur both directly
(acid rain) and indirectly (loss of biodiversity, algal blooms). (EPA1, 2011)
Table 1-‐3. Energy technologies and their associated emissions per unit energy
Energy Source GHG Emissions1 (g CO2eq./kWh)
Biomass 18 Solar PV 46 Solar Thermal 22 Geothermal 45 Hydroelectric 4 Ocean 8 Wind 12 Nuclear 16 Natural Gas 469 Oil 840 Coal 1,001
1 Median value from a literature review of LCAs for each technology compiled by the IPCC
Source: Moomaw et al., 2011. Annex II: Methodology
9
1.3.1.2 Reliability
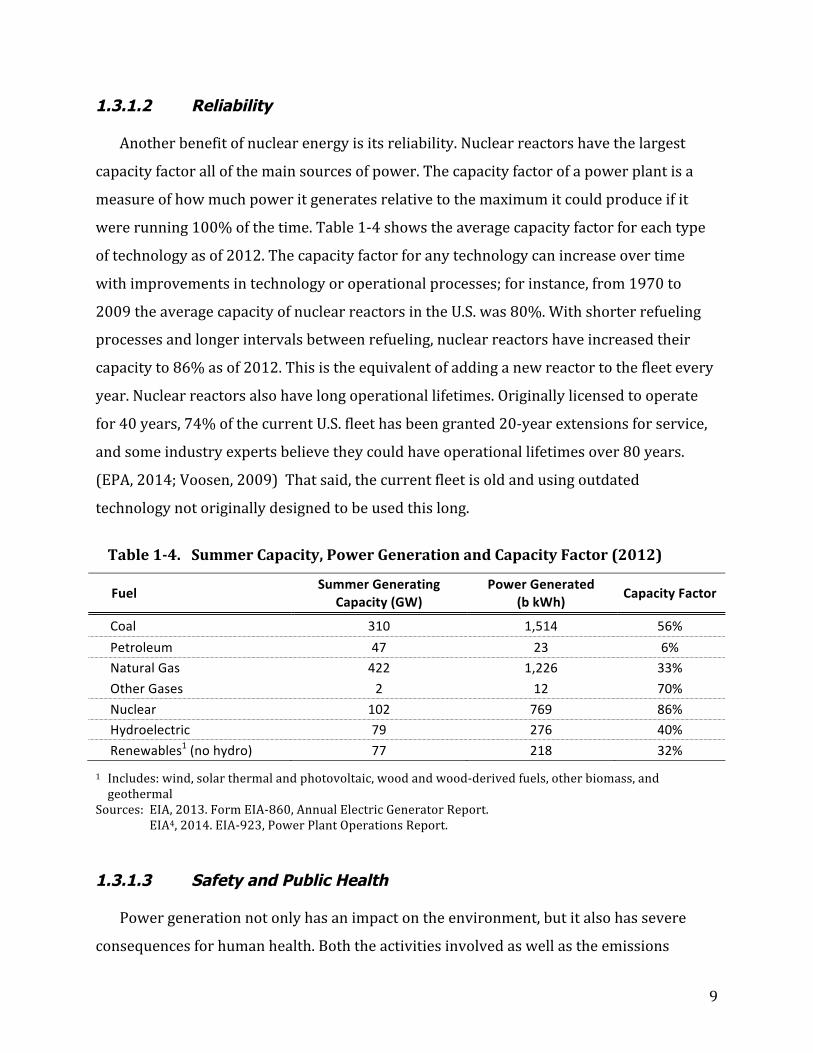
Another benefit of nuclear energy is its reliability. Nuclear reactors have the largest
capacity factor all of the main sources of power. The capacity factor of a power plant is a
measure of how much power it generates relative to the maximum it could produce if it
were running 100% of the time. Table 1-‐4 shows the average capacity factor for each type
of technology as of 2012. The capacity factor for any technology can increase over time
with improvements in technology or operational processes; for instance, from 1970 to
2009 the average capacity of nuclear reactors in the U.S. was 80%. With shorter refueling
processes and longer intervals between refueling, nuclear reactors have increased their
capacity to 86% as of 2012. This is the equivalent of adding a new reactor to the fleet every
year. Nuclear reactors also have long operational lifetimes. Originally licensed to operate
for 40 years, 74% of the current U.S. fleet has been granted 20-‐year extensions for service,
and some industry experts believe they could have operational lifetimes over 80 years.
(EPA, 2014; Voosen, 2009) That said, the current fleet is old and using outdated
technology not originally designed to be used this long.
Table 1-‐4. Summer Capacity, Power Generation and Capacity Factor (2012)
Fuel Summer Generating Capacity (GW)
Power Generated (b kWh) Capacity Factor
Coal 310 1,514 56% Petroleum 47 23 6% Natural Gas 422 1,226 33% Other Gases 2 12 70% Nuclear 102 769 86% Hydroelectric 79 276 40% Renewables1 (no hydro) 77 218 32%
1 Includes: wind, solar thermal and photovoltaic, wood and wood-‐derived fuels, other biomass, and geothermal
Sources: EIA, 2013. Form EIA-‐860, Annual Electric Generator Report. EIA4, 2014. EIA-‐923, Power Plant Operations Report. 1.3.1.3 Safety and Public Health
Power generation not only has an impact on the environment, but it also has severe
consequences for human health. Both the activities involved as well as the emissions
10
generated from each technology lead to externalities affecting thousands of people every
year here in the U.S. In order to reasonably compare the human health effects from each
technology, we can measure the number of fatalities per unit of energy (deaths/T kWh).
While normally, any amount of deaths associated to a power generating technology should
be viewed as a drawback, the variance among each technology is large enough that certain
technologies should be viewed as “better” in terms of public health, and thus it is included
it in the benefits section. See Table 1-‐5 for a comparison of the different technologies. The
values represent the number of lives that can be attributed to each technology across its
entire lifecycle. The types of deaths associated with each technology include but are not
limited to: direct work related incidents at all stages of production (mining, transportation,
operation, etc.), as well as indirect causes (respiratory and cardiovascular disease from
pollutants, radiation exposure, etc.). (Conca, 2012) An explanation of the table and values
follows.
First to gain some perspective, the total global energy generation in 2013 was roughly 4
trillion kilowatt-‐hours (T kWh), which is the unit of the denominator in the fatality rate.
Second, these figures go back to the inception of each technology so many of the figures are
subject to variability and are estimates taken from scientific and governmental reports.
Furthermore, because these figures represent the cumulative energy generated for each
technology, these rates are improving as each technology becomes safer. It is also
important to note that all of the figures are global estimates except for coal, which is a U.S.
estimate. The reason for doing so is because the coal policies and regulations set forth in
the U.S. are much stricter and therefore safer than other countries. For example, the coal
related deaths in China equate to roughly 90,000 deaths per T kWh. (Conca, 2012) The U.S.
figure is significantly lower due to the strict regulation of the Clean Air Act.
The numbers for oil, biomass, natural gas, and coal are high due to the expected
epidemiological deaths associated to air pollutants. It is estimated that nearly 30,000
Americans die prematurely every year due to cardiovascular and respiratory disease from
coal alone. (Conca, 2012) Coal produces the largest amount of emissions, which is why it
has the highest mortality rate. The deaths attributed to solar and wind technologies are due
mainly to installation and maintenance related activities, such as falling from a roof or the
top of a turbine. (Conca, 2012) Nuclear is at the bottom of the list with the lowest mortality
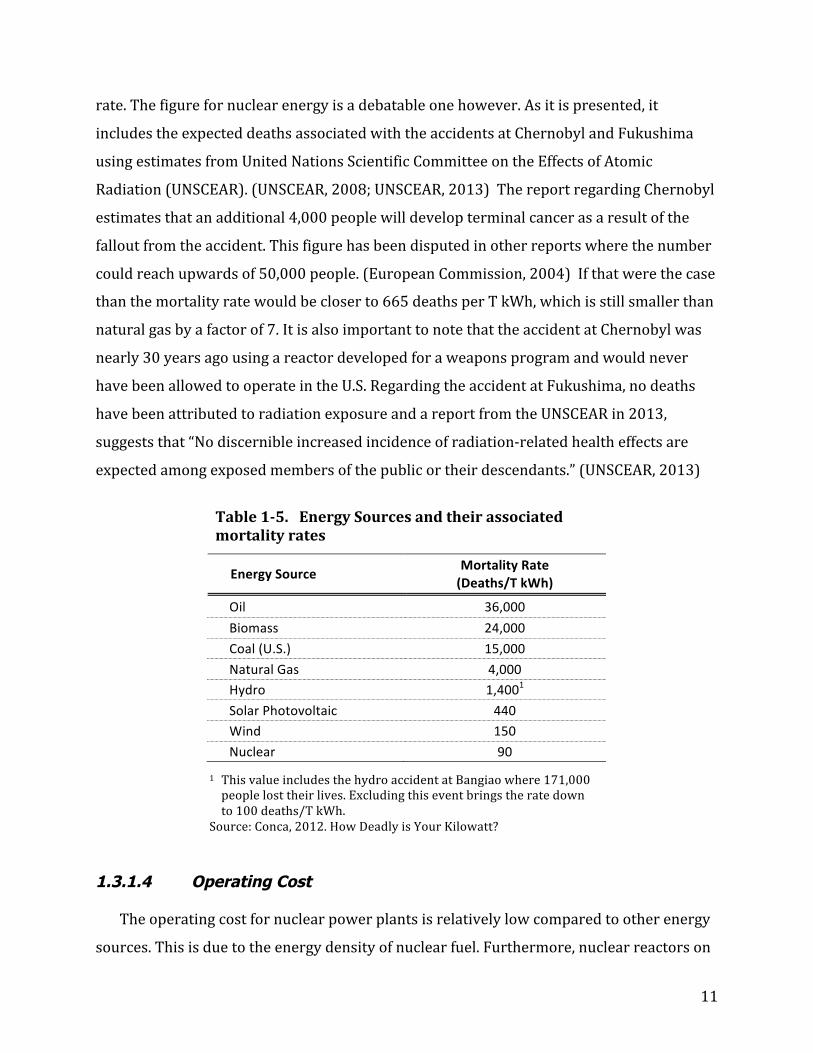
11
rate. The figure for nuclear energy is a debatable one however. As it is presented, it
includes the expected deaths associated with the accidents at Chernobyl and Fukushima
using estimates from United Nations Scientific Committee on the Effects of Atomic
Radiation (UNSCEAR). (UNSCEAR, 2008; UNSCEAR, 2013) The report regarding Chernobyl
estimates that an additional 4,000 people will develop terminal cancer as a result of the
fallout from the accident. This figure has been disputed in other reports where the number
could reach upwards of 50,000 people. (European Commission, 2004) If that were the case
than the mortality rate would be closer to 665 deaths per T kWh, which is still smaller than
natural gas by a factor of 7. It is also important to note that the accident at Chernobyl was
nearly 30 years ago using a reactor developed for a weapons program and would never
have been allowed to operate in the U.S. Regarding the accident at Fukushima, no deaths
have been attributed to radiation exposure and a report from the UNSCEAR in 2013,
suggests that “No discernible increased incidence of radiation-‐related health effects are
expected among exposed members of the public or their descendants.” (UNSCEAR, 2013)
Table 1-‐5. Energy Sources and their associated mortality rates
Energy Source Mortality Rate (Deaths/T kWh)
Oil 36,000 Biomass 24,000 Coal (U.S.) 15,000 Natural Gas 4,000 Hydro 1,4001 Solar Photovoltaic 440 Wind 150 Nuclear 90
1 This value includes the hydro accident at Bangiao where 171,000 people lost their lives. Excluding this event brings the rate down to 100 deaths/T kWh.
Source: Conca, 2012. How Deadly is Your Kilowatt? 1.3.1.4 Operating Cost
The operating cost for nuclear power plants is relatively low compared to other energy
sources. This is due to the energy density of nuclear fuel. Furthermore, nuclear reactors on

12
average are refueled every 18 to 24 months of operational use, where fossil fuel plants
need to be refueled every day. (EIA1, 2011) Table 1-‐6 lists the levelized fixed and variable
O&M costs (in 2012 $/MWh) attributed to each plant type calculated by the Energy
Information Administration (EIA) for new power plants coming online in 2019. Excluding
renewables (geothermal, wind, solar and hydro), nuclear power plants are the cheapest
power plants to operate and maintain. What are not shown here however, are the capital
requirements to build such plants, which will be discussed later in the chapter.
Table 1-‐6. Power plant technologies and levelized fixed and variable O&M costs
Plant Type Fixed O&M (2012 $/MWh)
Variable O&M (including fuel) (2012 $/MWh)
Total O&M Cost (2012 $/MWh)
Conventional Coal 4.2 30.3 34.5
Integrated Coal-‐Gasification Combined Cycle (IGCC) 6.9 31.7 38.6 IGCC with Carbon Capture Sequestration (CCS) 9.8 38.6 48.4
Natural Gas (NG) Conventional Combined Cycle (CC) 1.7 49.1 50.8 NG Advanced CC 2.0 45.5 47.5
NG Advanced CC with CCS 4.2 55.6 59.8 NG Conventional Combustion Turbine 2.8 82 84.8
NG Advanced Combustion Turbine 2.7 70.3 73.0
Advanced Nuclear 11.8 11.8 23.6 Geothermal 12.2 0.0 12.2
Biomass 14.5 39.5 54.0 Wind 13.0 0.0 13.0
Offshore Wind 22.8 0.0 22.8
Solar PV 11.4 0.0 11.4 Solar Thermal 42.1 0.0 42.1
Hydro 4.1 6.4 10.5
Source: EIA2, 2014. Levelized Cost and Levelized Avoided Cost of New Generation Resources in the Annual Energy Outlook 2014
1.3.2 Drawbacks 1.3.2.1 Costs
The cost for building new nuclear power plant includes both the capital costs
(equipment, materials and labor for construction) as well as the financing cost. Table 1-‐7
lists the levelized capital costs (in 2012 $/MWh) attributed to each plant type calculated by
13
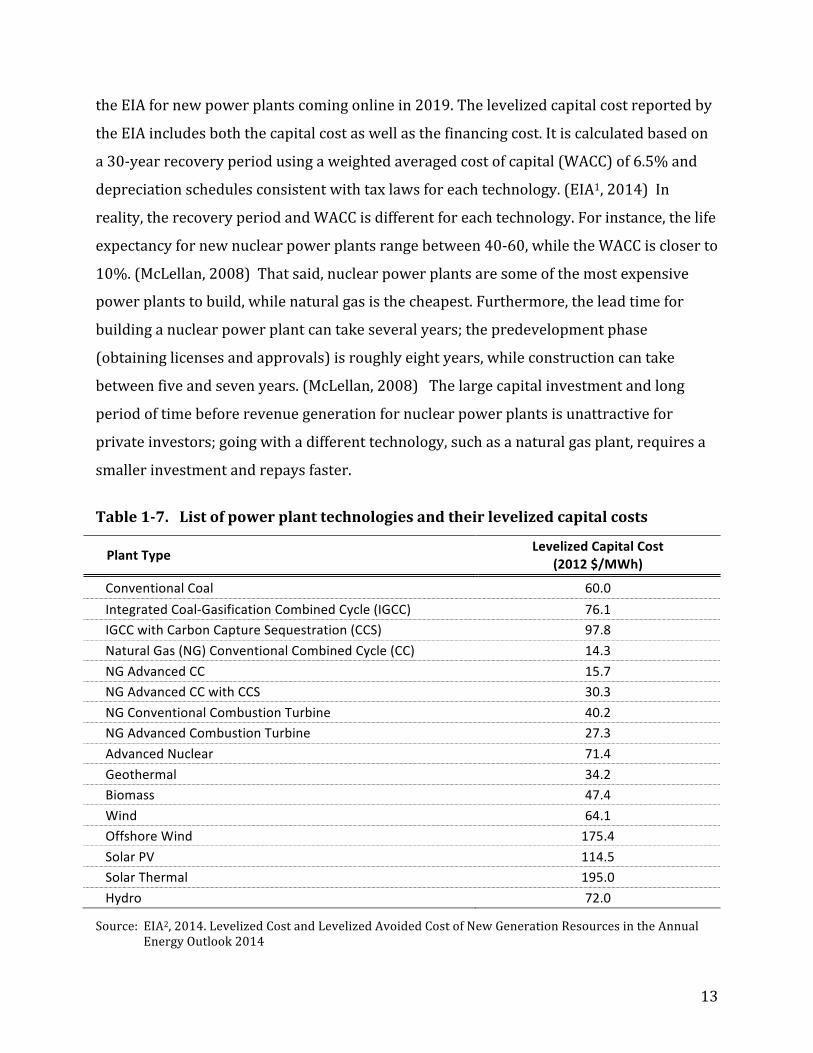
the EIA for new power plants coming online in 2019. The levelized capital cost reported by
the EIA includes both the capital cost as well as the financing cost. It is calculated based on
a 30-‐year recovery period using a weighted averaged cost of capital (WACC) of 6.5% and
depreciation schedules consistent with tax laws for each technology. (EIA1, 2014) In
reality, the recovery period and WACC is different for each technology. For instance, the life
expectancy for new nuclear power plants range between 40-‐60, while the WACC is closer to
10%. (McLellan, 2008) That said, nuclear power plants are some of the most expensive
power plants to build, while natural gas is the cheapest. Furthermore, the lead time for
building a nuclear power plant can take several years; the predevelopment phase
(obtaining licenses and approvals) is roughly eight years, while construction can take
between five and seven years. (McLellan, 2008) The large capital investment and long
period of time before revenue generation for nuclear power plants is unattractive for
private investors; going with a different technology, such as a natural gas plant, requires a
smaller investment and repays faster.
Table 1-‐7. List of power plant technologies and their levelized capital costs
Plant Type Levelized Capital Cost (2012 $/MWh)
Conventional Coal 60.0 Integrated Coal-‐Gasification Combined Cycle (IGCC) 76.1 IGCC with Carbon Capture Sequestration (CCS) 97.8 Natural Gas (NG) Conventional Combined Cycle (CC) 14.3 NG Advanced CC 15.7 NG Advanced CC with CCS 30.3 NG Conventional Combustion Turbine 40.2 NG Advanced Combustion Turbine 27.3 Advanced Nuclear 71.4 Geothermal 34.2 Biomass 47.4 Wind 64.1 Offshore Wind 175.4 Solar PV 114.5 Solar Thermal 195.0 Hydro 72.0
Source: EIA2, 2014. Levelized Cost and Levelized Avoided Cost of New Generation Resources in the Annual Energy Outlook 2014
14
1.3.2.2 Non-Renewable
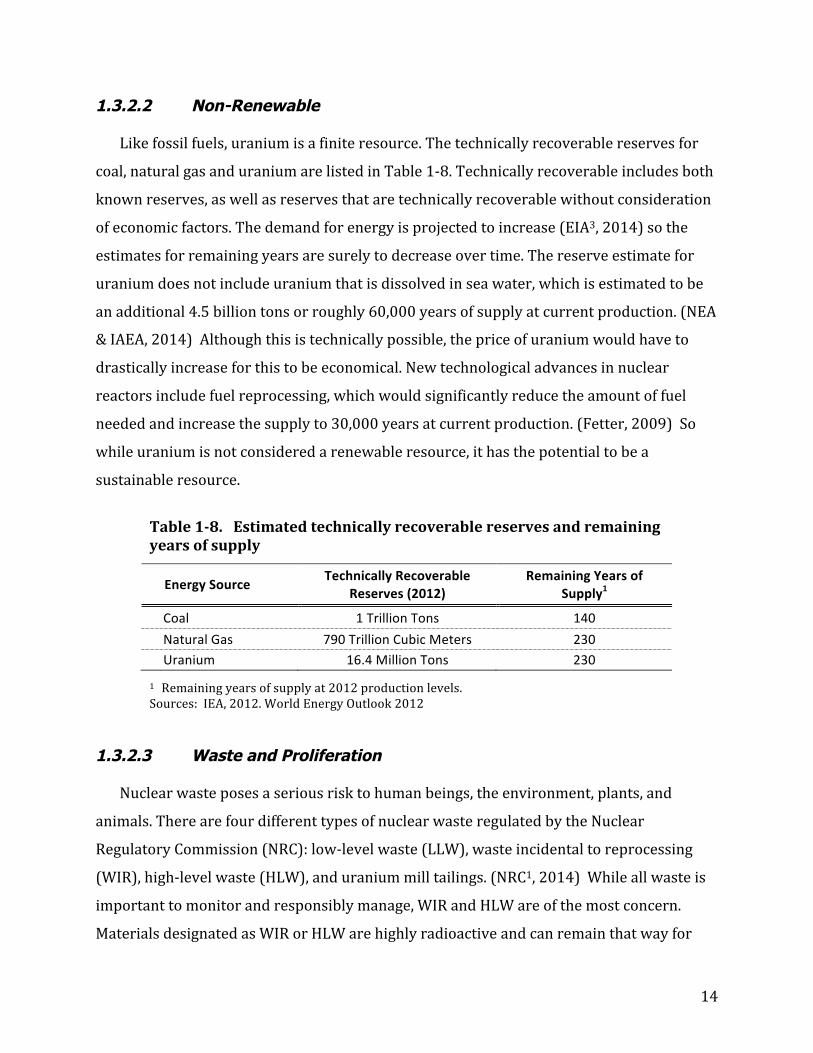
Like fossil fuels, uranium is a finite resource. The technically recoverable reserves for
coal, natural gas and uranium are listed in Table 1-‐8. Technically recoverable includes both
known reserves, as well as reserves that are technically recoverable without consideration
of economic factors. The demand for energy is projected to increase (EIA3, 2014) so the
estimates for remaining years are surely to decrease over time. The reserve estimate for
uranium does not include uranium that is dissolved in sea water, which is estimated to be
an additional 4.5 billion tons or roughly 60,000 years of supply at current production. (NEA
& IAEA, 2014) Although this is technically possible, the price of uranium would have to
drastically increase for this to be economical. New technological advances in nuclear
reactors include fuel reprocessing, which would significantly reduce the amount of fuel
needed and increase the supply to 30,000 years at current production. (Fetter, 2009) So
while uranium is not considered a renewable resource, it has the potential to be a
sustainable resource.
Table 1-‐8. Estimated technically recoverable reserves and remaining years of supply
Energy Source Technically Recoverable Reserves (2012)
Remaining Years of Supply1
Coal 1 Trillion Tons 140 Natural Gas 790 Trillion Cubic Meters 230 Uranium 16.4 Million Tons 230
1 Remaining years of supply at 2012 production levels. Sources: IEA, 2012. World Energy Outlook 2012
1.3.2.3 Waste and Proliferation
Nuclear waste poses a serious risk to human beings, the environment, plants, and
animals. There are four different types of nuclear waste regulated by the Nuclear
Regulatory Commission (NRC): low-‐level waste (LLW), waste incidental to reprocessing
(WIR), high-‐level waste (HLW), and uranium mill tailings. (NRC1, 2014) While all waste is
important to monitor and responsibly manage, WIR and HLW are of the most concern.
Materials designated as WIR or HLW are highly radioactive and can remain that way for
15
hundreds to thousands of years. There is no current solution for disposal of these wastes.
Another issue with these wastes is security. Both WIR and HLW can contain weapons grade
materials in the form of uranium and plutonium; therefore, the threat of a security breach
exists. However, the reality of a terrorist organization stealing this waste to make nuclear
weapons is not likely to occur, as it would require a substantial amount of infrastructure,
highly sophisticated equipment, and a team of educated personnel that can carry out the
complex chemical processes involved in turning the waste into weapons grade material.
(NEI3, 2014) There is also the threat of proliferation at a government controlled nuclear
power plant, which can be done by fuel reprocessing; however, these actions are monitored
by the IAEA.
1.3.3 Nuclear Disasters
One of the biggest concerns of nuclear power is the looming possibly of a major nuclear
accident; more specifically, an incident that leads to a reactor core meltdown. In a
meltdown, there is a loss of coolant to the reactor core, causing the core to overheat (melt),
which can potentially release radioactive material to the atmosphere. (IAEA, 2008; NRC1,
2014) To date, there have been three major nuclear accidents: Three Mile Island,
Chernobyl and Fukushima.
1.3.3.1 Three Mile Island
The Three Mile Island Nuclear Generating Station is located near Middletown, PA, and
consists of two pressurized water reactors (PWR), Unit-‐1 and Unit-‐2. On March 28, 1979,
the Unit-‐2 reactor underwent a loss of coolant accident that lead to severe reactor damage
and the release of radioactivity to the environment; however, the radioactivity had no
detectable health effects to the workers and public and there were no casualties. (Roesler,
2009) The incident occurred due to a combination of operator related errors, equipment
malfunction, and design-‐related issues. (NRC, 2013) An investigation of the incident
identified the design of the control room as the significant cause of the accident. (Roesler,
2009) Furthermore, an NRC led investigation identified numerous regulatory issues within
the industry that were subsequently changed following the accident. The NRC also created
16
the Institute of Nuclear Power Operations (INPO), which provides a forum for the ongoing
process of learning lessons in the operations area. (Blandford & May, 2012) The cost of the
cleanup was estimated to have cost one billion dollars and took nearly 14 years.
(Christiansen, 2014)
1.3.3.2 Chernobyl
The Chernobyl Nuclear Power Plant is located near Pripyat, Ukraine and consists of four
boiling water reactors (BWR), Reactors 1-‐4. The accident at Chernobyl is the worst nuclear
power plant disaster in terms of human lives lost. On April 26, 1986, Reactor 4 was
undergoing a reactor systems test when staff incorrectly administered a series of wrong
operations that led to a significant surge of power to the reactor core. This caused the
reactor to overheat and lead to a large explosion and release of radiation into the
atmosphere. (Steinhauser, Brandl & Johnson, 2014) The accident was due not only to a bad
reactor design, but also to enormous human errors, and to the complete disregard of safety
procedures. (Csereklyei, 2014) The estimated death toll varies dramatically ranging from
4,000 to 60,000 due to cancer caused by the radiation. (Steinhauser, Brandl & Johnson,
2014; Fairli & Sumner, 2006) There is still ongoing cleanup is estimated to cost have cost
$235 billion to this point. (Christiansen, 2014) The reactor design used at Chernobyl had
numerous design flaws, but one in particular set itself apart from those used in the U.S. and
rest of the Western World; that is, there was no secondary containment vessel surrounding
the reactor core. This type of reactor would never be allowed to operate in the U.S.;
however, the world saw the devastation that can occur when things go wrong in a nuclear
reactor. As a result, all new reactors are required to have secondary containment
structures. (Blandford & May, 2012)
1.3.3.3 Fukushima Daiichi
The Fukushima Daiichi Nuclear Power Plant is located near the towns of Okuma and
Futaba, Japan and consists of six BWRs, Units 1-‐6. On March 11, 2011, a magnitude 9.0
earthquake struck off the coast of Japan creating a tsunami that crashed into the east coast
of Japan, where the Fukushima power plant is located. At the time, only Units 1-‐3 were
17
operating, and were immediately triggered to shutdown following the earthquake.
(TEPCO1, 2011) Power to Units 1-‐3 were relying on backup diesel generators, which were
subsequently flooded when the tsunami hit, cutting off power to the reactors. (TEPCO2,
2011) Over the next few days, overheating in the reactor core caused several hydrogen
explosions in Units 1-‐3 releasing radiation into the atmosphere. (Holt, Campbell & Nikitin,
2012) The release of radiation caused several nearby communities within a 25-‐mile radius
to evacuate the area to prevent exposure. (Holt, Campbell & Nikitin, 2012) In a 2013
UNSCEAR report, it was determined that “no discernible increased incidence of radiation-‐
related health effects are expected among exposed members of the public or their
descendants.” (UNSCEAR, 2013) It is, however, still early to understand the full effects this
disaster will have on the area as well as the rest of the world.
Following this event, several organizations, including the NRC, analyzed the status of
the nuclear industry. The NRC report concluded with 12 different recommendations for the
U.S. nuclear industry moving forward addressing the following general regulatory
concerns: ensuring protection, enhancing mitigation, strengthening emergency
preparedness, and improving the efficiency of the regulatory oversight process of the fleet.
(McLellan, 2008) Furthermore, the NRC issued new long-‐term orders and regulations
addressing safety protocols for operating reactors. (AEO2014, 2014)
Nuclear accidents are a major drawback to the nuclear industry. When things go wrong,
they go terribly wrong, as was the case in Chernobyl. However, it is important to mention
that there has only been one major accident on U.S. soil, which resulted in zero deaths and
little contamination to the atmosphere. It also occurred 35 years ago in a first generation
reactor and furthermore, the NRC and nuclear industry has responded since then with
stricter regulations. There is some concern over the safety of the U.S. reactor fleet and their
vulnerability to risk; construction on every operational reactor in the U.S. began in 1977 or
earlier. (EIA2, 2011)
18
1.4 Chapter Summary
Nuclear energy has several benefits including reliability, low emissions, low impact on
human health and low O&M costs. However, it is evident that there are several issues with
nuclear energy that need to be addressed if the U.S. is to pursue an expansion of nuclear
power. Thorium, which was previously disregarded by the nuclear industry, is an
alternative fuel source for nuclear energy that has the potential to mitigate some of these
concerns. The following chapter will explain what thorium is, and the potential role it could
play in the nuclear industry and U.S. energy mix.
19
Chapter 2 Thorium as a Nuclear Fuel
Thorium, like uranium, is a naturally occurring radioactive element. It is 3-‐4 times more
abundant than uranium in the earth’s crust, (Schaffer, 2013) although, new reserves are
getting discovered as the interest in thorium gains attention. Total global reserves have
increased from about 1.5 million tons to 6.3 million tons in the past 5 years. (Schaffer,
2011; NEA & IAEA 2014) Recently, a 600,000 ton deposit was discovered in Lehmi Pass,
Idaho, which represents nearly 10% of global thorium reserves. (NEA & IAEA, 2014) Over
the past two centuries, thorium has had several commercial applications, some of which
include: high-‐temperature laboratory crucibles, high quality lenses for cameras and
scientific equipment, and as a catalyst in the conversion of ammonia to nitric acid.
(Hammond, 2000) Thorium can also be used as a fuel source in nuclear reactors as it was
mentioned in the previous chapter.
2.1 Nuclear Fuel Cycle
There are two fuel cycles that can be used in a nuclear reactor to generate power: the
uranium-‐plutonium fuel cycle and the thorium-‐uranium fuel cycle. The uranium-‐plutonium
fuel cycle dominates the nuclear industry today and is the only one used in U.S. reactor
fleet. (NNL, 2012) There are several differences between the two cycles, which determine
how each is used in a nuclear reactor.
2.1.1 Uranium-Plutonium Fuel Cycle
As it was mentioned in the previous chapter, uranium exists in nature predominantly as
two isotopes: 99.3% 238U and 0.7% 235U. Because the natural occurrence of 235U is such a
small percentage, natural uranium must go through three major steps before it can used in
a nuclear reactor: mining and milling, conversion and enrichment, and fuel fabrication.
(MIT, 2011)
20
Uranium mining is similar to the mining process for other heavy metals such as zinc and
copper. The ore is mined and crushed into a fine powder where it is then chemically
processed to separate the uranium. (NRC3, 2014) This milling process, produces a
concentrated substance known as “yellowcake,” which is actually brown or black in color
and is typically 85% U3O8. (NRC3, 2014) The next step is to convert the yellowcake into
uranium hexafluoride (UF6) so that it can be isotopically enriched to a higher percentage of 235U, often between 3-‐5%. (MIT, 2011) Uranium with a 235U concentration less than 20% is
referred to as low enriched uranium or LEU. A 235U concentration above 20% is regarded as
highly enriched uranium (HEU). The final step is fuel fabrication where the LEU is
converted into uranium oxide (UO2) powder, which is then pressed into ceramic pellets
(about the size of the tip of a finger), loaded into Zircaloy tubes and finally constructed into
fuel assemblies. Fuel assemblies for most LWRs in the U.S. may contain up 264 fuel rods.
(NRC3, 2014) A typical 1000 MW LWR has the annual consumption of anywhere between
20,000 and 400,000 tons of uranium ore (depending on the quality of the ore and reactor
usage), which translates to roughly 200 tons of UO2, the remainder discarded as mine
tailings. Of this, only 35 tons will be used as LEU in the reactor, the remaining 165 tons are
discarded as depleted uranium. (WNA, 2014) It is possible, however, to reprocess the
depleted uranium by mixing it with HEU from nuclear weapons to make fresh reactor fuel,
although this process is not practiced in the U.S. (NRC3, 2014)
The fuel assemblies themselves are not very radioactive. The fission of 235U in the fuel
pellets produces fast neutrons, which are not suitable for neutron absorption of 238U. This
is because the absorption spectrum for fast neutrons is much too small to begin the chain
reaction. Instead a moderator (LWRs use water) is introduced to the system to slow down
the neutrons. These slow, or thermal (thermal because they are the same temperature as
the moderator), neutrons are more readily absorbed by 238U. The 238U transmutes to 239Pu,
which easily fissions through neutron bombardment and the process repeats itself. The
fissioning of 239Pu accounts for roughly half of the power output in the reactor. (Schaffer,
2011) At current consumption rates, there is roughly 100 years of economically
recoverable uranium reserves left. (NNL, 2012) However, uranium reserves are price
dependent; therefore, as the price of uranium increases more uranium reserves will be
economically recoverable. (NNL, 2012)
21
2.1.2 Thorium-Uranium Fuel Cycle
Thorium exists in nature solely as the fertile isotope 232Th. Because it does not have a
naturally occurring fissile isotope like uranium does (235U), thorium cannot be used by
itself as a nuclear fuel. (NNL, 2010) This is the main fundamental difference between the
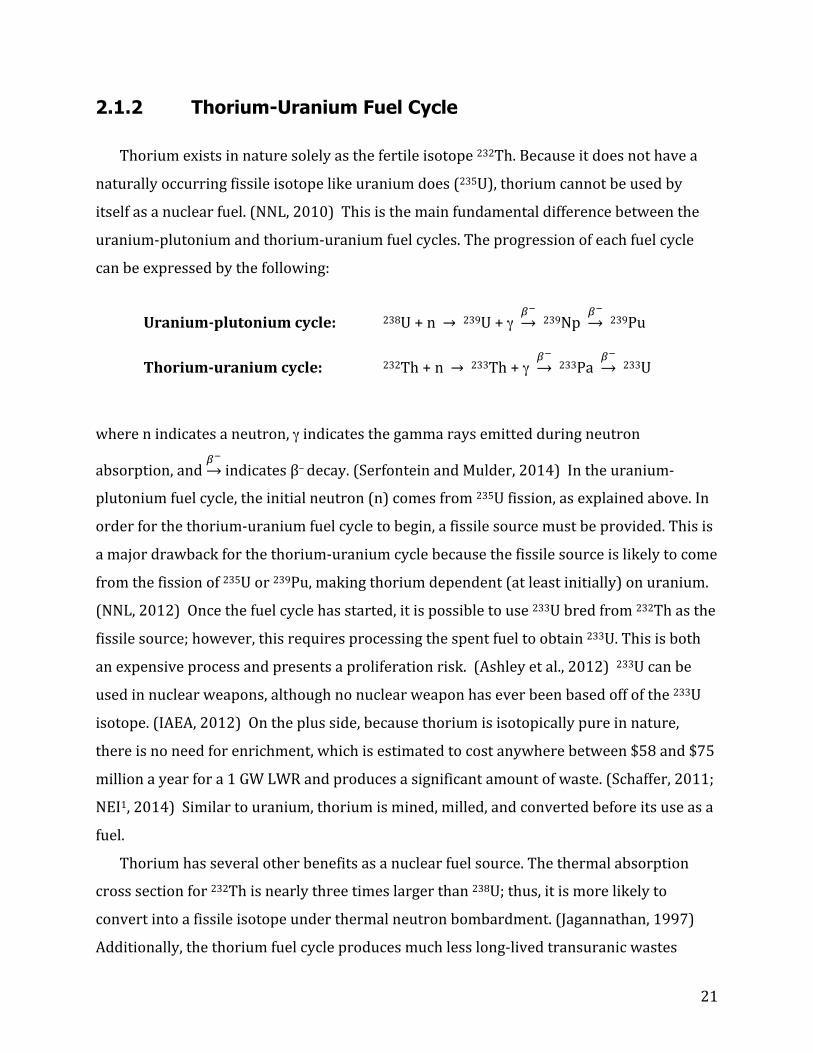
uranium-‐plutonium and thorium-‐uranium fuel cycles. The progression of each fuel cycle
can be expressed by the following:
Uranium-‐plutonium cycle: 238U + n → 239U + γ
!! 239Np
!! 239Pu
Thorium-‐uranium cycle: 232Th + n → 233Th + γ
!! 233Pa
!! 233U
where n indicates a neutron, γ indicates the gamma rays emitted during neutron
absorption, and !! indicates β– decay. (Serfontein and Mulder, 2014) In the uranium-‐
plutonium fuel cycle, the initial neutron (n) comes from 235U fission, as explained above. In
order for the thorium-‐uranium fuel cycle to begin, a fissile source must be provided. This is
a major drawback for the thorium-‐uranium cycle because the fissile source is likely to come
from the fission of 235U or 239Pu, making thorium dependent (at least initially) on uranium.
(NNL, 2012) Once the fuel cycle has started, it is possible to use 233U bred from 232Th as the
fissile source; however, this requires processing the spent fuel to obtain 233U. This is both
an expensive process and presents a proliferation risk. (Ashley et al., 2012) 233U can be
used in nuclear weapons, although no nuclear weapon has ever been based off of the 233U
isotope. (IAEA, 2012) On the plus side, because thorium is isotopically pure in nature,
there is no need for enrichment, which is estimated to cost anywhere between $58 and $75
million a year for a 1 GW LWR and produces a significant amount of waste. (Schaffer, 2011;
NEI1, 2014) Similar to uranium, thorium is mined, milled, and converted before its use as a
fuel.
Thorium has several other benefits as a nuclear fuel source. The thermal absorption
cross section for 232Th is nearly three times larger than 238U; thus, it is more likely to
convert into a fissile isotope under thermal neutron bombardment. (Jagannathan, 1997)
Additionally, the thorium fuel cycle produces much less long-‐lived transuranic wastes
22
(TRUs), especially plutonium, which increases proliferation resistance. (Greaves et al.,
2012; Eom et al., 1998; NNL, 2012) Therefore, not only does the thorium fuel cycle
produce less waste, but the waste is shorter lived and after roughly 300 years, it is 10,000
times less toxic than the waste from the uranium-‐plutonium cycle. (Kamei & Hakami, 2011;
Hargraves & Moir, 2010) A more detailed explanation of the benefits from thorium will be
discussed in Chapter 4: Benefits of a LFTR Fleet in the U.S.
2.2 Uses in the Current U.S. Reactor Fleet
Thorium can be used in a similar fashion as uranium in the U.S. reactor fleet; that is,
thorium oxide (ThO2) can be manufactured into ceramic pellets and assembled into fuel
bundles for use in the 100 LWRs in the U.S. However, the U.S. fleet operates solely on the
uranium-‐plutonium fuel cycle. If thorium is to play a role in the current reactor fleet, the
risks, costs, and benefits of doing so must be weighed and balanced against the uranium-‐
plutonium fuel cycle. (Nelson, 2012) Any changes to the system must yield significant
benefits in order to drive the necessary investment required to make those changes.
One of the stated benefits of the thorium-‐uranium fuel cycle is that it produces shorter-‐
lived wastes. This is because the isotopic inventory of the fuel cycle (mainly 232Th, 233Pa and 233U) produces lighter isotopes from fission than the uranium-‐plutonium cycle. However,
the thorium-‐uranium fuel cycle depends on an initial fissile load (233U, 235U or 239Pu)
Therefore, in order for the thorium-‐uranium cycle to take full advantage of the waste
benefits, it must be started with 233U. (Nelson, 2012) A reactor using the thorium-‐uranium
cycle could breed the required 233U; however, this would require a large separation facility
that neither the financing nor the political support is likely to be available in the near
future. (Nelson, 2012) Furthermore, there is still the need for an initial fissile source from 235U or 239Pu, thus negating some of the waste benefits that come with the thorium-‐
uranium fuel cycle.
Although adoption of the thorium-‐uranium fuel cycle is technically feasible without
major modifications to current reactor configurations, the U.S. reactor fleet and nuclear
industry has built a foundation of infrastructure around the uranium-‐plutonium fuel cycle.
Unfortunately, the added benefits of using thorium in the current U.S. reactor fleet do not
23
outweigh the investment required to implement these changes. (IAEA, 2005; MIT 2011)
On the other hand, the long-‐term outlook for the thorium-‐uranium cycle looks promising.
The current fleet of LWR reactors is approaching their life expectancy, and with added
safety concerns and waste management issues, construction of new nuclear power plants
in the U.S. has been put on hiatus. Thorium provides an alternative path to a nuclear future,
but in order to realize the benefits thorium offers, a new generation of reactors must be
utilized. (Nelson, 2012)
2.3 Liquid Fluoride Thorium Reactor
In 2002, the molten salt reactor (MSR) was selected as one of the six Generation IV
reactor designs based on the following characteristics: sustainability, economics, safety,
reliability and proliferation-‐resistance. (DOE, 2002) A specific reactor design that has
raised interest in the past decade is a type of MSR referred to as a Liquid Fluoride Thorium
Reactor (LFTR, pronounced “lifter”). The LFTR uses technology based off of the Molten Salt
Reactor Experiment (MSRE), which was an 8 MW test reactor at the Oak Ridge National
Laboratory (ORNL) that successfully operated for five years between 1965-‐1969. Although
the experiment was deemed a success, in 1973 funding from the AEC was cut-‐off, which all
but ended the program. (Hargraves & Moir, 2010; LeBlanc2, 2010) The official reason for
terminating the program was due to corrosion issues during operation. Yet, there is
speculation about whether or not the decision was grounded in politics. At that time, Alvin
Weinberg, the director at ORNL, was creating tension in the nuclear industry by publically
raising concerns over the safety of PWRs, a type of LWR used in the U.S. (LeBlanc2, 2010)
Until recently, there has been little progression on the technology since the program ended.
In an MSR and LFTR there are no solid fuel pellets but rather fertile and fissile material
that are dissolved in a fluid medium, the salt. (LeBlanc2, 2010) This fundamental difference
provides several advantages in design, operation, safety, waste management, cost, and
proliferation resistance over the conventional configuration of solid fuel reactors. (Cooper
et al. 2011, LeBlanc1, 2010) The following sections discuss the LFTR components and the
theoretical benefits from using such a reactor.
24
2.3.1 How a LFTR works
A LFTR works on an entirely different set of principles compared to the LWR. Instead of
solid ceramic pellets, a LFTR uses fluid fuel that has UF4, PuF3, and/or ThF4 dissolved into a
carrier salt, commonly LiF and BeF2 (FLiBe). There are single fuel and double fuel systems.
In a single fuel system, both the fissile and fertile material are mixed into the carrier salt. A
two fluid design separates the fissile and fertile salts by a core and a blanket. The core is
filled with the UF4 and FLiBe, and the blanket is a volume surrounding the core that is filled
with a molten mixture of ThF4 and FLiBe. (LeBlanc1, 2010) Heat from fission inside the
core melts the blanket salt and provides neutrons that get absorbed by 232Th and
transmute into 233U, which can be chemically separated and fed back into the core to
sustain the chain reaction. Heat from the reaction gets transferred to either a steam or gas
cycle, which produces electricity. (LeBlanc2, 2010)
2.3.2 Advantages of a Fluid System
The fluid nature of the system serves a triple function: 1) as a liquid fuel, 2) as a heat
transfer medium, and 3) as a fuel-‐processing medium. (Greaves et al., 2012) A deeper
valuation of these benefits will be provided in Chapter 4: Benefits of a LFTR Fleet in the U.S.
2.3.2.1 As a Liquid Fuel
Inside of the reactor, the liquid fuel is circulated such that, in the presence of a
moderator (in this case, graphite enclosing the core) is able to achieve a self-‐sustaining
chain reaction. (Greaves et al., 2012) In an LWR, radiation and heat from the reaction can
damage the solid fuel and zirconium cladding that houses the fuel pellets. Consequently, the
reactor needs to be shut down and a third of the fuel rods need to be replaced every 18 to
24 months while the rest get rearranged. Spent fuel rods are radiotoxic so they must be
removed remotely and safely stored for several years before they can be transferred to dry-‐
cask storage where they will remain for long-‐term storage. This is both an expensive cost
and an inconvenience for the plant operator. (Hargraves and Moir, 2010) Furthermore, the
25
structural damage to the fuel rods prevents the fuel from being fully burned up and only
3%-‐10% of the energy content in the fuel is used. (MIT, 2011; Alvin Weinberg Foundation,
2014; Greaves et al., 2012)
Liquid fuel, however, is resistant to damage from heat and radiation. The chemistry of
the fluid can be constantly monitored and any alternations that need to be made are done
so without having to shut down the reactor. (Greaves et al., 2012) This allows operators to
maintain a perfect concentration in the fluid fuel to maximize efficiency.
One of the most inherent safety features of using liquid fuel is that a meltdown cannot
happen because the fuel is already molten. In a LFTR, there is a backup safety mechanism
called a freeze plug located at the bottom of the reactor core. It is a plug of salt that is kept
below its freezing point by an air-‐cooled fan. In the event of a total blackout scenario
(Fukushima), power to the fan is cut off and the salt plug melts so the fluid fuel mixture can
flow into a drain tank for safe storage. The drain tanks are made of neutron absorbers that
halt the chain reaction. Any fissions products in the salt quickly form stable fluorides that
will stay within the salt. (LeBlanc2, 2010) On the other hand, if the temperature of the core
gets too hot it will overcome the cooling of the fan and the freeze plug will melt. (Hargraves
& Moir, 2010) In LWRs, power is needed to shut down the reactor; conversely, in a LFTR,
power is needed to keep it operating. This inherent safety feature makes LFTRs an
appealing choice if operational safety is a top priority for the industry.
2.3.2.2 As a Heat Transfer Medium
Molten fluoride salts are excellent coolants and can have a volumetric heat capacity up
to 25% higher than pressurized water (used in PWRs). This translates into smaller
components such as heat exchangers, primary coolant loops, and pumps. (LeBlanc1, 2010)
Additionally, in an LWR, water serves as the coolant and the moderator. Heat from the
fission boils the water to steam, which drives the turbine. These systems are kept under
high pressure (BWR – 7 MPa, PWR – 16 MPa) and consist of expensive materials.
(Hargraves & Moir, 2010) LWRs have large, thick containment vessels able to withstand
these high pressures and to prevent contamination leakage in the event of a steam or
hydrogen explosion (as was the case in the Fukushima Daiichi disaster). A LFTR operates at
26
low pressures (0.5 MPa) and therefore, there is no need for large and costly pressure
vessels and thick walled containment structures. LFTRs operate instead at high
temperatures, allowing the use of higher efficiency Brayton gas generators, which increase
the thermal efficiency from roughly 35% to 50%. (Cooper et al., 2011)
A second important property of the fluid salt mixture is its negative temperature
coefficient of reactivity. (Hargraves & Moir, 2010) When the temperature of the salt
increases, it expands, which reduces the neutron absorption spectrum and slows down the
nuclear reaction. Thus, a runaway meltdown scenario is not possible. Additionally, this
property allows the reactor to operate as a load following plant, which is a plant that can
easily adjust its power output as the demand for electricity fluctuates throughout the day.
(LeBlanc1, 2010)
2.3.3.3 As a Fuel Processing Medium
Some byproducts from the fission process, such as xenon-‐135 (135Xe) have large
neutron absorption cross-‐sections and act as poisons to the reaction process. 135Xe is
produced in both fuel cycles and is responsible for nearly half of the neutron absorptions in
a solid fuel reactor. However, in an MSR such as a LFTR, 135Xe will bubble out of solution
and can be removed remotely. (LeBlanc1, 2010; Cooper et al., 2011) Other fission products
such as molybdenum, neodymium, and technetium can be removed through fluorination
increasing the lifecycle of the fuel as well as its efficiency, allowing nearly all of the energy
content in the thorium to be burned up. (Hargraves & Moir, 2010) A 1 GW LWR in the U.S.
uses roughly 200 to 250 tons of LEU every year; meanwhile, it is estimated that only one
ton of processed thorium would be required to produce the same amount of electricity.
(WNA, 2014; Hargraves & Moir, 2010) Processing out fission products also minimizes the
risk of any leaking into the environment in that the event of a catastrophic accident.
(Furukawa et al., 1997)
27
2.3.3 Current Research on MSRs
2.3.3.1 U.S.
The main push for LFTR development in the U.S. is by Kirk Sorenson, a former NASA
engineer and nuclear physicist. In 2011, he started the company Flibe Energy and they are
working on obtaining funding to develop a small 2 MW research reactor. (Flibe, 2013)
Transatomic Power is another company based out of Cambridge, MA that is currently
developing a 550 MW MSR that can be fueled with either uranium or thorium and uses
lithium fluoride (LiF) as the fuel salt. They are estimating that the overnight cost will be $2
billion and take between 2-‐3 years to build. (Transatomic Power, 2014)
2.3.3.2 China
In China, a team of 140 PhD scientists, working at the Shanghai institute of Nuclear and
Applied Physics, are working hastily to design a new thorium based MSR. Originally given
25 years to develop a reactor, the Chinese government recently reduced the period to 10
years. With a $350 million start up budget, the team says they will have a 2 MW test reactor
ready by 2020, with commercially viable power plants ready by the mid 20s. (Chen, 2014)
2.3.3.3 France
The French National Centre for Scientific Research (CNRS) at the Grenoble-‐based
Laboratory of Subatomic Physics and Cosmology (LPSC) is developing plans for a 1000 MW
molten salt fast reactor (MSFR). A MSFR operates on the fast neutron spectrum rather than
the thermal neutron spectrum, which is more appealing for the LFTR design. (AWF, 2013)
2.3.3.4 Russia
The Kurchatov Institute in Russia is pursuing an MSR that can be used to dispose
Russia’s stockpile of nuclear weapons. Called the Molten Salt Actinide Recycler and
28
Transmuter or MOSART, the reactor would be fueled with spent fuel containing actinides
and plutonium that has a thermal capacity of 2400 MWth. Thermal capacity is roughly
three times larger than the electrical capacity due to heat loss in the system, but this
depends on the turbine used in the power plant. The Russians are also working on a Hybrid
MOSART, which is a thorium MSR that will be used for either electricity generation or to
breed 233U for the French MSFR. (AWF, 2013)
2.4 Chapter Summary
Thorium is an energy source capable of replacing uranium in future reactor designs.
Thorium has several advantages over uranium: it is 3-‐4 times more abundant in the earth’s
crust, it produces much less and much shorter lived radiotoxic waste, and it has a higher
propensity to fission in a thermal reactor. Similar to uranium, it can be used in solid fuel
reactors; however, in order to truly capitalize on thorium’s benefits it needs to be utilized
in a new reactor design, the LFTR.
The advantages of LFTRs are based in the design of the reactors. Within the design are
inherent safety features that make operational safety, environmental safety, and efficiency
a top priority. Nevertheless, these benefits can only be realized if a LFTR reactor is built
and implemented at a commercial scale. The following chapter will assess the U.S. market
potential for LFTRs.
29
Chapter 3 U.S. LFTR Fleet: Market Potential and Scenarios
Every year the EIA publishes an annual forecast of the energy sector, called the Annual
Energy Outlook. Their most recent report, the Annual Energy Outlook 2014 (AEO2014),
relies on their National Energy Modeling System (NEMS) to forecast the demand and
supply of energy in the U.S. through 2040. (EIA3, 2014) The report includes several
different scenarios that incorporate market trends to illustrate uncertainties with the
Reference case projections. In order to forecast different scenarios, NEMS takes into
consideration federal and state legislations and regulations, as well as the tax credits and
federal subsidies that affect each power generating sector. (EIA3, 2014)
While the AEO2014 provides a foundation for the market potential of the nuclear
industry, it bases its forecasts on the current technology of the reactor fleet. Therefore, in
order to adequately valuate the benefits of a LFTR fleet, new assumptions must be
incorporated into the AEO2014 to estimate the market potential for LFTRs.
The purpose of this chapter is to estimate the market potential in order to quantify the
benefits from developing a LFTR fleet in the U.S. The analysis uses the AEO2014 as a
foundation and incorporates recent developments in LFTR research to expand on the scope
of the AEO2014. Furthermore, this analysis is different from the AEO2014 in the following
ways:
Expanded Scope: The AEO2014 presents projections for energy demand and generation using fuel sources that are currently in the market and does not consider new Gen IV reactors, such as the LFTR. This analysis will incorporate LFTRs as a nuclear fuel source.
Extended Scope: The AEO2014 presents projections for energy demand and generation through 2040. This analysis will extend the forecast to the year 2050 in order to allow the effects of LFTR development to set in.
New Scenarios: The AEO2014 forecasts several difference scenarios that incorporate the uncertainties in the market and economy. This analysis will include several new
30
scenarios that will illustrate the magnitude of effects an expansive LFTR fleet would have on the economy, environment, and human health.
The following section discusses the methods and the assumptions that were made to
analyze the market potential.
3.1 Methods and Analysis
The market potential for a new LFTR fleet in the U.S. is based off of forecasts presented
in the EIA’s AEO2014. This analysis builds off of the predictions made in the AEO2014
Reference case, specifically the following parameters: Net Summer Generating Capacity,
Cumulative Electric Power Sector Additions, Cumulative Retirements, and Total Electricity
Generation. Each of these factors are broken down by fuel source. A full list of the values
from the AEO2014 Reference case can be found by downloading the report from the EIA’s
website.
Additionally, other key assumptions were made to incorporate the development of a
LFTR fleet into the forecasts. These assumptions were made at the author’s discretion
using figures and statements from a variety of sources that include: scientific articles and
journals, government reports and company websites.
The following sections describe the process used to assess the market potential for a
LFTR fleet.
3.1.1 Theoretical Market Potential
The theoretical market potential for a LFTR fleet represents the maximum market
penetration for LFTRs regardless of any technological, political and regulatory, and/or
economic barriers that stand in the way of development. Actually realizing this market
penetration is an unrealistic expectation; however, it provides a starting point to work
from for the remainder of the analysis.
31
First and foremost, The AEO2014 Reference case (hereafter, referred to as the RC)
forecasts the energy supply by fuel source through 2040, with projections every five years
(periods) starting with 2020. The RC incorporates economic, political, and market
assumptions that factor into the forecasts. The key assumptions made in the RC are as
follows:
All assumptions listed occur over the 2012-‐2040 time period, unless otherwise noted.
-‐ GDP growth: 2.4% -‐ Electricity demand growth: 29% (0.9%/year) -‐ Retirement of existing capacity: 96.7 GW -‐ New generating capacity added: 351.4 GW -‐ Increase in electricity generation: 1,166 billion kWh
In order to assess the theoretical potential for LFTRs four steps were taken. First, the
forecast of the RC was extended to 2050. The second step was accounting for retired
capacity during each period by each fuel source. Then the retired capacity was added to the
total capacity to determine how much new capacity was added during that period. The final
step was summing the new capacity added for each period to determine the total available
capacity that will be added to the electrical grid between 2012 and 2050.
3.1.1.1 Extending the Scope
The RC only has forecasted values through 2040. This analysis extends the forecast to
2050 using average growth rates in power generation forecasted in the RC for each
technology over varying time frames. Forecasts through 2050 were done on a per fuel basis
using an estimated rate of growth/decline depending on the trend observed in the RC.
Table 3-‐1 shows the RC values for each fuel and Table 3-‐2 shows the rate used for each fuel
with an explanation of how that rate was generated. From there, the rate was applied to the
previous columns value; i.e. to get generation in 2045, multiply the rate by generation in
2040 and so on.
Table 3-‐3 represents the new extended forecast of generation by fuel source through
2050. The extended forecast will be used as the Base Case scenario and will be referred to
hereafter as the BC. The BC will play as a foundation for the market assessment and the
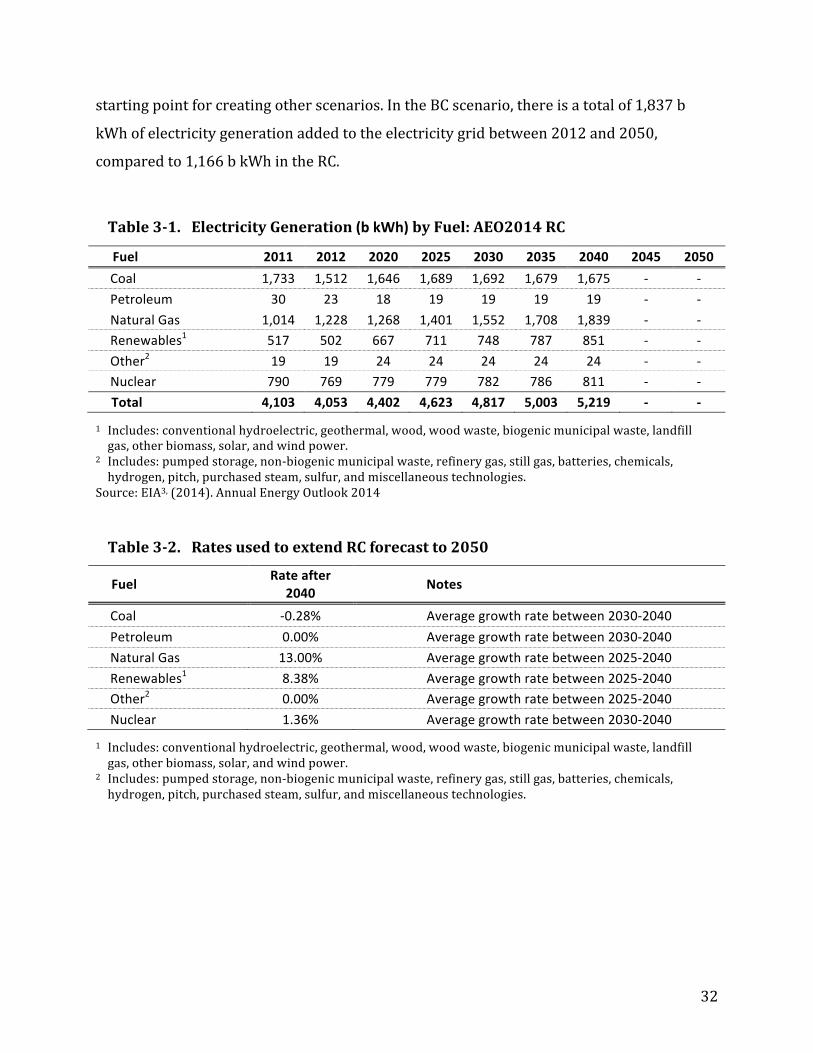
32
starting point for creating other scenarios. In the BC scenario, there is a total of 1,837 b
kWh of electricity generation added to the electricity grid between 2012 and 2050,
compared to 1,166 b kWh in the RC.
Table 3-‐1. Electricity Generation (b kWh) by Fuel: AEO2014 RC
Fuel 2011 2012 2020 2025 2030 2035 2040 2045 2050 Coal 1,733 1,512 1,646 1,689 1,692 1,679 1,675 -‐ -‐ Petroleum 30 23 18 19 19 19 19 -‐ -‐ Natural Gas 1,014 1,228 1,268 1,401 1,552 1,708 1,839 -‐ -‐ Renewables1 517 502 667 711 748 787 851 -‐ -‐ Other2 19 19 24 24 24 24 24 -‐ -‐ Nuclear 790 769 779 779 782 786 811 -‐ -‐ Total 4,103 4,053 4,402 4,623 4,817 5,003 5,219 -‐ -‐
1 Includes: conventional hydroelectric, geothermal, wood, wood waste, biogenic municipal waste, landfill gas, other biomass, solar, and wind power.
2 Includes: pumped storage, non-‐biogenic municipal waste, refinery gas, still gas, batteries, chemicals, hydrogen, pitch, purchased steam, sulfur, and miscellaneous technologies.
Source: EIA3, (2014). Annual Energy Outlook 2014
Table 3-‐2. Rates used to extend RC forecast to 2050
Fuel Rate after 2040 Notes
Coal -‐0.28% Average growth rate between 2030-‐2040 Petroleum 0.00% Average growth rate between 2030-‐2040 Natural Gas 13.00% Average growth rate between 2025-‐2040 Renewables1 8.38% Average growth rate between 2025-‐2040 Other2 0.00% Average growth rate between 2025-‐2040 Nuclear 1.36% Average growth rate between 2030-‐2040
1 Includes: conventional hydroelectric, geothermal, wood, wood waste, biogenic municipal waste, landfill gas, other biomass, solar, and wind power.
2 Includes: pumped storage, non-‐biogenic municipal waste, refinery gas, still gas, batteries, chemicals, hydrogen, pitch, purchased steam, sulfur, and miscellaneous technologies.
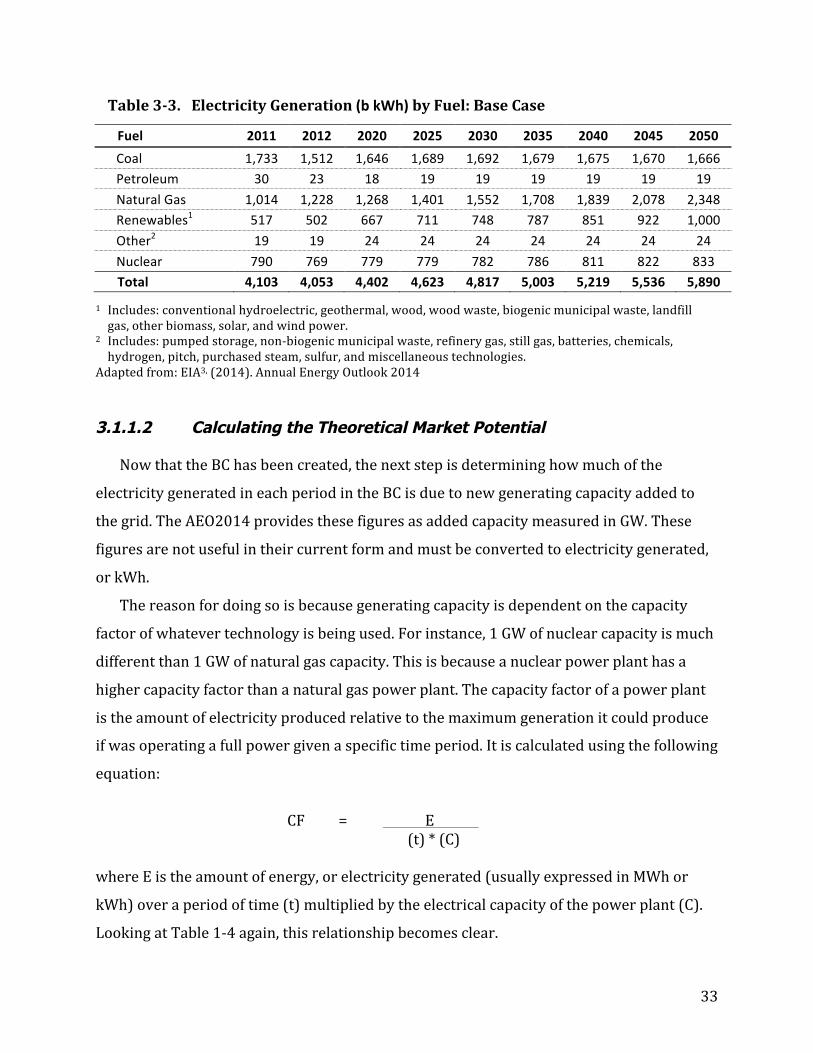
33
Table 3-‐3. Electricity Generation (b kWh) by Fuel: Base Case
Fuel 2011 2012 2020 2025 2030 2035 2040 2045 2050 Coal 1,733 1,512 1,646 1,689 1,692 1,679 1,675 1,670 1,666 Petroleum 30 23 18 19 19 19 19 19 19 Natural Gas 1,014 1,228 1,268 1,401 1,552 1,708 1,839 2,078 2,348 Renewables1 517 502 667 711 748 787 851 922 1,000 Other2 19 19 24 24 24 24 24 24 24 Nuclear 790 769 779 779 782 786 811 822 833 Total 4,103 4,053 4,402 4,623 4,817 5,003 5,219 5,536 5,890
1 Includes: conventional hydroelectric, geothermal, wood, wood waste, biogenic municipal waste, landfill gas, other biomass, solar, and wind power.
2 Includes: pumped storage, non-‐biogenic municipal waste, refinery gas, still gas, batteries, chemicals, hydrogen, pitch, purchased steam, sulfur, and miscellaneous technologies.
Adapted from: EIA3, (2014). Annual Energy Outlook 2014 3.1.1.2 Calculating the Theoretical Market Potential
Now that the BC has been created, the next step is determining how much of the
electricity generated in each period in the BC is due to new generating capacity added to
the grid. The AEO2014 provides these figures as added capacity measured in GW. These
figures are not useful in their current form and must be converted to electricity generated,
or kWh.
The reason for doing so is because generating capacity is dependent on the capacity
factor of whatever technology is being used. For instance, 1 GW of nuclear capacity is much
different than 1 GW of natural gas capacity. This is because a nuclear power plant has a
higher capacity factor than a natural gas power plant. The capacity factor of a power plant
is the amount of electricity produced relative to the maximum generation it could produce
if was operating a full power given a specific time period. It is calculated using the following
equation:
CF = E
(t) * (C)
where E is the amount of energy, or electricity generated (usually expressed in MWh or
kWh) over a period of time (t) multiplied by the electrical capacity of the power plant (C).
Looking at Table 1-‐4 again, this relationship becomes clear.
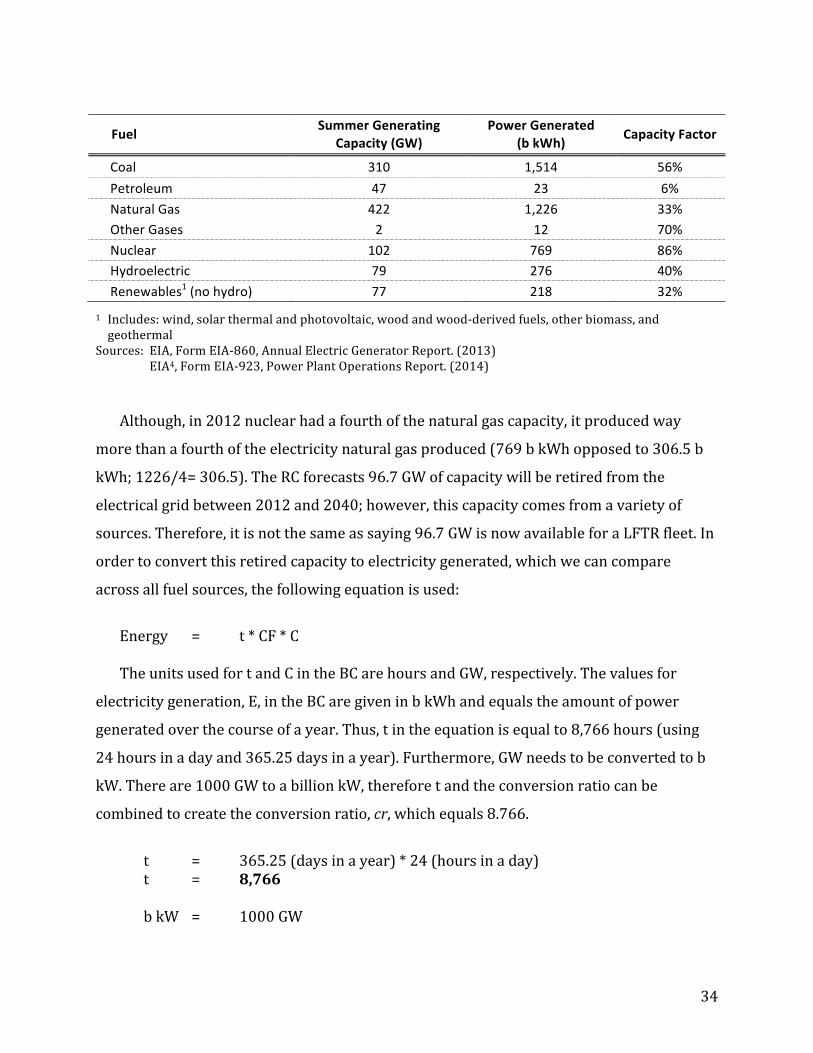
34
Fuel Summer Generating Capacity (GW)
Power Generated (b kWh) Capacity Factor
Coal 310 1,514 56% Petroleum 47 23 6% Natural Gas 422 1,226 33% Other Gases 2 12 70% Nuclear 102 769 86% Hydroelectric 79 276 40% Renewables1 (no hydro) 77 218 32%
1 Includes: wind, solar thermal and photovoltaic, wood and wood-‐derived fuels, other biomass, and geothermal
Sources: EIA, Form EIA-‐860, Annual Electric Generator Report. (2013) EIA4, Form EIA-‐923, Power Plant Operations Report. (2014)
Although, in 2012 nuclear had a fourth of the natural gas capacity, it produced way
more than a fourth of the electricity natural gas produced (769 b kWh opposed to 306.5 b
kWh; 1226/4= 306.5). The RC forecasts 96.7 GW of capacity will be retired from the
electrical grid between 2012 and 2040; however, this capacity comes from a variety of
sources. Therefore, it is not the same as saying 96.7 GW is now available for a LFTR fleet. In
order to convert this retired capacity to electricity generated, which we can compare
across all fuel sources, the following equation is used:
Energy = t * CF * C The units used for t and C in the BC are hours and GW, respectively. The values for
electricity generation, E, in the BC are given in b kWh and equals the amount of power
generated over the course of a year. Thus, t in the equation is equal to 8,766 hours (using
24 hours in a day and 365.25 days in a year). Furthermore, GW needs to be converted to b
kW. There are 1000 GW to a billion kW, therefore t and the conversion ratio can be
combined to create the conversion ratio, cr, which equals 8.766.
t = 365.25 (days in a year) * 24 (hours in a day) t = 8,766
b kW = 1000 GW
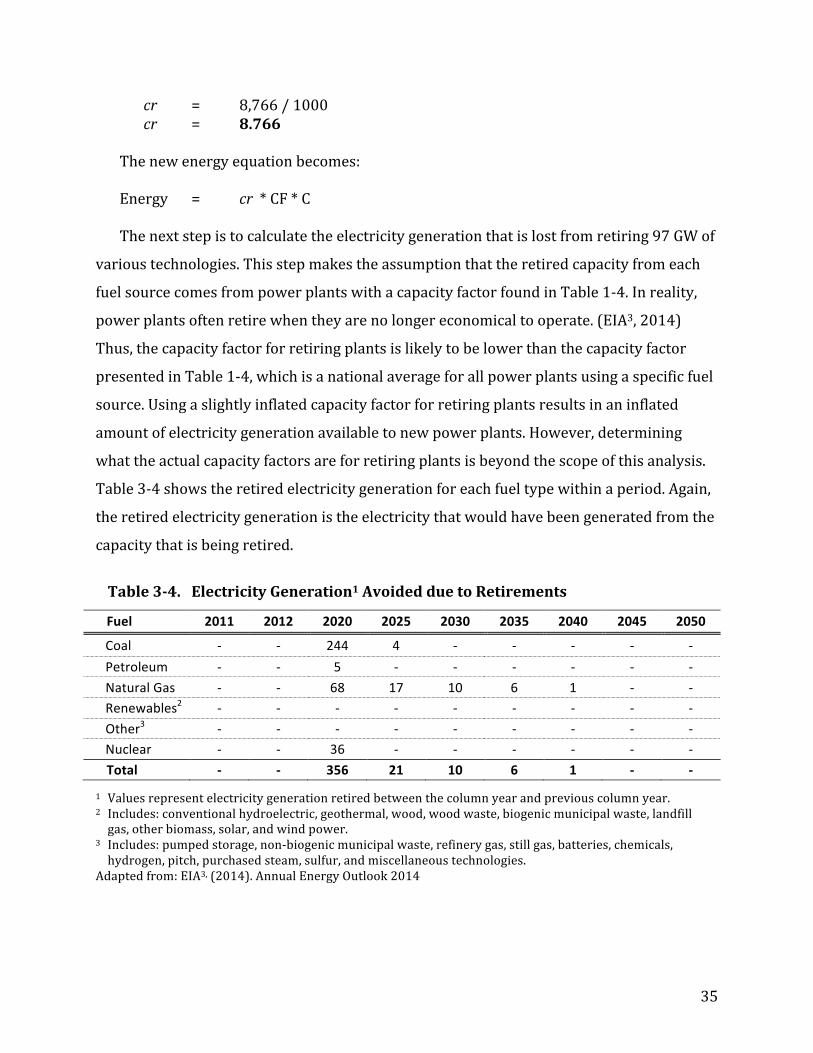
35
cr = 8,766 / 1000 cr = 8.766
The new energy equation becomes: Energy = cr * CF * C The next step is to calculate the electricity generation that is lost from retiring 97 GW of
various technologies. This step makes the assumption that the retired capacity from each
fuel source comes from power plants with a capacity factor found in Table 1-‐4. In reality,
power plants often retire when they are no longer economical to operate. (EIA3, 2014)
Thus, the capacity factor for retiring plants is likely to be lower than the capacity factor
presented in Table 1-‐4, which is a national average for all power plants using a specific fuel
source. Using a slightly inflated capacity factor for retiring plants results in an inflated
amount of electricity generation available to new power plants. However, determining
what the actual capacity factors are for retiring plants is beyond the scope of this analysis.
Table 3-‐4 shows the retired electricity generation for each fuel type within a period. Again,
the retired electricity generation is the electricity that would have been generated from the
capacity that is being retired.
Table 3-‐4. Electricity Generation1 Avoided due to Retirements
Fuel 2011 2012 2020 2025 2030 2035 2040 2045 2050
Coal -‐ -‐ 244 4 -‐ -‐ -‐ -‐ -‐ Petroleum -‐ -‐ 5 -‐ -‐ -‐ -‐ -‐ -‐ Natural Gas -‐ -‐ 68 17 10 6 1 -‐ -‐ Renewables2 -‐ -‐ -‐ -‐ -‐ -‐ -‐ -‐ -‐ Other3 -‐ -‐ -‐ -‐ -‐ -‐ -‐ -‐ -‐ Nuclear -‐ -‐ 36 -‐ -‐ -‐ -‐ -‐ -‐ Total -‐ -‐ 356 21 10 6 1 -‐ -‐
1 Values represent electricity generation retired between the column year and previous column year. 2 Includes: conventional hydroelectric, geothermal, wood, wood waste, biogenic municipal waste, landfill gas, other biomass, solar, and wind power.
3 Includes: pumped storage, non-‐biogenic municipal waste, refinery gas, still gas, batteries, chemicals, hydrogen, pitch, purchased steam, sulfur, and miscellaneous technologies.
Adapted from: EIA3, (2014). Annual Energy Outlook 2014
36
An example for how one of the values was calculated is shown below. Furthermore, the
only fuel source that had retirements past 2025 was natural gas. There are no retirements
between 2040-‐2050, however, due to the retirements tailing off between 2025 and 2040 in
the RC.
Coal (2025): E = 8.766 * 0.8 GW * 56% E = 3.93 b kWh (rounded to 4 above)
Now that the retired electricity generation has been accounted for in the BC, the next
step is to sum the retired electricity generation (395 b kWh) and add it to the electricity
generation added between 2012 and 2050 in the BC (1,837 b kWh) to get a total of 2,257 b
kWh of electricity. This value represents the forecasted capacity of electricity that will be
generated by new power plants between the years 2012 and 2050 and the theoretical
market potential for a LFTR fleet. This total is based off of the assumptions made in the RC
and BC. Under different scenarios, more retirements could lead to a greater amount of
available generation. This situation will be explored in the following sections regarding
new scenarios.
3.1.2 Scenarios
It is unrealistic to assume that all of the generated electricity will come from one fuel
source. Furthermore, there are several factors that influence decision making when
considering new capacity additions. The EIA lists the following factors among the most
important: electricity demand growth, the need to replace inefficient plants, the costs and
operating efficiencies of different power generation options, fuel prices, state RPS
programs, and the availability of federal tax credits for some technologies. More
importantly, the generation mix is sensitive to fuel prices and policies and regulations.
(EIA3, 2014) The AEO2014 took all of the factors into consideration when creating the RC
and varying scenarios.
Different scenarios presented in the AEO2014 were also incorporated into this analysis,
specifically, the Accelerated Retirement cases. In these scenarios, there is an increase in
coal-‐fired and nuclear power plants retirements over the forecasted period. These
37
retirements are a result of an increase operating and maintenance costs, fuel costs, and
cheaper alternatives leading these plants to no longer operate economically. (EIA3, 2014)
These scenarios were incorporated into this analysis by using the projected rate of decline
in electricity generation from retirements and extending the forecast to 2050. This was
done at a rate that allowed for a gradual increase LFTR development. An explanation of this
process follows in the scenario explanations.
3.1.2.1 Base Case
The technological readiness is perhaps the largest barrier preventing LFTR
development. Until the technology can be proven at a commercial scale, there is no reason
to believe that LFTRs will play a significant role in the electricity mix. Efforts around the
world to develop LFTRs and MSRs (see Chapter 2: Thorium as a Nuclear Fuel) suggest that
they could be ready at the commercial level by the mid 2020s; therefore, for this analysis it
is assumed that the technical readiness of LFTRs operating commercially in the U.S. will be
available by 2030. This provides an adequate amount of time for research and development
and testing of prototype reactors if the U.S. were to engage pursuing this effort today.
The BC uses values adapted from the RC and applies the amount of nuclear generation
after 2030 to LFTRs. All other factors are maintained and the values for other fuel sources
are left the same. This implies that any nuclear additions before 2030 would be associated
to LWRs. Refer to Table 3-‐3 for the BC forecasted generation.
3.1.2.2 Nuclear After 2030
In this scenario, BC values were kept the same through 2030. After 2030, it is assumed
that LFTR technology will be available to the market and all new electricity generation
connecting to the grid, with the exception of renewables, will be due to LFTRs. The
forecasted generation for renewables was left the same to satisfy RPS programs, as well as
minimizing CO2 emissions from the power sector, keeping in mind one of the overall goals
for the power sector is to reduce GHG emissions. For other fuel sources, generation after
2030 was kept constant, unless it was already decreasing, as was the case for coal. See
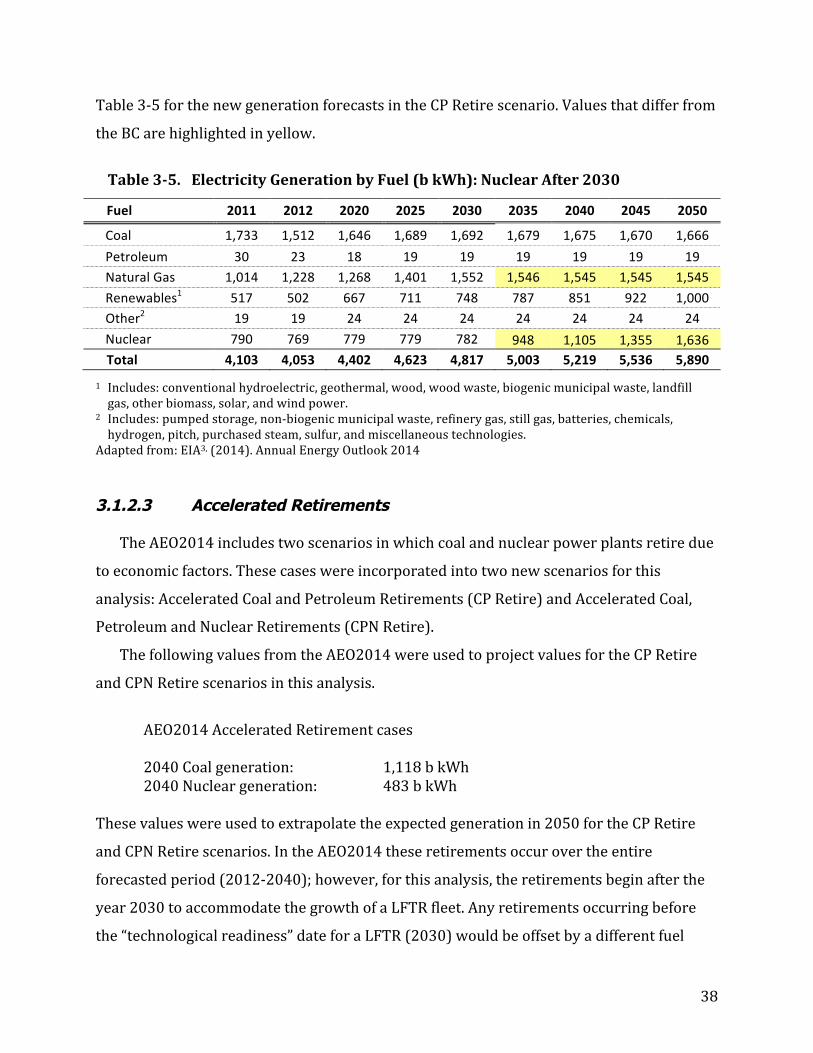
38
Table 3-‐5 for the new generation forecasts in the CP Retire scenario. Values that differ from
the BC are highlighted in yellow.
Table 3-‐5. Electricity Generation by Fuel (b kWh): Nuclear After 2030
Fuel 2011 2012 2020 2025 2030 2035 2040 2045 2050
Coal 1,733 1,512 1,646 1,689 1,692 1,679 1,675 1,670 1,666 Petroleum 30 23 18 19 19 19 19 19 19 Natural Gas 1,014 1,228 1,268 1,401 1,552 1,546 1,545 1,545 1,545 Renewables1 517 502 667 711 748 787 851 922 1,000 Other2 19 19 24 24 24 24 24 24 24 Nuclear 790 769 779 779 782 948 1,105 1,355 1,636 Total 4,103 4,053 4,402 4,623 4,817 5,003 5,219 5,536 5,890
1 Includes: conventional hydroelectric, geothermal, wood, wood waste, biogenic municipal waste, landfill gas, other biomass, solar, and wind power.
2 Includes: pumped storage, non-‐biogenic municipal waste, refinery gas, still gas, batteries, chemicals, hydrogen, pitch, purchased steam, sulfur, and miscellaneous technologies.
Adapted from: EIA3, (2014). Annual Energy Outlook 2014 3.1.2.3 Accelerated Retirements
The AEO2014 includes two scenarios in which coal and nuclear power plants retire due
to economic factors. These cases were incorporated into two new scenarios for this
analysis: Accelerated Coal and Petroleum Retirements (CP Retire) and Accelerated Coal,
Petroleum and Nuclear Retirements (CPN Retire).
The following values from the AEO2014 were used to project values for the CP Retire
and CPN Retire scenarios in this analysis.
AEO2014 Accelerated Retirement cases 2040 Coal generation: 1,118 b kWh 2040 Nuclear generation: 483 b kWh
These values were used to extrapolate the expected generation in 2050 for the CP Retire
and CPN Retire scenarios. In the AEO2014 these retirements occur over the entire
forecasted period (2012-‐2040); however, for this analysis, the retirements begin after the
year 2030 to accommodate the growth of a LFTR fleet. Any retirements occurring before
the “technological readiness” date for a LFTR (2030) would be offset by a different fuel
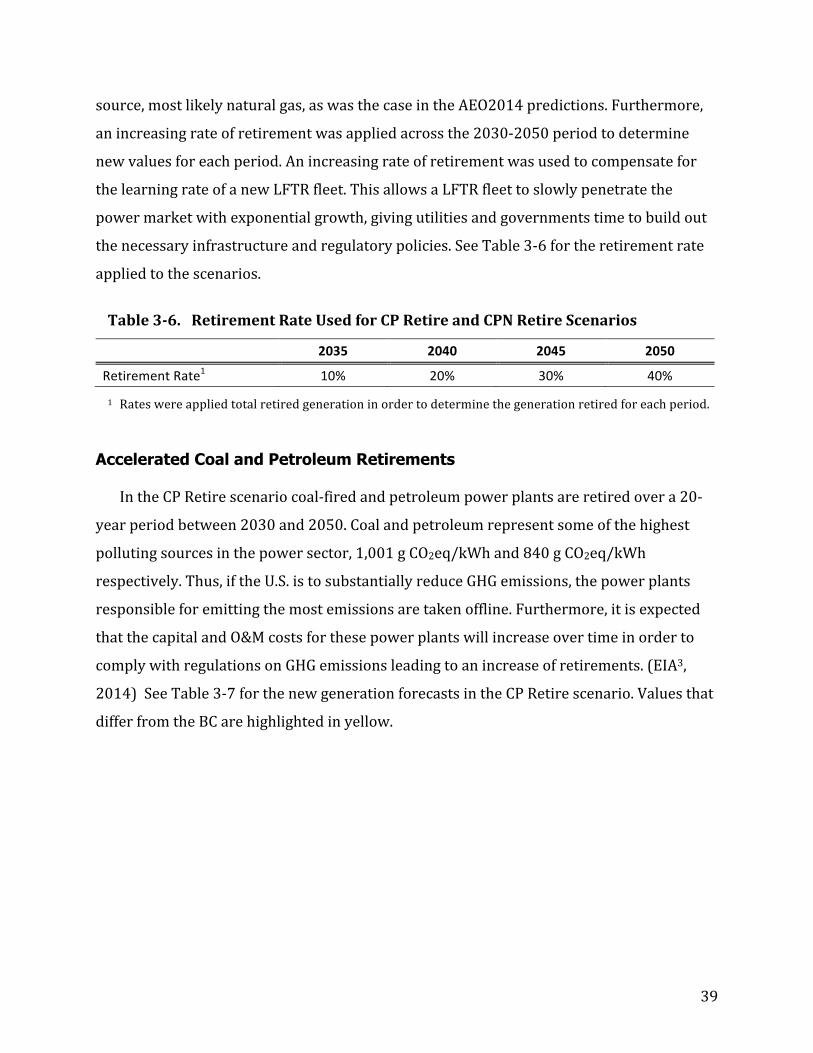
39
source, most likely natural gas, as was the case in the AEO2014 predictions. Furthermore,
an increasing rate of retirement was applied across the 2030-‐2050 period to determine
new values for each period. An increasing rate of retirement was used to compensate for
the learning rate of a new LFTR fleet. This allows a LFTR fleet to slowly penetrate the
power market with exponential growth, giving utilities and governments time to build out
the necessary infrastructure and regulatory policies. See Table 3-‐6 for the retirement rate
applied to the scenarios.
Table 3-‐6. Retirement Rate Used for CP Retire and CPN Retire Scenarios
2035 2040 2045 2050
Retirement Rate1 10% 20% 30% 40%
1 Rates were applied total retired generation in order to determine the generation retired for each period. Accelerated Coal and Petroleum Retirements
In the CP Retire scenario coal-‐fired and petroleum power plants are retired over a 20-‐
year period between 2030 and 2050. Coal and petroleum represent some of the highest
polluting sources in the power sector, 1,001 g CO2eq/kWh and 840 g CO2eq/kWh
respectively. Thus, if the U.S. is to substantially reduce GHG emissions, the power plants
responsible for emitting the most emissions are taken offline. Furthermore, it is expected
that the capital and O&M costs for these power plants will increase over time in order to
comply with regulations on GHG emissions leading to an increase of retirements. (EIA3,
2014) See Table 3-‐7 for the new generation forecasts in the CP Retire scenario. Values that
differ from the BC are highlighted in yellow.
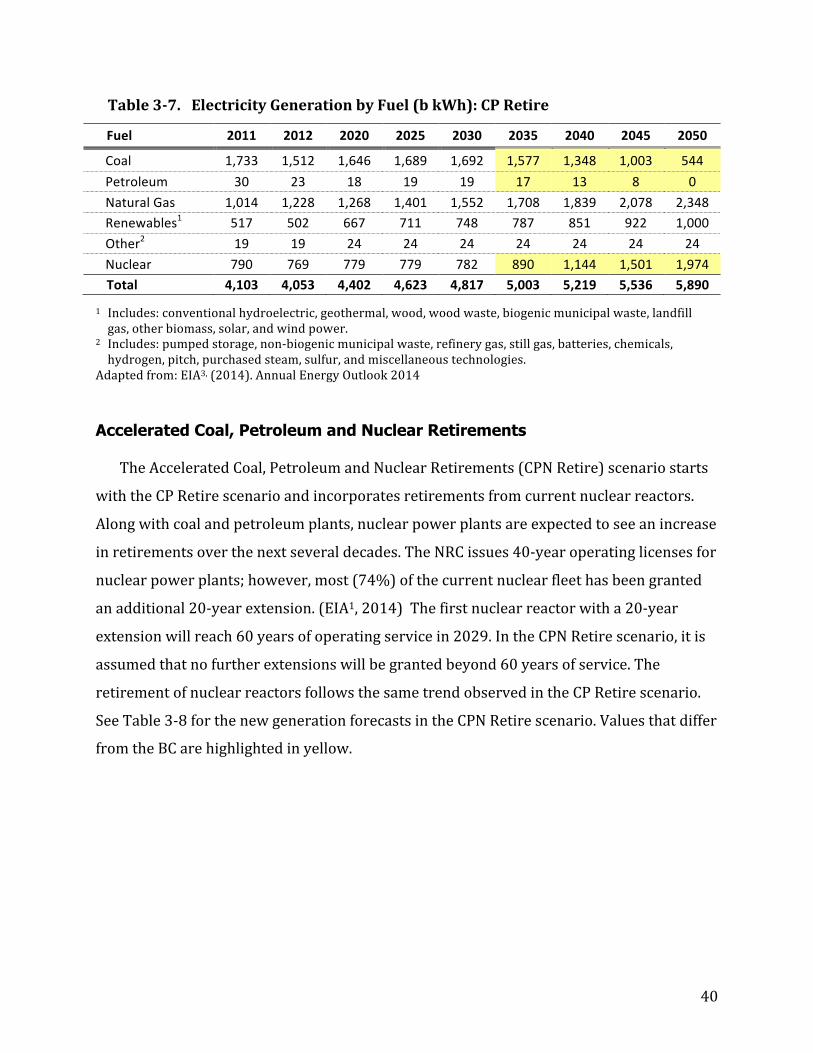
40
Table 3-‐7. Electricity Generation by Fuel (b kWh): CP Retire
Fuel 2011 2012 2020 2025 2030 2035 2040 2045 2050
Coal 1,733 1,512 1,646 1,689 1,692 1,577 1,348 1,003 544 Petroleum 30 23 18 19 19 17 13 8 0 Natural Gas 1,014 1,228 1,268 1,401 1,552 1,708 1,839 2,078 2,348 Renewables1 517 502 667 711 748 787 851 922 1,000 Other2 19 19 24 24 24 24 24 24 24 Nuclear 790 769 779 779 782 890 1,144 1,501 1,974 Total 4,103 4,053 4,402 4,623 4,817 5,003 5,219 5,536 5,890
1 Includes: conventional hydroelectric, geothermal, wood, wood waste, biogenic municipal waste, landfill gas, other biomass, solar, and wind power.
2 Includes: pumped storage, non-‐biogenic municipal waste, refinery gas, still gas, batteries, chemicals, hydrogen, pitch, purchased steam, sulfur, and miscellaneous technologies.
Adapted from: EIA3, (2014). Annual Energy Outlook 2014 Accelerated Coal, Petroleum and Nuclear Retirements
The Accelerated Coal, Petroleum and Nuclear Retirements (CPN Retire) scenario starts
with the CP Retire scenario and incorporates retirements from current nuclear reactors.
Along with coal and petroleum plants, nuclear power plants are expected to see an increase
in retirements over the next several decades. The NRC issues 40-‐year operating licenses for
nuclear power plants; however, most (74%) of the current nuclear fleet has been granted
an additional 20-‐year extension. (EIA1, 2014) The first nuclear reactor with a 20-‐year
extension will reach 60 years of operating service in 2029. In the CPN Retire scenario, it is
assumed that no further extensions will be granted beyond 60 years of service. The
retirement of nuclear reactors follows the same trend observed in the CP Retire scenario.
See Table 3-‐8 for the new generation forecasts in the CPN Retire scenario. Values that differ
from the BC are highlighted in yellow.
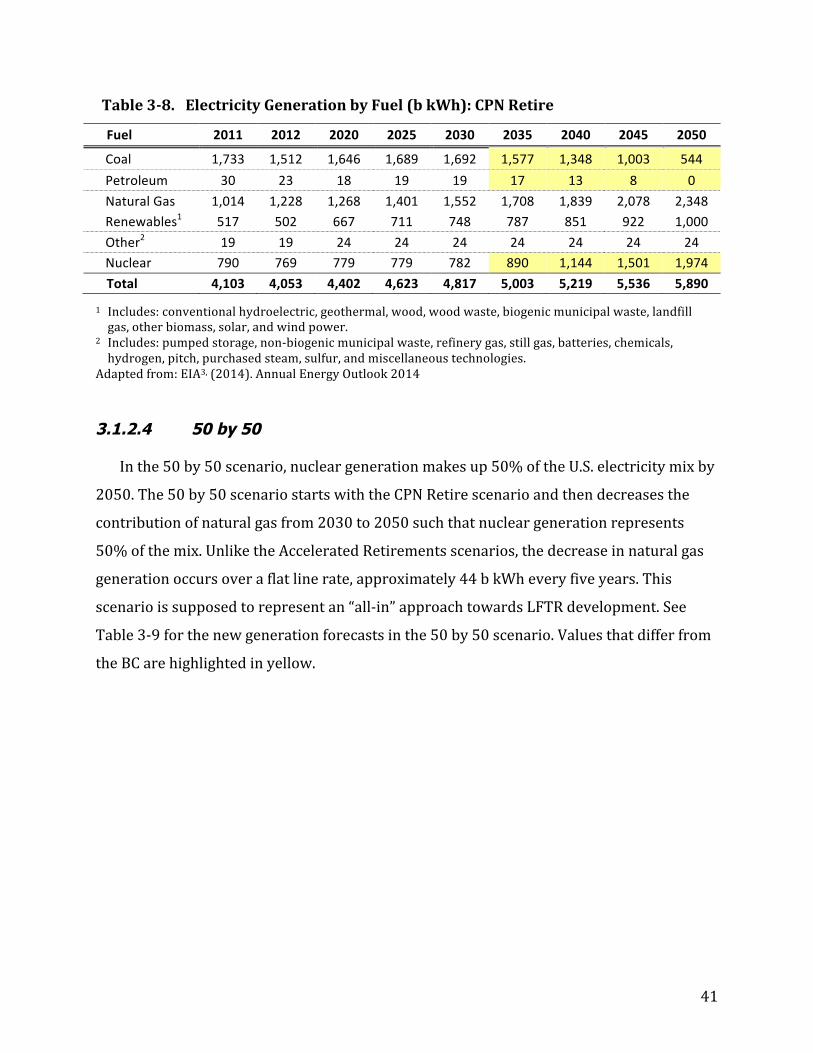
41
Table 3-‐8. Electricity Generation by Fuel (b kWh): CPN Retire
Fuel 2011 2012 2020 2025 2030 2035 2040 2045 2050
Coal 1,733 1,512 1,646 1,689 1,692 1,577 1,348 1,003 544 Petroleum 30 23 18 19 19 17 13 8 0 Natural Gas 1,014 1,228 1,268 1,401 1,552 1,708 1,839 2,078 2,348 Renewables1 517 502 667 711 748 787 851 922 1,000 Other2 19 19 24 24 24 24 24 24 24 Nuclear 790 769 779 779 782 890 1,144 1,501 1,974 Total 4,103 4,053 4,402 4,623 4,817 5,003 5,219 5,536 5,890
1 Includes: conventional hydroelectric, geothermal, wood, wood waste, biogenic municipal waste, landfill gas, other biomass, solar, and wind power.
2 Includes: pumped storage, non-‐biogenic municipal waste, refinery gas, still gas, batteries, chemicals, hydrogen, pitch, purchased steam, sulfur, and miscellaneous technologies.
Adapted from: EIA3, (2014). Annual Energy Outlook 2014 3.1.2.4 50 by 50
In the 50 by 50 scenario, nuclear generation makes up 50% of the U.S. electricity mix by
2050. The 50 by 50 scenario starts with the CPN Retire scenario and then decreases the
contribution of natural gas from 2030 to 2050 such that nuclear generation represents
50% of the mix. Unlike the Accelerated Retirements scenarios, the decrease in natural gas
generation occurs over a flat line rate, approximately 44 b kWh every five years. This
scenario is supposed to represent an “all-‐in” approach towards LFTR development. See
Table 3-‐9 for the new generation forecasts in the 50 by 50 scenario. Values that differ from
the BC are highlighted in yellow.
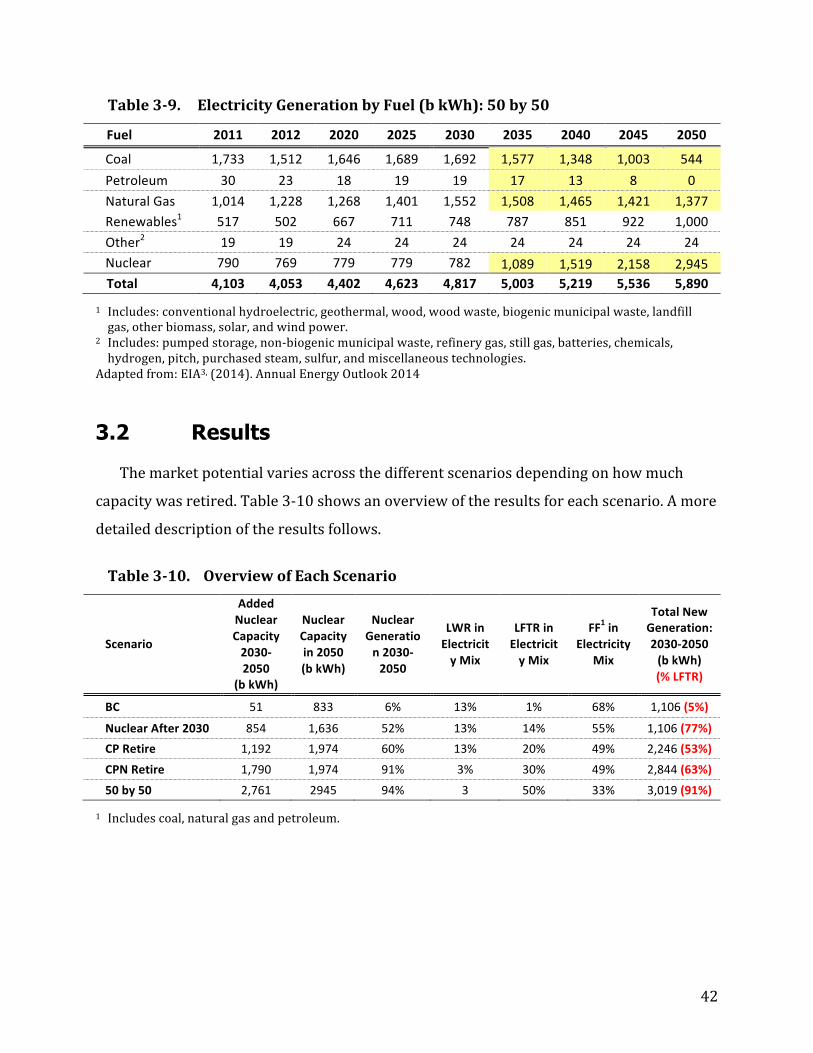
42
Table 3-‐9. Electricity Generation by Fuel (b kWh): 50 by 50
Fuel 2011 2012 2020 2025 2030 2035 2040 2045 2050
Coal 1,733 1,512 1,646 1,689 1,692 1,577 1,348 1,003 544 Petroleum 30 23 18 19 19 17 13 8 0 Natural Gas 1,014 1,228 1,268 1,401 1,552 1,508 1,465 1,421 1,377 Renewables1 517 502 667 711 748 787 851 922 1,000 Other2 19 19 24 24 24 24 24 24 24 Nuclear 790 769 779 779 782 1,089 1,519 2,158 2,945 Total 4,103 4,053 4,402 4,623 4,817 5,003 5,219 5,536 5,890
1 Includes: conventional hydroelectric, geothermal, wood, wood waste, biogenic municipal waste, landfill gas, other biomass, solar, and wind power.
2 Includes: pumped storage, non-‐biogenic municipal waste, refinery gas, still gas, batteries, chemicals, hydrogen, pitch, purchased steam, sulfur, and miscellaneous technologies.
Adapted from: EIA3, (2014). Annual Energy Outlook 2014 3.2 Results
The market potential varies across the different scenarios depending on how much
capacity was retired. Table 3-‐10 shows an overview of the results for each scenario. A more
detailed description of the results follows.
Table 3-‐10. Overview of Each Scenario
Scenario
Added Nuclear Capacity 2030-‐2050
(b kWh)
Nuclear Capacity in 2050 (b kWh)
Nuclear Generation 2030-‐2050
LWR in Electricity Mix
LFTR in Electricity Mix
FF1 in Electricity
Mix
Total New Generation: 2030-‐2050 (b kWh) (% LFTR)
BC 51 833 6% 13% 1% 68% 1,106 (5%)
Nuclear After 2030 854 1,636 52% 13% 14% 55% 1,106 (77%) CP Retire 1,192 1,974 60% 13% 20% 49% 2,246 (53%)
CPN Retire 1,790 1,974 91% 3% 30% 49% 2,844 (63%)
50 by 50 2,761 2945 94% 3 50% 33% 3,019 (91%)
1 Includes coal, natural gas and petroleum.
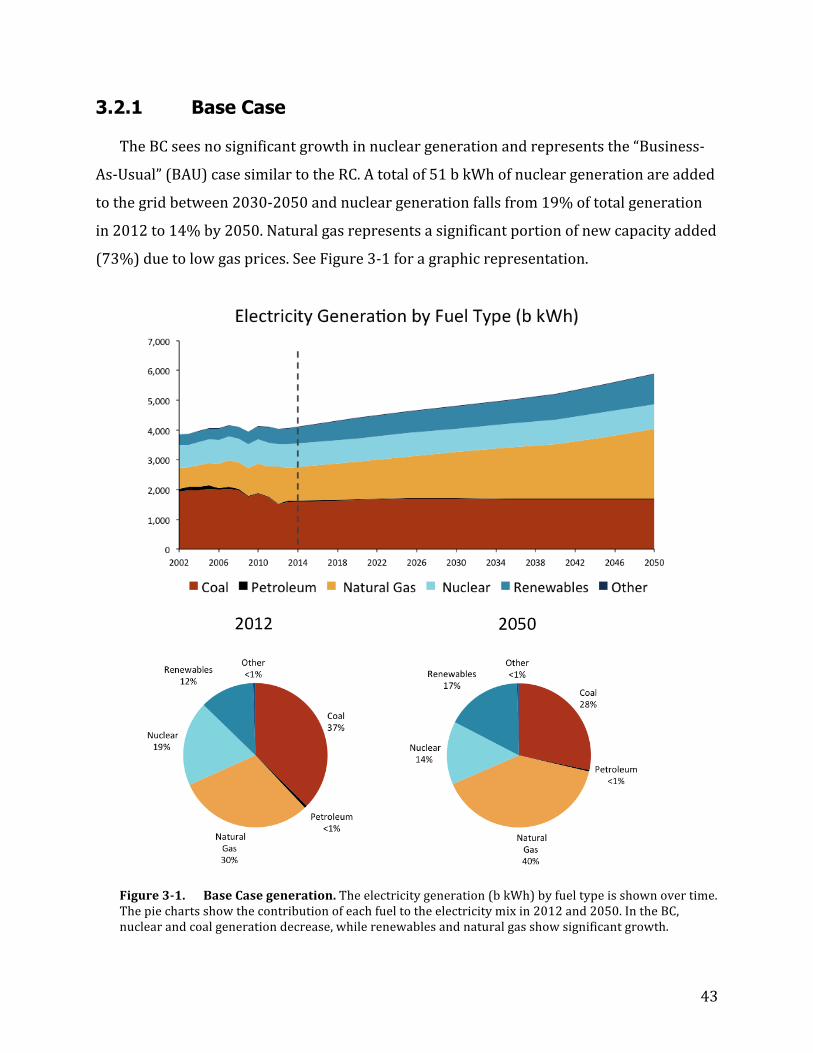
43
3.2.1 Base Case
The BC sees no significant growth in nuclear generation and represents the “Business-‐
As-‐Usual” (BAU) case similar to the RC. A total of 51 b kWh of nuclear generation are added
to the grid between 2030-‐2050 and nuclear generation falls from 19% of total generation
in 2012 to 14% by 2050. Natural gas represents a significant portion of new capacity added
(73%) due to low gas prices. See Figure 3-‐1 for a graphic representation.
Figure 3-‐1. Base Case generation. The electricity generation (b kWh) by fuel type is shown over time. The pie charts show the contribution of each fuel to the electricity mix in 2012 and 2050. In the BC, nuclear and coal generation decrease, while renewables and natural gas show significant growth.
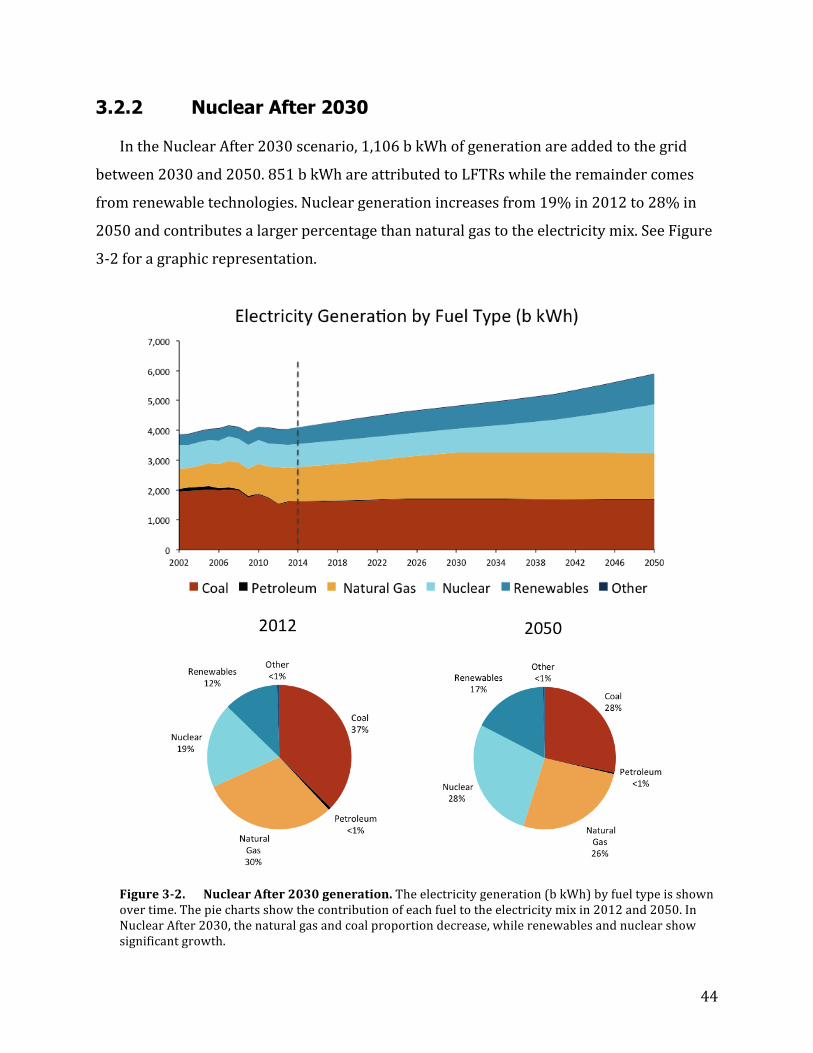
44
3.2.2 Nuclear After 2030
In the Nuclear After 2030 scenario, 1,106 b kWh of generation are added to the grid
between 2030 and 2050. 851 b kWh are attributed to LFTRs while the remainder comes
from renewable technologies. Nuclear generation increases from 19% in 2012 to 28% in
2050 and contributes a larger percentage than natural gas to the electricity mix. See Figure
3-‐2 for a graphic representation.
Figure 3-‐2. Nuclear After 2030 generation. The electricity generation (b kWh) by fuel type is shown over time. The pie charts show the contribution of each fuel to the electricity mix in 2012 and 2050. In Nuclear After 2030, the natural gas and coal proportion decrease, while renewables and nuclear show significant growth.
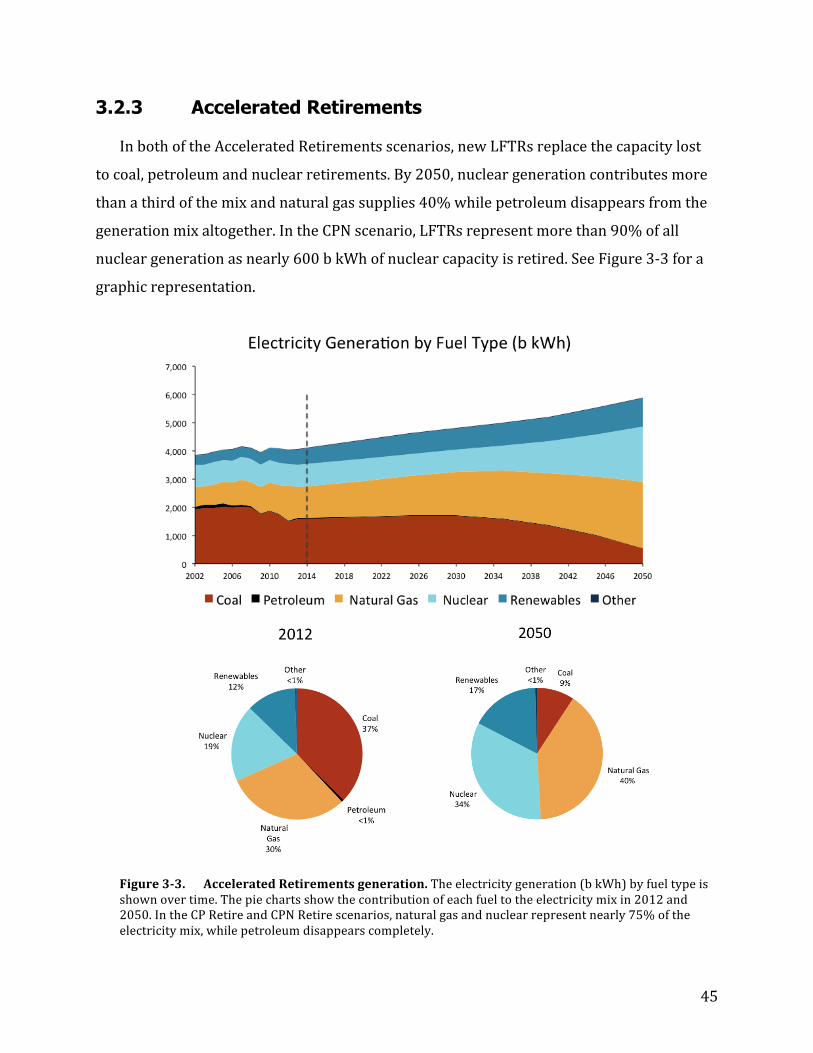
45
3.2.3 Accelerated Retirements
In both of the Accelerated Retirements scenarios, new LFTRs replace the capacity lost
to coal, petroleum and nuclear retirements. By 2050, nuclear generation contributes more
than a third of the mix and natural gas supplies 40% while petroleum disappears from the
generation mix altogether. In the CPN scenario, LFTRs represent more than 90% of all
nuclear generation as nearly 600 b kWh of nuclear capacity is retired. See Figure 3-‐3 for a
graphic representation.
Figure 3-‐3. Accelerated Retirements generation. The electricity generation (b kWh) by fuel type is shown over time. The pie charts show the contribution of each fuel to the electricity mix in 2012 and 2050. In the CP Retire and CPN Retire scenarios, natural gas and nuclear represent nearly 75% of the electricity mix, while petroleum disappears completely.
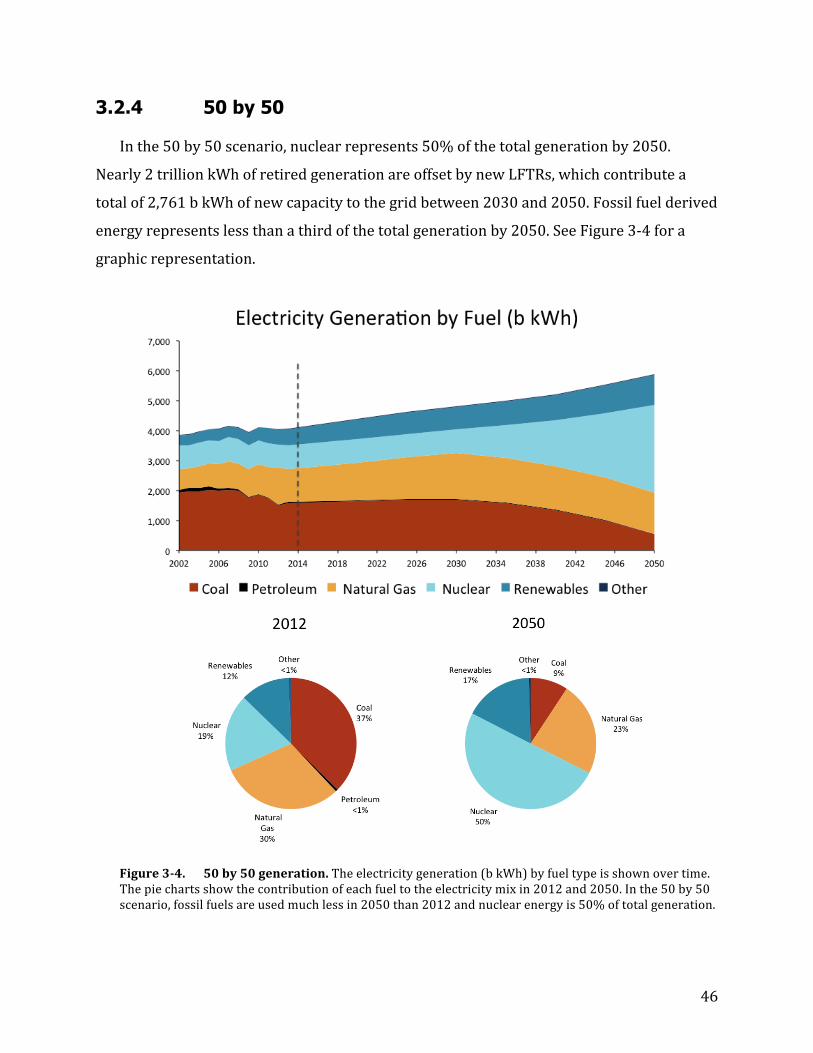
46
3.2.4 50 by 50
In the 50 by 50 scenario, nuclear represents 50% of the total generation by 2050.
Nearly 2 trillion kWh of retired generation are offset by new LFTRs, which contribute a
total of 2,761 b kWh of new capacity to the grid between 2030 and 2050. Fossil fuel derived
energy represents less than a third of the total generation by 2050. See Figure 3-‐4 for a
graphic representation.
Figure 3-‐4. 50 by 50 generation. The electricity generation (b kWh) by fuel type is shown over time. The pie charts show the contribution of each fuel to the electricity mix in 2012 and 2050. In the 50 by 50 scenario, fossil fuels are used much less in 2050 than 2012 and nuclear energy is 50% of total generation.
47
3.3 Limitations The limitations of this assessment are described below.
3.3.1 Market Conditions The demand for electricity, and thus the amount of electricity generated, was kept the same
for each scenario. This analysis made the assumption that any change in economic
conditions would apply equally across all fuel types. In reality, choices to add capacity to
the electric grid are dependent on market conditions such as GDP growth and demand.
(EIA3, 2014) Fuel prices also have a significant effect on generation mix and any changes in
the price of fossil fuels will greatly affect their supply. However, it was beyond the scope of
this project to incorporate fluctuating economic conditions. Rather this analysis was purely
made to illustrate the effects of developing and expanding a LFTR fleet in the U.S.
3.3.2 Reliance on the AEO2014
The AEO2014 was used as the foundation for this report to generate new values in the
various scenarios. The assumptions made in the AEO2014 Reference case also applied to
BC. Liberties were made on behalf of the remaining scenarios in the case, but values before
2030 were based off the RC.
3.3.3 Technological Readiness
It is unclear when a LFTR will be ready for commercial implementation. Much research
and testing need to occur before any reliance can be made on a readiness date. The year
2030 was chosen based on reports regarding LFTR development. Many countries and
companies are aggressively pursuing this technology (see Chapter 2: Thorium as a Nuclear
Fuel). China is likely to bring a commercial sized reactor online by the mid 2020s. It is
assumed that once a commercial reactor has been displayed at a global level, development

48
of the technology will pick up soon after. 2030 is an optimistic date for development in the
U.S., but nonetheless is possible.
The following chapter discusses the benefits of implementing a LFTR fleet in the various
scenarios.
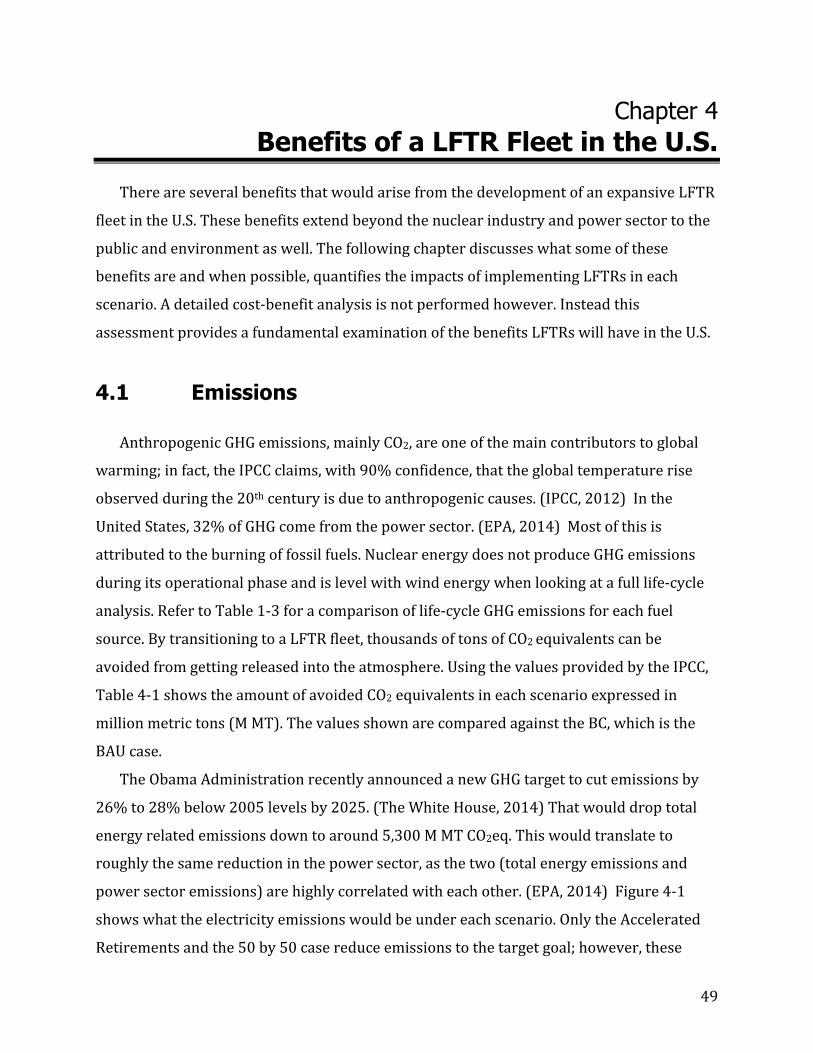
49
Chapter 4 Benefits of a LFTR Fleet in the U.S.
There are several benefits that would arise from the development of an expansive LFTR
fleet in the U.S. These benefits extend beyond the nuclear industry and power sector to the
public and environment as well. The following chapter discusses what some of these
benefits are and when possible, quantifies the impacts of implementing LFTRs in each
scenario. A detailed cost-‐benefit analysis is not performed however. Instead this
assessment provides a fundamental examination of the benefits LFTRs will have in the U.S.
4.1 Emissions
Anthropogenic GHG emissions, mainly CO2, are one of the main contributors to global
warming; in fact, the IPCC claims, with 90% confidence, that the global temperature rise
observed during the 20th century is due to anthropogenic causes. (IPCC, 2012) In the
United States, 32% of GHG come from the power sector. (EPA, 2014) Most of this is
attributed to the burning of fossil fuels. Nuclear energy does not produce GHG emissions
during its operational phase and is level with wind energy when looking at a full life-‐cycle
analysis. Refer to Table 1-‐3 for a comparison of life-‐cycle GHG emissions for each fuel
source. By transitioning to a LFTR fleet, thousands of tons of CO2 equivalents can be
avoided from getting released into the atmosphere. Using the values provided by the IPCC,
Table 4-‐1 shows the amount of avoided CO2 equivalents in each scenario expressed in
million metric tons (M MT). The values shown are compared against the BC, which is the
BAU case.
The Obama Administration recently announced a new GHG target to cut emissions by
26% to 28% below 2005 levels by 2025. (The White House, 2014) That would drop total
energy related emissions down to around 5,300 M MT CO2eq. This would translate to
roughly the same reduction in the power sector, as the two (total energy emissions and
power sector emissions) are highly correlated with each other. (EPA, 2014) Figure 4-‐1
shows what the electricity emissions would be under each scenario. Only the Accelerated
Retirements and the 50 by 50 case reduce emissions to the target goal; however, these
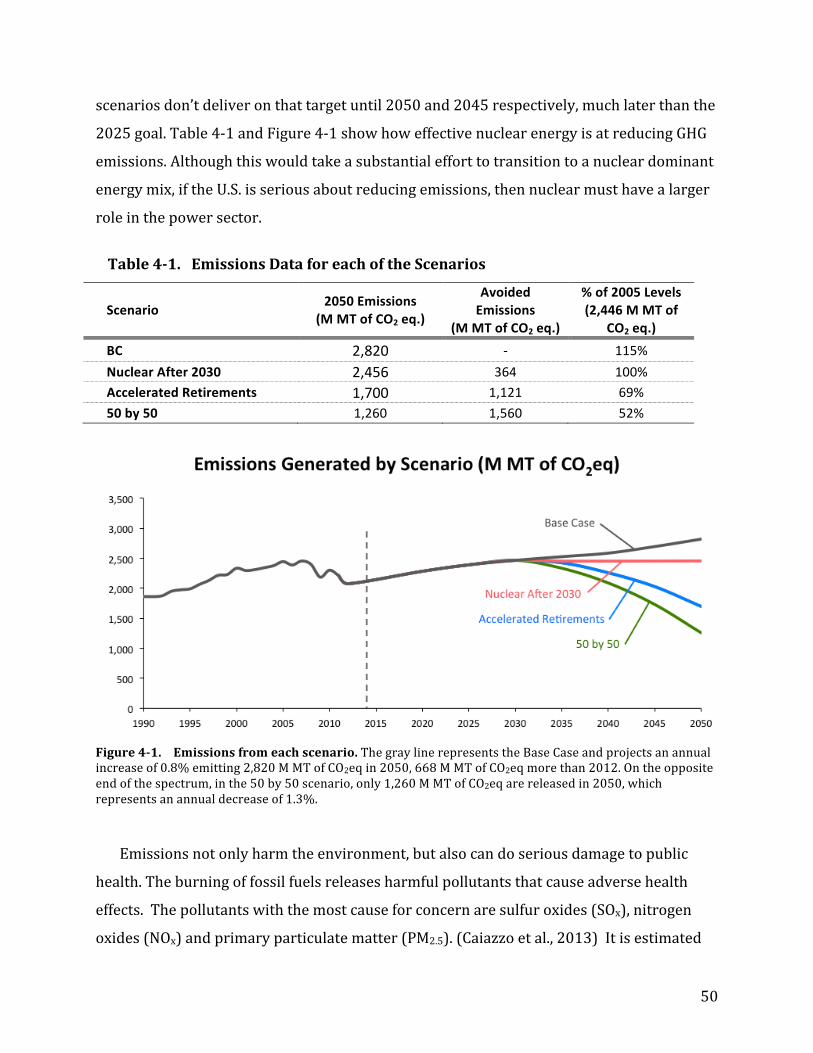
50
scenarios don’t deliver on that target until 2050 and 2045 respectively, much later than the
2025 goal. Table 4-‐1 and Figure 4-‐1 show how effective nuclear energy is at reducing GHG
emissions. Although this would take a substantial effort to transition to a nuclear dominant
energy mix, if the U.S. is serious about reducing emissions, then nuclear must have a larger
role in the power sector.
Table 4-‐1. Emissions Data for each of the Scenarios
Scenario 2050 Emissions (M MT of CO2 eq.)
Avoided Emissions
(M MT of CO2 eq.)
% of 2005 Levels (2,446 M MT of
CO2 eq.) BC 2,820 -‐ 115% Nuclear After 2030 2,456 364 100% Accelerated Retirements 1,700 1,121 69% 50 by 50 1,260 1,560 52%
Figure 4-‐1. Emissions from each scenario. The gray line represents the Base Case and projects an annual increase of 0.8% emitting 2,820 M MT of CO2eq in 2050, 668 M MT of CO2eq more than 2012. On the opposite end of the spectrum, in the 50 by 50 scenario, only 1,260 M MT of CO2eq are released in 2050, which represents an annual decrease of 1.3%.
Emissions not only harm the environment, but also can do serious damage to public
health. The burning of fossil fuels releases harmful pollutants that cause adverse health
effects. The pollutants with the most cause for concern are sulfur oxides (SOx), nitrogen
oxides (NOx) and primary particulate matter (PM2.5). (Caiazzo et al., 2013) It is estimated
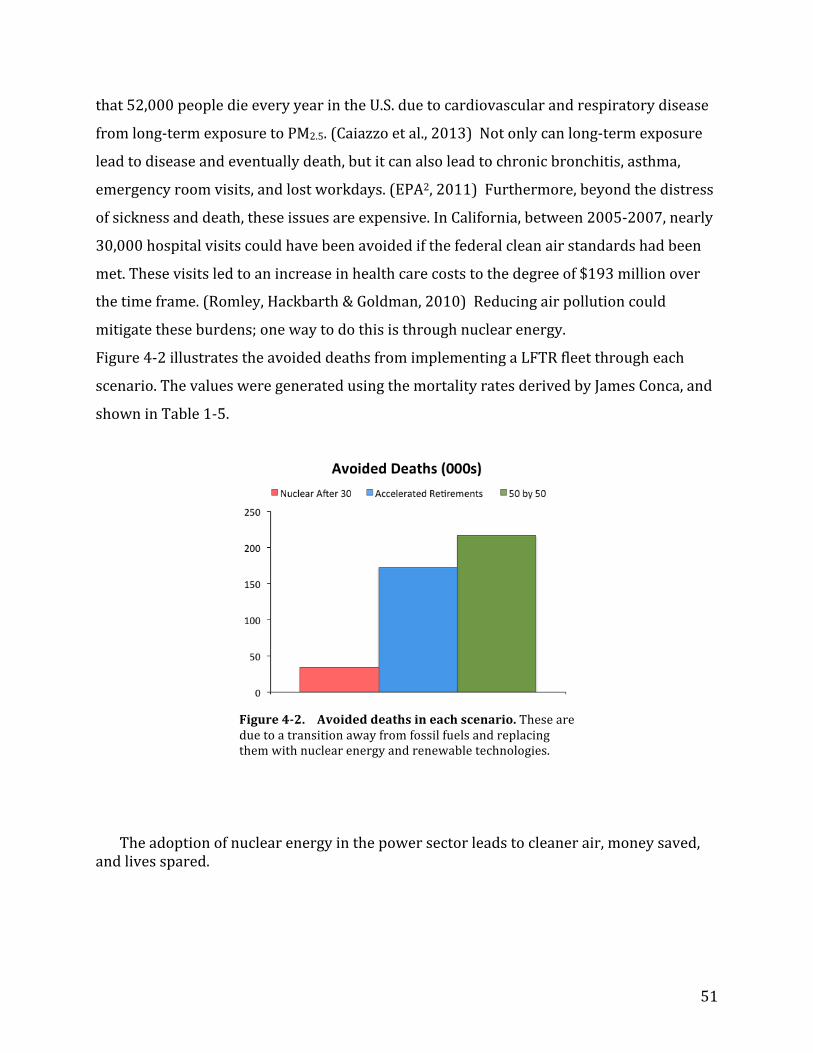
51
that 52,000 people die every year in the U.S. due to cardiovascular and respiratory disease
from long-‐term exposure to PM2.5. (Caiazzo et al., 2013) Not only can long-‐term exposure
lead to disease and eventually death, but it can also lead to chronic bronchitis, asthma,
emergency room visits, and lost workdays. (EPA2, 2011) Furthermore, beyond the distress
of sickness and death, these issues are expensive. In California, between 2005-‐2007, nearly
30,000 hospital visits could have been avoided if the federal clean air standards had been
met. These visits led to an increase in health care costs to the degree of $193 million over
the time frame. (Romley, Hackbarth & Goldman, 2010) Reducing air pollution could
mitigate these burdens; one way to do this is through nuclear energy.
Figure 4-‐2 illustrates the avoided deaths from implementing a LFTR fleet through each
scenario. The values were generated using the mortality rates derived by James Conca, and
shown in Table 1-‐5.
Figure 4-‐2. Avoided deaths in each scenario. These are due to a transition away from fossil fuels and replacing them with nuclear energy and renewable technologies.
The adoption of nuclear energy in the power sector leads to cleaner air, money saved,
and lives spared.
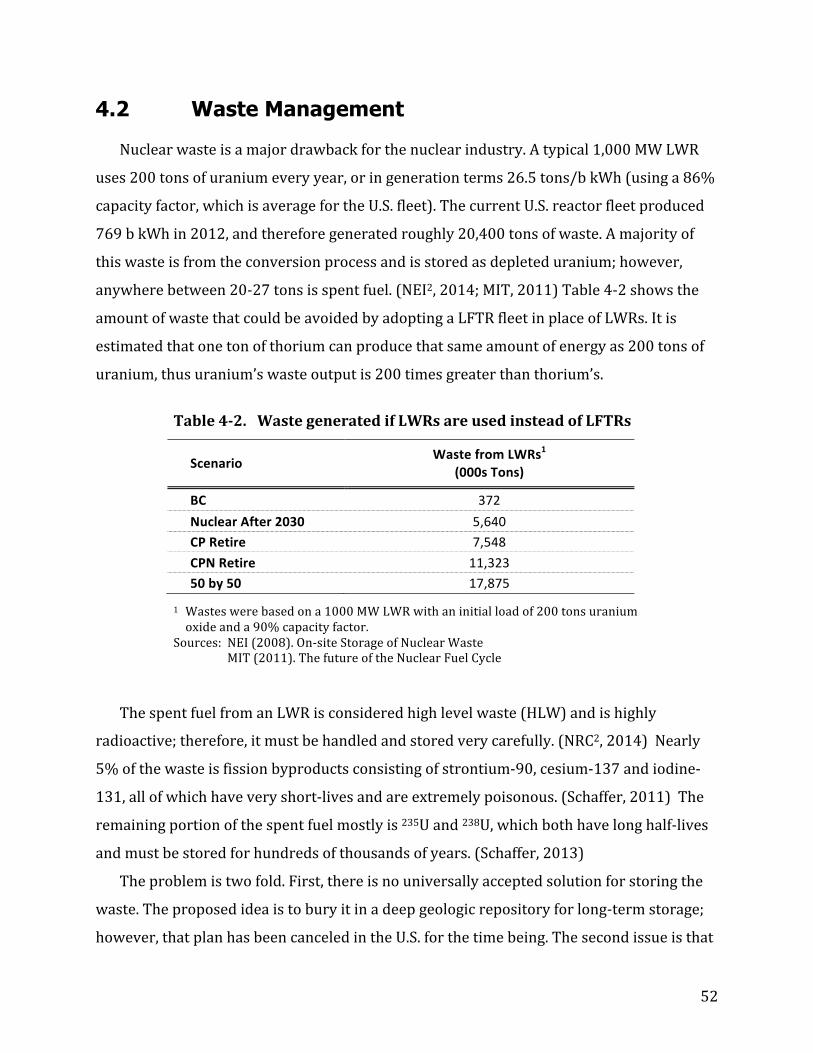
52
4.2 Waste Management
Nuclear waste is a major drawback for the nuclear industry. A typical 1,000 MW LWR
uses 200 tons of uranium every year, or in generation terms 26.5 tons/b kWh (using a 86%
capacity factor, which is average for the U.S. fleet). The current U.S. reactor fleet produced
769 b kWh in 2012, and therefore generated roughly 20,400 tons of waste. A majority of
this waste is from the conversion process and is stored as depleted uranium; however,
anywhere between 20-‐27 tons is spent fuel. (NEI2, 2014; MIT, 2011) Table 4-‐2 shows the
amount of waste that could be avoided by adopting a LFTR fleet in place of LWRs. It is
estimated that one ton of thorium can produce that same amount of energy as 200 tons of
uranium, thus uranium’s waste output is 200 times greater than thorium’s.
Table 4-‐2. Waste generated if LWRs are used instead of LFTRs
Scenario Waste from LWRs1 (000s Tons)
BC 372 Nuclear After 2030 5,640 CP Retire 7,548 CPN Retire 11,323 50 by 50 17,875
1 Wastes were based on a 1000 MW LWR with an initial load of 200 tons uranium oxide and a 90% capacity factor.
Sources: NEI (2008). On-‐site Storage of Nuclear Waste MIT (2011). The future of the Nuclear Fuel Cycle
The spent fuel from an LWR is considered high level waste (HLW) and is highly
radioactive; therefore, it must be handled and stored very carefully. (NRC2, 2014) Nearly
5% of the waste is fission byproducts consisting of strontium-‐90, cesium-‐137 and iodine-‐
131, all of which have very short-‐lives and are extremely poisonous. (Schaffer, 2011) The
remaining portion of the spent fuel mostly is 235U and 238U, which both have long half-‐lives
and must be stored for hundreds of thousands of years. (Schaffer, 2013)
The problem is two fold. First, there is no universally accepted solution for storing the
waste. The proposed idea is to bury it in a deep geologic repository for long-‐term storage;
however, that plan has been canceled in the U.S. for the time being. The second issue is that
53
after a substantial amount of time, a small, but substantial, amount of plutonium will be
created in the spent fuel. This presents a proliferation risk, as plutonium is the main
constituent used in nuclear weapons.
In a LFTR many of these drawbacks are overcome due to the nature of the thorium fuel
cycle, which produces much less volume of waste, by a factor of about 200-‐300. (Cooper et
al., 2011) Furthermore, because thorium has fewer neutrons than uranium, it requires
many more neutrons captures in order to produce the same fission byproducts. As a result,
the thorium fuel cycle produces much less radiotoxic waste. While uranium spent fuel takes
tens to hundreds of thousands of years to stabilize, thorium fuel takes only 300 years.
(Kamei & Hakami, 2011) This minimizes the need for spent fuel storage and handling, both
a safety and economic benefit.
Thorium and LFTRs also help mitigate the risk of proliferation. When using a pure
thorium-‐uranium fuel cycle, there are several integral features that make it proliferation
resistant. One of the isotopes present in the decay chain is 232U, which emits very strong
gamma radiation. This makes it extremely difficult to handle and shield against making it
proliferation resistant. (Ashley et al., 2012) However, thorium needs the presence of a
fissile load material in order to begin its chain reaction, thus while the thorium fuel cycle is
proliferation resistant, it does not eliminate all of the possible routes to obtaining material
suitable for a nuclear weapon. As is the case for a LWR, which produces much more
plutonium than a LFTR would produce. (Hargraves & Moir, 2010)
4.3 Safety
The inherent safety features built into the design of the LFTR make it an intriguing
option for new Gen IV reactors. The foundation of this system is centered on chemistry,
using fluid fuel mixed with a carrier salt. This fluid system has several benefits that give the
LFTR an edge over current LWR reactors. First and foremost, the fluid fuel eliminates any
chance of a meltdown. Meltdowns are the black eye of the nuclear industry. Images of the
recent and tragic disaster at Fukushima are still fresh in the mind. The design of the LFTR
prevents any incidents similar to that of Fukushima or Chernobyl. The reactors currently
used in the U.S. all operate under tremendous pressure, which requires expensive piping
54
and pressure vessels. (Hargraves & Moir, 2010) Furthermore, a large containment building
acts as the last line of defense and is supposed to withstand any explosion caused by steam
or hydrogen buildup. This is what was supposed to happen at Fukushima; however, the
containment building failed to stay intact releasing dangerous radiation into the
atmosphere.
Rather than operating at high pressures, LFTRs operate at high temperature and near
atmospheric pressure eliminating the need for thick walled containment structures and
pressure vessels. (LeBlanc2, 2010) There are no pressure explosions in a LFTR. The high
temperature also suits the fluid fuel mixture in the reactor, which has a high heat capacity
and makes for an excellent coolant. This minimizes the size of the primary heat exchange
system allowing the entire system to be more compact and save money on construction
costs. (LeBlanc2, 2010) the high temperature has another advantage in that it allows the
use of more efficient gas turbines such as Brayton nitrogen generators, instead of steam
turbines, bumping the thermal efficiency from 35% to 50%. (Cooper et al., 2011)
Moreover, the fluid fuel mixture has a strong negative temperature coefficient of
reactivity. As the salt heats up, the fuel expands, which reduces the absorption of neutrons
and slows down the nuclear reaction. This is both a safety mechanism and an operational
benefit. In the event of an uncontrolled reaction where heat builds up in the reactor, the
salt/fuel mixture responds by slowing the reaction. This is an operational benefit because it
allows operators to use the power plant for load following, which is typically not done in
the U.S.
Finally, the LFTR has a built in safety mechanism that acts as a back up in the worst-‐
case scenario of a station blackout. In fact a station blackout is not a threatening situation
to LFTRs as they are to some LWRs. In the event of total power loss, an air-‐cooled freeze
plug sitting under the reactor core melts and the fuel flows down into a neutron absorbing
drain tank where the reaction quickly stops and the fuel solidifies. Any fission products in
the fuel mixture quickly form stable fluorides and stay within the salt in the event of a
severe breech (natural disaster). (Leblanc1, 2010)
55
4.4 Costs
Some of the economic benefits have already been discussed in previous sections:
smaller primary components, no expensive pressurized vessels, more compact designs, all
of which lead to a cheaper reactor. It is estimated that the capital costs for a LFTR could be
25% to 50% less than a LWR. (LeBlanc2, 2010) Other estimates suggest that a 1 GW plant
could be built for a cost between $220 million to $780 million. (Andreev, 2013) Hargraves
and Moir (2010) suggest that small 100 MW systems could be made in massive production
lines similar to how Boeing produces their jets. They believe that this style of production
will provide the “advantages of specialization among workers, product standardization,
and optimization control, as inspections can be conducted by highly trained workers using
installed, specialized equipment.”
Furthermore, the thorium in a LFTR does not need to be enriched or fabricated into fuel
assemblies. This expensive process accounts for roughly 10% of the total cost of electricity
for a LWR. (MIT, 2011; University of Chicago, 2004) Table 4-‐3 shows the avoided cost of
enrichment and fabrication offset by using LFTR technology. While, fuel costs only
represent 10% of the total cost, using a different fuel cycle and reactor design can save a lot
of money. In just the BC alone, nearly $200 billion dollars is spent over a 20-‐year period to
fuel nuclear reactors. Eliminating this cost also brings the cost of nuclear electricity closer
to natural gas and coal making LFTRs a lucrative choice once the technology is ready for a
commercial scale. The design of the LFTR also makes the system easier to operate
compared to LWRs, which would decrease O&M costs. Zou and Barnett report that staffing
costs for a 1000 MW plant could decrease by a factor of 10 from $50 million to $5 million.
(Zou & Barnett, 2014)
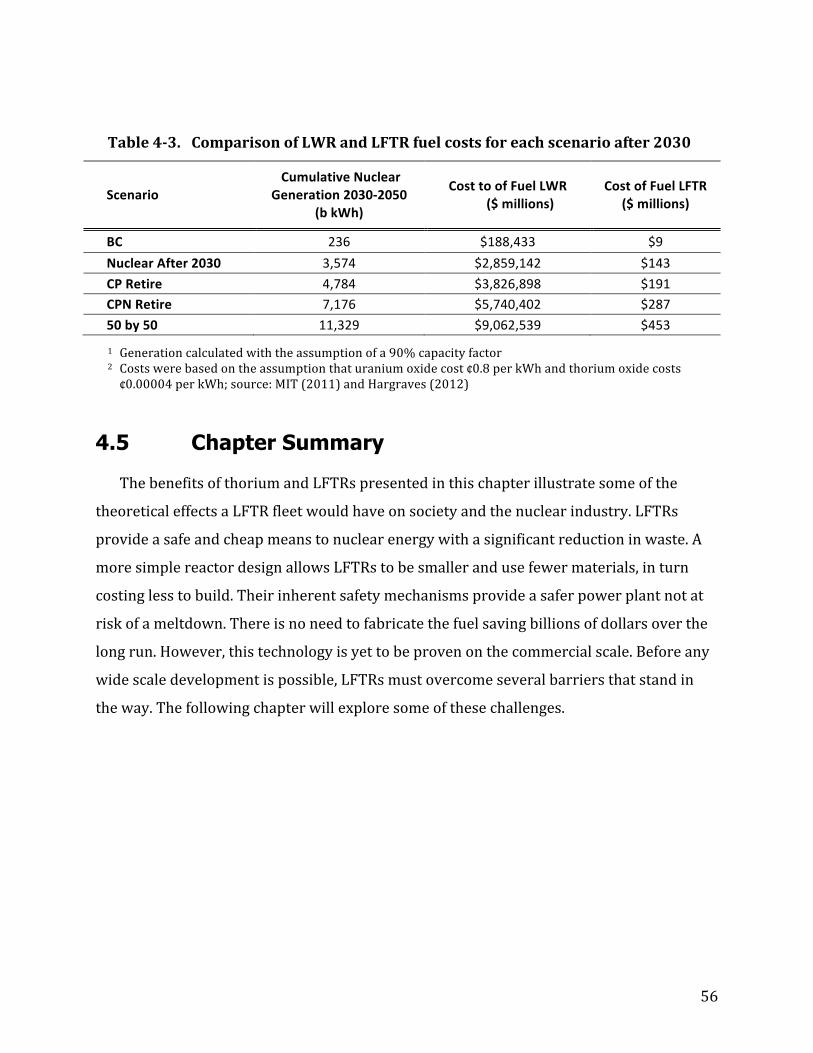
56
Table 4-‐3. Comparison of LWR and LFTR fuel costs for each scenario after 2030
Scenario Cumulative Nuclear Generation 2030-‐2050
(b kWh)
Cost to of Fuel LWR ($ millions)
Cost of Fuel LFTR ($ millions)
BC 236 $188,433 $9 Nuclear After 2030 3,574 $2,859,142 $143 CP Retire 4,784 $3,826,898 $191 CPN Retire 7,176 $5,740,402 $287 50 by 50 11,329 $9,062,539 $453
1 Generation calculated with the assumption of a 90% capacity factor 2 Costs were based on the assumption that uranium oxide cost ¢0.8 per kWh and thorium oxide costs ¢0.00004 per kWh; source: MIT (2011) and Hargraves (2012)
4.5 Chapter Summary
The benefits of thorium and LFTRs presented in this chapter illustrate some of the
theoretical effects a LFTR fleet would have on society and the nuclear industry. LFTRs
provide a safe and cheap means to nuclear energy with a significant reduction in waste. A
more simple reactor design allows LFTRs to be smaller and use fewer materials, in turn
costing less to build. Their inherent safety mechanisms provide a safer power plant not at
risk of a meltdown. There is no need to fabricate the fuel saving billions of dollars over the
long run. However, this technology is yet to be proven on the commercial scale. Before any
wide scale development is possible, LFTRs must overcome several barriers that stand in
the way. The following chapter will explore some of these challenges.
57
Chapter 5 Challenges to LFTR Development
The challenges that stand in the way for a LFTR fleet stem mainly from the fact that a
commercial reactor has yet to be built. Until that occurs, there is no reason to believe a
LFTR fleet will exist in the U.S. Beyond this overwhelming challenge of getting a reactor to
market, there lies technical, political, and economic challenges. The following chapter will
discuss what these challenges are.
5.1 Technical 5.1.1 Fission Product Removal
The LFTR operates on a close loop cycle; in order words the fuel gets reprocessed. This
is essential for the use of thorium; in that once 233U has been bred, it must be removed,
processed, and then returned to the fissile core. Only small scale experiments have tested
this process, and while the experiments were successful, there needs to be further research
exploring the continuous operation of processing fuels. (Endicott, 2013) A transition from
small laboratory testing to large-‐scale industrial application is likely to be expensive and
time consuming. (Wilson & Ainsworth, 1997; NNL, 2010) This process of fission removal is
also subject to proliferation and therefore must be monitored to mitigate risk. (LeBlanc1,
2010)
5.1.2 Corrosion
When the MSRE was shut down in 1973, one of the issues stated was corrosion. One of
the materials used is called Hastelloy N, which experienced corrosion due to neutron
irradiation. Research at ORNL on a new Hastelloy N material with titanium incorporated
into it proved to be successful in initial tests; however, the research ended with the
termination of the program. (Endicott, 2013) Recent research has been developed around a
new material known as carbon-‐carbon (C/C) that is a composite of graphite reinforced
58
with carbon fiber that can withstand temperatures around 1400 °C; although, much more
testing needs to occur in order to determine its use in a reactor. (Endicott, 2013)
5.1.3 Proliferation
The thorium fuel cycle produces 232U, which gives off intense radiation making spent
fuel relatively hard to handle. (IAEA, 2005) However, the proliferation resistance can be
circumvented through chemical processes. Ashley et al. suggest that the chemical
processes involved are fairly straightforward and could be carried out in nuclear facilities
all over the world. (Ashley et al., 2012) The main concern isn’t so much from terrorist
organizations, but rather, from willful countries seeking nuclear weapons programs. In the
U.S. this isn’t a threat, however the point remains that proliferation is possible.
5.1.4 Availability of Fuel
Thorium is not in high demand right now so the infrastructure to obtain thorium is
lacking. If a large-‐scale development of LFTRs is to occur than it will be necessary to have
this infrastructure in place. Additionally, thorium requires a fissile start up material to
begin the cycle. Ideally this material would be 233U to minimize the radiotoxicity and
amount of waste generated. The problem, however, is that no significant quantities of 233U
exist. (LeBlanc1, 2010) Other options lead to using LEU, HEU, or transuranics as the initial
load. This presents proliferation issues because these materials can all be used in nuclear
weapons. Furthermore, using these materials negates many of the waste benefits from
using the thorium fuel cycle. One idea is the use plutonium form old nuclear weapons to
reduce the U.S. stockpile. The issue here is that little research that has been done on
whether or not this is technically feasible. (SNETP, 2012)
59
5.2 Political
The U.S. government has a hands-‐off approach on the development of new reactors in
the nuclear industry. In a report to congress, the DOE stated that it is the private sector’s
and nuclear industry’s decision which technologies get deployed. (DOE, 2010) In addition,
the NRC is structured around the uranium-‐plutonium cycle and they rarely issue combined
licenses (COLs), the first one in 30 years was issued in 2012. Michael Goldstein, a lawyer for
the Energy From Thorium Foundation (EFTF), says licensing is a big issue and that there
are no existing regulations that address thorium or LFTR technologies. (Kelly-‐Detwiler,
2014) Addressing a completely new reactor design will prove difficult not only in the
development of the reactor, but in the development in new policies and regulations as well.
The NRC will need to research and train employees on how to deal with this new
technology, which will take time and money. (Hargraves & Moir, 2011)
5.3 Economic
The shale boom in the past decade has vastly expanded the reach of natural gas in the
energy mix. Natural gas is expected to make up 73% of all new capacity in the U.S., which is
due mainly to cheap supply. (EIA3, 2014) Technology choices for new generating capacity
are dependent largely on financial factors such as capital costs, which nuclear tend to have
the highest. (EIA3, 2014) LFTRs have been suggested to have lower capital costs, but the
truth to these notions wont be certain until a commercial scale LFTR has been built. A full
cost-‐benefit analysis should be included in any decision to pursue a new reactor design. If
the benefits do not outweigh the costs, there is little chance it will be picked up by
investors. (Barrett, Bragg-‐Sitton & Galicki, 2012) Therefore, if LFTRs are to be successful in
a market-‐driven industry, they must demonstrate clear and substantial benefits over the
competing technologies. (NNL, 2010)
The competition with uranium is another limiting factor to thorium’s growth. The
remaining reserves for uranium are said to last another 100 years at current consumption
rates, however as it was noted, this is likely to increase as the price for uranium increases.
(Serfontein & Mulder, 2014) Furthermore, the industry as rooted itself in the uranium-‐

60
plutonium fuel cycle, and stakeholders involved have a large amount at stake with solid
fuel designs based on the uranium-‐plutonium cycle. (LeBlanc2, 2010) The stakeholders
opposed to LFTR development are likely those invested in upstream and downstream
activities of the uranium-‐plutonium fuel cycle. Fuel fabrication and enrichment facilities
will surely lobby against LFTRs as their services will no longer be needed at the scale they
are today.
61
Chapter 6 Conclusions and Recommendations
6.1 Conclusions
The previous chapters have shown that the thorium fuel cycle implemented using LFTR
technology has the potential to disrupt the nuclear and power sectors. In doing so, they can
provide clean, safe, reliable, and abundant electricity to the market for many years to come.
President Obama and his Administration have vowed to aggressively cut emissions over
the next couple decades, yet an expansion in fossil fuel derived electricity is increasing.
(The White House, 2014; EIA3, 2014) Development of LFTR technology presents the U.S.
with the opportunity to be a global role model for clean power generation. The following
chapter summarizes this paper’s findings and provides recommendations for future
stakeholders involved with thorium and LFTRs.
U.S. LFTR Fleet: Market Potential and New Scenarios
-‐ The estimated potential for LFTRs is approximately 51 b kWh of new capacity
added to the electricity grid between 2030 and 2050. This is roughly 6.5 GW of new
capacity using a capacity factor of 90%. This value represents the forecasted supply
under the Reference case assumptions in the AEO2014.
-‐ Nuclear After 2030: Approximately 854 b kWh are available for LFTR
development increasing the share of nuclear electricity to 28% by 2050. This
represents nearly 108 GW of new capacity using a capacity factor of 90%. This
scenario is dominated by an aggressive growth of LFTRs after 2030.
-‐ Accelerated Retirements: Between 1,192 and 1,790 b kWh are available for new
LFTR generated electricity. This represents between 151-‐227 GW of new capacity
using a capacity factor of 90%. In these scenarios, nuclear generation makes up a
third of the generation mix. New LFTRs offset the retirement of old coal and/or
nuclear power plants.
62
-‐ 50 by 50: Approximately 2,761 b kWh are available for LFTR generation. This
represents 350 GW of added capacity raising the share of nuclear generation to
50%. This scenario is representative of accelerated retirements of coal and nuclear,
with a decline in natural gas production as well.
Benefits of a LFTR Fleet in the U.S.
-‐ Decrease in emissions ranging between 364-‐1,560 million MT of CO2
equivalents, depending on which scenario is implemented. This reduction in
emissions could theoretically save between 35,000 and 215,000 lives that would
have otherwise died due to the exposure of emissions released from fossil fuels.
-‐ Between 372 and 17,875 tons of waste could be avoided by using LFTRs instead
of LWRs. Nuclear waste is expensive to store, hazardous to life environmental and
biological life systems, and presents a risk of proliferation. The waste is also less
toxic because LFTRs burn up more of the fission products in the fuel. Wastes from
LFTRs are safe to handle after 300 years compared to 100,000 to 1,000,000 years
for LWR spent fuel.
-‐ 0 meltdowns and safer operating facilities due to the fluid nature of LFTRs. Low
pressure systems mean there are no gas buildups leading to pressure explosions
like what happened in Fukushima. Inherent properties of the fuel prevent radiation
from escaping in a catastrophic event.
-‐ No need for fuel enrichment or fabrication saving $188 billion and $9 trillion
over the course of 20 years between 2030 and 2050. Further cost reductions come
from smaller components and eliminating the necessity of pressurized containment
vessels.
Challenges to LFTR Development
-‐ The development of a prototype is essential to the success of getting LFTRs into
the nuclear industry. Exhaustive testing and extensive research need to occur over
the next decade to work out any technical issues in the design. Issues with corrosion
63
and fuel reprocessing are focal points for research moving forward. The waste
benefits of the thorium fuel cycle can only be fully recognized when minimizing the
usage of the uranium-‐plutonium fuel cycle.
-‐ No existing regulations involving the use of fluid fuels presents a regulatory
challenge facing the industry. Many steps will need to be taken to train and educate
NRC staff on the thorium fuel cycle and LFTR processes.
-‐ Cheap natural gas and uranium fuel sustainability are barriers to entry for the
thorium fuel cycle. Without a working prototype investors and utilities have little
incentive to take on the financial burden of backing LFTR development.
6.2 Recommendations
6.2.1 Acquire Funds
There is roughly $30 billion dollars sitting in a Nuclear Waste Fund. (Ahlers, 2014) This
fund has been collecting taxes since 1982 to provide the development of repositories for
long-‐term nuclear waste storage. Furthermore, the funds can be used to establish a
program of research, development, and demonstration regarding the disposal of waste.
These funds should be reallocated to develop an R&D program centered around building a
prototype LFTR that operates on spent fuel. This would comply within the law’s
parameters. The interest collected on the fund is over a $1 billion a year, which is more
than enough to start an R&D program.
Federal loan guarantees also provide a means to acquiring funding. The DOE said they
would provide $12.6 billion in loan guarantees for the development of advanced reactors.
Funding aimed at developing a working prototype is the first step towards seeing a
commercial LFTR come to fruition.
64
6.2.2 Build Prototype and Small Test Reactor
In order to get the NRC and investors to buy into this technology, there needs to be a
working prototype. It is essential that every detail is meticulously examined and tested to
eliminate uncertainty and minimize risk. Once a prototype has been deemed a success, a
test reactor with a higher capacity should be constructed to show the commercial
application of a LFTR. These funds can come from private investment or the government
from either of the two options mentioned above.
6.2.3 Continued Research
A transition away from solid fuel means a whole new set of principles, regulations, and
policies for how to monitor and operate these systems. Heavy investment in training,
education and workforce development will be necessary once the LFTR gains traction.
Research on chemical processing techniques will be important for the LFTR system in
order to capitalize on utilizing the thorium fuel cycle. The U.S. should continue to invest in
R&D programs through national laboratories and university programs.
6.2.4 Carbon Tax
The U.S. government should impose a carbon tax on CO2 emissions. A carbon tax would
discourage the development of fossil fuel generation and incentivize nuclear and renewable
growth. A carbon tax that pays dividends to the public would further exacerbate the
transition away from fossil fuels. A carbon tax with a dividend would put the power of
choice into the public’s hands and deter the government from picking sides on where to
spend the tax money. People that have no regard for emissions will get taxed more, and
those that have low emissions will earn money. This should trickle down into other
industries dependent on energy production such as businesses and industrial operations
pushing society as a whole to be carbon neutral. A carbon tax of this sort would shift
priorities for energy investors and drive the change needed to develop out a LFTR fleet in
the U.S.
65
6.2.5 Waste Disposal Policy
Policies regarding waste will have to be reexamined and reinvented. Using liquid fuel is
surely to have different effects that solid fuel for waste disposal. If LFTRs are to begin their
cycle on spent fuel, then new policies regarding the handling and transportation of these
materials is essential.
The U.S. government could also increase the fee enforced in the Nuclear Waste Disposal
Act. Ideally, energy production from all forms should be waste free. Ramping up the waste
fee would help push the R&D for reactors that both create less waste or have means of
depleting the current waste stockpiles; LFTRs do both.
66
Chapter 7 Literature Cited
Ahlers, M. M. (2014). Hot nuclear waste, cold hard cash, and you. CNN. Retrieved December 01, 2014, from
http://www.cnn.com/2014/05/16/us/nuclear-‐waste-‐money/ Alvin Weinberg Foundation. (2014). Nuclear Energy, Molten Salt Reactors & Thorium, (June), 1–8. Andreev, L. (2013). Certain issues of economic prospects of thorium-‐based nuclear energy systems (p. 23). Ashley, S. F. (2012). Thorium fuel has risks. Nature, 492, 31–33. Association, W. N. (2014). The Nuclear Fuel Cycle. Retrieved October 13, 2014, from http://www.world-‐
nuclear.org/info/Nuclear-‐Fuel-‐Cycle/Introduction/Nuclear-‐Fuel-‐Cycle-‐Overview/ Barrett, K., Bragg-‐Sitton, S., & Galicki, D. (2012). Advanced LWR Nuclear Fuel Cladding System Development
Trade-‐off Study (p. 34). Blandford, Edward D., and May, Michael M. (2012). Lessons Learned from “Lessons Learned”: The Evolution of
Nuclear Power Safety after Accidents and Near-‐Accidents. Cambridge, Mass.: American Academy of Arts and Sciences.
Caiazzo, F., Ashok, A., Waitz, I. a., Yim, S. H. L., & Barrett, S. R. H. (2013). Air pollution and early deaths in the
United States. Part I: Quantifying the impact of major sectors in 2005. Atmospheric Environment, 79, 198–208.
Chen, S. (2014). Chinese scientists urged to develop new thorium reactors by 2024. South China Morning Post.
Retrieved November 18, 2014, from http://www.scmp.com/news/china/article/1452011/chinese-‐scientists-‐urged-‐develop-‐new-‐thorium-‐nuclear-‐reactors-‐2024?page=all
University of Chicago. (2004). The Economic Future of Nuclear Power (p. 38). Christiansen, D. (2014). From Three Mile Island to Fukushima Daiichi. IEEE Spectrum, 8–12. Conca, J. (2012). How Deadly is Your Kilowatt? Forbes. Retrieved November 01, 2014, from
http://www.forbes.com/sites/jamesconca/2012/06/10/energys-‐deathprint-‐a-‐price-‐always-‐paid/ Cooper, N., Minakata, D., Begovic, M., & Crittenden, J. (2011). Should we consider using liquid fluoride thorium
reactors for power generation? Environmental Science & Technology, 45(15), 6237–8. Csereklyei, Z. (2014). Measuring the impact of nuclear accidents on energy policy. Ecological Economics, 99,
121–129. Department of Energy (DOE). (2002) Nuclear Energy Research Advisory Committee and the Generation IV
International Forum, A technology roadmap for generation IV nuclear energy systems. Department of Energy (DOE). (2010). Nuclear Energy Research and Development Roadmap (p. 48). Department of Energy (DOE). (2014). Nuclear Waste Policy Act. Retrieved December 01, 2014, from
http://energy.gov/downloads/nuclear-‐waste-‐policy-‐act
67
Energy Information Administration (EIA1). (2011) Nuclear power plants undergo seasonal scheduled outages. Today in Energy. Retrieved November 04, 2014, from http://www.eia.gov/todayinenergy/detail.cfm?id=1490
Energy Information Administration (EIA2). (2011). Nuclear Reactor Operational Status Tables. Retrieved
November 21, 2014, from http://www.eia.gov/nuclear/reactors/stats_table3.html Energy Information Administration (EIA). (2013). Form EIA-‐860, Annual Electric Generator Report. Energy Information Administration (EIA1). (2014). Nuclear Regulatory Commission resumes license renewals
for nuclear power plants. Today in Energy. Retrieved November 01, 2014, from http://www.eia.gov/todayinenergy/detail.cfm?id=18591#
Energy Information Administration (EIA2). (2014). Levelized Cost and Levelized Avoided Cost of New
Generation Resources in the Annual Energy Outlook 2014 (p. 12). Energy Information Administration (EIA3). (2014). Annual Energy Outlook 2014 with projections to 2040 (p.
269). Energy Information Administration (EIA4). (2014). Form EIA-‐923, Power Plant Operations Report. Endicott, N. (2013). Thorium-‐Fuelled Molten Salt Reactors (p. 23). Eom, T.Y., Do, J.B., Choi, Y.B., Park, K.K. & Choi, I.K. (1998) Thorium fuel cycle concept for KAERI’s accelerator
driven system project. In Thorium fuel utilization: Options and trends, IAEA. (pp. 54-‐59). Environmental Protection Agency (EPA1). (2011). Proposed Revisions to the Secondary National Ambient Air
Quality Standards for Oxides of Nitrogen and Sulfur (pp. 1–5). Environmental Protection Agency (EPA2). (2011). The Benefits and Costs of the Clean Air Act from 1990 to
2020 (p. 238). Environmental Protection Agency (EPA). (2014). Greenhouse Gas Emissions. Retrieved November 29, 2014,
from http://www.epa.gov/climatechange/ghgemissions/ European Commission. (2004). Externalities of Energy (p. 270). Luxembourg. Fairlie, I., & Sumner, D. (2006). The Other Report on Chernobyl (p. 91). Fetter, S. (2009). How long will the world’s uranium supplies last? Scientific American. Retrieved November
05, 2014, from http://www.scientificamerican.com/article/how-‐long-‐will-‐global-‐uranium-‐deposits-‐last/
Flibe. (2013). Notice of Intent to Submit License Application for a Liquid-‐Fluoride Reactor and Mo-‐99
Production Facility (p. 2). Furukawa, K., Simoneko, V., Mitachi, K., Furuhashi, A., Yoshioka, R., Chigrinov, S., Lecocq, A., & Kato, Y. (1997).
Thorium cycle implementation through plutonium incineration by thorium molten-‐salt nuclear energy synergetics. In Thorium fuel utilization: Options and trends, IAEA. (pp. 123-‐138).
Gosling, F.G. (2010). The Manhattan Project: Making the Atomic Bomb. Washington, D.C., Department of
Energy. Greaves, E. D., Furukawa, K., Sajo-‐Bohus, L., & Barros, H. (2012). The case for the thorium molten salt reactor
(Vol. 460, pp. 453–460).
68
Hammond, C. R. (2000). The Elements, in Handbook of Chemistry and Physics 81st edition. CRC press. Hargraves, R., & Moir, R. (2010). Liquid Fluoride Thorium Reactors. American Scientist, 304–313. Hargraves, R., & Moir, R. (2011). Liquid Fuel Nuclear Reactors. APS Physics. Retrieved December 02, 2014,
from http://www.aps.org/units/fps/newsletters/201101/hargraves.cfm Holt, M., Campbell, R. J., & Nikitin, M. B. (2012). Fukushima Nuclear Disaster (p. 12). Washington D.C. House, T. W. (2014). U.S.-‐China Joint Announcement on Climate Change and Clean Energy Cooperation.
Retrieved December 02, 2014, from http://www.whitehouse.gov/the-‐press-‐office/2014/11/11/fact-‐sheet-‐us-‐china-‐joint-‐announcement-‐climate-‐change-‐and-‐clean-‐energy-‐c
International Atomic Energy Agency (IAEA). (2002). Thorium fuel utilization: Options and trends (pp. 176–
182). International Atomic Energy Agency (IAEA). (2005). Thorium fuel cycle — Potential benefits and challenges (p.
113). Vienna, Austria. International Atomic Energy Agency (IAEA). (2008). Severe Accident Management Programmes for Nuclear
Power Plants: Safety Guide No. NS–G–2.15. International Atomic Energy Agency. International Atomic Energy Agency (IAEA). (2012). Role of Thorium to Supplement Fuel Cycles of Future
Nuclear Energy Systems (p. 157). International Atomic Energy Agency (IAEA1). (2014). Operational & Long-‐Term Shutdown Reactors.
Retrieved October 25, 2014, from http://www.iaea.org/PRIS/WorldStatistics/OperationalReactorsByCountry.aspx
International Atomic Energy Agency (IAEA2). (2014). Under Construction Reactors. Retrieved October 25,
2014, from http://www.iaea.org/PRIS/WorldStatistics/UnderConstructionReactorsByCountry.aspx International Atomic Energy Agency (IAEA3). (2014). United States of America. Retrieved October 25, 2014,
from http://www.iaea.org/PRIS/CountryStatistics/CountryDetails.aspx?current=US International Energy Agency (IEA). (2012). World Energy Outlook 2012 (p. 668). Intergovernmental Panel on Climate Change (IPCC). (2012). Renewable Energy Sources and Climate Change
Mitigation: Special Report of the Intergovernmental Panel on Climate Change (p. 1076). Jagannathan, V. (1997) Thorium pre-‐breeder/breeder route to widen the nuclear material base for
generation of electric power. In Thorium fuel utilization: Options and trends, IAEA. (pp. 176–182). Kamei, T., & Hakami, S. (2011). Evaluation of implementation of thorium fuel cycle with LWR and MSR.
Progress in Nuclear Energy, 53(7), 820–824. Kelly-‐Dewwiler, P. (2014). Molten Salt Nuclear Reactors: Part Of America’s Long-‐Term Energy Future? Forbes.
Retrieved December 04, 2013, from http://www.forbes.com/sites/peterdetwiler/2014/09/22/molten-‐salt-‐nuclear-‐reactors-‐part-‐of-‐americas-‐long-‐termenergy-‐future/2/
LeBlanc, D. (20101). Molten salt reactors: A new beginning for an old idea. Nuclear Engineering and Design,
240(6), 1644–1656.
69
Leblanc, D. (20102). Too Good to Leave the shelf. Mechanical Engineering, 29–33. McLellan, D. (2008). The Economics of Nuclear Power: Current Debates and Issues for Future Consideration (p.
19). Waterloo, Ontario. MIT. (2011). The Future of the Nuclear Fuel Cycle (p. 237). Moomaw, W., P. Burgherr, G. Heath, M. Lenzen, J. Nyboer, A. Verbruggen. (2011). Annex II: Methodology. In
IPCC Special Report on Renewable Energy Sources and Climate Change Mitigation [O. Edenhofer, R. Pichs-‐Madruga, Y. Sokona, K. Seyboth, P. Matschoss, S. Kadner, T. Zwickel, P. Eickemeier, G. Hansen, S. Schlömer, C. von Stechow (eds)], Cambridge University Press, Cambridge, United Kingdom and New York, NY, USA.
Nuclear Energy Agency & International Atomic Energy Agency (NEA & IAEA). (2014). Uranium 2014:
Resources, Production and Demand (p. 504). Nuclear Energy Institute (NEI1). (2014). Costs: Fuel, Operation, Waste Disposal & Life Cycle. Retrieved
November 16, 2014, from http://www.nei.org/Knowledge-‐Center/Nuclear-‐Statistics/Costs-‐Fuel,-‐Operation,-‐Waste-‐Disposal-‐Life-‐Cycle
Nuclear Energy Institute (NEI2). (2014). On-‐site Storage of Nuclear Waste. Retrieved December 03, 2014,
from http://www.nei.org/Knowledge-‐Center/Nuclear-‐Statistics/On-‐Site-‐Storage-‐of-‐Nuclear-‐Waste Nuclear Energy Institute (NEI3). (2014). Preventing the Proliferation of Nuclear Materials (p. 3). Nuclear Energy Institute (NEI4). (2014). US Nuclear Power Plants. Retrieved October 25, 2014, from
http://www.nei.org/Knowledge-‐Center/Nuclear-‐Statistics/US-‐Nuclear-‐Power-‐Plants Nelson, A. T. (2012). Thorium: Not a near-‐term commercial nuclear fuel. Bulletin of the Atomic Scientists,
68(5), 33–44. National Nuclear Laboratory (NNL). (2010). The Thorium Fuel Cycle (p. 8). National Nuclear Laboratory (NNL). (2012). Comparison of thorium and uranium fuel cycles (p. 31). Nuclear Regulatory Commission (NRC). (2013). Backgrounder on the Three Mile Island Accident. Retrieved
November 03, 2014, from http://www.nrc.gov/reading-‐rm/doc-‐collections/fact-‐sheets/3mile-‐isle.html
Nuclear Regulatory Commission (NRC1). (2014). Glossary. Retrieved November 14, 2014, from
http://www.nrc.gov/reading-‐rm/basic-‐ref/glossary.html Nuclear Regulatory Commission (NRC2). (2014). High-‐Level Waste. Retrieved December 03, 2014, from
http://www.nrc.gov/waste/high-‐level-‐waste.html Nuclear Regulatory Commission (NRC3). (2014). Stages of the Nuclear Fuel Cycle. Retrieved October 07, 2014,
from http://www.nrc.gov/materials/fuel-‐cycle-‐fac/stages-‐fuel-‐cycle.html Roesler, A. (2009). Lessons from Three Mile Island: The Design of Interactions in a High-‐stakes Environment (pp.
170–195). Romley, J. A., Hackbarth, A., & Goldman, D. P. (2010). The Impact of Air Quality on Hospital Spending (p. 78). Schaffer, M. B. (2011). Toward a viable nuclear waste disposal program. Energy Policy, 39(3), 1382–1388.
70
Schaffer, M. B. (2013). Abundant thorium as an alternative nuclear fuel. Energy Policy, 60, 4–12. Seaborg, G. T. (1976). Early History of Heavy Isotope Research at Berkeley, August 1940 to April 1942.
Lawrence Berkeley Laboratory. Sorensen, Kirk F. (2014). Thorium Research in the Manhattan Project Era. Master's Thesis, University of
Tennessee. Steinhauser, G., Brandl, A., & Johnson, T. E. (2014). Comparison of the Chernobyl and Fukushima nuclear
accidents: a review of the environmental impacts. The Science of the Total Environment, 470-‐471, 800–817.
Sustainable Nuclear Energy Technology Platform. (2012). Molten Salt Reactor Systems (p. 10). TEPCO1. (2011). Occurrence of a Specific Incident Stipulated in Article 10, Clause 1 of the Act on Special
Measures Concerning Nuclear Emergency Preparedness (Fukushima Daiichi). Retrieved November 12, 2014, from http://www.tepco.co.jp/en/press/corp-‐com/release/11031102-‐e.html
TEPCO2. (2011). Occurrence of a Specific Incident Stipulated in Article 15, Clause 1 of the Act on Special
Measures Concerning Nuclear Emergency Preparedness (Fukushima Daiichi). Retrieved November 12, 2014, from TEPCO. (2011). Occurrence of a Specific Incident Stipulated in Article 10, Clause 1 of the Act on Special Measures Concerning Nuclear Emergency Preparedness (Fukushima Daiichi). Retrieved November 12, 2014, from http://www.tepco.co.jp/en/press/corp-‐com/release/11031102-‐e.html
Transatomic Power. (2014). Transatomic Power (p. 33). United Nations Scientific Committee on the Effects of Atomic Radiation (UNSCEAR). (2008). Sources and
Effects of Ionizing Radiation (Vol. II, p. 219). New York, NY. United Nations Scientific Committee on the Effects of Atomic Radiation (UNSCEAR). (2013). UNSCEAR : The
Fukushima accident (p. 5). Vienna, Austria. Voosen, P. (2009). How Long Can a Nuclear Reactor Last? Scientific American. Retrieved November 02, 2014,
from http://www.scientificamerican.com/article/nuclear-‐power-‐plant-‐aging-‐reactor-‐replacement-‐/ Wilson, P.D. & Ainsworth, K.F. (1997). Potential advantages and drawbacks of the thorium fuel cycle in
relation to current practice: A BNFL view. In Thorium fuel utilization: Options and trends, IAEA. (pp. 305-‐315).
World Nuclear Association (WNA). (2014). No Nuclear Power in the USA. Retrieved October 25, 2014, from
http://www.world-‐nuclear.org/info/Country-‐Profiles/Countries-‐T-‐Z/USA-‐-‐Nuclear-‐Power/ Zou, X., & Barnett, J. (2014). The Potential of Thorium for Safer, Cleaner and Cheaper Energy. National Center
for Policy Analysis, (149), 4.