Embed Size (px)
Citation preview
Does the U.S. Midwest Have a Cost Advantage Over China in Producing Corn, Soybeans, and Hogs?
Cheng Fang and Jay Fabiosa
MATRIC Research Paper 02-MRP 4 August 2002
Midwest Agribusiness Trade Research and Information Center Iowa State University
Ames, Iowa 50011-1070 www.matric.iastate.edu
Cheng Fang is an assistant scientist and Jacinto Fabiosa is a scientist at the Center for Agricultural and Rural Development, Iowa State University. This publication is available online at www.card.iastate.edu. Permission is granted to reproduce this information with appropriate attribution to the authors and to MATRIC at Iowa State University. MATRIC is supported by the Cooperative State Research, Education, and Extension Service, U.S. Department of Agriculture, under Agreement No. 92-34285-7175. Any opinions, findings, conclusions, or recommendations expressed in this publication are those of the authors and do not necessarily reflect the view of the U.S. Department of Agriculture. Iowa State University does not discriminate on the basis of race, color, age, religion, national origin, sexual orientation, sex, marital status, disability, or status as a U.S. Vietnam Era Veteran. Any persons having inquiries concerning this may contact the Office of Equal Opportunity and Diversity, 1031 Wallace Road Office Building, Room 101, 515-294-7612.

Abstract
China’s accession to the World Trade Organization, a significant event for U.S.
agricultural trade, has been viewed as benefitting U.S. farmers, especially midwestern
farmers. This research compares the productivity and cost of production (COP) of China
and the United States in producing corn, soybeans, and hogs. The results show that the
U.S. Midwest (defined in this study as the Heartland region as classified by the U.S.
Department of Agriculture’s Economic Research Service) has a substantial advantage in
land and labor productivities in producing corn and soybeans, especially compared to
China’s South and West producing regions. However, China’s Northeast region, a major
corn- and soybean-producing area, has a very competitive COP over the U.S. Midwest. In
hog production, the U.S. Midwest has a cost advantage over China in feed cost and labor
productivity (there is little difference in fine feed usage), but this advantage is more than
offset by the lower cost of feeder pigs and low capital replacement cost in China. Land
policy in both the United States and China is a key determinant of COP. In addition, labor
productivity and related policies in China are driving forces for China’s competitive
position.
Key words: agricultural trade, competitiveness, corn, cost of production, exchange rate,
hogs, land policy, productivity, soybeans, U.S. Midwest versus China.

DOES THE U.S. MIDWEST HAVE A COST ADVANTAGE OVER CHINA IN PRODUCING CORN, SOYBEANS, AND HOGS?
Introduction
China’s economy has been growing rapidly since the implementation of economic
reforms at the end of the 1970s. This rapid income growth is changing China’s food
consumption patterns, especially its animal protein consumption. Over the last 15 years,
per capita meat consumption (red meat and poultry) in China has increased 166 percent,
or an average of 7.2 percent annually. Economic reforms also have led to incentives to
develop specialized livestock production systems that are moving the production
structure toward larger and more intensive management systems.
Both China and the United States are large producers of pork, corn, and soybeans in
international agricultural markets. In 2000, China produced over 47 percent of the
world’s pork and the United States produced 40 percent of the world’s corn and 45
percent of soybeans. China has become a major player in world trade and has strong
potential to influence world prices because of the size of its production sector. In 2000,
China exported 10.47 million metric tons (mmt) of corn but imported 10.42 mmt of
soybeans. Agriculture is one of the few sectors in which the United States has a trade
surplus with China. From 1995 to 2000, the agricultural trade surplus averaged about
$350 million annually. In 2000, China imported around $1 billion of soybeans and
soybean products from the United States, accounting for 58 percent of total U.S.
agricultural exports to China.
After 15 years of negotiations, China finally joined the World Trade Organization
(WTO) in December 2001. China’s inclusion in the WTO, a significant trade issue for
U.S. agriculture, is viewed as benefitting U.S. farmers. China promised to cut the
currently prevailing average tariff rates from 22 percent to 17.5 percent for agricultural
products. For certain agricultural products that are deemed important to the United States,
such as animal products, fruits, and dairy products, the average tariff will fall from 31 to
2 / Fang and Fabiosa
14 percent. For bulk agricultural commodities, such as corn, wheat, and soybean oil,
China has agreed to expand market access through tariff rate quotas. In addition, China
must curtail export subsidies after WTO accession. The corn export subsidy in 2001 was
as high as 418 yuan per metric ton.
Many observers see China as a huge potential market for U.S. products (Hayes and
Clemens; Fuller et al.; Qin and Amponsah). However, experts disagree on the extent and
composition of U.S. agricultural and food trade with China. The United States’s
competitiveness in agricultural and value-added products in China depends on many
factors, but the difference in cost of production (COP) and productivity are the most
important factors.
The objectives of this research are to examine the competitive structures of China
and the United States, emphasizing productivity and COP for corn, soybeans, and
hogs. This research provides regional comparisons in China and the U.S. Midwest.
Three types of hog production systems in China are analyzed. We use COP data from
1996 to 2000 to avoid the variability of productivity and derived COP units. We begin
with a description of research methods and data issues.
Research Methods and Data
Production competitiveness has become a popular area of concern as policymakers
seek to monitor sectoral economic health, evaluate the consequences of free trade
agreements, and assess the impacts of agricultural and tax policies. COP studies have long
been familiar tools in the study of inter- or cross-country agricultural commodity
competitiveness (Barkema, Drabenstott, and Tweeten; Glaze and Schoney; Le Stum and
Camaret; Ortman, Stulp, and Rask; Sharples; Stanton).
There is a no definition of competitiveness in economic theory. However, it is
becoming conventional for economists and policymakers to perceive competitiveness as
the result of the combined effect of market distortions and comparative advantage
(Sharples). Comparative advantage is useful to analyze the optimal welfare and
competitiveness under perfect competitive markets. Comparative advantage is a measure
of competitiveness in an undistorted world. Comparative advantage is not observable. In
order to calculate comparative advantage, all market distortions must be removed. Market
Does the U.S. Midwest Have a Cost Advantage Over China in Producing Corn, Soybeans, and Hogs? / 3
distortions include distortions resulting from policy and distortions resulting from
imperfect competition.
Since international agricultural markets are far from being undistorted, the cost and
production relationships underlying comparative advantage can provide limited
information on a country’s competitive position. A country can increase its
competitiveness in the international market by changing its agricultural policies or by
other factors, such as increasing efficiency, lowering taxes or raising subsidies on crop
production and marketing, and depreciating the home currency. An examination of these
policy changes can help to explain changes in past and current competitiveness and to
analyze the impact of removing the distortions in the future.
This study compares productivity and COP by using the actual observed data. The
results provide information on the competitiveness of the two countries in corn, soybeans,
and hog production under current policy regimes. We compare competitiveness assuming
that two major distorted factors are removed. One factor is U.S. land cost; the other is the
exchange rate between the Chinese yuan and the U.S. dollar.
The U.S. Department of Agriculture (USDA) COP estimates do not include effects
of government programs, and all are in actual terms. Land cost in the United States is
artificially high, with government support capitalized into higher land values (see Schertz
and Johnston and Jolly and Lence). A recent study by Beghin, Roland-Holst, and van der
Mensbrugghe shows that land rent would be reduced by 43 percent if U.S. government
farm policy were removed.
Costs in Chinese renmingbi (RMB) (or yuan) terms are converted into U.S. dollars
by China’s official exchange rate. The official exchange rate has been distorted in the last
several years (Fang and Beghin). In this study, we conduct a scenario analysis on the
impact of the exchange rate. We derive the shadow nominal exchange rate based on the
real effective exchange rate series from 1995 to 2000 from The World Bank (2000 and
2001). The estimated shadow nominal exchange rates are 8.97 RMB/U.S.$ for 1996, 9.37
RMB/U.S.$ for 1997, 9.38 RMB/U.S.$ for 1998, 8.93 RMB/U.S.$ for 1999, and 8.96
RMB/U.S.$ for 2000.
In addition to the comparisons of total COP, we compare the major components of
cost. A comparison of major factors in the COP in the two countries indicates the net
4 / Fang and Fabiosa
effect on input use and factor payments of the existing forces shaping competitiveness in
each country. The comparison provides the sources of the difference in the COP and
possible impacts from each factor in the future.
The major data for China’s COP are 1996 to 2000 farm household survey data. The
survey is conducted by China’s Price Bureau in cooperation with the Ministry of
Agriculture, Ministry of Forestry, Ministry of Domestic Trade, China Silk Import and
Export General Company, China Federation of Supply and Marketing Cooperatives,
China’s Tobacco Administration Bureau, China’s Chinese Medicine Administration
Bureau, and China’s Light Industry General Committee. The survey, conducted each
year, has been carried out for decades. The number of households in the survey varies
across agricultural activities, according to the relative importance of each activity. In the
2000 survey, there are 3,843 households for corn, 1,045 households for soybeans, 2,255
households for backyard hog production, 665 households for specialized producers, and
142 households for large-scale practice. Part of the data is available in China’s Rural
Statistical Yearbook (China’s National Statistical Bureau). The output data for corn,
soybeans, and hogs in China are obtained from China’s Statistical Yearbook.
The U.S. COP data are obtained from the USDA. The USDA collects data on
production technology every four to five years and updates quantities of output and prices
of inputs every year. Commodity-specific surveys as part of the annual Agricultural
Resource Management Study have been used to collect the data since 1996. The
production technology underlying the estimates for 1996 to 2000 reported here are based
on the 1996 version of the Farm Costs and Returns Survey for corn, the 1997 version for
soybeans, and the 1992 and 1998 versions for hogs. These survey years are normal years
in production conditions.
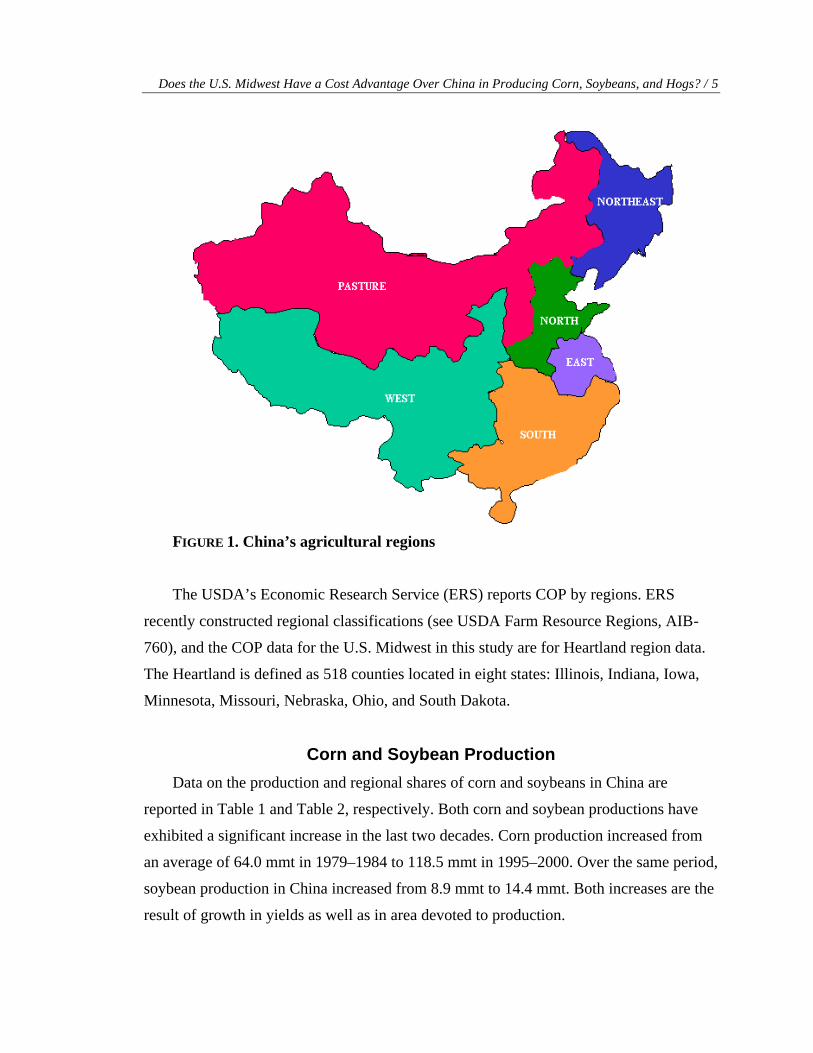
China is disaggregated into six regions, as shown in Figure 1: Northeast (Liaoning,
Jilin, and Heilongjiang provinces), North (Beijing, Tianjin, Hebei, Shandong, and Henan
provinces), South (Zhejiang, Fujian, Jiangxi, Hubei, Hunan, Guangdong, Guangxi, and
Hainan provinces), West (Sichuan, Guizhou, Yunnan, Xizang, and Shaanxi provinces),
and Pastoral (Shanxi, Nei Monggol, Gansu, Ningxia, and Xinjiang provinces).
Does the U.S. Midwest Have a Cost Advantage Over China in Producing Corn, Soybeans, and Hogs? / 5
FIGURE 1. China’s agricultural regions
The USDA’s Economic Research Service (ERS) reports COP by regions. ERS
recently constructed regional classifications (see USDA Farm Resource Regions, AIB-
760), and the COP data for the U.S. Midwest in this study are for Heartland region data.
The Heartland is defined as 518 counties located in eight states: Illinois, Indiana, Iowa,
Minnesota, Missouri, Nebraska, Ohio, and South Dakota.
Corn and Soybean Production
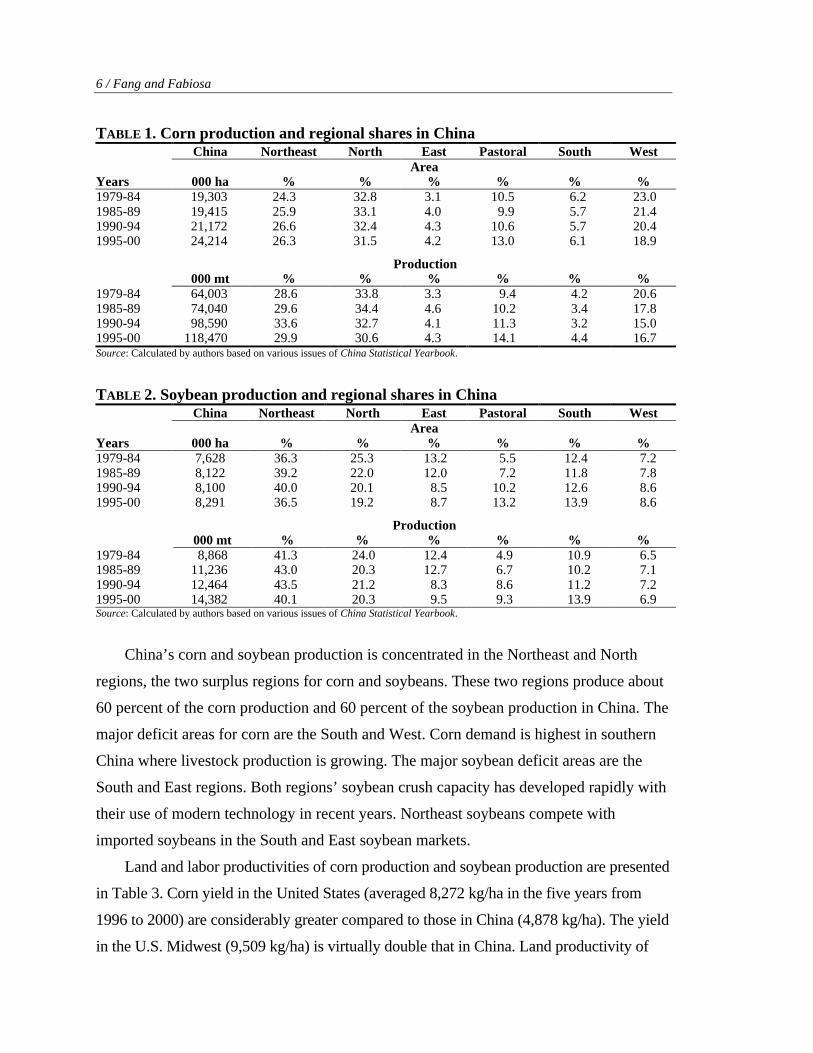
Data on the production and regional shares of corn and soybeans in China are
reported in Table 1 and Table 2, respectively. Both corn and soybean productions have
exhibited a significant increase in the last two decades. Corn production increased from
an average of 64.0 mmt in 1979–1984 to 118.5 mmt in 1995–2000. Over the same period,
soybean production in China increased from 8.9 mmt to 14.4 mmt. Both increases are the
result of growth in yields as well as in area devoted to production.
6 / Fang and Fabiosa
TABLE 1. Corn production and regional shares in China China Northeast North East Pastoral South West
Area Years 000 ha % % % % % % 1979-84 19,303 24.3 32.8 3.1 10.5 6.2 23.0 1985-89 19,415 25.9 33.1 4.0 9.9 5.7 21.4 1990-94 21,172 26.6 32.4 4.3 10.6 5.7 20.4 1995-00 24,214 26.3 31.5 4.2 13.0 6.1 18.9
Production
000 mt % % % % % % 1979-84 64,003 28.6 33.8 3.3 9.4 4.2 20.6 1985-89 74,040 29.6 34.4 4.6 10.2 3.4 17.8 1990-94 98,590 33.6 32.7 4.1 11.3 3.2 15.0 1995-00 118,470 29.9 30.6 4.3 14.1 4.4 16.7 Source: Calculated by authors based on various issues of China Statistical Yearbook.
TABLE 2. Soybean production and regional shares in China China Northeast North East Pastoral South West
Area Years 000 ha % % % % % % 1979-84 7,628 36.3 25.3 13.2 5.5 12.4 7.2 1985-89 8,122 39.2 22.0 12.0 7.2 11.8 7.8 1990-94 8,100 40.0 20.1 8.5 10.2 12.6 8.6 1995-00 8,291 36.5 19.2 8.7 13.2 13.9 8.6
Production
000 mt % % % % % % 1979-84 8,868 41.3 24.0 12.4 4.9 10.9 6.5 1985-89 11,236 43.0 20.3 12.7 6.7 10.2 7.1 1990-94 12,464 43.5 21.2 8.3 8.6 11.2 7.2 1995-00 14,382 40.1 20.3 9.5 9.3 13.9 6.9 Source: Calculated by authors based on various issues of China Statistical Yearbook.
China’s corn and soybean production is concentrated in the Northeast and North
regions, the two surplus regions for corn and soybeans. These two regions produce about
60 percent of the corn production and 60 percent of the soybean production in China. The
major deficit areas for corn are the South and West. Corn demand is highest in southern
China where livestock production is growing. The major soybean deficit areas are the
South and East regions. Both regions’ soybean crush capacity has developed rapidly with
their use of modern technology in recent years. Northeast soybeans compete with
imported soybeans in the South and East soybean markets.
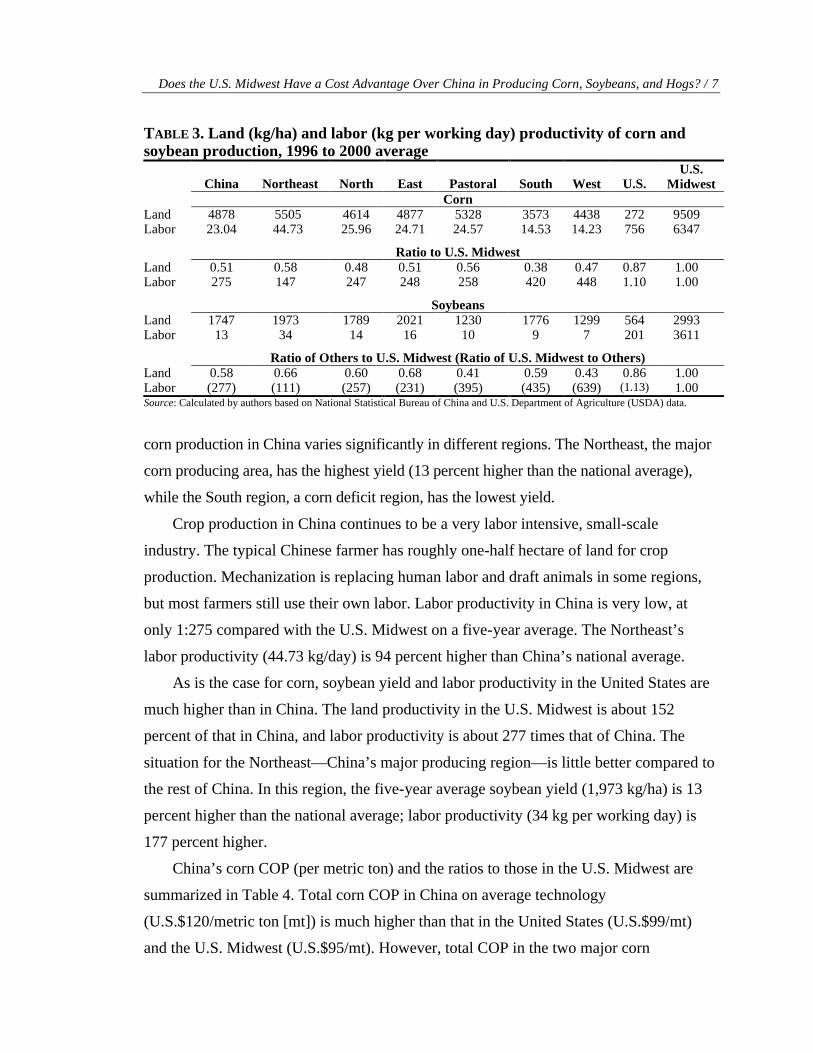
Land and labor productivities of corn production and soybean production are presented
in Table 3. Corn yield in the United States (averaged 8,272 kg/ha in the five years from
1996 to 2000) are considerably greater compared to those in China (4,878 kg/ha). The yield
in the U.S. Midwest (9,509 kg/ha) is virtually double that in China. Land productivity of
Does the U.S. Midwest Have a Cost Advantage Over China in Producing Corn, Soybeans, and Hogs? / 7
TABLE 3. Land (kg/ha) and labor (kg per working day) productivity of corn and soybean production, 1996 to 2000 average
China Northeast North East Pastoral South West U.S. U.S.
Midwest Corn
Land 4878 5505 4614 4877 5328 3573 4438 272 9509 Labor 23.04 44.73 25.96 24.71 24.57 14.53 14.23 756 6347
Ratio to U.S. Midwest
Land 0.51 0.58 0.48 0.51 0.56 0.38 0.47 0.87 1.00 Labor 275 147 247 248 258 420 448 1.10 1.00
Soybeans
Land 1747 1973 1789 2021 1230 1776 1299 564 2993 Labor 13 34 14 16 10 9 7 201 3611
Ratio of Others to U.S. Midwest (Ratio of U.S. Midwest to Others) Land 0.58 0.66 0.60 0.68 0.41 0.59 0.43 0.86 1.00 Labor (277) (111) (257) (231) (395) (435) (639) (1.13) 1.00 Source: Calculated by authors based on National Statistical Bureau of China and U.S. Department of Agriculture (USDA) data.
corn production in China varies significantly in different regions. The Northeast, the major
corn producing area, has the highest yield (13 percent higher than the national average),
while the South region, a corn deficit region, has the lowest yield.
Crop production in China continues to be a very labor intensive, small-scale
industry. The typical Chinese farmer has roughly one-half hectare of land for crop
production. Mechanization is replacing human labor and draft animals in some regions,
but most farmers still use their own labor. Labor productivity in China is very low, at
only 1:275 compared with the U.S. Midwest on a five-year average. The Northeast’s
labor productivity (44.73 kg/day) is 94 percent higher than China’s national average.
As is the case for corn, soybean yield and labor productivity in the United States are
much higher than in China. The land productivity in the U.S. Midwest is about 152
percent of that in China, and labor productivity is about 277 times that of China. The
situation for the Northeast—China’s major producing region—is little better compared to
the rest of China. In this region, the five-year average soybean yield (1,973 kg/ha) is 13
percent higher than the national average; labor productivity (34 kg per working day) is
177 percent higher.
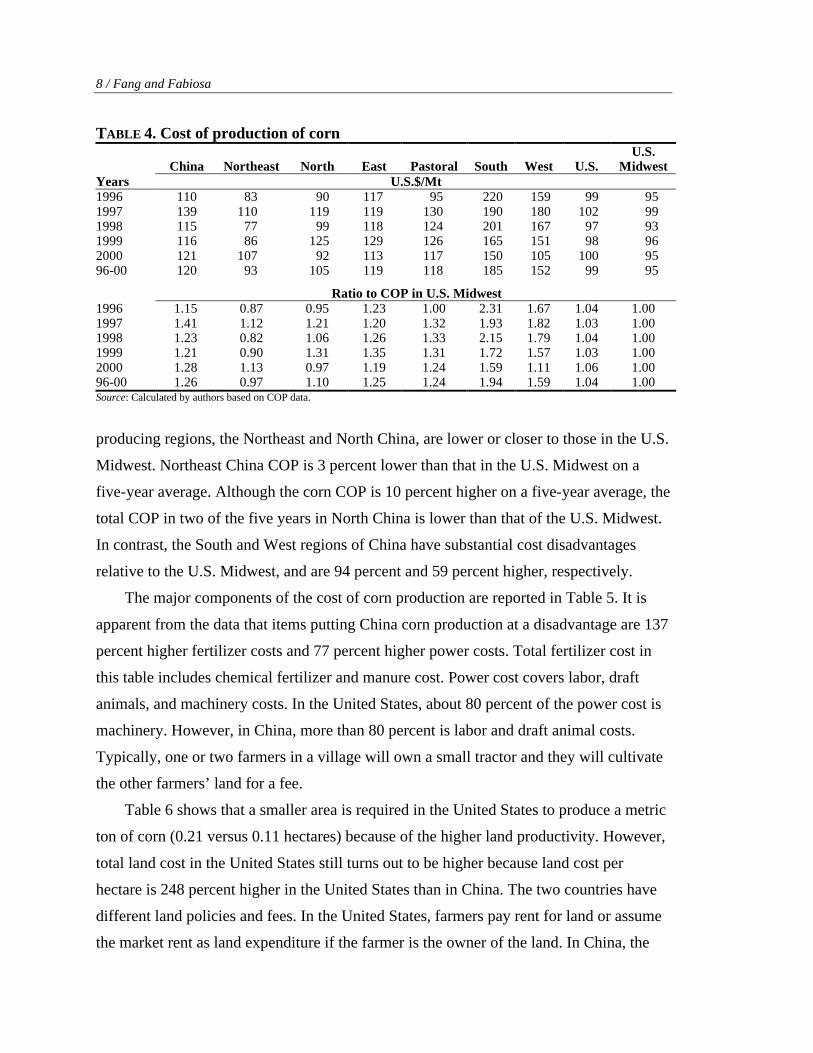
China’s corn COP (per metric ton) and the ratios to those in the U.S. Midwest are
summarized in Table 4. Total corn COP in China on average technology
(U.S.$120/metric ton [mt]) is much higher than that in the United States (U.S.$99/mt)
and the U.S. Midwest (U.S.$95/mt). However, total COP in the two major corn
8 / Fang and Fabiosa
TABLE 4. Cost of production of corn
China Northeast North East Pastoral South West U.S. U.S.
Midwest Years U.S.$/Mt 1996 110 83 90 117 95 220 159 99 95 1997 139 110 119 119 130 190 180 102 99 1998 115 77 99 118 124 201 167 97 93 1999 116 86 125 129 126 165 151 98 96 2000 121 107 92 113 117 150 105 100 95 96-00 120 93 105 119 118 185 152 99 95
Ratio to COP in U.S. Midwest 1996 1.15 0.87 0.95 1.23 1.00 2.31 1.67 1.04 1.00 1997 1.41 1.12 1.21 1.20 1.32 1.93 1.82 1.03 1.00 1998 1.23 0.82 1.06 1.26 1.33 2.15 1.79 1.04 1.00 1999 1.21 0.90 1.31 1.35 1.31 1.72 1.57 1.03 1.00 2000 1.28 1.13 0.97 1.19 1.24 1.59 1.11 1.06 1.00 96-00 1.26 0.97 1.10 1.25 1.24 1.94 1.59 1.04 1.00 Source: Calculated by authors based on COP data.
producing regions, the Northeast and North China, are lower or closer to those in the U.S.
Midwest. Northeast China COP is 3 percent lower than that in the U.S. Midwest on a
five-year average. Although the corn COP is 10 percent higher on a five-year average, the
total COP in two of the five years in North China is lower than that of the U.S. Midwest.
In contrast, the South and West regions of China have substantial cost disadvantages
relative to the U.S. Midwest, and are 94 percent and 59 percent higher, respectively.
The major components of the cost of corn production are reported in Table 5. It is
apparent from the data that items putting China corn production at a disadvantage are 137
percent higher fertilizer costs and 77 percent higher power costs. Total fertilizer cost in
this table includes chemical fertilizer and manure cost. Power cost covers labor, draft
animals, and machinery costs. In the United States, about 80 percent of the power cost is
machinery. However, in China, more than 80 percent is labor and draft animal costs.
Typically, one or two farmers in a village will own a small tractor and they will cultivate
the other farmers’ land for a fee.
Table 6 shows that a smaller area is required in the United States to produce a metric
ton of corn (0.21 versus 0.11 hectares) because of the higher land productivity. However,
total land cost in the United States still turns out to be higher because land cost per
hectare is 248 percent higher in the United States than in China. The two countries have
different land policies and fees. In the United States, farmers pay rent for land or assume
the market rent as land expenditure if the farmer is the owner of the land. In China, the

Does the U.S. Midwest Have a Cost Advantage Over China in Producing Corn, Soybeans, and Hogs? / 9
TABLE 5. Major components in cost of production of corn, 1996 to 2000 average
China Northeast North East Pastoral South West U.S. U.S.
Midwest U.S.$/Mt
Land 14 13 16 24 14 19 16 24 25 Power 62 40 49 61 51 106 91 39 35 Total
fertilizer 28 25 22 21 30 44 33 12 12 Seeds 7 7 7 7 7 7 6 8 8
Ratio to COP in U.S. Midwest Land 0.56 0.52 0.65 0.94 0.54 0.78 0.63 0.94 1.00 Power 1.77 1.16 1.42 1.74 1.47 3.06 2.61 1.12 1.00 Total
fertilizer 2.37 2.13 1.84 1.82 2.53 3.68 2.75 0.99 1.00 Seeds 0.85 0.91 0.88 0.88 0.90 0.93 0.78 1.03 1.00 Source: Calculated by authors based on COP data. TABLE 6. Land use, price, and cost of corn, 1996 to 2000 average
China Northeast North East Pastoral South West U.S. U.S.
Midwest Cost ($/mt) 14 13 16 24 14 19 16 24 25 Use (ha/mt) 0.21 0.19 0.22 0.21 0.19 0.28 0.23 0.11 0.11 Price ($/ha) 68.45 69.41 73.54 115.38 71.66 69.10 68.36 211.41 238.05
Ratio to COP in U.S. Midwest Cost 0.56 0.52 0.65 0.94 0.54 0.78 0.63 0.94 1.00 Use 1.96 1.77 2.09 1.95 1.79 2.67 2.18 1.06 1.00 Price 0.29 0.29 0.31 0.48 0.30 0.29 0.29 0.89 1.00 Source: Calculated by authors based on COP data.
government owns the land and the land is leased to individual farmers based on family
size. The first round of leases was granted in the late 1970s for 20 years and a new round
of leases was conducted in the last several years—typically for 30 years. Farmers pay the
tax to the government with a proportion of their production. The land tax cost is very low
compared to rent in the United States. However, farmers also need to pay the fee to
different levels of local government (central government, village, and township). These
fees are relatively high and there has been an upward trend in recent years. In our cost
calculation, both the central government tax and local taxes are included in the land cost.
On a five-year average, the land cost of producing corn in China is only 56 percent of that
in the U.S. Midwest.
China’s labor cost on a metric ton basis has averaged about six times the labor cost
in the U.S. Midwest, as shown in Table 7. China has cheaper labor and the wage rate is
only 1/462 that of the United States. But the cheap labor advantage is offset by lower
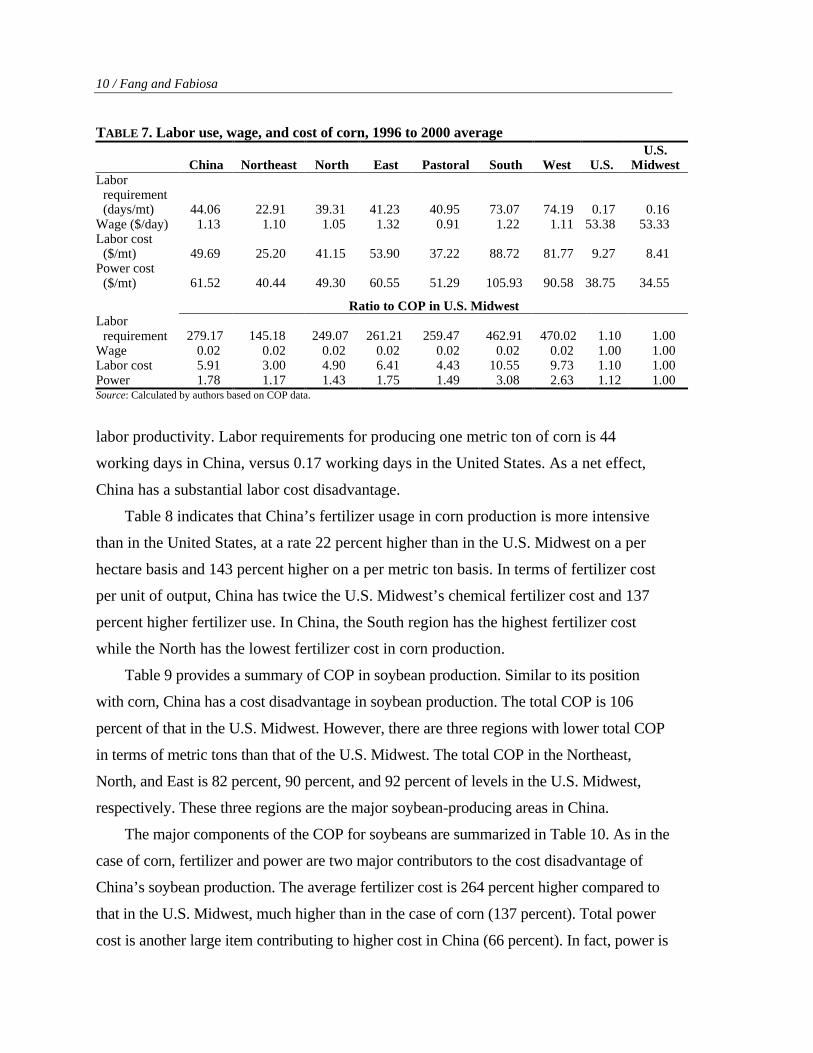
10 / Fang and Fabiosa
TABLE 7. Labor use, wage, and cost of corn, 1996 to 2000 average
China Northeast North East Pastoral South West U.S. U.S.
Midwest Labor
requirement (days/mt)
44.06
22.91
39.31
41.23
40.95
73.07
74.19
0.17
0.16
Wage ($/day) 1.13 1.10 1.05 1.32 0.91 1.22 1.11 53.38 53.33 Labor cost
($/mt) 49.69 25.20 41.15 53.90 37.22 88.72 81.77 9.27 8.41 Power cost
($/mt) 61.52 40.44 49.30 60.55 51.29 105.93 90.58 38.75 34.55
Ratio to COP in U.S. Midwest Labor
requirement 279.17 145.18 249.07 261.21 259.47 462.91 470.02 1.10 1.00 Wage 0.02 0.02 0.02 0.02 0.02 0.02 0.02 1.00 1.00 Labor cost 5.91 3.00 4.90 6.41 4.43 10.55 9.73 1.10 1.00 Power 1.78 1.17 1.43 1.75 1.49 3.08 2.63 1.12 1.00 Source: Calculated by authors based on COP data.
labor productivity. Labor requirements for producing one metric ton of corn is 44
working days in China, versus 0.17 working days in the United States. As a net effect,
China has a substantial labor cost disadvantage.
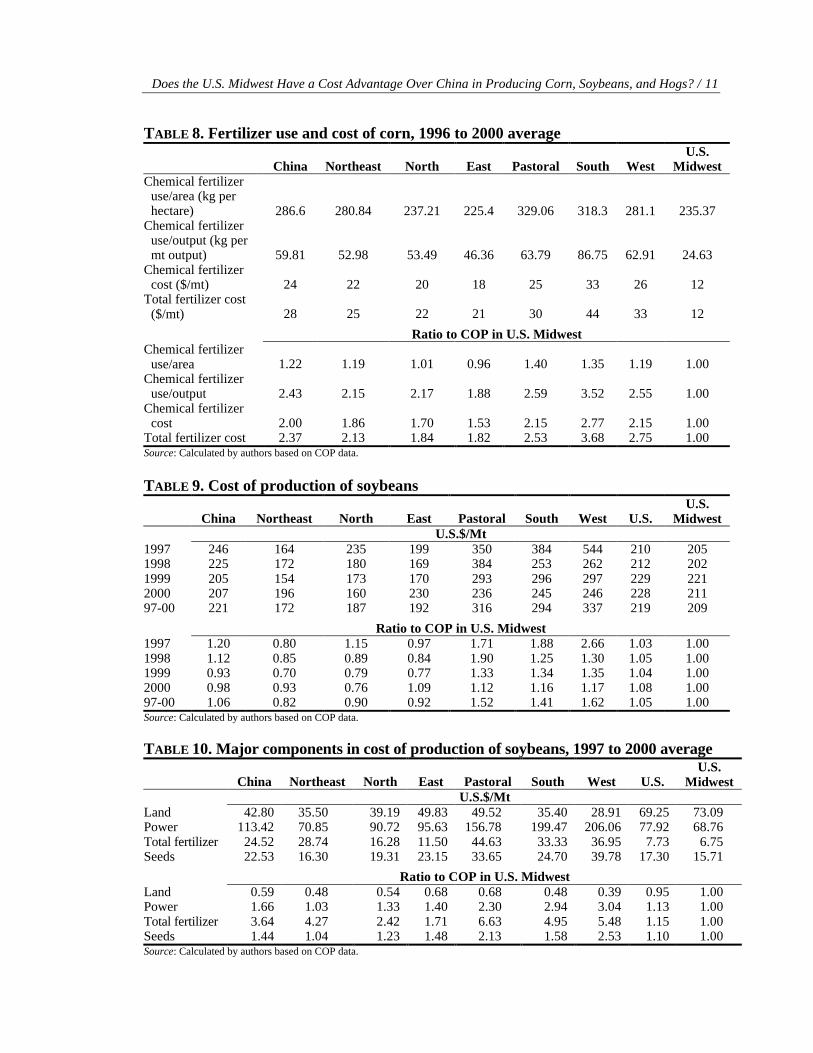
Table 8 indicates that China’s fertilizer usage in corn production is more intensive
than in the United States, at a rate 22 percent higher than in the U.S. Midwest on a per
hectare basis and 143 percent higher on a per metric ton basis. In terms of fertilizer cost
per unit of output, China has twice the U.S. Midwest’s chemical fertilizer cost and 137
percent higher fertilizer use. In China, the South region has the highest fertilizer cost
while the North has the lowest fertilizer cost in corn production.
Table 9 provides a summary of COP in soybean production. Similar to its position
with corn, China has a cost disadvantage in soybean production. The total COP is 106
percent of that in the U.S. Midwest. However, there are three regions with lower total COP
in terms of metric tons than that of the U.S. Midwest. The total COP in the Northeast,
North, and East is 82 percent, 90 percent, and 92 percent of levels in the U.S. Midwest,
respectively. These three regions are the major soybean-producing areas in China.
The major components of the COP for soybeans are summarized in Table 10. As in the
case of corn, fertilizer and power are two major contributors to the cost disadvantage of
China’s soybean production. The average fertilizer cost is 264 percent higher compared to
that in the U.S. Midwest, much higher than in the case of corn (137 percent). Total power
cost is another large item contributing to higher cost in China (66 percent). In fact, power is
Does the U.S. Midwest Have a Cost Advantage Over China in Producing Corn, Soybeans, and Hogs? / 11
TABLE 8. Fertilizer use and cost of corn, 1996 to 2000 average
China Northeast North East Pastoral South West U.S.
Midwest Chemical fertilizer
use/area (kg per hectare) 286.6 280.84 237.21 225.4 329.06 318.3 281.1 235.37
Chemical fertilizer use/output (kg per mt output)
59.81
52.98
53.49
46.36
63.79
86.75
62.91
24.63
Chemical fertilizer cost ($/mt) 24 22 20 18 25 33 26 12
Total fertilizer cost ($/mt) 28 25 22 21 30 44 33 12
Ratio to COP in U.S. Midwest Chemical fertilizer
use/area 1.22 1.19 1.01 0.96 1.40 1.35 1.19 1.00 Chemical fertilizer
use/output
2.43
2.15
2.17
1.88
2.59
3.52
2.55
1.00 Chemical fertilizer
cost 2.00 1.86 1.70 1.53 2.15 2.77 2.15 1.00 Total fertilizer cost 2.37 2.13 1.84 1.82 2.53 3.68 2.75 1.00 Source: Calculated by authors based on COP data.
TABLE 9. Cost of production of soybeans
China Northeast North East Pastoral South West U.S. U.S.
Midwest U.S.$/Mt 1997 246 164 235 199 350 384 544 210 205 1998 225 172 180 169 384 253 262 212 202 1999 205 154 173 170 293 296 297 229 221 2000 207 196 160 230 236 245 246 228 211 97-00 221 172 187 192 316 294 337 219 209 Ratio to COP in U.S. Midwest 1997 1.20 0.80 1.15 0.97 1.71 1.88 2.66 1.03 1.00 1998 1.12 0.85 0.89 0.84 1.90 1.25 1.30 1.05 1.00 1999 0.93 0.70 0.79 0.77 1.33 1.34 1.35 1.04 1.00 2000 0.98 0.93 0.76 1.09 1.12 1.16 1.17 1.08 1.00 97-00 1.06 0.82 0.90 0.92 1.52 1.41 1.62 1.05 1.00 Source: Calculated by authors based on COP data. TABLE 10. Major components in cost of production of soybeans, 1997 to 2000 average
China Northeast North East Pastoral South West U.S. U.S.
Midwest U.S.$/Mt
Land 42.80 35.50 39.19 49.83 49.52 35.40 28.91 69.25 73.09 Power 113.42 70.85 90.72 95.63 156.78 199.47 206.06 77.92 68.76 Total fertilizer 24.52 28.74 16.28 11.50 44.63 33.33 36.95 7.73 6.75 Seeds 22.53 16.30 19.31 23.15 33.65 24.70 39.78 17.30 15.71 Ratio to COP in U.S. Midwest Land 0.59 0.48 0.54 0.68 0.68 0.48 0.39 0.95 1.00 Power 1.66 1.03 1.33 1.40 2.30 2.94 3.04 1.13 1.00 Total fertilizer 3.64 4.27 2.42 1.71 6.63 4.95 5.48 1.15 1.00 Seeds 1.44 1.04 1.23 1.48 2.13 1.58 2.53 1.10 1.00 Source: Calculated by authors based on COP data.
12 / Fang and Fabiosa
the largest factor affecting China’s soybean COP in dollar terms ($44/mt higher). However,
the power cost in the Northeast region is very close to that in the U.S. Midwest.
Interestingly, China’s seed cost to produce soybeans is much higher (44 percent), although
the seed price in China is much lower. United States producers primarily use Roundup
Ready seed, paying a high price for the seed and agreeing not to save it for additional
planting. China, on the other hand, still uses non-genetically modified seed varieties that
are inexpensive. The higher unit seed cost may result from the fact that quantity used per
acre is higher and the yield is lower in China’s soybean production.
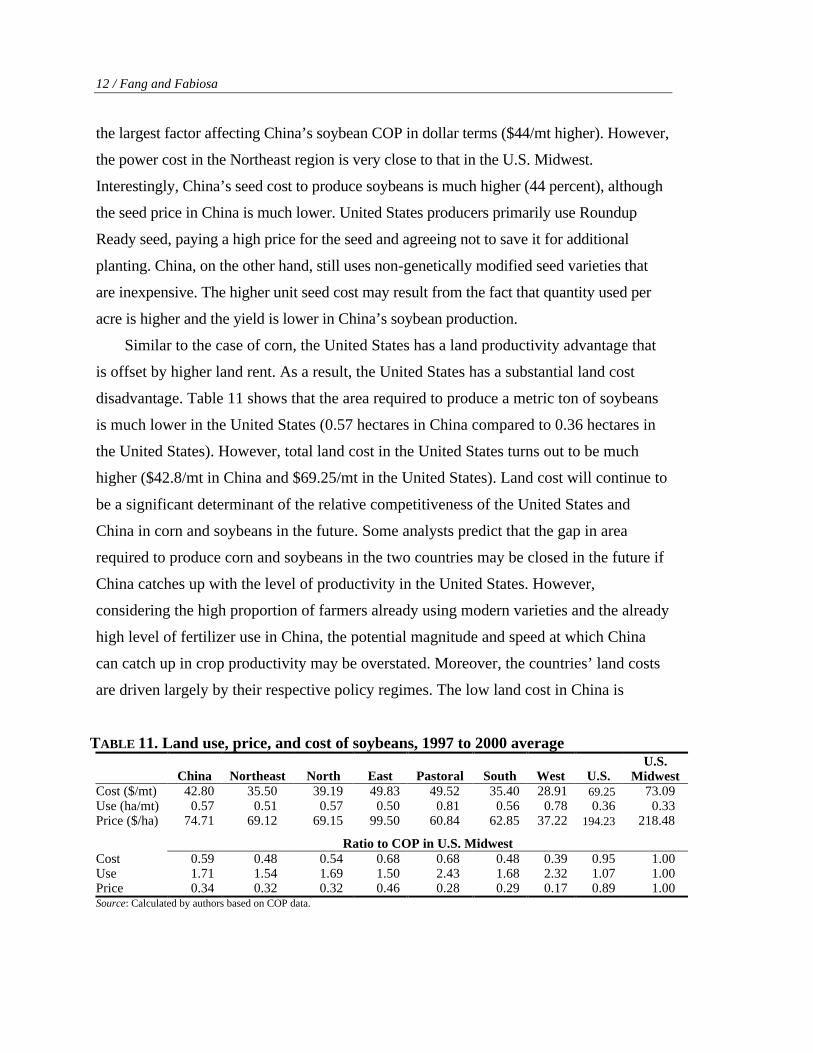
Similar to the case of corn, the United States has a land productivity advantage that
is offset by higher land rent. As a result, the United States has a substantial land cost
disadvantage. Table 11 shows that the area required to produce a metric ton of soybeans
is much lower in the United States (0.57 hectares in China compared to 0.36 hectares in
the United States). However, total land cost in the United States turns out to be much
higher ($42.8/mt in China and $69.25/mt in the United States). Land cost will continue to
be a significant determinant of the relative competitiveness of the United States and
China in corn and soybeans in the future. Some analysts predict that the gap in area
required to produce corn and soybeans in the two countries may be closed in the future if
China catches up with the level of productivity in the United States. However,
considering the high proportion of farmers already using modern varieties and the already
high level of fertilizer use in China, the potential magnitude and speed at which China
can catch up in crop productivity may be overstated. Moreover, the countries’ land costs
are driven largely by their respective policy regimes. The low land cost in China is
TABLE 11. Land use, price, and cost of soybeans, 1997 to 2000 average
China Northeast North East Pastoral South West U.S. U.S.
Midwest Cost ($/mt) 42.80 35.50 39.19 49.83 49.52 35.40 28.91 69.25 73.09 Use (ha/mt) 0.57 0.51 0.57 0.50 0.81 0.56 0.78 0.36 0.33 Price ($/ha) 74.71 69.12 69.15 99.50 60.84 62.85 37.22 194.23 218.48
Ratio to COP in U.S. Midwest Cost 0.59 0.48 0.54 0.68 0.68 0.48 0.39 0.95 1.00 Use 1.71 1.54 1.69 1.50 2.43 1.68 2.32 1.07 1.00 Price 0.34 0.32 0.32 0.46 0.28 0.29 0.17 0.89 1.00 Source: Calculated by authors based on COP data.

Does the U.S. Midwest Have a Cost Advantage Over China in Producing Corn, Soybeans, and Hogs? / 13
artificial and reflects the administrative control in land use and the lack of a free land
market. On the other hand, in the United States, land cost is artificially high, with
government support capitalized into higher land values. As land use policy is liberalized
in China, and as government support in the United States is reduced, land costs in both
countries are expected to move toward convergence. That is, land cost is expected to
increase in China and decrease in the United States.
Soybean production labor requires 76 days per mt in China compared to 0.32 days in
the United States. However, even with a 462 percent higher wage rate in the United
States than in China, labor cost in China is 378 percent higher for soybean production
(Table 12) as that in the United States.
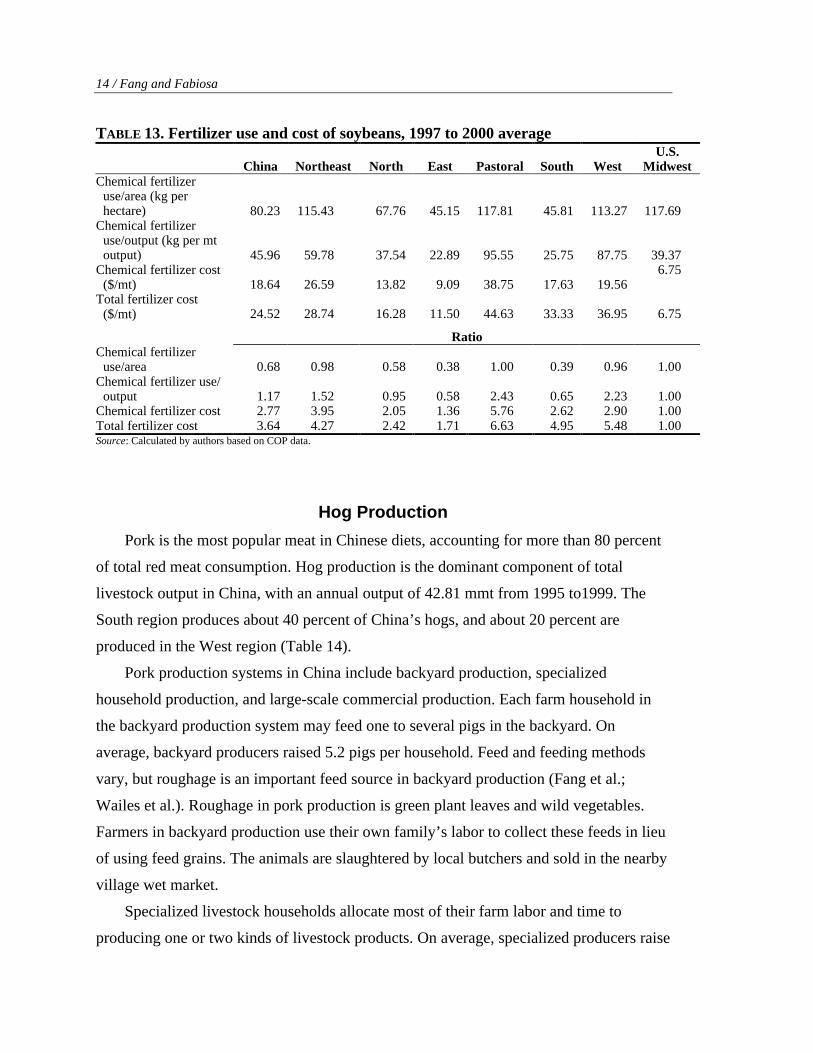
In contrast to corn production, soybean production fertilizer use per hectare in China
on average is 32 percent lower than that in the U.S. Midwest, as summarized in Table 13.
The difference in fertilizer utilization on a per metric ton basis is much smaller in
soybean production than in corn production. The major factor contributing to higher
fertilizer costs is the price. The major soybean producing region in China, the Northeast
region, has almost the same amount of fertilizer use per hectare as the U.S. Midwest.
TABLE 12. Labor use, wage, and cost of soybeans, 1997 to 2000 average
China Northeast North East Pastoral South West U.S. U.S.
Midwest Labor
requirement (days/mt)
76.60
30.50
71.10
63.66
108.97
120.01
176.12
0.32
0.28
Wage ($/day) 1.12 1.11 1.05 1.29 0.96 1.42 1.02 56.96 57.31 Labor cost
($/mt) 85.98 33.82 75.14 81.65 104.60 171.47 179.79 17.99 15.95 Power cost
($/mt) 113.42 70.85 90.72 95.63 156.78 199.47 206.06 77.79 68.90
Ratio to COP in U.S. Midwest Labor
requirement 274.40 109.26 254.70 228.05 390.34 429.90 630.88 1.13 1.00 Wage 0.02 0.02 0.02 0.02 0.02 0.02 0.02 0.99 1.00 Labor cost 5.39 2.12 4.71 5.12 6.56 10.75 11.28 1.13 1.00 Power 1.66 1.03 1.33 1.39 2.29 2.93 3.04 1.13 1.00 Source: Calculated by authors based on COP data.
14 / Fang and Fabiosa
TABLE 13. Fertilizer use and cost of soybeans, 1997 to 2000 average
China Northeast North East Pastoral South West U.S.
Midwest Chemical fertilizer
use/area (kg per hectare) 80.23 115.43 67.76 45.15 117.81 45.81 113.27 117.69
Chemical fertilizer use/output (kg per mt output) 45.96 59.78 37.54 22.89 95.55 25.75 87.75 39.37
Chemical fertilizer cost ($/mt) 18.64 26.59 13.82 9.09 38.75 17.63 19.56
6.75
Total fertilizer cost ($/mt) 24.52 28.74 16.28 11.50 44.63 33.33 36.95 6.75
Ratio Chemical fertilizer
use/area 0.68 0.98 0.58 0.38 1.00 0.39 0.96 1.00 Chemical fertilizer use/
output 1.17 1.52 0.95 0.58 2.43 0.65 2.23 1.00 Chemical fertilizer cost 2.77 3.95 2.05 1.36 5.76 2.62 2.90 1.00 Total fertilizer cost 3.64 4.27 2.42 1.71 6.63 4.95 5.48 1.00 Source: Calculated by authors based on COP data.
Hog Production
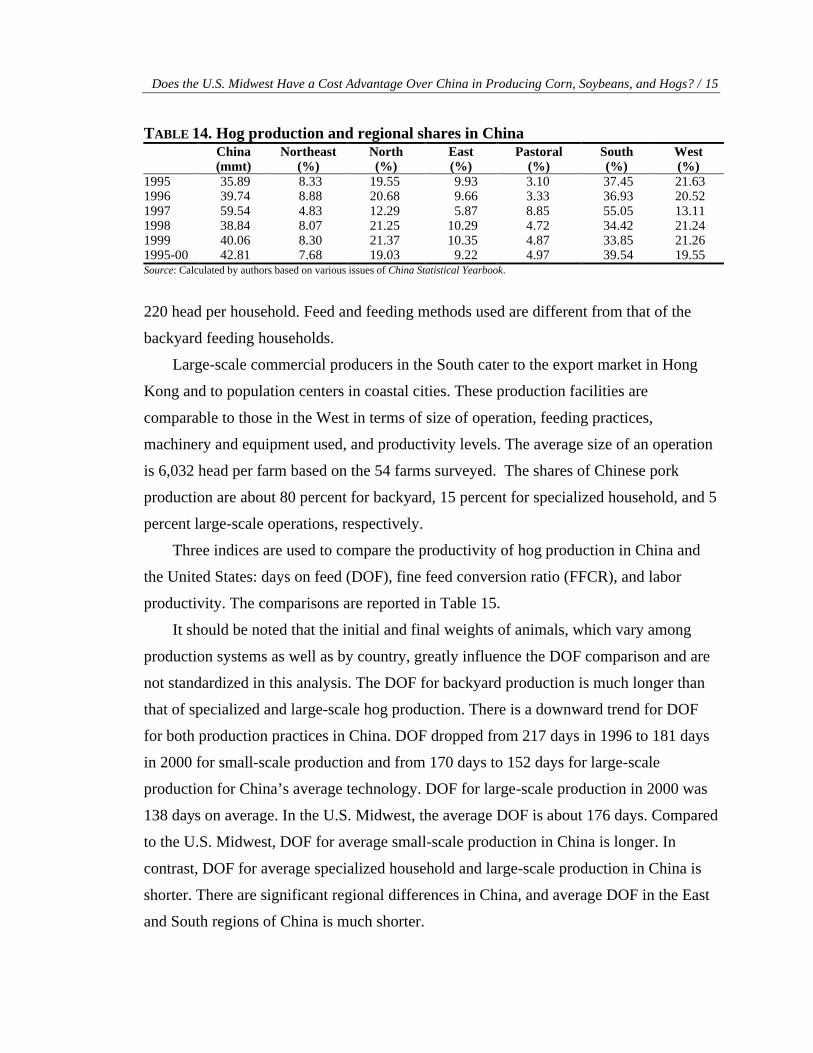
Pork is the most popular meat in Chinese diets, accounting for more than 80 percent
of total red meat consumption. Hog production is the dominant component of total
livestock output in China, with an annual output of 42.81 mmt from 1995 to1999. The
South region produces about 40 percent of China’s hogs, and about 20 percent are
produced in the West region (Table 14).
Pork production systems in China include backyard production, specialized
household production, and large-scale commercial production. Each farm household in
the backyard production system may feed one to several pigs in the backyard. On
average, backyard producers raised 5.2 pigs per household. Feed and feeding methods
vary, but roughage is an important feed source in backyard production (Fang et al.;
Wailes et al.). Roughage in pork production is green plant leaves and wild vegetables.
Farmers in backyard production use their own family’s labor to collect these feeds in lieu
of using feed grains. The animals are slaughtered by local butchers and sold in the nearby
village wet market.
Specialized livestock households allocate most of their farm labor and time to
producing one or two kinds of livestock products. On average, specialized producers raise
Does the U.S. Midwest Have a Cost Advantage Over China in Producing Corn, Soybeans, and Hogs? / 15
TABLE 14. Hog production and regional shares in China
China (mmt)
Northeast (%)
North (%)
East (%)
Pastoral (%)
South (%)
West (%)
1995 35.89 8.33 19.55 9.93 3.10 37.45 21.63 1996 39.74 8.88 20.68 9.66 3.33 36.93 20.52 1997 59.54 4.83 12.29 5.87 8.85 55.05 13.11 1998 38.84 8.07 21.25 10.29 4.72 34.42 21.24 1999 40.06 8.30 21.37 10.35 4.87 33.85 21.26 1995-00 42.81 7.68 19.03 9.22 4.97 39.54 19.55 Source: Calculated by authors based on various issues of China Statistical Yearbook.
220 head per household. Feed and feeding methods used are different from that of the
backyard feeding households.
Large-scale commercial producers in the South cater to the export market in Hong
Kong and to population centers in coastal cities. These production facilities are
comparable to those in the West in terms of size of operation, feeding practices,
machinery and equipment used, and productivity levels. The average size of an operation
is 6,032 head per farm based on the 54 farms surveyed. The shares of Chinese pork
production are about 80 percent for backyard, 15 percent for specialized household, and 5
percent large-scale operations, respectively.
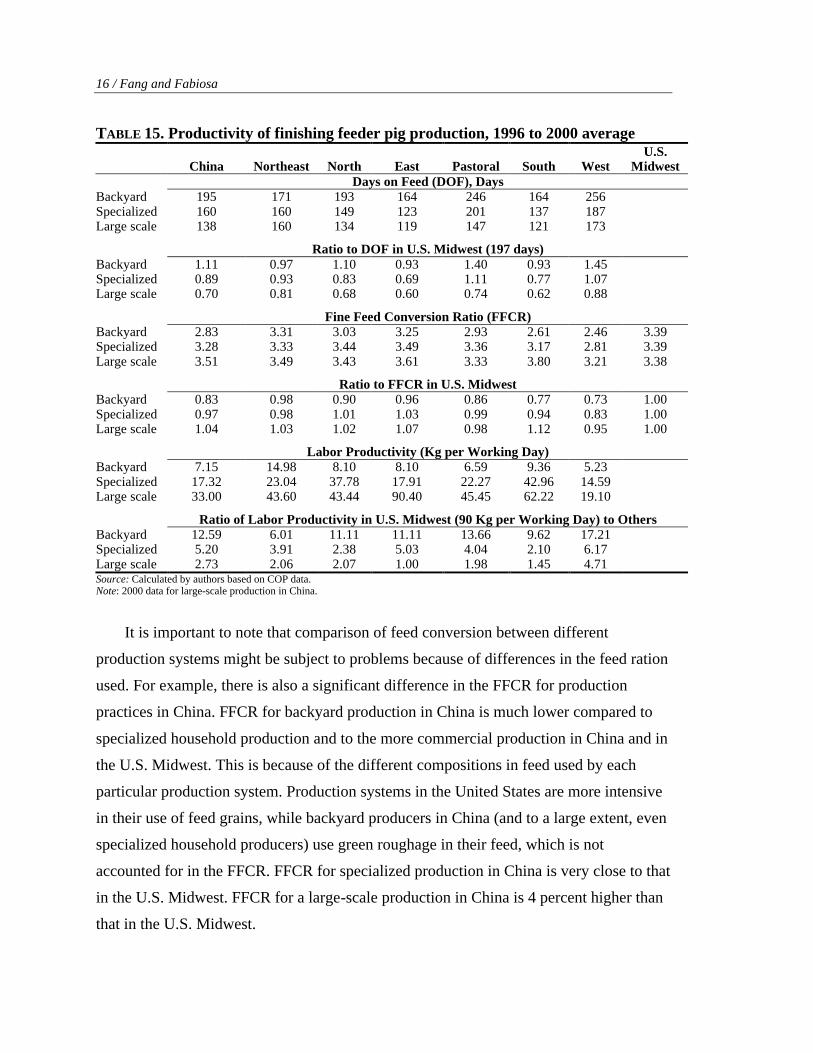
Three indices are used to compare the productivity of hog production in China and
the United States: days on feed (DOF), fine feed conversion ratio (FFCR), and labor
productivity. The comparisons are reported in Table 15.
It should be noted that the initial and final weights of animals, which vary among
production systems as well as by country, greatly influence the DOF comparison and are
not standardized in this analysis. The DOF for backyard production is much longer than
that of specialized and large-scale hog production. There is a downward trend for DOF
for both production practices in China. DOF dropped from 217 days in 1996 to 181 days
in 2000 for small-scale production and from 170 days to 152 days for large-scale
production for China’s average technology. DOF for large-scale production in 2000 was
138 days on average. In the U.S. Midwest, the average DOF is about 176 days. Compared
to the U.S. Midwest, DOF for average small-scale production in China is longer. In
contrast, DOF for average specialized household and large-scale production in China is
shorter. There are significant regional differences in China, and average DOF in the East
and South regions of China is much shorter.
16 / Fang and Fabiosa
TABLE 15. Productivity of finishing feeder pig production, 1996 to 2000 average
China Northeast North East Pastoral South West U.S.
Midwest Days on Feed (DOF), Days Backyard 195 171 193 164 246 164 256 Specialized 160 160 149 123 201 137 187 Large scale 138 160 134 119 147 121 173
Ratio to DOF in U.S. Midwest (197 days) Backyard 1.11 0.97 1.10 0.93 1.40 0.93 1.45 Specialized 0.89 0.93 0.83 0.69 1.11 0.77 1.07 Large scale 0.70 0.81 0.68 0.60 0.74 0.62 0.88
Fine Feed Conversion Ratio (FFCR) Backyard 2.83 3.31 3.03 3.25 2.93 2.61 2.46 3.39 Specialized 3.28 3.33 3.44 3.49 3.36 3.17 2.81 3.39 Large scale 3.51 3.49 3.43 3.61 3.33 3.80 3.21 3.38
Ratio to FFCR in U.S. Midwest Backyard 0.83 0.98 0.90 0.96 0.86 0.77 0.73 1.00 Specialized 0.97 0.98 1.01 1.03 0.99 0.94 0.83 1.00 Large scale 1.04 1.03 1.02 1.07 0.98 1.12 0.95 1.00
Labor Productivity (Kg per Working Day) Backyard 7.15 14.98 8.10 8.10 6.59 9.36 5.23 Specialized 17.32 23.04 37.78 17.91 22.27 42.96 14.59 Large scale 33.00 43.60 43.44 90.40 45.45 62.22 19.10
Ratio of Labor Productivity in U.S. Midwest (90 Kg per Working Day) to Others Backyard 12.59 6.01 11.11 11.11 13.66 9.62 17.21 Specialized 5.20 3.91 2.38 5.03 4.04 2.10 6.17 Large scale 2.73 2.06 2.07 1.00 1.98 1.45 4.71 Source: Calculated by authors based on COP data. Note: 2000 data for large-scale production in China.
It is important to note that comparison of feed conversion between different
production systems might be subject to problems because of differences in the feed ration
used. For example, there is also a significant difference in the FFCR for production
practices in China. FFCR for backyard production in China is much lower compared to
specialized household production and to the more commercial production in China and in
the U.S. Midwest. This is because of the different compositions in feed used by each
particular production system. Production systems in the United States are more intensive
in their use of feed grains, while backyard producers in China (and to a large extent, even
specialized household producers) use green roughage in their feed, which is not
accounted for in the FFCR. FFCR for specialized production in China is very close to that
in the U.S. Midwest. FFCR for a large-scale production in China is 4 percent higher than
that in the U.S. Midwest.
Does the U.S. Midwest Have a Cost Advantage Over China in Producing Corn, Soybeans, and Hogs? / 17
Hog production also is labor intensive in China compared to that in the United
States. One working day in the U.S. Midwest produces about 90 kg pork, while backyard
hog production in China produces only 7.15 kg. Labor productivity in the U.S. Midwest
is 12.59 times greater than that of backyard production in China, 4.72 times greater than
specialized household hog production in China, but only 2.73 times greater than the
large-scale production in the South region of China.
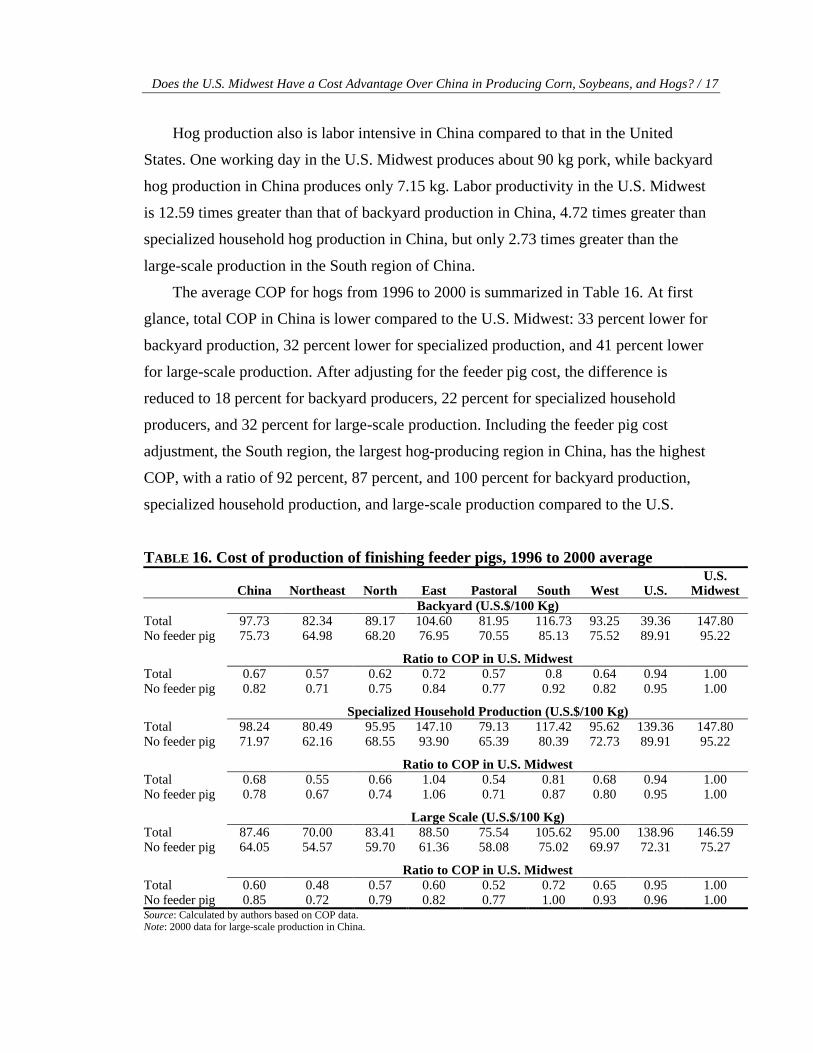
The average COP for hogs from 1996 to 2000 is summarized in Table 16. At first
glance, total COP in China is lower compared to the U.S. Midwest: 33 percent lower for
backyard production, 32 percent lower for specialized production, and 41 percent lower
for large-scale production. After adjusting for the feeder pig cost, the difference is
reduced to 18 percent for backyard producers, 22 percent for specialized household
producers, and 32 percent for large-scale production. Including the feeder pig cost
adjustment, the South region, the largest hog-producing region in China, has the highest
COP, with a ratio of 92 percent, 87 percent, and 100 percent for backyard production,
specialized household production, and large-scale production compared to the U.S.
TABLE 16. Cost of production of finishing feeder pigs, 1996 to 2000 average
China Northeast North East Pastoral South West U.S. U.S.
Midwest Backyard (U.S.$/100 Kg)
Total 97.73 82.34 89.17 104.60 81.95 116.73 93.25 39.36 147.80 No feeder pig 75.73 64.98 68.20 76.95 70.55 85.13 75.52 89.91 95.22
Ratio to COP in U.S. Midwest Total 0.67 0.57 0.62 0.72 0.57 0.8 0.64 0.94 1.00 No feeder pig 0.82 0.71 0.75 0.84 0.77 0.92 0.82 0.95 1.00
Specialized Household Production (U.S.$/100 Kg) Total 98.24 80.49 95.95 147.10 79.13 117.42 95.62 139.36 147.80 No feeder pig 71.97 62.16 68.55 93.90 65.39 80.39 72.73 89.91 95.22
Ratio to COP in U.S. Midwest Total 0.68 0.55 0.66 1.04 0.54 0.81 0.68 0.94 1.00 No feeder pig 0.78 0.67 0.74 1.06 0.71 0.87 0.80 0.95 1.00
Large Scale (U.S.$/100 Kg) Total 87.46 70.00 83.41 88.50 75.54 105.62 95.00 138.96 146.59 No feeder pig 64.05 54.57 59.70 61.36 58.08 75.02 69.97 72.31 75.27
Ratio to COP in U.S. Midwest Total 0.60 0.48 0.57 0.60 0.52 0.72 0.65 0.95 1.00 No feeder pig 0.85 0.72 0.79 0.82 0.77 1.00 0.93 0.96 1.00 Source: Calculated by authors based on COP data. Note: 2000 data for large-scale production in China.
18 / Fang and Fabiosa
Midwest. Compared to the specialized household production in the East China region, the
U.S. Midwest has a 6 percent cost advantage.
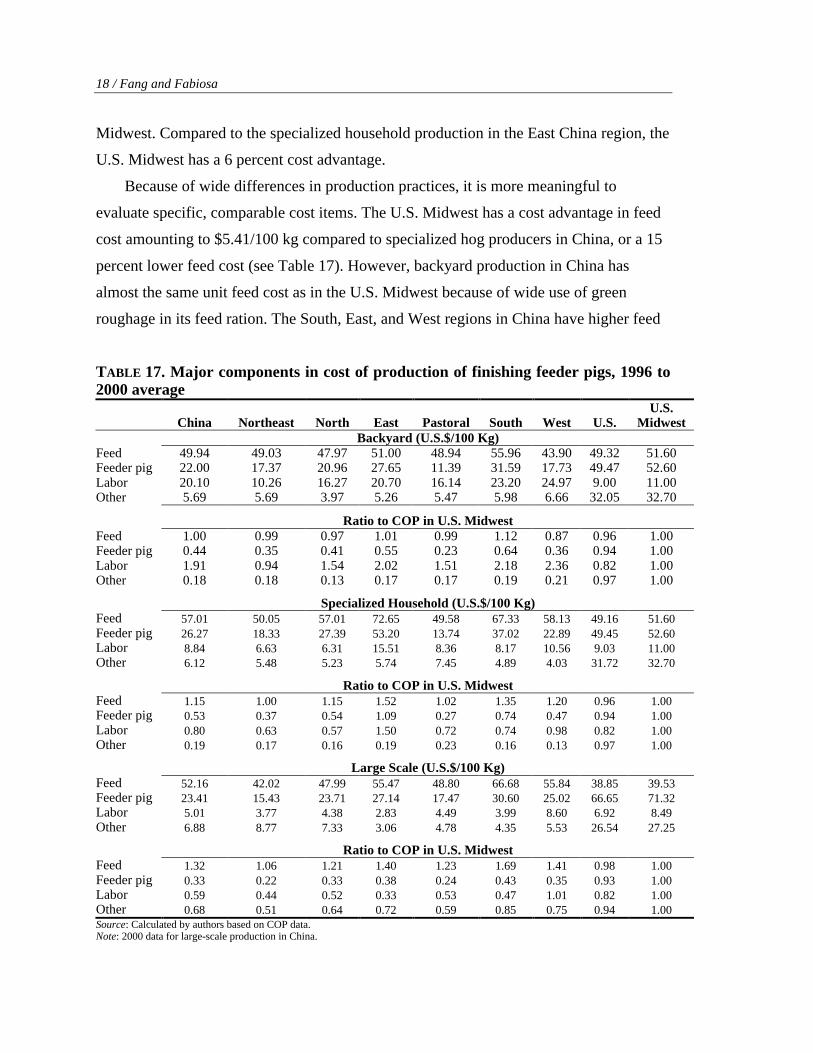
Because of wide differences in production practices, it is more meaningful to
evaluate specific, comparable cost items. The U.S. Midwest has a cost advantage in feed
cost amounting to $5.41/100 kg compared to specialized hog producers in China, or a 15
percent lower feed cost (see Table 17). However, backyard production in China has
almost the same unit feed cost as in the U.S. Midwest because of wide use of green
roughage in its feed ration. The South, East, and West regions in China have higher feed
TABLE 17. Major components in cost of production of finishing feeder pigs, 1996 to 2000 average
China Northeast North East Pastoral South West U.S. U.S.
Midwest Backyard (U.S.$/100 Kg)
Feed 49.94 49.03 47.97 51.00 48.94 55.96 43.90 49.32 51.60 Feeder pig 22.00 17.37 20.96 27.65 11.39 31.59 17.73 49.47 52.60 Labor 20.10 10.26 16.27 20.70 16.14 23.20 24.97 9.00 11.00 Other 5.69 5.69 3.97 5.26 5.47 5.98 6.66 32.05 32.70
Ratio to COP in U.S. Midwest Feed 1.00 0.99 0.97 1.01 0.99 1.12 0.87 0.96 1.00 Feeder pig 0.44 0.35 0.41 0.55 0.23 0.64 0.36 0.94 1.00 Labor 1.91 0.94 1.54 2.02 1.51 2.18 2.36 0.82 1.00 Other 0.18 0.18 0.13 0.17 0.17 0.19 0.21 0.97 1.00
Specialized Household (U.S.$/100 Kg) Feed 57.01 50.05 57.01 72.65 49.58 67.33 58.13 49.16 51.60 Feeder pig 26.27 18.33 27.39 53.20 13.74 37.02 22.89 49.45 52.60 Labor 8.84 6.63 6.31 15.51 8.36 8.17 10.56 9.03 11.00 Other 6.12 5.48 5.23 5.74 7.45 4.89 4.03 31.72 32.70
Ratio to COP in U.S. Midwest Feed 1.15 1.00 1.15 1.52 1.02 1.35 1.20 0.96 1.00 Feeder pig 0.53 0.37 0.54 1.09 0.27 0.74 0.47 0.94 1.00 Labor 0.80 0.63 0.57 1.50 0.72 0.74 0.98 0.82 1.00 Other 0.19 0.17 0.16 0.19 0.23 0.16 0.13 0.97 1.00
Large Scale (U.S.$/100 Kg) Feed 52.16 42.02 47.99 55.47 48.80 66.68 55.84 38.85 39.53 Feeder pig 23.41 15.43 23.71 27.14 17.47 30.60 25.02 66.65 71.32 Labor 5.01 3.77 4.38 2.83 4.49 3.99 8.60 6.92 8.49 Other 6.88 8.77 7.33 3.06 4.78 4.35 5.53 26.54 27.25
Ratio to COP in U.S. Midwest Feed 1.32 1.06 1.21 1.40 1.23 1.69 1.41 0.98 1.00 Feeder pig 0.33 0.22 0.33 0.38 0.24 0.43 0.35 0.93 1.00 Labor 0.59 0.44 0.52 0.33 0.53 0.47 1.01 0.82 1.00 Other 0.68 0.51 0.64 0.72 0.59 0.85 0.75 0.94 1.00 Source: Calculated by authors based on COP data. Note: 2000 data for large-scale production in China.
Does the U.S. Midwest Have a Cost Advantage Over China in Producing Corn, Soybeans, and Hogs? / 19
costs, reflecting the high COP of corn and soybeans and higher transportation costs of
feed. China has a labor disadvantage in backyard production due to low labor
productivity but it has a labor advantage in specialized household production and large-
scale production. China has a strong feeder pig cost advantage across all three types of
practices. Our data do not explain this cost differential, but the most likely major source
of the difference is the labor intensity in feeder pig production, where China has a
significant advantage over the United States due to the availability of cheap labor.
The U.S. Midwest has a substantial cost disadvantage in other cost terms ($27.01 for
backyard production, $26.58 for specialized household, and $25.82 for large-scale
production). The major difference in other cost terms is attributable to the higher capital
replacement costs (or depreciation) in the United States. It is difficult to ascertain whether
the computation of capital replacement cost is similar enough in both countries to warrant
a valid comparison in this category.
Impacts of U.S. Land Rent Distortion and Exchange Rates
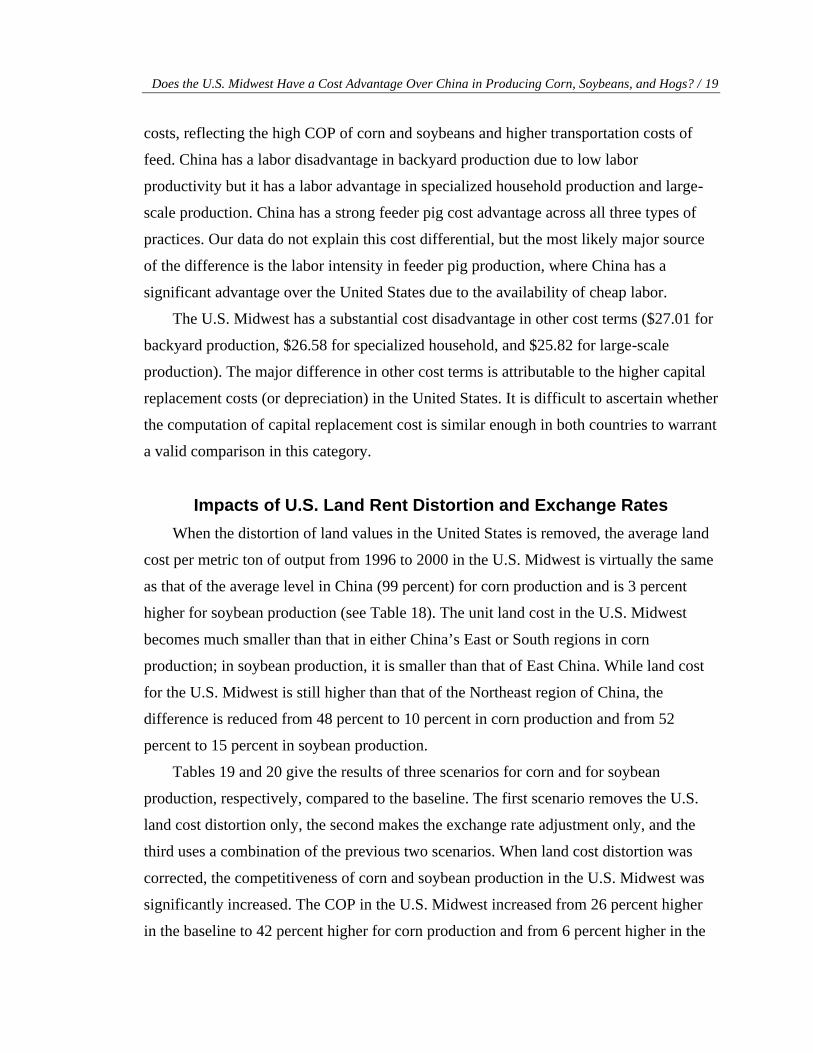
When the distortion of land values in the United States is removed, the average land
cost per metric ton of output from 1996 to 2000 in the U.S. Midwest is virtually the same
as that of the average level in China (99 percent) for corn production and is 3 percent
higher for soybean production (see Table 18). The unit land cost in the U.S. Midwest
becomes much smaller than that in either China’s East or South regions in corn
production; in soybean production, it is smaller than that of East China. While land cost
for the U.S. Midwest is still higher than that of the Northeast region of China, the
difference is reduced from 48 percent to 10 percent in corn production and from 52
percent to 15 percent in soybean production.
Tables 19 and 20 give the results of three scenarios for corn and for soybean
production, respectively, compared to the baseline. The first scenario removes the U.S.
land cost distortion only, the second makes the exchange rate adjustment only, and the
third uses a combination of the previous two scenarios. When land cost distortion was
corrected, the competitiveness of corn and soybean production in the U.S. Midwest was
significantly increased. The COP in the U.S. Midwest increased from 26 percent higher
in the baseline to 42 percent higher for corn production and from 6 percent higher in the
20 / Fang and Fabiosa
TABLE 18. Land cost after adjusting U.S. land cost in corn and soybean production, 1996 to 2000 average
China Northeast North East Pastoral South West U.S. U.S.
Midwest U.S.$/Mt Corn 14.10 12.93 16.20 23.68 13.53 19.44 15.71 13.40 14.28 Soybeans 42.80 35.50 39.19 49.83 49.52 35.40 28.91 39.47 41.66
Ratio to COP in U.S. Midwest Corn 0.99 0.90 1.13 1.66 0.95 1.36 1.10 0.94 1.00 Soybeans 1.03 0.85 0.94 1.19 1.20 0.85 0.69 0.95 1.00 Source: Calculated by authors based on COP data. TABLE 19. Scenario analysis on the cost of production of corn, 1996 to 2000 average
China Northeast North East Pastoral South West U.S. U.S.
Midwest U.S.$/Mt Base 120 93 105 119 118 185 152 99 95 U.S. land
cost 120 93 105 119 118 185 152 89 85 Exchange
rate 109 84 95 108 107 168 138 99 95 Both 109 84 95 108 107 168 138 89 85
Ratio to COP in U.S. Midwest Base 1.26 0.97 1.10 1.25 1.24 1.94 1.59 1.04 1.00 U.S. land
cost 1.42 1.09 1.24 1.41 1.40 2.19 1.80 1.05 1.00 Exchange
rate 1.14 0.88 1.00 1.13 1.12 1.76 1.45 1.04 1.00 Both 1.29 0.99 1.13 1.28 1.27 1.98 1.63 1.05 1.00 Source: Calculated by authors based on COP data. TABLE 20. Scenario analysis on the cost of production of soybeans, 1997 to 2000 average
China Northeast North East Pastoral South West U.S. U.S.
Midwest U.S.$/Mt Base 221 172 187 192 316 294 337 219 209 U.S. land
cost only 221 172 187 192 316 294 337 190 178 Exchange
rate only 204 158 173 177 292 272 311 219 209 Both 204 158 173 177 292 272 311 190 178
Ratio to COP in U.S. Midwest Base 1.06 0.82 0.90 0.92 1.52 1.41 1.62 1.05 1.00 U.S. land
cost only 1.24 0.97 1.05 1.08 1.78 1.66 1.90 1.07 1.00 Exchange
rate only 0.95 0.74 0.81 0.83 1.36 1.27 1.46 1.05 1.00 Both 1.12 0.87 0.95 0.98 1.60 1.49 1.71 1.07 1.00 Source: Calculated by authors based on COP data.

Does the U.S. Midwest Have a Cost Advantage Over China in Producing Corn, Soybeans, and Hogs? / 21
baseline to 24 percent higher in soybean production. Corn production in the U.S.
Midwest becomes competitive overall compared to all regions in China. Northeast China
switched from cost advantage to cost disadvantage in corn production. In soybean
production, the U.S. Midwest switched from cost disadvantage to cost advantage relative
to the North and East regions of China. Northeast China still has a cost advantage
compared to the U.S. Midwest.
As expected in the second scenario with the exchange rate adjustment, the depreciating
Chinese yuan increases China’s competitiveness in corn and soybean production. China’s
COP decreased from 26 percent higher to 14 percent higher. The Northeast region becomes
more competitive and the North region changes from a cost disadvantage to an equal
advantage in unit COP. On average, in soybean production, China changed from cost
disadvantage to advantage. Three regions in China (Northeast, North, and East) become
more competitive. The other three regions remain at a cost disadvantage.
As a net effect of both U.S. land cost and the exchange rate, the U.S. Midwest gains
more in competitiveness. The U.S. Midwest has a cost advantage in corn production over
all the regions in China except in the Northeast. The Northeast region has almost the
same competitiveness as the U.S. Midwest in corn production in terms of COP. In
soybean production, the Northeast and North regions in China are still competitive. The
COP in the East China region comes close to that of the U.S. Midwest.
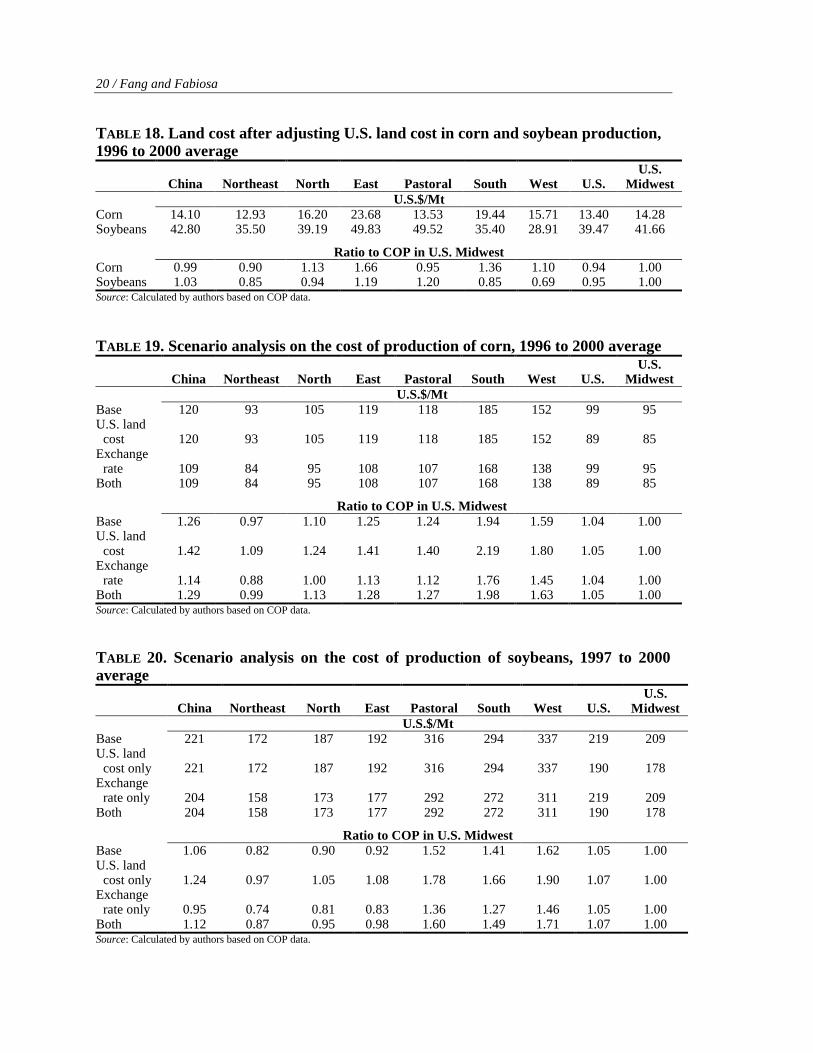
The scenario of the exchange rate on COP in feeder pigs was conducted and the
results are summarized in Table 21. As expected, depreciating the Chinese RMB
significantly increases the cost advantage for China’s hog production. All ratios of
China’s COP over the U.S. Midwest are reduced by 6 to 7 percent.
Conclusions and Discussion
This research compares the productivity and COP (cost of production) between
China and the United States for corn, soybeans, and hogs and provides regional
comparisons in China and the U.S. Midwest. Three kinds of hog production systems in
China are examined.
22 / Fang and Fabiosa
TABLE 21. Exchange rate on cost of production of finishing feeder pigs, 1996 to 2000 average (ratio to COP in U.S. Midwest)
China Northeast North East Pastoral South West U.S. U.S.
Midwest Backyard (Baseline) Total 0.67 0.57 0.62 0.72 0.57 0.8 0.64 0.94 1.00 No feeder pig 0.82 0.71 0.75 0.84 0.77 0.92 0.82 0.95 1.00
(Scenario) Total 0.61 0.52 0.56 0.65 0.51 0.73 0.58 0.94 1.00 No feeder pig 0.75 0.64 0.68 0.77 0.70 0.84 0.74 0.95 1.00
Specialized Household Production (Baseline) Total 0.68 0.55 0.66 1.04 0.54 0.81 0.68 0.94 1.00 No feeder pig 0.78 0.67 0.74 1.06 0.71 0.87 0.80 0.95 1.00
(Scenario) 0.61 0.50 0.60 0.95 0.49 0.73 0.62 0.94 1.00 No feeder pig 0.71 0.61 0.68 0.97 0.65 0.79 0.73 0.95 1.00
Large Scale (Baseline) Total 0.60 0.48 0.57 0.60 0.52 0.72 0.65 0.95 1.00 No feeder pig 0.85 0.72 0.79 0.82 0.77 1.00 0.93 0.96 1.00
(Scenario) Total 0.55 0.44 0.52 0.56 0.47 0.66 0.60 0.94 1.00 No feeder pig 0.79 0.67 0.74 0.76 0.72 0.92 0.86 0.95 1.00 Source: Calculated by authors. Note: 2000 data for large-scale production in China.
The results show that the United States has a substantial advantage in land and labor
productivity in corn and soybean production. The United States also has labor
productivity in hog production, but there is not a big difference in DOF (days on feed)
and fine feed requirements of the two countries. Based on China’s average technology,
the United States has a cost advantage in corn and soybean production but a disadvantage
in hog production.
Although the United States has a strong advantage in land productivity, it has a
substantial cost disadvantage in land because of inflated land rent resulting from
government programs. It is unlikely that China can make up the difference in land
productivity because of current intensive fertilizer usage. It is expected that land costs in
both countries will move toward convergence. The land policies in both countries will
play a significant role in determining their relative competitive positions.
China has very cheap labor. However, labor costs in producing corn and soybeans
are more expensive than in the United States because of lower labor productivity. There
Does the U.S. Midwest Have a Cost Advantage Over China in Producing Corn, Soybeans, and Hogs? / 23
has been an upward trend in labor productivity in China and this trend is expected to
continue as more job opportunities in the nonagricultural sectors occur.
The United States has a significant cost disadvantage in producing hogs regardless of
the production practice. The disadvantage stems mainly from feeder pig costs and capital
costs included in the “other” cost category.
Our results show that producing corn in China’s South and West regions is extremely
costly. To produce the same amount of corn, the South and West regions costs are 94
percent and 59 percent higher, respectively, compared to costs in the U.S. Midwest.
These differences in COP provide a good opportunity for U.S. farmers because these two
regions are major corn consumption and importing regions in China. The two regions
together produced 21.66 mmt of pork annually in the last five years, or 2.58 times the
total pork production of the United States.
The United States has a significant cost advantage over the South, West, and Pastoral
regions of China. Total COP including land cost to produce a unit of soybeans in these
three regions is 41 percent, 62 percent, and 52 percent higher, respectively, relative to
that of the U.S. Midwest. These three regions are big importing regions of soybeans in
China as there is a growing demand for soybean meal for livestock, and this will have
important implications for U.S. soybean exporters. The South region has been emerging
as a large soybean demand market, as modern soybean crushing capacity has developed
in the last several years. In addition to the COP advantage, crushers prefer imported seed
because U.S. soybeans have a higher oil content than do domestic seeds, and delivery is
more reliable.
However, U.S. corn and soybeans are facing strong competition from the Northeast
and North regions of China. The results of this study show that the unit costs of
producing corn and soybeans in these two regions are nearly equal to those in the U.S.
Midwest. Interestingly, the results indicate that the situation for Chinese farmers in major
producing regions as a result of WTO accession is not as bad as many had thought.
With China’s good productive potential, mostly found in the Northeast region but
with the bulk of consumption occurring in the Southeast region, investment in and
development of transportation infrastructure will be a major determinant in how regional
competitiveness will translate into trade patterns in the future. Industry experts report that
24 / Fang and Fabiosa
the cost of transporting corn and soybeans from the Northeast to the South in China is
comparable to transporting them from the United States.
In hog production, the U.S. Midwest has a cost advantage over China in terms of
feed cost based on average technology, but this advantage is more than offset by the
lower cost of feeder pigs and low capital replacement cost in China. In addition,
producers in the U.S. Midwest are competitive in terms of COP compared to the
producers of specialized households and large-scale farms in the major hog-producing
regions of South and East China.
Removing the U.S. land value distortion would increase the overall competitiveness
of U.S. corn, soybean, and hog producers. However, the benefits from removing U.S.
land value distortion would be offset by the depreciating Chinese yuan. The net effects
from these two policy scenarios will not change the major conclusions discussed above.
The recently passed U.S. agricultural law removes any expectations for a reduction of
land value distortions in the near future.
China is conducting an experiment in land tax and fee reforms in an attempt to
reduce land costs and increase farm income. The experiment started at Anhui province in
2000 and Jiangsu province joined the experiment in 2001. The Chinese government
allowed several more provinces to join the reform in 2002. The reform has reduced
farmers’ costs but it has run into many obstacles. A major difficulty for the reform is
local governments’ lack of funds to pay for the huge loans and education funds. We
cannot quantify the impact of this policy, as it remains unclear at this time.
The results of this study provide important information on China’s competitiveness
in the international corn, soybean, and pork markets, and these results have important
implications for China’s inclusion in the WTO. However, COP analysis provides only
one of the determinants of a country’s competitive position. Domestic agricultural and
nonagricultural policies have a major impact on competitiveness. Currently, the United
States provides much better support to farmers, which makes U. S. products more
competitive in China’s markets.
Export potential for Chinese pork is also constrained by sanitary and phytosanitary
(SPS) considerations. In particular, China is not free of foot-and-mouth disease and
classical swine fever. China intends to develop disease-free regions to avoid SPS

Does the U.S. Midwest Have a Cost Advantage Over China in Producing Corn, Soybeans, and Hogs? / 25
restrictions, but its success in doing so remains to be seen. China can also circumvent
SPS restrictions by exporting processed pork products (Fabiosa et al.).
sThe results of this study should be taken with all the caveats that have been raised.
Foremost is the inherent limitation in this type of study where some concepts (such as
capital depreciation for hog production) are not standardized. In addition, this study did
not analyze the quality difference between the two countries. For example, the U.S.
soybean is considered superior to local varieties, having 2 percent to 2.5 percent more oil
content, more standardized seed size, and less foreign material. The comparability of
pork quality in the different production systems is also uncertain.

References
Barkema, A., M. Drabenstott, and L. Tweeten. 1990. “The Competitiveness of U.S. Agriculture in the 1990s.” In Agricultural Policies in a New Decade. Edited by Kristen Allen. Washington, D.C.: National Center for Food and Agricultural Policy and Resources for the Future.
Beghin J., D. Roland-Holst, and D. van der Mensbrugghe. 2002. “Global Agricultural Trade and the Doha Round: What Are the Implications for North and South?” CARD Working Paper 02-WP-308. Center for Agricultural and Rural Development, Iowa State University. June.
China’s National Statistical Bureau. Various issues. China Statistical Yearbook. (Zhongguo Tongji Nianjian, various issues). Beijing, China.
Fabiosa, J., C. Fang, F. Fuller, J. Hansen, and H. Matthey. 2001. “Assessing China’s Capacity to Expand Meat Imports under WTO Accession: Policy Issues and Transportation-Logistic Constraints.” Food and Agricultural Policy Research Institute, field trip report to the U.S. Department of Agriculture.
Fang, C., and J. Beghin. 2000. “The Impact of Exchange Rate on Chinese Agricultural Comparative Advantage.” Paper presented at the 24th International Conference of Agricultural Economists, Berlin, Germany. June.
Fang, C., F. Fuller, M. Lopez, and F. Tuan. 2000. “Changes of Livestock Feeding in China: With Emphasis on Hogs.” International Agriculture and Trade Report: China, Situation and Outlook. WRS-99-4, U.S. Department of Agriculture, Economic Research Service. March.
Fuller, F., J. Beghin, S. De Cara, J. Fabiosa, C. Fang, and H. Matthey. 2001. “China’s Accession to the WTO: What Is at Stake for Agricultural Markets?” CARD Working Paper 01-WP 276, Center for Agricultural and Rural Development, Iowa State University. June.
Glaze, D., and R. Schoney. 1995. “Comparison of Costs of Wheat Production in Saskatchewan and the U.S. Northern Plains.” Canadian Journal of Agricultural Economics 43: 367-85.
Hayes, D. J., and R. Clemens. 1997. “The Chinese Market for U.S. Pork and Pork Variety Meats.” U.S. Meat Export Analysis and Trade News. Meat Export Research Center, Iowa State University. February.
Jolly, R., and S. Lence. 2000. “Value-Added Land Values.” Choices First Quarter, pp. 18-23.
Le Stum, H., and D. Camaret. 1990. “European Community Experience in Costs of Producing Wheat.” American Journal of Agricultural Economics 72: 1298-1303.
Ortman, G. F., V. Stulp, and N. Rask. 1986. “Comparative Costs of Agricultural Commodity Among Major Exporting Countries.” Working Paper 1325. Department of Agricultural Economics and Rural Sociology, Ohio State University.
Qin, X. D., and W. Amponsah. 2001. “The Outlook of U.S.-China Pork Trade Under the U.S. –China Relations Act.” In the proceedings of the Western Coordinating Committee (WCC-101) annual meetings, Sonoma, CA, April 8-10.
Does the U.S. Midwest Have a Cost Advantage Over China in Producing Corn, Soybeans, and Hogs? / 27
Sharples, J. A. 1990. “Cost of Production and Productivity in Analyzing Trade and Competitiveness.” American Journal of Agricultural Economics 72(MONTH): 1278-82.
Stanton, B. F. 1986. “Production Costs for Cereals in the European Community: Comparisons with the United States, 1977-1984.” Dep. Agr. Res. Bull. No. 86-2, Cornell University, March.
Schertz, L., and W. Johnston. 1998. “Landowners: They Get the 1996 Farm Act Benefits.” Choices, First Quarter 1998.
Wailes, E., C. Fang, X. Zhang, L. Cao, H. Cheng, Z. Wu, and J. Guo. 1998. “China’s Livestock Feed Use Relationships: Preliminary Results from a Survey in Seven Provinces.” In Food Markets in China: New Looks and Deeper Understandings. In proceedings of the Western Coordinating Committee (WCC-101) annual meetings, Honolulu, Hawaii, Washington State University IMPACT Center, January 12-13.
World Bank. 2000. World Development Indicators. Washington, D.C.
———. 2001. World Development Indicators. Washington, D.C.