Embed Size (px)
Citation preview

DOES THE UNDERGROUND ECONOMY HOLD BACK
FINANCIAL DEEPENING? EVIDENCE FROM THE ITALIAN
CREDIT MARKET
Giorgio Gobbi* and Roberta Zizza*
Abstract
The paper investigates the relationship between underground activities and financial deepening. The
access to external finance requires entrepreneurs to disclose credible information through formal
documentation. This requirement may be impossible to oblige to for many informal producers who
lack a proper book-keeping of their operations. For the same reason irregular workers may find
difficult to borrow for financing both consumption and housing purchase. Using panel data on Italian
regional credit markets we find a strong negative impact of the share of irregular employment on
outstanding credit to the private sector. According to our estimates a shift of 1 per cent of the
employees from regular activities to irregular ones corresponds to a decline of about 2 percentage
points in the volume of business lending and of 0.3 percentage points in outstanding credit to
households, both expressed as ratios to GDP. Conversely, the feedback effects from financial
deepening to the size of the informal sector are weak and statistically not significant. Through a
difference-in-difference approach exploiting the regularisation program for immigrant workers
launched in 2002 we also identify a negative effect of the irregular labour on banks’ entry decisions in
the local credit markets, now defined in terms of provinces.
JEL classification: G21, O17, R23.
Keywords: irregular employment, bank lending, school drop-out, entry, branching, regularisation
program.
* Bank of Italy, Economic Research Department. We wish to thank Guy Michaels and Barbara
Petrongolo for useful comments and audience participants at the “New Developments in
Macroeconomic Modelling and Growth Dynamics” conference (Faro, September 2006), at the “XV
International Tor Vergata Conference on Banking and Finance” (Rome, December 2006) and at the
Centre for Economic Performance, London School of Economics (February 2007). The opinions
expressed do not necessarily reflect those of the Bank of Italy or its staff. Address for
correspondence: Via Nazionale 91, 00184 Rome, Italy. Email: [email protected],

2
1. Introduction
Shadow or underground1 economic activity accounts for a sizeable proportion of
employment and output in emerging market economies and in developing countries. Rates of
participation in the unofficial economy are quite high also in several developed countries. An
extensive literature has explored measurement issues and causes of this phenomenon
(Schneider and Enste, 2000; Schneider, 2006). A recent strand of research has moved to
assess the relationships between the informal activities and the regular sectors of the
economy. This paper contributes to this area and provides an analysis of the impact of the
informal economy on the amount of credit granted by banks and other financial
intermediaries (OFI) to business firms and households. A negative correlation emerges when
one looks at cross-country data referred to high-income OECD members2 (chart 1). If such an
impact is significant, the size of the informal sector may be well regarded as a factor affecting
the different development of credit markets across time and across countries. This would
provide new insights with respect even to the most recent literature, which so far has pointed
to the role played by institutions in explaining cross-country heterogeneities (see, for
example, Djankov et al., 2005).
The relationship between the underground economy and the credit market has been
rarely investigated in the economic literature, both from a theoretical and an empirical
perspective. Usually the exclusion from the official financial markets is mentioned among the
costs that firms bear from being informal. The access to finance requires entrepreneurs to
disclose credible information about their activities through formal documentation; this
requirement may be impossible to oblige to for many informal producers who lack a proper
book-keeping of their operations.
The constraints faced by irregular firms in raising funds are also often referred to as a
rationale for the anti-cyclical behaviour of the underground economy. The scarcity of capital
at disposal of the informal entrepreneur makes it more difficult to invest, sometimes forcing
1 By underground economy we mean those activities (production, labour) which are deliberately concealed to
the public authorities in order to escape the payment of taxes and social contributions or to avoid having to meet
legal standards (minimum wages, number of hours worked, safety and health standards, and so on; OECD
(2002)). The terms ‘underground’, ‘shadow’, ‘informal’, ‘irregular’, ‘hidden’ will be here considered as
synonyms and used thereafter interchangeably. 2 The comparison has been restricted to the subset of OECD members classified as ‘high income’, arguably
representing a more homogeneous panel of countries.

3
him to operate a low productivity technology, thus depressing the economic growth also
during the expansionary phases. If irregularity is regarded as a transitory state for “infant”
activities (so-called “development shadow sector” view, as opposite to “marginal shadow
sector”), an irregular firm which is credit constrained could be locked-in in an irregularity
trap and never unfold its productive potential.
Household access to credit can also be affected by the size of the underground
activities. Irregular workers may be unable to provide to banks and other financial institutions
the documentation that supports their ability to service the debt. Furthermore, in areas
characterised by high rates of irregularity it is likely that an above average number of
dwellings are not fully complying with the relevant laws and are not eligible assets as
collateral.
Both supply and demand effects presumably play a significant role, unambiguously
pointing to a negative relationship between credit granted and the size of the shadow sector.
On one side enterprises and households involved in irregular activities do not demand credit
because they are not able to provide assets fully eligible as collateral or cannot meet the
minimal informational requirements to be risk-assessed in the official credit markets. On the
other hand a negative externality may arise as the opaqueness of irregular activities in a local
credit market could spill over to the regular sector and reduce the overall ability of banks to
screen and monitor borrowers. This is likely to occur when the borderline between regular
and irregular activities is fuzzy as in the case where a large number of firms operate only
partially underground.
We investigate the relationship between the underground activities and the
development of the credit market relying upon data for the Italian economy since the mid-
Nineties. There are several reasons for choosing Italy. First of all, that country presents a high
rate of irregular labour when compared to other industrialised countries. Also there is a
substantial geographical heterogeneity to be exploited and to be explained, as standard
arguments for heterogeneity delivered in cross-country analyses (e.g. differences in fiscal and
regulatory burden, in institutions and in legal settings) should not apply to a within-country
context.
We perform two different exercises.
First, using panel data techniques applied to regional data we relate the bank credit to
GDP ratio to the share of irregular workers over total employment in the private sector. The

4
opposite direction of causality, running from the availability of credit to the extent of the
shadow sector, is taken into account as well. We take care of relevant endogeneity problems.
As expected we find that there is a strong negative link between these two variables and that
a non negligible proportion of the regional variation in the bank credit to GDP ratio both for
firms and households can be traced back the size of the irregular activities. The same pattern
also emerges whenever we enrich the analysis with the loans extended by other financial
institutions. On the contrary we do not detect any significant feedback effects from the credit-
GDP ratio to the rate of irregular work.
Second, we evaluate if entry decisions by banks into local markets are affected by the
extent of the irregular employment; this allows us to identify if there are supply effects at
work. Through a difference-in-difference approach, exploiting the exogenous variation
induced by a regularisation program for immigrant workers launched in 2002, we estimate a
negative effect of the size of the underground sector on the number of new bank branches.
We interpret this result as evidence of a negative externality brought about by the
underground economy. Owing to information asymmetries and transaction costs, the reach of
retail banking markets is rather limited and the entry deterrence exerted by informal activities
can restrain the supply of banking and financial services to small business enterprises (SMEs)
and to households.
The paper is organised as follows. In section 2 we briefly review the existing literature.
In section 3 we illustrate the development and the structural characteristics of the
underground economy in Italy. In sections 4 and 5 we discuss the data, describe the empirical
strategy and present estimates with regard respectively to the credit and to the entry
equations. In the last section we conclude pointing to the future extension of the research.
2. The underground economy and the credit market
Business firms’ accounts, balance sheets, salary pay slips and other records provide
basic information to financial intermediaries for gauging the credit worthiness of the would-
be borrowers. Firms who hide part of their activity and accordingly counterfeit the accounts
in order to escape from tax obligations can therefore be unable to raise external finance in the
official credit markets. The very same constraints could also be binding for other sources of
financing, such as the resort to the capital market, although this is an option not very common
for small and medium sized firms, among which those operating informally are mainly

5
concentrated. This very simple idea is the starting point of virtually all of the relative small
number of papers, which have addressed the issue of the relationship between irregular
economic activities and the financial sector.
In Johnson et al. (2000) the variable ‘financing’ is put on the right-hand side of a
regression for the underground economy in a panel of transition countries. ‘Financing’,
measured as the percentage of firms who received credit in a given time range, is found to
have no impact on the decision to operate underground. However, all enterprises included in
the sample are known to the authorities, hence their activity is in the worst case only partially
hidden, allowing them somehow to access the official financial system.
A few recent papers have included the banking sector in a general equilibrium model
with a shadow economy. Dabla-Norris and Feltenstein (2005) model the cost of operating
underground in terms of limited ability to borrow from the banking system. A simulation
carried out on data from Pakistan shows that as the government moves to a high tax regime,
firms at a first stage move partially into the underground economy; then, they gradually move
back into the legal economy due to the fact that since they are not paying taxes, their credit is
restricted and hence the availability of capital. On the other side, a low tax regime eliminates
underground economy and reduces credit rationing, but it is not sustainable over time, as both
the budget and the trade deficits deteriorate.
Antunes and Cavalcanti (2007) also propose a general equilibrium model where the
benefit from being formal is a better access to outside finance; since projects and assets in the
irregular sector are not adequately documented, they cannot be turned into capital or cannot
be used as collateral for a loan. Each individual has three occupational options – being either
a worker, or a formal or an informal entrepreneur - and the choice depends on the quality of
his project (“ability”) as well as on his bequests. Only high productivity projects are chosen
by formal entrepreneurs. A calibrated version of the model allows to evaluate how much of
the difference between United States and Southern Europe in the extent of the informal sector
is attributable to entry barriers (regulation costs) and credit market imperfections
(enforcement of financial contracts). They find that the former accounts for most of this
difference.
Straub (2005) presents a model linking the choice to operate in the shadow economy to
the initial endowment of capital, to the efficiency of the credit market and to the costs of
registering formally; some extensions also allow to test whether this decision could be

6
affected by the quality of the enforcement system, the volatility of the economy and the
degree of rigidity of the labour market. The empirical evidence, based on cross-country
enterprise-based data, gives credit to the idea that becoming at least partially formal and
accessing the formal credit market is a joint decision.
Being informal could imply not only limits in the size of the credit granted, but possibly
a higher cost of borrowing, whereas the features usually characterising irregular firms - small
size, opaqueness, scarce capital endowment, simple internal organisation - induce financial
intermediaries to classify them among the riskier activities. This higher cost can consist in
either a higher interest rate or more assets pledged as collateral for the credit granted. Some
authors have assumed the existence of a specialisation among lenders in the private credit
market, whereas non-bank intermediaries seem more prone to lend at a higher interest rate to
those rationed by banks (Carey et al., 1998). Under this view, irregular firms should
frequently recur to the first kind of intermediaries.
Albeit the extant literature provides useful insights and valuable pieces of evidence, to
our knowledge there are no papers which provide systematic empirical support of the links
between the credit and the underground sectors. This could also be due to the scarcity of
reliable data on the shadow economy. In what follows we try to establish some basic
quantitative relationships on which to foot further research.
3. Size and structure of the underground economy in Italy
The underground economy flourishes in many advanced and developing countries.
Several causes have been listed in the literature to justify the level and the growth of this
phenomenon: high level of taxation and complexity of the fiscal system; inefficiencies of the
institutional environment (auditing, law enforcement, judicial system); cultural acceptance
and lack of tax morality; excess of regulation and bureaucracy; high fragmentation of the
industrial structure; specialisation in labour intensive productions and growing demand
especially for labour-intensive services; increased volatility in the economy3.
Among the industrialised countries the shadow economy is of great magnitude in Italy,
where - according to the estimates published by the National Statistical Institute (Istat) - the
value added produced by the irregular sector in 2003 was equal to about 15-17 as a
3 See Roma (2001), Zizza (2002) and Lucifora (2003) for an extensive discussion of these issues.

7
percentage of total GDP. The underground sector also accounted for about 13 per cent of the
total employment, measured in terms of standard labour units; it was equal to 11 per cent in
1980.
These estimates are the official ones, delivered by Istat within the framework of
national accounts in order to ensure the exhaustiveness of GDP estimates. They are obtained
by comparing several sources of information (such as surveys of firms and households,
census, administrative data, and so on) and, after allowing for pertinent conceptual
differences, giving economic meaning to relevant discrepancies detected (see Istat, various
years).
Data on the underground economy available at a national level basically account for
hidden labour, income understatement (either by overstating costs or understating revenues)
and missing activities due to statistical reasons: illegal or criminal activities are not included,
as it is not yet current practice to make explicit adjustments for them in the national accounts,
due to the uncertainty and the poor quality of the estimates (OECD, 2002). At a regional
level, moreover, only measures of the hidden labour are released. So, henceforth we will refer
to a narrower concept of shadow economy, given by the ratio between the irregular number
of standard labour units and the total (regular plus irregular) number of standard labour units;
besides, in Italy it represents the most important component. We have re-elaborated the data
published by Istat in order to derive a rate of shadow employment in the private sector
excluding from the denominator the labour force employed by the Public Administration,
which we believe it is a more meaningful indicator of the actual weight of the irregular work
in the economy.
The distribution of the underground labour in Italy is heterogeneous both at a sectoral
and at a regional level. There are some economic activities which are more prone to employ
irregular workers: the agriculture and the tertiary sectors (net of the Public Administration)
display a high concentration (33 and 16 per cent, respectively). The intangibility of the
activity performed, the reduced physical capital endowment and the small size of most firms
operating in the services sector are all factors that make it easier for the underground
economy to proliferate. Within the industrial sector, characterised as a whole by a low
incidence (about 5 per cent), labour intensive sectors - such as textiles and clothes, leather
and shoes - are those where the phenomenon is more relevant. Regions in the South of Italy
are more affected, with rates of employment in the irregular sector in some cases higher than
25 per cent. In 2002, albeit the size of the irregular employment declined at a national level,

8
the divide between the Centre-North and the South widened: this divide can only by a small
extent being explained by the different sectoral composition, as the regions where the size for
the whole economy is higher also exhibit systematically higher rates in each sector
(Cappariello and Zizza, 2004).
4. Modelling the amount of credit granted in regional markets. Is there a
role for underground labour?
4.1 Data and empirical specification
Our empirical test is based on the specification of a set of regressions where the credit
to GDP ratio (y) is a function of the measure of the irregular employment in the private sector
(IRR), of J variables describing the local economy (LEj, j = 1,…,J) and of K structural
indicators related to the banking industry (BIk, k = 1,…,K). We include region-specific fixed
effects (xi) to take into account structural differences in the economies at the local level and
other characteristics that are persistent over time and not captured by our control variables
(for example, cultural differences or initial conditions). Common (economy-wide) time
patterns across regions are accounted for by year dummies (zt). Thus the basic equation to be
estimated is:
[1] yit = α +βIRRit +ΣjχjLEjit +ΣkδκBIkit + xi + zt + eit
The dataset constructed for this paper refers to the 20 Italian regions over the period
1995-2003. We assume the region as our definition of local banking markets; regions are,
besides, the boundaries considered by Italian antitrust regulation on credit markets.
As our dependent variable, we choose alternatively the following credit aggregates as
ratios to GDP: i) outstanding credit to the non-financial business sector including both
corporate and non corporate enterprises; ii) outstanding credit to the small firms with less
than 20 employees registered as individual firms or partnerships; iii) outstanding credit to the
consumer households.
We alternatively consider bank lending or bank lending compounded to the loans
granted by non-bank financial institutions. The extension to non-bank financial
intermediaries is meant to check whether it is possible to uncover substitution effects on the

9
supply side of the credit market. Data on credit granted by non-bank financial institutions are
available for the period 1997-2003 and only for those supervised by the Bank of Italy which
are the largest ones and presumably account for a large share of non-bank lending.
A proper measure of the impact of IRR on the amount of credit granted to small firms
would require a suitable scale factor like their share in terms of total output. Unfortunately we
do not have such a measure, so we use total GDP and this makes less clear-cut the
interpretation of the estimated coefficient of IRR in [1], due to two different factors. The first
one is the negative effect of the shadow economy on credit markets discussed so far. The
second one stems from the fact that a large share of irregular workers are employed in small
firms, and hence the magnitude of the irregular activities is likely to be negatively correlated
with average firm-size but positively with the weight of small firms.
In charts 2 and 3 we present scatters of outstanding bank lending to firms and
households, respectively, in relation the size of the irregular workforce in 2003. The
correlation is negative and quite strong, although a number of factors are likely to influence
both the extent of credit and of the irregular employment.
The set of variables accounting for the local economic conditions includes the log of
per capita GDP (LNGDPPC), the lagged average size of enterprises (SIZE), the lagged shares
of the agriculture, the construction and the service sectors in terms of value added
(SHAREAGR, SHARECON, SHARESER respectively) and a measure of the efficiency of the
judiciary system (ENFORCE).
The inclusion of LNGDPPC is quite standard in cross-country regressions where the
credit-to-GDP ratio stands on the left-hand side (see Cottarelli et al., 2005, for a recent
example). The idea is that outstanding credit is a measure of financial deepening and that
financial deepening is correlated with overall economic development approximated by per
capita GDP; faster growing regions should have a higher demand for credit. Moreover, is
meant to serve also as a proxy for labour productivity.
Firm size is measured as the average number of employees in the private sector.
Sectoral value added shares account for changes in output composition that can induce
changes in the demand of credit by firms. The variable ENFORCE is computed as the
average number of days that it takes a bankruptcy procedure to be worked out in courts. The
importance of the efficiency of the legal system in determining the development and the
functioning of credit markets has been extensively explored in the literature (see Djankov et

10
al., 2005, for a recent investigation of this issue based on cross-country data); specifically to
our point, Bianco et al. (2005) produce empirical evidence that in Italian provinces with
longer trials or large backlogs of pending trials, credit is less widely available.
We have included two controls for the structure of the banking industry. The first one is
the standard Herfindahl market concentration index (HERF), computed using the shares of
branches. As long as market concentration is correlated with the level of competition in the
market, we expect the estimated coefficient of HERF to show a negative sign. The second
one is a measure of branch density (BRANCHPC) given by the number of bank branches by a
thousand of inhabitants. Several studies have shown that physical proximity between lenders
and borrowers can help to alleviate problems arising from asymmetric information4. Hence
the density of bank branches is expected to be positively correlated with the overall
availability of credit.
Table A1 in Appendix A contains a synoptic presentation of the variables used in the
regressions and their descriptive statistics.
4.2 Concerns and solutions for the endogeneity of the irregularity rate
The variable IRR in equation [1] is likely to be endogenous for several reasons. First,
from a microeconomic perspective both the amount of credit demanded by firms and the
quantity of irregular work employed originated from the same decision making process. As
an example one can imagine of a firm which can choose between two technologies. The first
one is a capital intensive production plan which requires external finance and though has to
be run employing workers regularly registered. The second one is a labour intensive activity
for which credit is not required and irregular work can be employed. The decision of
demanding credit and of employing irregular workers is one and the same.
A different issue is that, as predicted by some theoretical models (e.g. that built by
Straub, 2005) an ampler supply of credit may mitigate the costs of being formal or reduce the
convenience to go underground; hence the causality link between credit and the rate of
irregularity may run in both directions.
Tackling these problems is a very difficult task because of the intrinsic opacity of the
informal sector, which dramatically reduce the number of potential truly exogenous variables
4 See Bofondi and Gobbi (2006) for a detailed discussion of the issue.

11
which can be used as instruments. In fact, several variables which are supposed to influence
the development of the underground economy (for example, the unemployment rate, the level
of productivity, the firm size) are also expected to be linked to the extension of credit. The
identification of a proper instrument is particularly difficult when dealing with geographical
areas - such as the Italian regions - a priori characterised by the same institutional and legal
settings.
Endogeneity should arise mainly when dealing with measures of credit granted to firms.
The occupational choice of workers - remaining regular versus going underground - seems in
fact harder to be put in connection with the availability of funds: obviously an agent could be
induced to search for a job if he can borrow neither from banks, nor from other financial
institutions, but in our view this should not introduce a preference for an irregular work
position.
In the set of regressions referred to firms our strategy to cope with endogeneity
consists of resorting to an instrumental variable approach, as well as of estimating a
simultaneous two-equation model. The latter specification, besides, allows us to assess
whether the relationship between credit and underground labour is one or two-way.
As an instrument for the rate of irregular employment the rate of drop-out at the second
year of the secondary school (DROPOUT) seems a good candidate5, on the grounds of a strict
connection between the educational attainment and the employment opportunities. On the
supply side, low-skilled workers are plausibly less choosy and could often find themselves in
need to accept also an irregular position; on the demand side, areas characterised by a low
level of education of the labour force may suffer from a negative externality inducing firms to
increase revenues by evading taxes and eluding laws rather than by adopting new
technologies.
A preliminary look at the data confirms that the rate of school drop-out is positively
correlated with the size of the underground labour across regions (see chart 4, referred to year
2003). Findings from previous research corroborate our choice. Boeri and Garibaldi (2002),
using an ad hoc survey carried out in Sicily, an Italian region where the underground
economy is traditionally flourishing, found that irregular jobs involve mainly workers at the
5 The rate of dropout at the first year (corresponding to an age of 14 according to the Italian education system) is
also available, but since in Italy – in compliance with the ILO standards - labour is forbidden to those aged less
than 15, we preferred to deal with a more consistent measure, accounting for the education choices of those
already eligible for employment.

12
lower end of the skill distribution. This is also supported by the sectoral breakdown reported
in section 3, as the underground labour is particularly diffuse in the agriculture, in the
construction sector, in the services to households and in labour intensive manufacturing
branches. Later the same authors have been able to confirm these results nationwide on the
basis of two other sources of information: the Istat Labour Force Survey and the Bank of Italy
Survey of Household Income and Wealth (Boeri and Garibaldi, 2005). Ahn and de La Rica
(1997) observe for the Spanish economy that education increases the probability of working
in the formal sector.
In order for our instrument to be relevant we need its partial correlation with the
endogenous regressor to be different from zero.6 Moreover, it is plausible that the schooling
achievement of the entrepreneur (in case of an individual firm) or of the workforce of a firm
asking for a loan is a parameter which is not used by banks to gauge the credit worthiness of
the would-be borrowers; after conditioning on some covariates, it is arguably uncorrelated
with other determinants of the extent of credit.
We formally tested for endogeneity by using the regression-based form of the Hausman
test (Wooldridge, 2002). Results broadly confirmed our a priori beliefs: the null hypothesis of
exogeneity was strongly accepted for credit granted to households, while we detected
endogeneity at the 10 per cent significance level for credit granted to firms.
In the simultaneous equation model DROPOUT is included as a determinant of the rate
of underground employment; the same set of variables accounting for the local economic
conditions in equation [1] is considered. Thus, the model is composed of equation [1] and of
the following one, with all symbols as explained above:
[2] IRRit = α +βyit +ΣjχjLEjit +δDROPOUTit + xi + zt + eit.
The expected sign of the coefficient for DROPOUT is positive, that for outstanding
credit - if a feedback effect should emerge - negative.
6 It could be argued that it is not the drop-out causing the underground economy, but that the reverse causality
direction occurs. Drop-out variable hence features with a lag in the first stage equation; moreover, we have
tested this line of reasoning against the data provided by the Survey of Household on Income and Wealth carried
out by the Bank of Italy (results are available from the authors upon request). Using data from surveys run from
1998 to 2004, the probability of dropping out of secondary school has been found not to depend on the size of
irregularity in the region, after controlling for parents’ education, parents’ occupation and time and region fixed
effects.

13
4.3 Empirical results
The results of the bank credit to GDP ratio regressions for non-financial firms are
reported in Table 1. The first four columns (A-D) refer to all the enterprises and the other (E-
H) to the smaller ones, i.e. partnerships and family-owned businesses employing less than 20
employees. For each definition of firms we have estimated a simple two-way fixed effects
model, an instrumental variable (IV) version of it and a simultaneous equation model using
three-stage least squares (3SLS). Because of the endogeneity problems discussed above we
restrict our comments to the last two models.
The first robust result is that our measure of the importance of the shadow economy
(IRR) has a large impact on bank lending to the overall business sector. From the IV
regression it emerges that a one percentage point shift in the regional employment from the
regular to the irregular sector leads to a reduction of the bank credit to GDP ratio of 2.1
percentage points (Table 1, column B). According to our estimates moving from the first
quartile to the third quartile of the distribution of IRR in our sample the effect on the
dependent variable is of 15 percentage points which compares with an interquartile range of
the bank credit to GDP ratio of 19 percentage points (Table A1).
As expected when we restrict to the small enterprises we find that the impact of the
irregular activities on credit is not statistically different from zero in the IV regression (Table
1, column F). We interpret this outcome as a balance between the depressing effect of the
shadow economy on the size of the credit market and the larger weight of semi-irregular
small firms in the regions where the resort to irregular employment is more intense.
The signs of the estimated coefficients for the variables controlling for the structural
characteristics of regional credit markets turn out as expected in all the specifications and
their magnitudes change very little. The market concentration index is negatively correlated
with the total amount of credit and, on the contrary, loans are more abundant where the
density of bank branches is higher. The pattern of coefficients of the variables intended to
control for other regional economic variables is less crystal clear. The log of per capita GDP
(LNGDPPC) has the expected sign, albeit not statistically different from zero, in the IV
regression for lending to all of the non-financial firms (Table 1, column B), but it is negative
(and statistically different from zero) in the IV regression for lending to small firms. This
may be interpreted as the effect of a negative correlation between the importance of small
firms and the level of per capita output. The coefficients of the variables SIZE and ENFORCE

14
are never statistically different from zero in the IV regressions. This may reflect their limited
longitudinal variability over the sample period. DROPOUT serves as a relevant instrument
for the rate of irregular employment, showing a largely significant coefficient in the first-
stage regression7 (Table 1, columns B and F).
In Table 1, columns C and D we report the results of the 3SLS estimation aiming at
uncovering feedback effects from the availability of credit to the size of the irregular sector.
The pattern of the coefficients in the credit equation (column C) is coherent with the one
obtained from the IV regression. The effect of IRR on credit is again quite significant both
economically and statistically: a shift of 1 per cent of the employees from regular activities to
irregular ones corresponds to a decline of 2.2 percentage points in bank credit to GDP ratio.
In the equation for irregular employment (column D) the identification variable DROPOUT
enters with the expected sign and is strongly statistically different from zero. The feedback
effect from credit to the size of the irregular sector is not statistically significant. The
outcomes of 3SLS estimation of the model restricted to the small firms (columns G and H)
provide indications that are broadly in line with those from the IV regression, as for
specifications referred to the overall business sector. Our results then suggest that the link
between the underground economy and the size of the credit market is essentially one-way.
Table 2 reports the results of the regressions for the outstanding loans to all of the non-
financial firms granted by both banks and other financial institutions. Although the analysis is
very preliminary, the magnitude of the negative impact of the irregular economy on the size
of total lending is the same as that for bank lending. Loans from non-bank financial
intermediaries do not substitute loans from bank in the local economy where the size of the
irregular workforce is large. One explanation is that the kind of financial intermediaries for
which we dispose of data are by and large specialized in lending activities such as leasing and
factoring, which as in the case of banks require the borrowers to keep records hardly
available to irregular firms. Preliminary investigations, not reported here, seem to suggest
that the loans by non-bank financial intermediaries that are not related to factoring or leasing
activities tend to be positively correlated with the ratio of irregular workers.
Last, Table 3 contains the results of the tentative estimates of credit to GDP ratio for the
household sector from a simple two-way fixed effects model. Considering only bank loans,
the dependent variable in our sample ranges from 11 per cent to 17 per cent and the average
7 According to Stock, Wright and Yogo (2002) the F-statistic on the excluded instrument in the first-stage
regression must be above 10 to rule out weak instruments.

15
is 14 per cent (Table A1). Consumer credit and other loans granted by non-bank financial
institutions add some 3 percentage points to these figures. The size of the irregular sector has
a negative impact also on the total amount of borrowing of households, but we have some
clue that the effect is higher for bank loans. A shift of one percentage point of workforce
from regular to irregular employment reduces by 0.39 percentage points the bank credit to
GDP ratio for households. Including the loans by other financial institutions the fall of the
ratio is of 0.28 percentage points. As in the set of regressions for outstanding credit to
business firms, the market concentration index is negatively correlated with the supply of
credit to households and loans to households are more abundant where the density of bank
branches is higher.
5. Entry decisions by banks in local credit markets and underground
labour
In this section we investigate whether bank entry into local credit markets, here defined
in terms of provinces, depends on the extent of the underground economy. We address the
problem of endogeneity by using a regularisation program for immigrant workers launched in
2002 as an instrument for the irregular labour.
There are two forces that can induce a negative correlation between the size of the
irregular employment and the number of branches within a local market. The first one works
on the demand side: a high rate of irregular labour implies a low demand of loans and other
financial services both from the irregular employers and employees. The second one is that
irregular activities add to the informational opaqueness of local credit markets and by this
way they raise the costs of entry for outside banks (Gobbi and Lotti, 2004).
A negative impact of the irregular economy on the size of bank branch networks can
have negative welfare effects also for the regular sector. The number of banks and bank
branches operating in a local market is an important factor in determining the supply
characteristics of retail banking and financial services. Although advances in information and
communication technologies have enlarged the transaction facilities available to the
consumers, in most countries the vast majority of these services are still distributed by bank
branches. In particular, according to a large body of literature, close proximity between
lenders and borrowers reduce the attritions due to asymmetric information in lending to
opaque borrowers such as small business firms. Degryse and Ongena (2005) shows that loan

16
rates increase with the distance between the firm and competing banks owing to spatial price
discrimination induced by borrowers’ mobility costs. Brevoort and Hannan (2004) using data
on the US lending markets report that distance is negatively associated with the likelihood of
a local commercial loan being made. Bofondi and Gobbi (2006) find that banks lending from
outside the local markets in which firms are based experience default rates twice as large as
the insider lenders. Borrowers are not the only recipients of the benefits from bank branch
density. Bofondi and Paiella (2004) using Italian micro data show that the probability of a
household holding a bank account is positively correlated with the number of branches.
Finally whenever a large number of bank branches is economically viable in a local market it
is likely that several different banks are operating there, sweeping away monopolistic rents.
5.1 The regularisation program for immigrant workers in 2002
In Italy much effort has been put into combating undeclared work. Several policy
measures have been taken since the mid-Nineties (for a comprehensive review, see European
Commission, 2004). However, direct policy measures, that is interventions explicitly targeted
at the reduction of the underground economy, have produced disappointing results. Among
them, the introduction of the Realignment Contracts (implemented in 1996), the
establishment of the Committee for the emergence of the underground economy (1998) and
the Regularisation Campaign (2001-2003).8
There is some evidence that firms could have instead preferred indirect, more “hidden”,
methods of regularisation. Among them, in particular, the subsidies introduced in 1998 (in the
form of a tax credit) provided to firms that either hired a new worker with permanent
contracts or transformed a fixed-term contract into an open-end one.9 Many firms claiming
the tax credit in fact experienced a sharp, sudden, and quite suspicious, increase of the
number of workers.
A policy intervention that has been effective in bringing underground workers out of
the shadows is the regularisation program for unauthorised migrants launched in 2002 (No.
189, 30th
July 2002, so called Bossi-Fini Law). The program ran from September 2002 to
8 In particular, with the Regularisation Campaign the Government expected to regularise about 900,000
workers; at the end of the program, only 3,854 new workers benefited from the regularisation. 9 See Cipollone and Guelfi (2003) for a description and an evaluation of this policy measure. The tax credit was
introduced first by the Finance Law for the year 1998, then prolonged first until the end of 2003, and later until
the end of 2006. The bonus was first targeted to small firms in the South of Italy, and since the second regime
extended to all firms and to all regions, though remaining much more generous for Southern regions.

17
November 2002) and involved about 700,000 workers; about half of them were domestic
workers, the others were distributed among the agriculture, the construction, the tourism and
the manufacturing (mainly metallurgy, textiles and footwear industries) sectors. To apply a
migrant had to provide a proof of employment.
The effect on the size of the irregular labour is apparent from the data, as it is likely that
many of these immigrants were engaged in underground activities before the regularisation.
According to Istat, the irregularity rate decreased in 2002 by almost one percentage point
with respect to the previous year (from 15.1 to 14.2 per cent); it declined further to 13.4 in
2003, reaching the lowest level in the last ten years.
5.2 Data and empirical strategy
The outcome variable describing the entry decision by banks is given by the number of
new branches (both de novo banks and branching by existing banks10
; ENTRY) opened at the
level of the 103 Italian provinces for each year over the period 1996-2003.
We want to test here whether the size of the underground economy has an effect on the
branching decision and if this effect is, as we have discussed so far, negative. Also in this
case the problem of endogeneity must be addressed and again we resort to an instrumental
variable strategy. This time we take advantage of the implementation of the regularisation
program that is, conditional on a number of covariates, arguably uncorrelated with other
factors shaping the entry decision.
We use this policy intervention in a difference-in-difference setting, where
identification is achieved by differentiating the outcome variable between a “treatment” and a
“control” group, observed pre and post treatment.11
The regularization program involved all the Italian provinces; however, its impact has
been very heterogenous across them12
, giving thus the chance to define “high program” and
“low program” areas. As in Duflo (2001), this distinction is made according to the sign of the
residuals in a regression able to take into account how intense the program was in each
10
We excluded banks that enter by acquiring an existing bank as the acquired bank was already in the market
though under a different ownership. 11
The tax credit policy would be a more questionable instrument, as the regions benefiting from it were those
where the underground economy is more diffuse, representing de facto an endogenous intervention. Moreover,
its period of application was very long, and hence its effects presumably too diluted to be appreciated in the
data.

18
province. Specifically we regressed the number of regularised workers on the number of
persons employed and on the province surface (see Appendix B).
In the absence of the program, we expect the banks’ behaviour in terms of branching
not to be systematically different in the two groups. In order to perform this falsification (or
placebo) exercise we will also compare treatment and control groups in period 1996-1998
versus period 1999-2001.
Descriptive statistics of the treatment and control groups are in table 4. A preliminary
look at the data seems not to corroborate our prediction. On one side, as reported before, the
rate of irregularity in treated provinces experienced a sensible decrease after the intervention.
On the other, the average number of branches opened in the period 2002-2003 (post
treatment period) was equal to 9.5, which compares to an average of 11.6 in the three
preceding years (pre treatment period); the number of new branches decreased both in the
treatment and in the control groups in the post-treatment period. However this descriptive
analysis fails to take into account the cyclical position of the Italian economy in the period
under exam (see chart 5). Post-treatment period was characterised by stagnation (0.3 per cent
growth on average), that contrasts with sustained growth (above 2 per cent) recorded in the
pre-treatment period. Moreover, as the intervention was launched in the second half of 2002,
and as banks take some time to charter new branches, it is likely that the actual post-treatment
period started later (i.e. in 2003).
We then need a more formal analysis that keeps into account conditioning variables.
Moreover, we will also consider only year 2003 as post-treatment period. We perform both
reduced and structural form estimates of the relation between bank branching and the
regularisation program. In the reduced form equation we regress the number of new branches
on the instrument I, on a set of covariates and on market and year fixed effects:
ENTRYit = α +βΙit+ΣjχjCONTROLSjit + xi + zt + eit
where Iit = postt*treati; post is a dummy equal to one from year 2002 onwards (or in year
2003 only in our alternative exercise) and treat is a dummy equal to one for treated (“high
program”) provinces. Since the number of entries is a non-negative count data, we resort to
12
See in chart B1 in the Appendix B the distribution across provinces of the ratio between the number of
regularised workers and the stock of employment.

19
the traditional Poisson regression model; to deal with overdispersion13
we scale the standard
errors using the square root of the Pearson Chi-square distribution.
In the structural model the number of new branches is instead set to depend on the
irregularity rate (IRRP), on a bunch of covariates and on market and year fixed effects:
ENTRYit = α +βIRRPit+ΣjχjCONTROLSjit + xi + zt + εit ;
in addition, in the first stage we estimate the effect of the instrument on the irregularity rate,
with symbols as above:
IRRPit = α +βIit+ΣjψjCONTROLSjit + xi + zt + ξit .
As further determinants of the entry we include standard characteristics of the market
(see for example Amel and Liang, 1997). In particular, we have a measure of the size of the
market in terms of population (POP) and of the growth of this size (∆POP); the market per
capita income (GDPPC) and its growth (∆GDPPC); the number of branches already existing
in the market at the beginning of the period (BRANCHES); an indicator of profitability, given
by the spread between interest rates on active and passive operations (SPREAD); an indicator
of market concentration, measured by the Herfindahl index computed using the share of
branches (HERF).14
Table B1 presents definitions and descriptive statistics of the variables
used in this section.
5.3 Empirical results
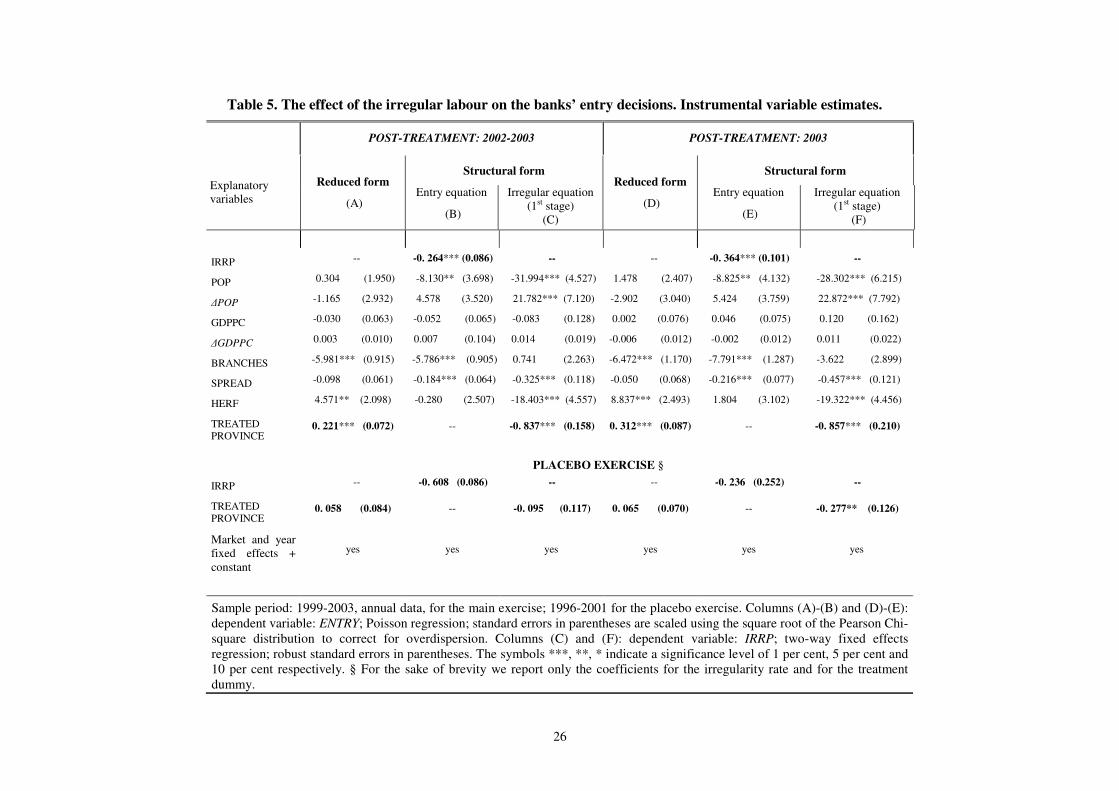
Table 5 summarises the results of the different estimates performed. If both 2002 and
2003 are kept as post-treatment period and if we take the period 1999-2001 as the pre-
treatment period we obtain that, as expected, in the structural form the irregularity rate affects
negatively the number of new branches (-0.264; column (B)); the treatment has in turn a
significant and negative relationship with the irregularity rate in the first stage (column (C)).
A one percentage point decrease of the irregularity rate should on average reflect in almost 3
13
As it often happens with count data, also our outcome variable exhibits a variance that is much larger than the
mean, hence violating the property of equidispersion that is typical of the Poisson distribution. 14
As the index is calculated on the basis of branches, it is introduced with a lag of one year to avoid endogeneity
problems.

20
additional new branches per province.15
Looking at the reduced form the results are in the
same direction, as the regularisation dummy exhibits a positive coefficient (column (A)). The
period 1999-2001 is then used as post-treatment period in the placebo exercise, with 1996-
1998 as pre-treatment period (in the bottom part of the table). No effect emerges from this
falsification exercise. As anticipated we have also restricted the post-treatment period to year
2003. Basically we get the same results, except for the fact that the deterrent effect of the
irregularity rate on bank branching is now a bit stronger (-0.364; column (E)), though not
statistically distinguishable from the coefficient retrieved in the first exercise. Again there is
no effect of the treatment in the placebo exercise except for the first stage, as the estimates of
the irregularity rate have incorporated the effects of the regularisation since 2002 (see Istat,
2005).
6. Conclusions
In this paper we have explored the link between the shadow economy and the credit
market. Notwithstanding a widespread belief that irregular activities prevent firms from
borrowing from the official market, systematic empirical evidence on the issue is scanty
because of the scarcity of data. Relying on a panel dataset of the Italian regions over the
period 1995-2003 we have attempted at a quantitative assessment of the constraints that the
shadow economy imposes on the amount of funds borrowed. Our results suggest that these
constraints are economically and statistically significant both for firms and households. The
heterogeneity in the size of the irregular employment across the Italian regions can explain a
large proportion of the variance in the credit to GDP ratio. On the contrary we haven’t found
sizeable feedback effect from credit to the shadow economy.
The impact of the underground labour on the development of the credit market has been
also evaluated in terms of branching by banks in Italian provinces. We have used a
difference-in-difference approach which exploits the exogenous variation induced by the
regularisation program for immigrant workers launched in 2002. This exercise shows that
irregular labour works as barrier to entry into local banking markets. We argue that this effect
is likely to have negative consequences on the supply of banking and financial services also
to the regular sector of the economy.
15
The average response to a one unit change in the j-th regressor is in Poisson regression models with intercept
equal to yjβ̂ (see Cameron and Trivedi, 2005).

21
Further research is required on several dimensions. Though we have been able to
identify a significant effect on the supply side of the credit market, the disentanglement of
supply and demand effects still deserves in our view a deeper analysis. Information on market
interest rates, credit supply stance and credit risk should be also brought into the picture.

Table 1. Credit and the irregular sector. Estimated coefficients from two-way fixed effects, IV and 3SLS regressions.
Dependent variable: bank loans to non-financial firms as a ratio to GDP
(CREDIT)
Dependent variable: bank loans to small non-financial firms as a ratio to
GDP (CREDIT)
3SLS 3SLS
Explanatory
variables
Two-way fixed
effects
(A)
IV
(B) Credit equation
(C)
Irregular
equation (D)
Two-way fixed
effects
(E)
IV
(F) Credit equation
(G)
Irregular equation
(H)
IRR -0. 922*** (0.225) -2.106*** (0.861) -2.245*** (0.787) -- -0.081 (0.059) 0.022 (0.198) 0.034 (0.183) --
CREDIT -- -- -- -0.000 (0.067) -- -- -- 0.130 (0.226)
LNGDPPC 0.114 (0.265) 0.381 (0.284) 0.385 (0.252) 0.220*** (0.062) -0.099** (0.052) -0.122* (0.065) -0.118** (0.058) 0.242*** (0.070)
HERF -0.576*** (0.176) -0.589*** (0.163) -0.504*** (0.137) -- -0.193*** (0.031) -0.192*** (0.038) -0.199*** (0.033) --
BRANCHPC 0.501*** (0.137) 0.478*** (0.126) 0.500*** (0.111) -- 0.116*** (0.034) 0.118*** (0.029) 0.118*** (0.026) --
SHAREAGR 1.243* (0.625) 0.341 (1.023) 0.140 (0.924) -0.725*** (0.268) -0.264 (0.173) -0.185 (0.235) -0.172 (0.215) -0.702*** (0.233)
SHARECON 0.404 (0.714) -0.292 (0.687) -0.374 (0.624) -0.536*** (0.147) 0.821*** (0.161) 0.882*** (0.158) 0.886*** (0.145) - 0.645*** (0.235)
SHARESER 1.436*** (0.416) 1.331*** (0.385) 1.233*** (0.344) -0.048 (0.148) 0.278*** (0.081) 0.288*** (0.088) 0.295*** (0.080) - 0.085 (0.125)
SIZE 0.002 (0.007) -0.002 (0.009) -0.002 (0.009) -0.005* (0.003) -0.001 (0.002) -0.000 (0.002) -0.000 (0.002) -0.005* (0.003)
ENFORCE -0.009 (0.031) 0.005 (0.026) 0.008 (0.024) 0.008 (0.007) -0.000 (0.004) -0.001 (0.006) -0.002 (0.005) 0.009 (0.007)
DROPOUT -- 0.002*** (12.6) § -- 0.002*** (0.001) -- 0.002*** (12.6) § -- 0.002*** (0.001)
CONSTANT -0.935 (0.810) -1.440* (0.782) -0.087* (0.048) -0.044*** (0.011) 0.147 (0.148) 0.193 (0.180) 0.015 (0.011) -0.048*** (0.012)
R2 0.72 0.66 0.64 0.42 0.64 0.63 0.62 0.40
Overall
significance: p-
value
0.00 0.00 0.00 0.00 0.00 0.00 0.00 0.00
Sample: annual data 1995-2003, 20 regions. Explanatory variables: IRR (irregular employment as a ratio to total employment, in the private sector); LNGDPPC
(log of per capita GDP, in the private sector); HERF (Herfindahl concentration index computed on branches); BRANCHPC (number of branches, per capita);
SHAREAGR (share of the agricultural sector, in terms of value added; with lag 1); SHARECON (share of the construction sector, in terms of value added; with
lag 1); SHARESER (share of the services sector, in terms of value added; with lag 1); SIZE (mean firm size; with lag 1); ENFORCE (average number of days
needed to complete bankruptcy proceedings; in logs, with lag 1); DROPOUT (rate of drop-out in the secondary school, with lag 1). As instrument for the rate of
irregular employment, DROPOUT was used. Robust standard errors are reported in parentheses. The symbols ***, **, * indicate a significance level of 1 per
cent, 5 per cent and 10 per cent respectively. Coefficients for time dummies are omitted for sake of brevity. § Coefficient of the instrument in the first-stage
regression; corresponding F-statistic in parenthesis.

23
Table 2. Credit and the irregular sector. Estimated coefficients from two-way fixed effects, IV and 3SLS regressions.
Dependent variable: bank and OFI loans to non-financial firms as a ratio to
GDP (CREDIT)
3SLS
Explanatory variables
Two-way fixed
effects
(A)
IV
(B) Credit equation
(C)
Irregular equation
(D)
IRR -0.968*** (0.243) -2.189** (1.011) -2.427*** (0.907) --
CREDIT -- -- -- -0.002 (0.115)
LNGDPPC 0.249 (0.306) 0.537 (0.342) 0.608** (0.292) 0.226*** (0.066)
HERF -0.514*** (0.191) -0.611*** (0.229) -0.282* (0.161) --
BRANCHPC 0.547*** (0.140) 0.550*** (0.156) 0.361*** (0.129) --
SHAREAGR 1.249* (0.670) 0.302 (1.153) 0.095 (1.038) -0.701** (0.345)
SHARECON 0.029 (0.812) -0.481 (0.690) -0.900 (0.664) -0.496*** (0.161)
SHARESER 1.044** (0.458) 0.962** (0.421) 0.862** (0.387) -0.041 (0.176)
SIZE -0.004 (0.009) -0.007 (0.012) -0.010 (0.011) -0.005 (0.003)
ENFORCE -0.001 (0.031) 0.014 (0.028) 0.011 (0.026) 0.009 (0.008)
DROPOUT -- 0.002*** (12.6) § -- 0.002** (0.001)
CONSTANT -1.076 (0.891) -1.658* (0.936) -0.107* (0.057) -0.045*** (0.012)
R2 0.77 0.72 0.66 0.38
Overall significance: p-value 0.00 0.00 0.00 0.00
Sample: annual data 1997-2003, 20 regions. Explanatory variables: IRR (irregular employment as a ratio to total employment, in
the private sector); LNGDPPC (log of per capita GDP in the private sector); HERF (Herfindahl concentration index computed on
branches); BRANCHPC (number of branches, per capita); SHAREAGR (share of the agricultural sector, in terms of value
added; with lag 1); SHARECON (share of the construction sector, in terms of value added; with lag 1); SHARESER (share of the
services sector, in terms of value added; with lag 1); SIZE (mean firm size; with lag 1); ENFORCE (average number of days
needed to complete bankruptcy proceedings; in logs, with lag 1); DROPOUT (rate of drop-out in the secondary school, with lag
1). As instrument for the rate of irregular employment, DROPOUT was used. Robust standard errors are reported in parentheses.
The symbols ***, **, * indicate a significance level of 1 per cent, 5 per cent and 10 per cent respectively. Coefficients for time
dummies are omitted for sake of brevity. § Coefficient of the instrument in the first-stage regression; corresponding F-statistic in
parenthesis.

24
Table 3. Credit to households and the irregular sector. Two-way fixed effects estimation.
Dependent variable
Explanatory variables
Bank loans as a ratio
to GDP
(A)
Bank and OFI loans
as a ratio to GDP
(B)
IRR -0.385*** (0.061) -0.276*** (0.055)
LNGDPPC 0.073* (0.051) -0.009 (0.051)
HERF -0.067* (0.037) -0.063 (0.062)
BRANCHPC 0.201*** (0.023) 0.155*** (0.029)
CONSTANT -0.103 (0.157) 0.132 (0.147)
R2 0.95 0.96
Overall significance: p-
value 0.00 0.00
Sample: annual data 1995-2003 for the first regression, 1997-
2003 for the second, 20 regions. Explanatory variables: IRR
(irregular employment as a ratio to total employment, in the
private sector); LNGDPPC (log of per capita GDP in the private
sector); HERF (Herfindahl concentration index computed on
branches); BRANCHPC (number of branches, per capita).
Robust standard errors are reported in parentheses. The symbols
***, **, * indicate a significance level of 1 per cent, 5 per cent
and 10 per cent respectively. Coefficients for time dummies are
omitted for sake of brevity.

25
Table 4. Characteristics of control and treatment group, pre and post-treatment.
Low program
provinces (control
group)
High program
provinces
(treatment group)
PRE - TREATMENT
ENTRY 9.9 13.1
IRRP 17.3 14.6
POP 6.03 6.01
∆POP -0.005 -0.002
GDPPC 14.6 16.6
∆GDPPC 2.6 2.3
BRANCHES 5.2 5.3
SPREAD 5.4 5.0
HERF 0.15 0.13
POST - TREATMENT
ENTRY 7.8 11.0
IRRP 17.0 13.1
POP 6.02 6.02
∆POP 0.004 0.01
GDPPC 15.1 17.0
∆GDPPC 0.12 -0.20
BRANCHES 5.3 5.4
SPREAD 5.7 5.3
HERF 0.15 0.12
Notes: POP and BRANCHES are in logs.
26
Table 5. The effect of the irregular labour on the banks’ entry decisions. Instrumental variable estimates.
POST-TREATMENT: 2002-2003 POST-TREATMENT: 2003
Structural form Structural form
Explanatory
variables
Reduced form
(A) Entry equation
(B)
Irregular equation
(1st stage)
(C)
Reduced form
(D) Entry equation
(E)
Irregular equation
(1st stage)
(F)
IRRP -- -0. 264*** (0.086) -- -- -0. 364*** (0.101) --
POP 0.304 (1.950) -8.130** (3.698) -31.994*** (4.527) 1.478 (2.407) -8.825** (4.132) -28.302*** (6.215)
∆POP -1.165 (2.932) 4.578 (3.520) 21.782*** (7.120) -2.902 (3.040) 5.424 (3.759) 22.872*** (7.792)
GDPPC -0.030 (0.063) -0.052 (0.065) -0.083 (0.128) 0.002 (0.076) 0.046 (0.075) 0.120 (0.162)
∆GDPPC 0.003 (0.010) 0.007 (0.104) 0.014 (0.019) -0.006 (0.012) -0.002 (0.012) 0.011 (0.022)
BRANCHES -5.981*** (0.915) -5.786*** (0.905) 0.741 (2.263) -6.472*** (1.170) -7.791*** (1.287) -3.622 (2.899)
SPREAD -0.098 (0.061) -0.184*** (0.064) -0.325*** (0.118) -0.050 (0.068) -0.216*** (0.077) -0.457*** (0.121)
HERF 4.571** (2.098) -0.280 (2.507) -18.403*** (4.557) 8.837*** (2.493) 1.804 (3.102) -19.322*** (4.456)
TREATED
PROVINCE 0. 221*** (0.072) -- -0. 837*** (0.158) 0. 312*** (0.087) -- -0. 857*** (0.210)
PLACEBO EXERCISE §
IRRP -- -0. 608 (0.086) -- -- -0. 236 (0.252) --
TREATED
PROVINCE 0. 058 (0.084) -- -0. 095 (0.117) 0. 065 (0.070) -- -0. 277** (0.126)
Market and year
fixed effects +
constant
yes yes yes yes yes yes
Sample period: 1999-2003, annual data, for the main exercise; 1996-2001 for the placebo exercise. Columns (A)-(B) and (D)-(E):
dependent variable: ENTRY; Poisson regression; standard errors in parentheses are scaled using the square root of the Pearson Chi-
square distribution to correct for overdispersion. Columns (C) and (F): dependent variable: IRRP; two-way fixed effects
regression; robust standard errors in parentheses. The symbols ***, **, * indicate a significance level of 1 per cent, 5 per cent and
10 per cent respectively. § For the sake of brevity we report only the coefficients for the irregularity rate and for the treatment
dummy.

27
Chart 1
Credit and the underground economy across OECD countries
Average of the years 2002/2003
y = -3.5692x + 169.63
(1.21) (20.74)
R2 = 0.3127
20
70
120
170
220
5 10 15 20 25 30
Size of the underground economy in terms of GDP (%)
Cre
dit
as
a p
erc
en
tag
e o
f G
DP
UK
US
IT
GR
FR
GE
Source: underground economy estimates have been borrowed by Schneider (2006). These estimates may differ
from official statistics for some country (Italy, for example); underlying methodologies have been criticized on
different grounds (see Istat, 2005 and OECD, 2002). Here we use them only for the sake of comparison. Data
on the ratio between credit and GDP are drawn from the 2006 revised version of the Financial Structure Dataset
(see Beck et al. (2000)). See also note 2.
Chart 2
Employment in the underground sector and bank lending to business firms across the Italian regions
Year 2003
y = -1.9287x + 76.372
(0.28) (4.99)
R2 = 0.7231
10
20
30
40
50
60
70
80
5 10 15 20 25 30 35
Size of the underground employment as a % of total employment in the private sector
Ban
k lo
an
s t
o n
on
-fin
an
cia
l fi
rms a
s a
% o
f re
gio
na
l G
DP

28
Chart 3
Employment in the underground sector and bank lending to households across the Italian regions
Year 2003
y = -0.2426x + 22.159
(0.08) (1.38)
R2 = 0.3505
10
13
15
18
20
23
25
5 10 15 20 25 30 35
Size of the underground employment as a % of total employment in the private sector
Ba
nk l
oan
s t
o c
on
su
me
r h
ou
seh
old
s a
s a
% o
f re
gio
nal
GD
P
Chart 4
Employment in the underground sector and school dropout across Italian regions
Year 2003
y = 0.1039x + 1.5399
(0.05) (0.91)
R2 = 0.208
0
3
5
8
5 10 15 20 25 30 35
Size of the underground employment as a % of total employment in the private sector
Dro
po
ut
at
the s
ec
on
d y
ear
of
the s
eco
nd
ary
sc
ho
ol

29
Chart 5
Average number of new branches by treatment and control groups and GDP growth
0.0
5.0
10.0
15.0
1996 1997 1998 1999 2000 2001 2002 2003
0.0
0.5
1.0
1.5
2.0
2.5
3.0
3.5
GDP growth (right axis)
treated
control

30
Appendix A: Variable definitions and sources; descriptive statistics
Regional data
CREDIT: bank loans to non-financial firms, to small non-financial firms, to households; bank and
OFI loans to non-financial firms and to households. As a percentage of GDP. Source:
Bank of Italy, Bank and Other Financial Intermediary Supervisory Reports.
IRR: irregular employment as a ratio to total employment, in the private sector; source: ISTAT.
LNGDPPC: log of per capita GDP, in the private sector. Population aged 15 and over; source: ISTAT,
National Accounts for GDP and Labour Force Survey for population.
HERF: Herfindahl concentration index computed on branches; source: our calculations on Bank of
Italy, Bank Supervisory Reports.
BRANCHPC: number of branches, per capita. Population aged 15 and over; source: our calculations
on Bank of Italy, Bank Supervisory Reports, and ISTAT, Labour Force Survey.
SHAREAGR, SHARECON, SHARESER : share of the agricultural, construction and services
sectors respectively, in terms of value added; source:
ISTAT.
SIZE: mean firm size, measured as the average number of employees in the private sector; source: our
calculations on ISTAT and Unioncamere.
ENFORCE: log of the average number of days needed to complete bankruptcy proceedings; source:
ISTAT.
DROPOUT: rate of drop-out at the second year of the secondary school; source: ISTAT.
Table A1. Descriptive statistics for regional data
Variable Mean Standard
deviation
First
quartile
Third
quartile
Minimu
m
Maxim
um
Bank loans to non-financial firms as a ratio to GDP 0.40 0.13 0.30 0.49 0.19 0.59
Bank loans to small non-financial firms as a ratio to GDP 0.11 0.04 0.09 0.14 0.05 0.25
Bank and OFI loans to non-financial firms as a ratio to GDP 0.46 0.15 0.34 0.59 0.21 0.70
Bank loans to households as a ratio to GDP 0.14 0.02 0.12 0.16 0.11 0.17
Bank and OFI loans to households as a ratio to GDP 0.17 0.02 0.15 0.18 0.13 0.21
IRR 0.17 0.06 0.13 0.20 0.11 0.31
LNGDPPC 2.92 0.26 2.67 3.14 2.50 3.29
HERF 0.13 0.06 0.10 0.14 0.06 0.33
BRANCHPC 0.58 0.21 0.43 0.71 0.28 1.12
SHAREAGR 0.04 0.02 0.02 0.05 0.01 0.07
SHARECON 0.06 0.01 0.05 0.07 0.04 0.08
SHARESER 0.66 0.04 0.62 0.69 0.60 0.75
SIZE 4.78 0.70 4.36 4.95 3.79 6.98
ENFORCE 7.77 0.15 7.70 7.88 7.48 8.06
DROPOUT 4.52 1.27 3.51 5.49 1.98 7.28
Statistics calculated on the average over the sample period.

31
Provincial data
ENTRY: number of new branches. Source: Bank of Italy, Bank Supervisory Reports.
IRRP: irregular employment as a ratio to total employment. Data for provinces have been retrieved
from official data at regional level (source: Istat). For each province the irregularity rate is
calculated as the weighted average across sectors of economic activity of the irregularity rate of
the corresponding region, with weights given by the size of the sector in the province. For years
1999 and 2000 our data are broadly comparable with those made available in Censis (2004).
POP: log of population aged 15 and over; source: ISTAT, Labour Force Survey.
∆POP: growth rate of POP.
GDPPC: per capita GDP; source: our calculations on ISTAT, National Accounts (see above for
population).
∆GDPPC: growth rate of GDPPC.
BRANCHES: log of number of branches; source: Bank of Italy, Bank Supervisory Reports.
HERF: Herfindahl concentration index computed on branches; source: our calculations on Bank of
Italy, Bank Supervisory Reports.
SPREAD: difference between interest rates on active and passive operations; source: Bank of Italy.
REGWORK: log of number of regularised immigrant workers; source: Ministry of the Interior.
SURFACE: log of the province surface area, in square metres; source: Istat.
EMPLOYMENT: log of employment; source: Istat.
Table A2. Descriptive statistics for provincial data
Variable Mean Standard
deviation
First
quartile
Third
quartile
Minimu
m
Maxim
um
ENTRY 10.4 13.1 3 12 0 107
IRRP 15.4 6.0 11.1 19.5 6.1 33.4
POP 6.0 0.7 5.5 6.4 4.5 8.3
∆POP 0.001 0.010 -0.01 0.01 -0.05 0.03
GDPPC 15.5 3.9 11.9 18.6 7.4 26.7
∆GDPPC 1.4 2.5 -0.2 2.7 -6.4 10.6
BRANCHES 5.3 0.7 4.8 5.7 3.0 7.7
HERF 0.14 0.08 0.10 0.16 0.04 0.65
SPREAD 5.6 1.4 4.5 6.6 1.9 10.9
Statistics calculated on the average over the sample period. POP and BRANCHES are in logs.

32
Appendix B
Table B1. Regression for selecting high and low program provinces
Dependent variable: REGWORK
SURFACE -0.30*** (0.11)
EMPLOYMENT 1.37*** (0.08)
CONSTANT 3.39*** (0.77)
R2 0.74
Overall significance: p-
value 0.00
Notes: OLS regression for year 2002 (103
observations). All variables in logarithms.
Robust standard errors are reported in
parentheses. The symbol *** indicates a
significance level of 1 per cent.
Chart B1
Distribution across provinces of the number of regularised workers as a percentage of total employment
Year 2002
0
.1
.2
.3
.4
0 2 4 6

References
Ahn, N. and De La Rica, S. (1997), “The underground economy in Spain: an alternative to
unemployment?”, Applied economics, 29, pp. 733-743.
Amel, D.F. and Liang, J.N. (1997), “Determinants of entry and profits in local banking
markets”, Review of Industrial Organization, 12, pp. 59-78.
Antunes, A.R. and Cavalcanti, T.V. (2007),“Start up costs, limited enforcement and the
hidden economy”, European Economic Review, 51, pp. 203-224.
Beck, T., Demirgüç-Kunt, A. and Levine, R. (2000), “A New Database on Financial
Development and Structure”, World Bank Economic Review, 14, pp. 597-605.
Bianco, M., T. Jappelli and Pagano, M. (2005), “Courts and Banks: Effects of Judicial
Enforcement on Credit Markets”, Journal of Money Credit and Banking, 37, pp. 223-
244.
Boeri, T. and Garibaldi, P. (2002), ‘Shadow Activity and Unemployment in a Depressed
Labour Market’, Cepr Discussion Paper, No. 3433.
Boeri, T. and Garibaldi, P. (2005), ‘Shadow sorting’, paper presented at the NBER
Macroeconomic Conference, Budapest, June.
Bofondi, M. and Gobbi, G. (2006), “Bad loans and entry into credit markets”, Review of
Finance, 10, pp. 39-67.
Bofondi, M. and Paiella, M. (2004), ‘Unbanked households in Italy: evidence from the
Survey on Income and Wealth’, Bank of Italy, manuscript.
Brevoort K.P. and Hannan, T.H. (2004) ‘Commercial Lending and Distance: Evidence from
Community Reinvestment Act Data’, The Federal Reserve Board Finance and
Economics Discussion Series, 2004-24.
Cappariello, R. and Zizza, R. (2004), ‘Institutional and economics forces behind the informal
sector in the Italian regions’, Bank of Italy, manuscript (in Italian).
Carey, M., Post, M. and Sharpe, S.A. (1998), “Does corporate lending by banks and finance
companies differ? Evidence on specialization in private debt contracting”, Journal of
Finance, 53, pp. 845-878.
Censis (2004), Understanding the underground economy (in Italian), Rome.
Cipollone, P. and Guelfi, A. (2003), ‘Tax credit policy and firms’ behaviour: the case of
subsidies to open-end labour contracts in Italy’, Bank of Italy, Temi di Discussione No.
471.
Cottarelli, C., Dell’Ariccia, G. and Vladkova-Hollar, I. (2005), “Early birds, late risers, and
seeping beauties: Bank credit growth to the private sector in central and Eastern Europe
and in the Balkans”, Journal of Banking and Finance, 29, pp. 83-104.
Dabla-Norris, E. and Feltenstein, A. (2005), “The underground economy and its
macroeconomic consequences”, Journal of Policy Reform, 8, pp. 153-174.
Degryse, H. and Ongena, S. (2005) “Distance, Lending Relationships, and Competition”,
Journal of Finance, 60, pp. 231-266.
Djankov, S., McLiesh, C. and Shleifer, A. (2005), ‘Private credit in 129 countries’, NBER
Working Papers, No. 11078.

34
Duflo, E. (2001), “Schooling and Labor Market Consequences of School Construction in
Indonesia: Evidence from an Unusual Policy Experiment”, American Economic
Review, 91, pp. 795-813.
European Commission (2004), Undeclared work in an enlarged union, DG for Employment
and Social Affairs, Brussels.
Gobbi, G. and Lotti, F. (2004) “Entry Decisions and Adverse Selection: an Empirical
Analysis of Local Credit Markets”, Journal of Financial Services Research, 26, pp.
225-244.
Istat (2000, 2002), Annual Report (in Italian), Rome.
Istat (2004), The measurement of irregular employment in National and Regional Accounts
for the years 1980-2002 (in Italian), Rome.
Istat (2005), The measurement of the underground economy in official statistics for the year
2003 (in Italian), Rome.
Istat (2005), Migrants in Italy. The effects of the last regularisation” (in Italian), Rome.
Johnson, S., Kaufmann, D., McMillan, J. and Woodruff, C. (2000), “Why do firms hide?
Bribes and unofficial activity after communism”, Journal of Public Economics, 76, pp.
495-520.
Lucifora, C. (2003), Underground economy and irregular employment (in Italian), Il Mulino,
Bologna.
OECD (2002), Measuring the non-observed economy. A handbook, Paris.
Roma, G. (2001), The underground economy (in Italian), Laterza, Bari.
Schneider, F. and Enste, D.H. (2000), “Shadow economies: size, causes and consequences”,
Journal of Economic Literature, 38, pp. 77-114.
Schneider, F. (2006), ‘Shadow economies and corruption all over the world. What do we
really know?’, Johannes Kepler University of Linz, Department of Economics,
Working Paper No. 617.
Stock, J.H., Wright, J.H. and Yogo, M. (2002), “A survey of weak instruments and weak
identification in generalized method of moments”, Journal of Business and Economic
Statistics, 20, pp. 518-529.
Straub, S. (2005), “Informal sector: the credit market channel”, Journal of Development
Economics, 78, pp. 299-321.
Wooldridge, J.M. (2002), Econometric analysis of cross section and panel data, MIT press,
Cambridge MA.
Zizza, R. (2002), ‘Metodologie di stima dell’economia sommersa: un’applicazione al caso
italiano’ (Different measurement approaches to the underground economy: an
application to Italian data), Bank of Italy, Temi di discussione No. 463.