Embed Size (px)
Citation preview

College of the Holy CrossCrossWorks
Economics Department Student Scholarship Economics Department
4-2018
Does the Stock Market Value Inclusion on aSustainability Index? An Event Study Using theDow Jones Sustainability North America IndexLauren HaywardCollege of the Holy Cross, [email protected]
Follow this and additional works at: https://crossworks.holycross.edu/econ_stu_scholarship
Part of the Economics Commons
This Department Honors Thesis is brought to you for free and open access by the Economics Department at CrossWorks. It has been accepted forinclusion in Economics Department Student Scholarship by an authorized administrator of CrossWorks.
Recommended CitationHayward, Lauren, "Does the Stock Market Value Inclusion on a Sustainability Index? An Event Study Using the Dow JonesSustainability North America Index" (2018). Economics Department Student Scholarship. 3.https://crossworks.holycross.edu/econ_stu_scholarship/3

Does the Stock Market Value Inclusion on a Sustainability Index?
An Event Study using the Dow Jones Sustainability North America Index
Lauren Hayward
Advisors: Prof. Victor Matheson and Prof. Karen Teitel
Economics Department Honors Thesis
College of the Holy Cross
April 2018
Hayward 2
Abstract
The concept of socially responsible investing (SRI) has evolved into a mainstream strategy for
investments. Investors who place value on sustainability use SRI strategies to make investment
decisions. Companies send a signal to stakeholders, including investors, that they are
sustainability leaders by being recognized as a member of a sustainability index. The purpose of
this paper is to analyze the impact of the announcement that a company is added to, removed
from, or remaining on the Dow Jones North America Sustainability Index (DJSI NA) on its stock
price. An event study is used to measure the impact of the announcement by analyzing the
abnormal stock returns over a 12-year period. The results indicate that a deletion of a company
from the DJSI NA has a negative and statistically significant temporary impact on its stock price.
Also, the addition of a company to the DJSI NA has a positive and statistically significant
temporary impact on its stock price. However, excluding the inaugural year of the DJSI NA,
only deletions from the index have a statistically significant impact on stock price.

Hayward 3
Introduction
The concept of socially responsible investing (SRI) has become a mainstream strategy for
investments. Assets managed using SRI strategies in the United States have grown over 125%
from approximately $4 trillion at the start of 2014 to almost $9 trillion at the start of 2016 (U.S.
SIF Foundation, 2016). Investors who place value on sustainability consider a company’s
environmental, social, and governance (ESG) performance when making investment decisions.
For example, environmental criteria such as greenhouse gas emissions and energy consumption,
social criteria such as employee working conditions and supply chain management, and
governance criteria such as crisis and risk management are valued by investors who consider
sustainability in their investment decisions.
Investors also recognize a positive relationship between ESG performance and a
company’s operational efficiency. For example, a recycling program to reduce waste at Cisco
contributed over $100 million to the company’s bottom line in 2008 (Nidumolu et al., 2009). In
addition, Cheng, Ioannou, and Serafeimi (2014) finds that companies with a higher ESG rating
obtain a lower cost of capital. Furthermore, investors see a positive relationship between ESG
integration and the management of long-term financial risks (RobecoSAM, 2017b).
The growth of SRI has, in turn, led to the creation of multiple stock indices that track the
sustainability performance of companies. Dorfleitner et al. (2015) explains that sustainability
indices play an important role in the decision-making process of investors who care about social
responsibility. Companies send a signal to stakeholders, including investors, that they are
sustainability leaders by their inclusion on a sustainability index. Institutional investors
increasingly rely on these indices to create their portfolios because these indices are viewed as
“objective, professional benchmarks assessed by neutral parties” (Robinson et al., 2011, p. 495).

Hayward 4
The sustainability indices include the KLD rating, the FTSE4Good Index, the Domini 400, and
the Dow Jones Sustainability Index. According to Dorfleitner et al. (2015), excessive
sustainability indices have been created because “neither a general consensus nor a set of rules
exists on how to measure ESG” (p. 454).
Among the various indices, the Dow Jones Sustainability Index (DJSI) is recognized in
the extant literature as the “leading sustainability index” by Lopez et al. (2007), Consolandi et al.
(2009), Cheung (2011), Robinson et al. (2011), Oberndorfer et al. (2013), Cheung and Roca
(2013), and Van Stekelenburg et al. (2015). The DJSI was the first global sustainability index,
launched in 1999 by S&P Dow Jones Indices1 and RobecoSAM. The DJSI family includes DJSI
World, DJSI North America, DJSI Europe, DJSI Asia Pacific, DJSI Emerging Markets, DJSI
Korea, DJSI Australia, and DJSI Chile (RobecoSAM, 2017a). S&P Dow Jones Indices and
RobecoSAM introduced different indices to recognize the sustainability leaders in each
geography (RobecoSAM, 2017a). According to Robinson et al. (2011), “the DJSI is recognized
as a global standard and used by a number of SRI fund [managers] that do not conduct their own
screening for social responsibility” (p. 498). Also, according to Van Stekelenburg et al. (2015),
“the Dow Jones Sustainability Indices have become a reference point in sustainability investing”
(p. 77). In addition, a survey of investors conducted by SustainAbility in 2013 recognized the
DJSI as the most familiar sustainability rating to investors and one of the top two ratings in terms
of credibility (Sadowski, 2013).
S&P Dow Jones Indices and RobecoSAM select companies on an annual basis to be
included on the Dow Jones Sustainability Indices based on the results of a Corporate
Sustainability Assessment (CSA). There are 60 industry-specific CSAs. The CSA is designed to
1 S&P Dow Jones Indices is a joint venture of S&P Global, CME Group, and the Dow Jones & Company.
Hayward 5
be “a fair representation of the corporate sustainability performance in a firm’s peer group”
(RobecoSAM, 2017b, p. 1). The CSA contains 80 to 120 questions related to environmental,
social, and governance factors. A CSA completed by a company is verified by RobecoSAM for
accuracy based on company supporting documentation, publicly available information, and
external stakeholder reports. RobecoSAM also uses publicly available information to evaluate
companies that do not complete the CSA, in order to ensure the DJSI covers a representative
group of companies by region and industry (RobecoSAM, 2016a). S&P Dow Jones Indices and
RobecoSAM select the companies to be named to the DJSI based on the results of the CSA. For
example, the DJSI NA, which was introduced in 2005, represents the top 20% of CSA survey
results among the 600 largest companies in the United States and Canada on the S&P Global
Broad Market Index (S&P Dow Jones Indices, 2016). S&P Dow Jones Indices and RobecoSAM
announce the results of the annual DJSI review each September. The announcement date is
typically one week prior to the effective change date.
This paper investigates the impact of the announcement of the DJSI NA annual review
results on a company’s stock price. An event study methodology is used to determine the impact
of the announcement that a company is included on or excluded from the DJSI NA by measuring
the abnormal return of its stock. The estimates for abnormal return of the stock control for the
daily return of the market and firm-specific fixed effects. Using data from 2005 to 2016, the
results indicate that the removal of a company from the DJSI NA has a negative and statistically
significant impact on its stock price for seven trading days following the effective change date.
Using data from the same time period, the addition of a company to the DJSI NA has a positive
and statistically significant impact on its stock price for two trading days following the
announcement date. However, excluding 2005 when the DJSI NA was introduced, only a

Hayward 6
deletion from the DJSI NA has a statistically significant impact on stock price. This suggests a
change in investors’ attitude toward inclusion on the DJSI NA may have occurred since 2005.
This paper contributes to literature by analyzing the impact of the announcement of the
results of the DJSI NA annual review on a company’s stock price. It also analyzes the impact of
a company remaining on the index for consecutive years, in addition to being newly added or
deleted from the index. Moreover, this paper includes a regression analysis to take into account
company-specific and time-invariant factors in order to test the statistical significance of the
addition to and deletion from the DJSI NA on a company’s stock price.
Research Question and Hypotheses
How does a company’s inclusion on or exclusion from the DJSI NA impact its stock
price? The first hypothesis (H1) is that a company added to the DJSI NA experiences an
increase in stock price following the announcement of its addition to the index. The second
hypothesis (H2) is that a company removed from the DJSI NA experiences a decrease in stock
price following the announcement of its removal from the index. The third hypothesis (H3) is
that a company remaining on the DJSI NA for consecutive years does not experience a change in
stock price following the announcement.
It is expected that institutional investors, who manage socially responsible funds, may
reallocate their funds based on the change in DJSI NA designation. The inclusion on or
exclusion from the DJSI NA may change the investors’ view about the future profitability of the
company and thus their demand for its stock. Alternatively, the investors who care about
sustainability may increase their demand for a stock based on the addition of the DJSI NA
designation and decrease their demand for a stock based on the deletion of the DJSI NA
Hayward 7
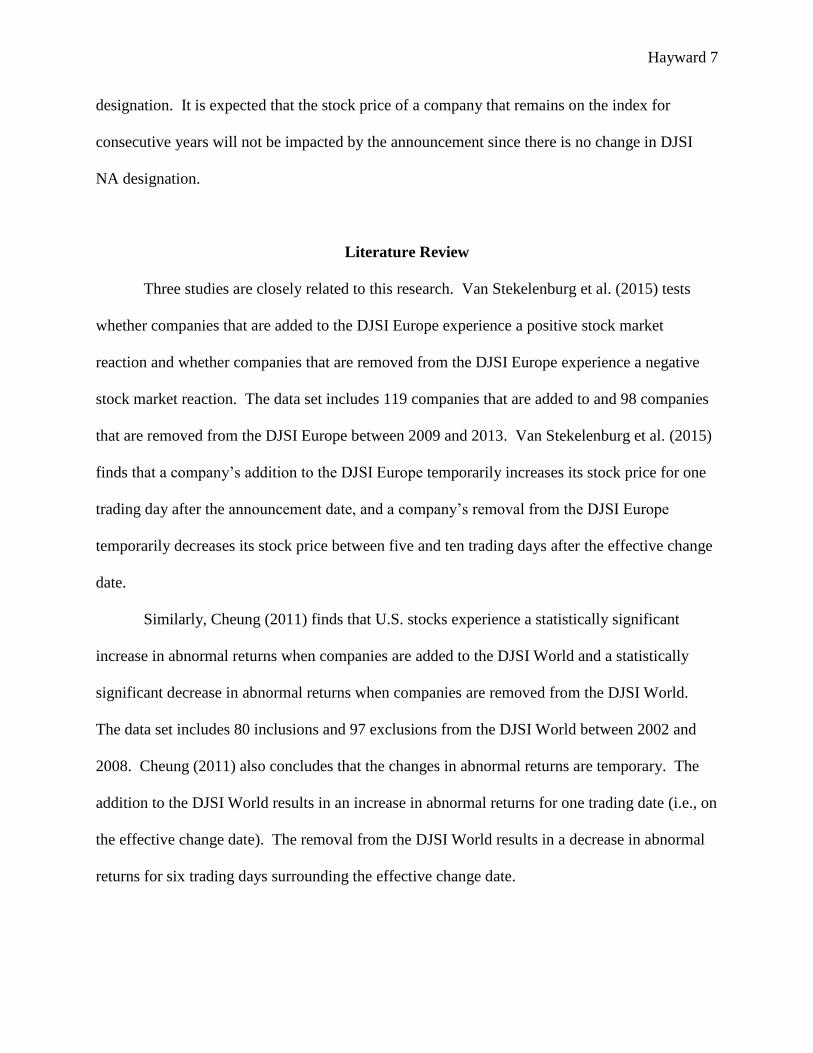
designation. It is expected that the stock price of a company that remains on the index for
consecutive years will not be impacted by the announcement since there is no change in DJSI
NA designation.
Literature Review
Three studies are closely related to this research. Van Stekelenburg et al. (2015) tests
whether companies that are added to the DJSI Europe experience a positive stock market
reaction and whether companies that are removed from the DJSI Europe experience a negative
stock market reaction. The data set includes 119 companies that are added to and 98 companies
that are removed from the DJSI Europe between 2009 and 2013. Van Stekelenburg et al. (2015)
finds that a company’s addition to the DJSI Europe temporarily increases its stock price for one
trading day after the announcement date, and a company’s removal from the DJSI Europe
temporarily decreases its stock price between five and ten trading days after the effective change
date.
Similarly, Cheung (2011) finds that U.S. stocks experience a statistically significant
increase in abnormal returns when companies are added to the DJSI World and a statistically
significant decrease in abnormal returns when companies are removed from the DJSI World.
The data set includes 80 inclusions and 97 exclusions from the DJSI World between 2002 and
2008. Cheung (2011) also concludes that the changes in abnormal returns are temporary. The
addition to the DJSI World results in an increase in abnormal returns for one trading date (i.e., on
the effective change date). The removal from the DJSI World results in a decrease in abnormal
returns for six trading days surrounding the effective change date.

Hayward 8
Like Van Stekelenburg et al. (2015) and Cheung (2011), a study by Robinson et al.
(2011) demonstrates a similar stock market reaction when companies are included on the DJSI
World. Robinson et al. (2011) analyzes the stock prices of 48 North American companies added
to and 43 North American companies removed from the DJSI World between 2003 and 2007.
The results indicate a statistically significant increase in abnormal returns for 60 trading days
after a company is added to the DJSI World. However, the results indicate a statistically
insignificant change in abnormal returns after a company is removed from the DJSI World.
In contrast to Van Stekelenburg et al. (2015), Cheung (2011), and Robinson et al. (2011),
some research demonstrates that the inclusion on the DJSI World results in a decrease in stock
price. According to Cheung and Roca (2013), stock prices decline when a company is either
included on or excluded from the DJSI World. Cheung and Roca (2013) examines the DJSI
World impact on stock prices in the Asia Pacific stock markets between 2002 and 2010. The
study concludes that the addition of a company to the DJSI World results in a decrease in stock
price. Cheung and Roca (2013) suggests that the negative price reaction to the inclusion on the
DJSI World reflects the pessimistic view of sustainability in Asia Pacific. Likewise, according
to Oberndorfer et al. (2013), the addition of a German company to the DJSI World results in a
decrease in its stock price in the Frankfurt Stock Exchange between 1999 and 2002.
Finally, some economic literature indicates that the addition of a company to the DJSI
does not impact its stock price. According to Oberndorfer et al. (2013), the addition of a German
company to the DJSI STOXX between 2001 and 2002 has no impact on its stock price in the
Frankfurt Stock Exchange. Oberndorfer et al. (2013) concludes that the DJSI STOXX is less
recognized than the DJSI World because the DJSI STOXX had been recently launched at the
start of the event study in 2001. Similarly, Consolandi et al. (2009) finds that the addition of a

Hayward 9
company to the DJSI STOXX between 2001 and 2006 does not impact stock price. However,
similar to Van Stekelenburg et al. (2015) and Cheung (2011), Consolandi et al. (2009) finds that
stocks have statistically significant negative abnormal returns when companies are deleted from
the DJSI STOXX. There is clearly no consensus in the extant literature on the size or the sign of
the impact on stock price resulting from a change in DJSI status.
Data
Data for the companies on the DJSI NA between 2005 and 2016 are from the “Dow Jones
Sustainability North America Composite Index” on the RobecoSAM website.2 The data set
includes the companies that are listed on the DJSI NA at least once from 2005 to 2016, as shown
in Table 1 in Appendix A. The companies that are added to, deleted from, and remaining on the
DJSI NA for each year are identified by comparing the index lists for consecutive years.
The historical stock prices are obtained from Yahoo Finance, the Center for Research in
Security Prices (CRSP), and the Bloomberg Terminal. The closing stock price for each day the
stock was publicly traded on a U.S. stock exchange from January 3, 2005 to December 30, 2016
is used in the study.3 In addition, the S&P 500 Index is selected as the market portfolio.
A total of 281 companies are listed on the DJSI NA at least once from 2005 to 2016, but
only 241 of these companies have all the necessary historical stock prices to be included in the
data set. The remaining 40 companies are omitted because each is privately held and/or its stock
is not publicly traded on a U.S. stock exchange. Data cleaning identified the companies that
2 http://www.robecosam.com/en/sustainability-insights/about-sustainability/corporate-sustainability-
assessment/send.jsp and
http://www.robecosam.com/images/DJSI2016_ComponentList_NorthAmerica.pdf (accessed on
September 1, 2017). 3 The actual closing price, not the adjusted closing price, is used in the study because the adjusted closing
stock price is not available for all companies.

Hayward 10
changed names during the 12-year time period, and all company names were standardized. The
companies on the DJSI NA are researched using publicly available information, such as the press
releases on company websites and the United States Securities and Exchange Commission (SEC)
8-K forms. A total of 24 companies on the DJSI NA had been acquired during the preceding
year. These firms are omitted from the data set in the year that each is acquired because the
stock prices are likely affected by the acquisition and/or the company is liquidated soon after the
acquisition. For example, Cinergy Corporation was removed from the DJSI NA in September
2007, but it was acquired by Duke Energy in April 2006. In addition, three companies are
omitted because each had experienced bankruptcy during the preceding year to a change in DJSI
NA status. For example, Nortel Networks Corporation was removed from the DJSI NA in
September 2009, but it had filed for bankruptcy in January 2009.
The data set contains 286 additions to the DJSI NA and 122 deletions from the DJSI NA
from 2005 to 2016. The total number of additions and deletions is greater than the total number
of companies (i.e., 241) because some companies, such as Allergan Inc., Xerox Corporation and
Nisource Inc., are added to and/or deleted from the DJSI NA more than once between 2005 and
2016. Also, if a company is named to the DJSI NA for consecutive years, it is considered a
“remain” for each year it stays on the index. The data set contains 1137 so-called remains.
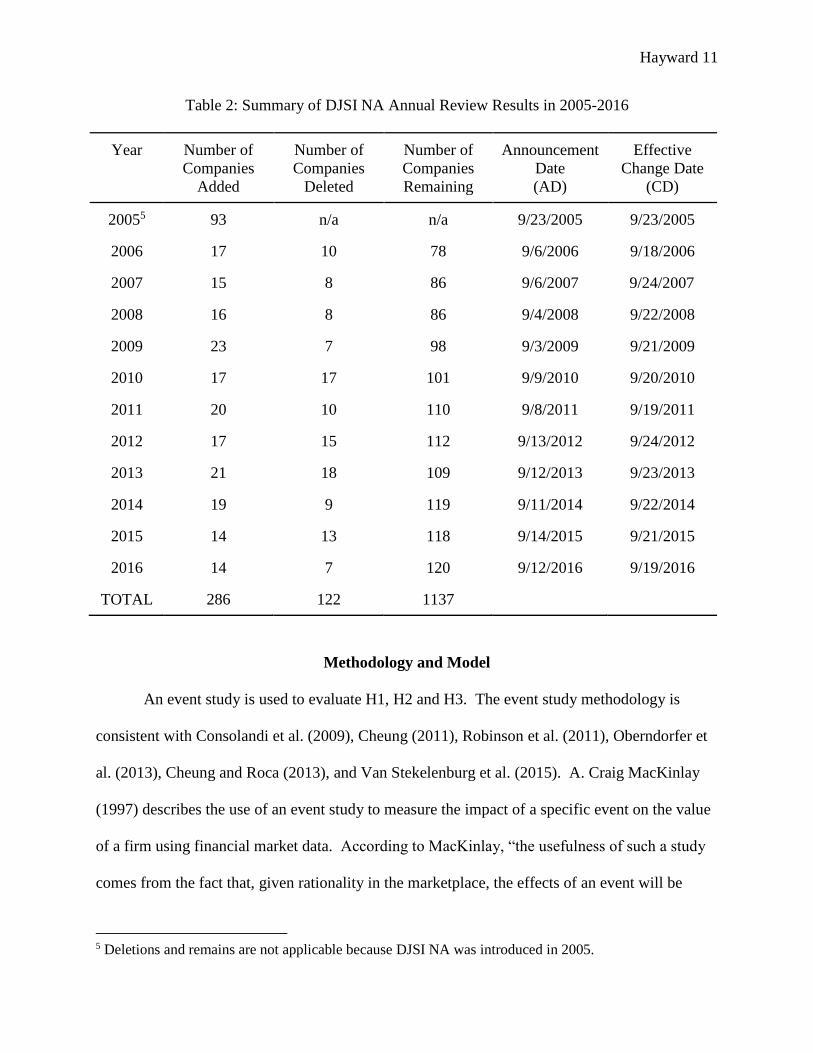
Table 2 summarizes the results of the DJSI NA annual review for each year.4 It also
contains the announcement date (AD) and the effective change date (CD), which are available
from the press releases on the RobecoSAM website.
4 Quantities may differ from those reported in RobecoSAM press releases due to mergers, acquisitions,
company name changes, etc.
Hayward 11
Table 2: Summary of DJSI NA Annual Review Results in 2005-2016
Year Number of
Companies
Added
Number of
Companies
Deleted
Number of
Companies
Remaining
Announcement
Date
(AD)
Effective
Change Date
(CD)
20055 93 n/a n/a 9/23/2005 9/23/2005
2006 17 10 78 9/6/2006 9/18/2006
2007 15 8 86 9/6/2007 9/24/2007
2008 16 8 86 9/4/2008 9/22/2008
2009 23 7 98 9/3/2009 9/21/2009
2010 17 17 101 9/9/2010 9/20/2010
2011 20 10 110 9/8/2011 9/19/2011
2012 17 15 112 9/13/2012 9/24/2012
2013 21 18 109 9/12/2013 9/23/2013
2014 19 9 119 9/11/2014 9/22/2014
2015 14 13 118 9/14/2015 9/21/2015
2016 14 7 120 9/12/2016 9/19/2016
TOTAL 286 122 1137
Methodology and Model
An event study is used to evaluate H1, H2 and H3. The event study methodology is
consistent with Consolandi et al. (2009), Cheung (2011), Robinson et al. (2011), Oberndorfer et
al. (2013), Cheung and Roca (2013), and Van Stekelenburg et al. (2015). A. Craig MacKinlay
(1997) describes the use of an event study to measure the impact of a specific event on the value
of a firm using financial market data. According to MacKinlay, “the usefulness of such a study
comes from the fact that, given rationality in the marketplace, the effects of an event will be
5 Deletions and remains are not applicable because DJSI NA was introduced in 2005.

Hayward 12
reflected immediately in security prices” (MacKinlay, 1997, p. 13). The benefit of an event
study is that an event’s economic impact can be measured using security prices observed over a
relatively short time period (MacKinlay, 1997).
In an event study, the impact of the event (e.g., the announcement of the results of the
DJSI NA annual review) is measured by the abnormal return of the stock. The market model is
used to predict the return of a stock using the return of the market portfolio. The market model is
𝑅𝑖𝑡 = 𝛼𝑖𝑦 + 𝛽𝑖𝑦𝑅𝑚𝑡 + 𝜀𝑖𝑡
where 𝑅𝑖𝑡 is the expected return of stock i on trading day t, and 𝑅𝑚𝑡 is the return of the S&P 500
Index on trading day t. 𝛼𝑖𝑦 and 𝛽𝑖𝑦 are the stock-specific parameters for stock i in year y, and 𝜀𝑖𝑡
is the error term of stock i on trading day t.
The market model parameters 𝛼𝑖𝑦 and 𝛽𝑖𝑦 are estimated for the stocks of the 241
companies for each year (i.e., 2005 to 2016). An ordinary least squares regression uses the stock
returns and S&P 500 Index returns during the estimation window, which is 165 to 16 trading
days prior to the announcement date of the DJSI NA annual review results. The estimation
window does not overlap the event window to prevent the announcement from influencing the
market model parameter estimates.
The expected return of the stock is
𝐸(𝑅𝑖𝑡) = 𝛼𝑖𝑦 + 𝛽𝑖𝑦𝑅𝑚𝑡
where 𝐸(𝑅𝑖𝑡) is the estimated expected return of stock i on trading day t. The parameters 𝛼𝑖𝑦
and 𝛽𝑖𝑦 are estimated for each stock i in year y.
The abnormal return is calculated as the difference between the realized return and the
estimated expected return of the stock as shown below:
𝐴𝑅𝑖𝑡 = 𝑅𝑖𝑡 − 𝐸(𝑅𝑖𝑡)

Hayward 13
where 𝐴𝑅𝑖𝑡 is the abnormal return of stock i on trading day t.
The cumulative abnormal return (CAR) is
𝐶𝐴𝑅𝑡1,𝑡2 = ∑ 𝐴𝑅𝑖𝑡
𝑡2
𝑡= 𝑡1
where 𝐶𝐴𝑅𝑡1,𝑡2 is the cumulative abnormal return from trading day t1 to trading day t2.
Similar to Van Stekelenburg et al. (2015), the event window is selected as the time period
between 15 trading days prior to the announcement date and 60 trading days after the
announcement date (written as AD-15 to AD+60 trading days). Analyzing the abnormal returns
prior to the announcement date determines if the market acquires information about the DJSI NA
annual review results prior to the announcement. Similar to Van Stekelenburg et al. (2015),
Cheung (2011), and Robinson et al. (2011), the event window is divided into sub-windows to
analyze the CAR for different time periods surrounding the announcement date (AD) and the
effective change date (CD).
A one-sample t-test is used to test if the CAR for the companies added to, removed from,
and remaining on the DJSI NA are statistically distinguishable from zero. Also, a two-sample t-
test compares the CARs for (1) companies added to and removed from the DJSI NA, (2)
companies added to and remaining on the DJSI NA, and (3) companies removed from and
remaining on the DJSI NA.
In addition, a regression analysis estimates the marginal effects of DJSI NA additions and
deletions on the cumulative abnormal returns. The regression includes fixed effects in order to
control for company-specific and time-invariant impacts on its stock price, such as industry. The
regression equation is
𝐶𝐴𝑅𝑖,𝑡1,𝑡2 = 𝛽0 + 𝛽1𝐴𝐷𝐷𝑖𝑡 + 𝛽2𝐷𝐸𝐿𝐸𝑇𝐸𝑖𝑡 + ∑ 𝑓𝑖
𝑖
+ 𝜀𝑖𝑡

Hayward 14
where 𝐶𝐴𝑅𝑖,𝑡1,𝑡2 is the cumulative abnormal return for stock i from trading day t1 to trading day
t2. 𝐴𝐷𝐷𝑖𝑡 is a dummy variable for stock i that equals one for companies added to the DJSI NA,
and zero otherwise. 𝐷𝐸𝐿𝐸𝑇𝐸𝑖𝑡 is a dummy variable for stock i that equals one for companies
deleted from the DJSI NA, and zero otherwise. ∑ 𝑓𝑖𝑖 is the fixed effects of company i, and εit is
the error term of stock i on trading day t. 𝛽1 is the marginal effect on CAR if a company is
added to the DJSI NA. 𝛽2 is the marginal effect on CAR if a company is removed from the DJSI
NA.
An indicator variable for the days from the announcement date is assigned to each trading
day. The indicator variable 0 denotes the announcement date (AD). The indicator variable +1
denotes the trading day following the AD, +2 denotes the second trading day following the AD,
etc. Likewise, the indicator variable -1 denotes the trading day prior to the AD, -2 denotes the
second trading day prior to the AD, etc. Similarly, an indicator variable for the days from the
effective change date (CD) is assigned to each trading day.
The assumption for the event study is that the timing of the announcement of the results
of the DJSI NA annual review is exogenous and cannot be influenced by the company. Another
assumption is that the market is efficient and rational. The market model assumes the normality
of data and a linear relationship between the return of the market portfolio and the expected stock
return.
Results
Market Model Regression Analysis
The parameters 𝛼𝑖𝑦 and 𝛽𝑖𝑦 for the market model are estimated for each stock for each
year using an ordinary least squares regression. The data for the regression include the stock

Hayward 15
returns and S&P 500 Index market returns during the estimation window (i.e., between AD-165
and AD-16 trading days) for each company and each year.
A summary of the market model regression results is shown in Table 3 below. The
results estimate that the mean 𝛽𝑖𝑦 is 0.994. The marginal effect of the S&P 500 Index market
return on the stock return is positive and is estimated to be approximately one. The p-values for
the coefficient 𝛽𝑖𝑦 indicate that the S&P 500 Index market return is a good estimator for the
expected stock return. The coefficient 𝛽𝑖𝑦 is statistically significant in 1542 out of the 1560
regressions based on a 10% significance level. The remaining 18 companies are Canadian
companies traded on both the Toronto Stock Exchange and the NYSE and/or gold production
companies whose stock prices likely do not trend with the S&P 500 Index. The mean R-squared
value is 0.358, and the maximum value is 0.816.
Table 3: Market Model Regression Summary6
Mean N Max Min
iy 0.000111 1560 0.00828 -0.00477
iy Std. Error 0.00113 1560 0.00624 0.000388
iy t-statistic 0.0946 1560 3.17 -2.981
iy p-value 0.496 1560 0.998 0.00152
iy 0.994 1560 3.113 -0.962
iy Std. Error 0.12 1560 0.616 0.0392
iy t-statistic 9.408 1560 25.623 -3.06
iy p-value 0.0045 1560 0.844 0
R-squared value 0.358 1560 0.816 0.00262
Cumulative Abnormal Return (CAR) Analysis
The results of the one-sample t-tests are shown in Tables B1 to B3 in Appendix B.
Consistent with the event studies performed by Van Stekelenburg et al. (2015), Cheung (2011),
6 The specific results of the market model regressions are available upon request.

Hayward 16
and Robinson et al. (2011), the one-sample t-tests identify if the CAR is statistically
distinguishable from zero in any of the event sub-windows. If the CAR is statistically different
than zero in an event sub-window, the announcement has an impact on abnormal returns during
this window.
The one-sample t-test of the CAR during the event window prior to the announcement
(i.e., AD-15 to AD-1 trading days) indicates that the CAR is not statistically distinguishable from
zero. This suggests that the market does not acquire information about the DJSI NA annual
review results before the announcement date.
The one-sample t-test indicates the CAR of the DJSI NA additions is positive and
statistically different from zero between (1) the two trading days prior to and following the
announcement, (2) the announcement date and the following two trading days, and (3) the
announcement date and the following five trading days. This suggests that an addition to the
index temporarily increases the CAR up to five trading days following the announcement date.
The one-sample t-test indicates the CAR of the DJSI NA deletions is negative and
statistically different from zero for seven out of the 11 event sub-windows analyzed. The longest
windows are between (1) the announcement date and the following fifteen trading days and (2)
the effective change date and the following seven trading days. This suggests that a deletion
from the index temporarily decreases the CAR for 15 trading days following the announcement
date and for seven trading days following the effective change date. These two windows are
similar because the announcement date is typically one week prior to the effective change date.
In contrast, the one-sample t-test indicates the CAR of the stocks of the companies
remaining on the DJSI NA is not statistically distinguishable from zero. This suggests the

Hayward 17
announcement that a company remains on the index for consecutive years does not impact its
stock price.
The results of the two-sample t-tests are shown in Tables B4 to B6 in Appendix B. The
two-sample t-test results support the findings of the one-sample t-tests. For example, the CAR of
the stocks of companies newly added to the DJSI NA is greater than the CAR of the stocks of
companies remaining on the index during the analyzed event windows. The results of the two-
sample t-tests further support that the announcement of a company remaining on the DJSI NA
for consecutive years does not have a statistically significant impact on stock price.
In addition, the results of the regression analysis are shown in Table 4 below. The
marginal effect of the addition to the DJSI NA on CAR is positive and statistically significant
between (1) the one trading day before and one trading day after the announcement date and (2)
the announcement date and the following two trading days. The regression results indicate that
the addition of a company to the index increases the CAR by approximately 0.005 and 0.004
respectively in these two windows. For example, the predicted impact on a $10 stock would be
an increase in CAR by approximately $0.04 during the two trading days following the
announcement of the company’s addition to the index.
The marginal effect of the removal from the DJSI NA on CAR is negative in the analyzed
event windows. The marginal effect of the removal from the index is statistically significant
between (1) the effective change date and the following five trading days and (2) the effective
change date and the following seven trading days. The regression results indicate that the
removal of company from the index decreases the CAR by approximately 0.008 in these two
windows. For example, the predicted impact on a $10 stock would be a decrease in CAR by
approximately $0.08 during five to seven trading days following the effective change date.

Hayward 18
Table 4: Regression Results for Cumulative Abnormal Returns (2005-2016)
Event Sub-
Window
(trading days)
Variable Coefficient Std. Error t-statistic
AD-15 to AD-1
ADD -0.000884 0.00376 -0.24
DELETE -0.00768 0.00559 -1.37
Constant 0.00138 0.00159 0.87
AD-1 to AD+1 ADD 0.00478*** 0.00168 2.85
DELETE -0.00219 0.00250 -0.88
Constant -0.00101 0.000712 -1.42
AD-2 to AD+2 ADD 0.00401 0.00251 1.60
DELETE -0.00544 0.00373 -1.46
Constant -0.00104 0.00106 -0.98
AD-5 to AD+5 ADD 0.00230 0.00360 0.64
DELETE -0.00778 0.00535 -1.45
Constant 0.000626 0.00152 0.41
AD to AD+2 ADD 0.00373** 0.00171 2.18
DELETE -0.00218 0.00254 -0.86
Constant -0.00111 0.000724 -1.51
AD to AD+5 ADD 0.00318 0.00259 1.23
DELETE -0.00378 0.00385 -0.98
Constant -0.000431 0.00110 -0.39
AD to AD+15 ADD -0.00231 0.00447 -0.52
DELETE -0.0103 0.00665 -1.55
Constant -0.00250 0.00189 -1.32
AD+10 to AD+15 ADD -0.00305 0.00275 -1.11
DELETE -0.00428 0.00408 -1.05
Constant 0.000230 0.00116 0.20
CD to CD+5 ADD -0.000423 0.00261 -0.16
DELETE -0.00796** 0.00388 -2.05
Constant -0.000892 0.0111 -0.81
CD to CD+7 ADD 0.000805 0.00307 0.26
DELETE -0.00816* 0.00457 -1.79
Constant -0.00160 0.00130 -1.23
CD to CD+10 ADD -0.00376 0.00388 -0.97
DELETE -0.00716 0.00576 -1.24
Constant -0.00173 0.00164 -1.05
Note: ***, ** and * represent statistical significance at one percent, five percent and ten
percent levels, respectively.

Hayward 19
2005 Sensitivity Analysis
The circumstances in 2005, the first year of the DJSI NA, are arguably different than any
year since. For example, approximately one-third of the additions to the DJSI NA in the data set
occur in 2005 and may skew the results. In addition, the popularity of the DJSI NA may have
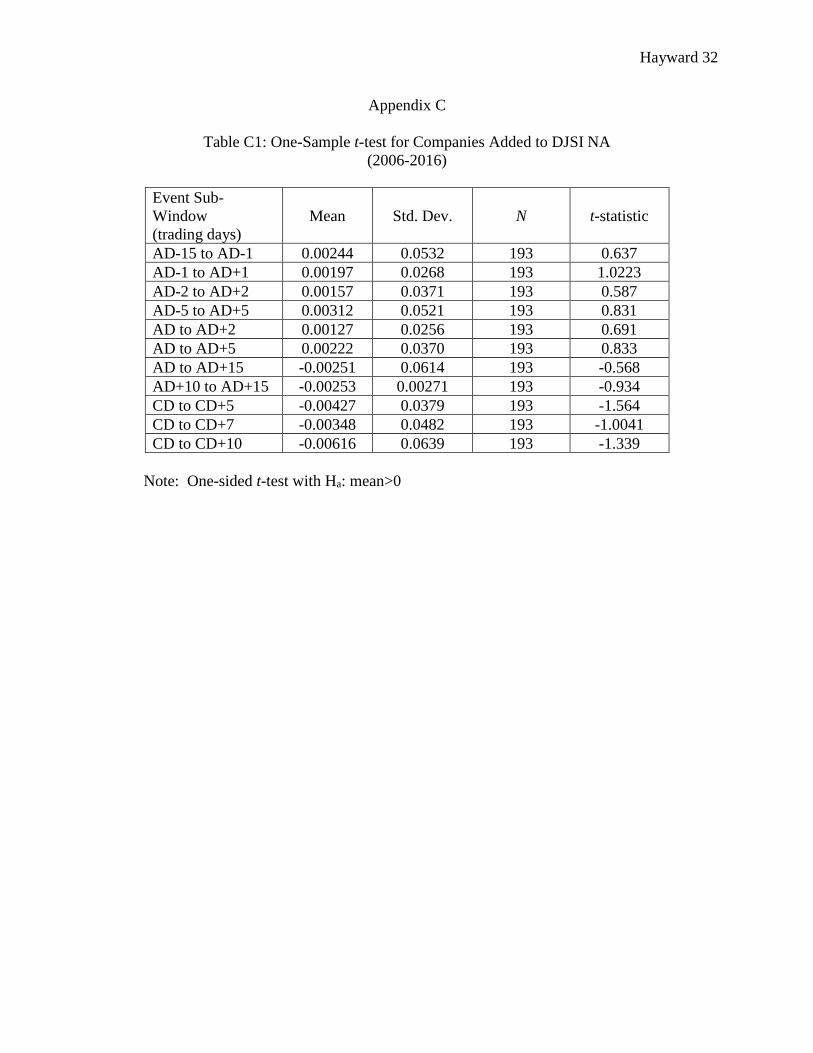
declined as additional sustainability indices have been introduced. In fact, the one-sample t-test
indicates the CARs of the stocks of companies added the DJSI NA are not statistically
distinguishable from zero if the 2005 data are omitted, as shown in Table C1 in Appendix C.
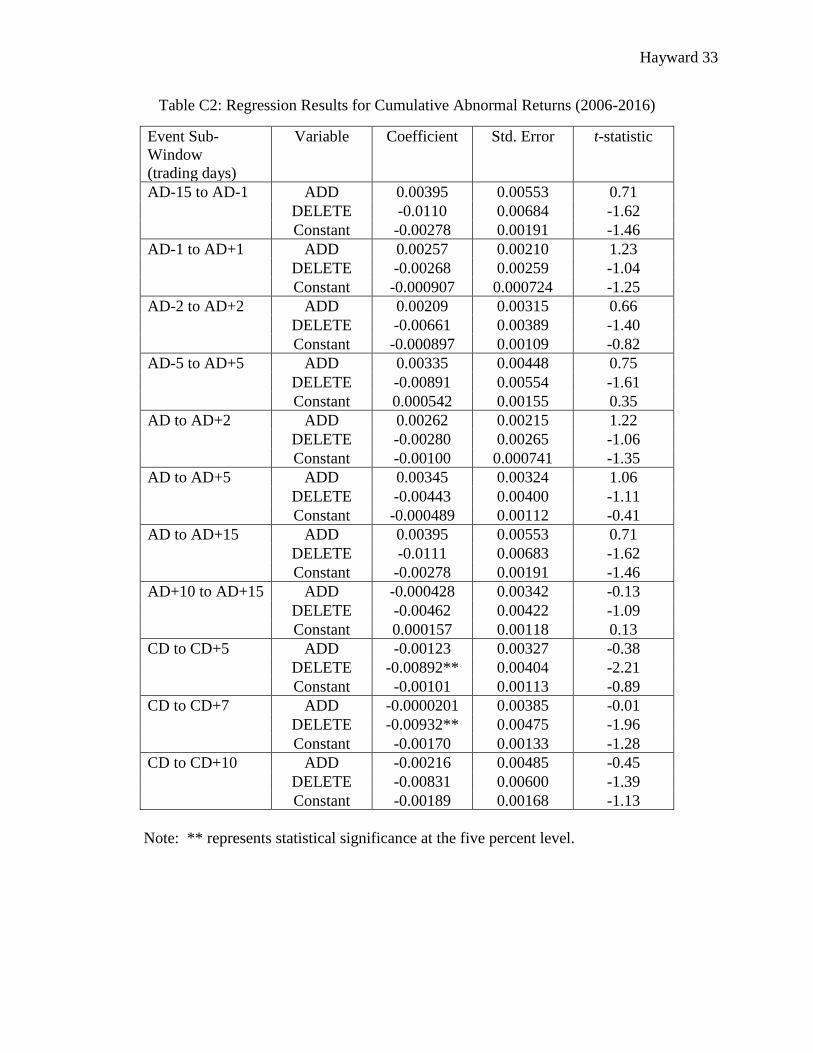
The regression results excluding the 2005 data are shown in Table C2 in Appendix C. If
the 2005 data are omitted, the regression analysis also indicates that the addition to the DJSI NA
no longer has a statistically significant impact on the CAR. In contrast, a deletion from the index
has substantially the same regression results if the 2005 data are included or excluded.
Average Cumulative Abnormal Returns by Year
Representative graphs of the average cumulative abnormal return (CAAR) by year are
shown in Appendix D. The graphs indicate that there is no apparent upward or downward trend
for CAAR from 2005 to 2016. Although the year 2008 appears to be an outlier on Figure D1,
the cause is likely related to the volatility of stock prices in September 2008 during the financial
crisis.
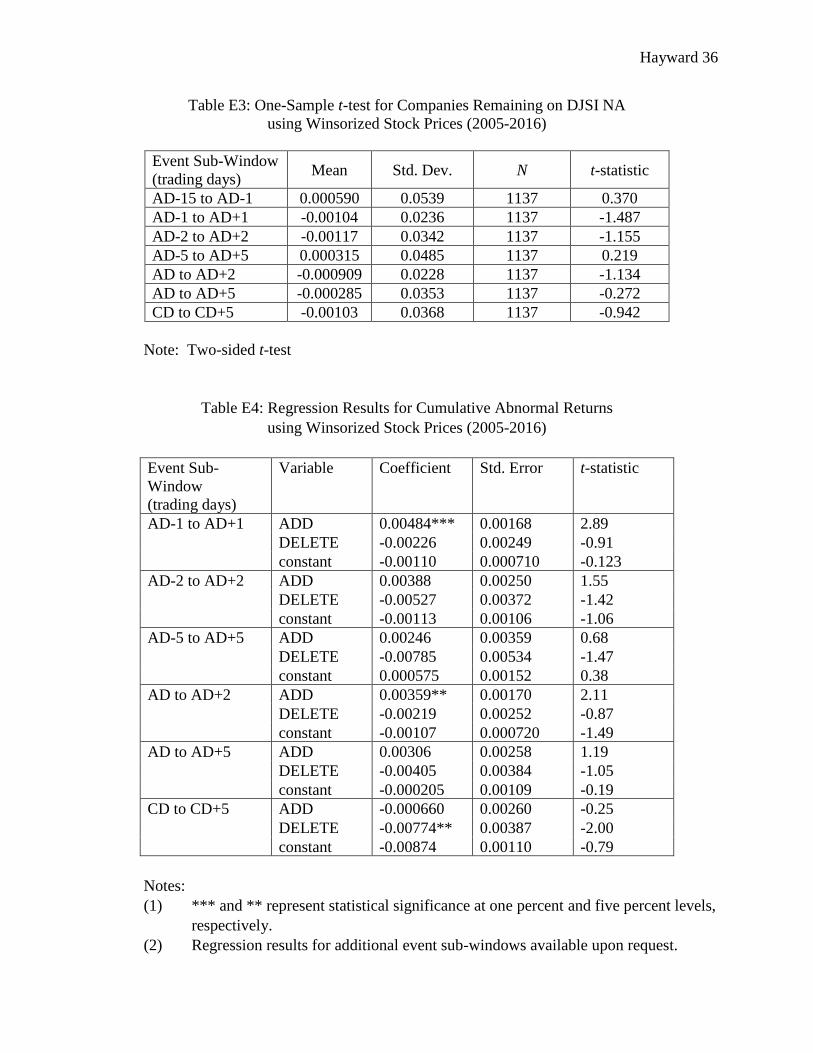
Effect of Winsorizing the Stock Prices
The results of winsorizing the closing stock prices are shown in Appendix E. The closing
stock prices are winsorized at the 99% and 1% level to mitigate the effect of outliers.
Winsorizing the stock prices does not substantially affect the results of the one-sample t-tests,
two-sample t-tests, and regression analyses.

Hayward 20
Comparison to Other Studies
Similar to Van Stekelenburg et al. (2015) and Cheung (2011), this study finds that the
deletion of a company from a DJSI index has a negative and statistically significant temporary
impact on stock price. Also, the addition of a company to the DJSI NA has a positive and
statistically significant temporary increase on stock price using data from 2005 to 2016.
However, unlike Van Stekelenburg et al. (2015), Cheung (2011), and Robinson et al. (2011), this
study finds that only the deletion from the index has a statistically significant impact if the 2005
data are excluded. The differences may be due to the different Dow Jones Sustainability Indices
and/or time frames.
Conclusion
Based on the regression results, the announcement that company is added to DJSI NA has
a statistically significant increase in stock price for two trading days after the announcement
date. In addition, the announcement that a company is removed from the DJSI NA has a
statistically significant decrease in stock price for seven trading days after the effective change
date. However, omitting the data from the inaugural year 2005, the announcement that a
company is added to the DJSI NA does not have a statistically significant impact on stock price.
The results suggest that there was a change in investor sentiment when company was
initially added to DJSI NA in 2005. The addition of the DJSI NA designation may have
increased the demand for the stock and thus increased the stock price. However, over time, the
prominence of the DJSI NA has perhaps declined. Using data from 2006 to 2016, the results
indicate that the stock market does not react to the announcement that a company is included on
the DJSI NA, but it does react to the announcement that a company is removed from the index.

Hayward 21
The results suggest that commitment to sustainability has become an expectation of doing
business. It appears the stock market no longer rewards a company for being included on the
DJSI NA, but it may penalize a company if it is removed from the index.

Hayward 22
References
Cheng, B., Ioannu, I., & Serafeimi, G. (2014). Corporate social responsibility and access to
finance. Strategic Management Journal, 35, 1-23.
Cheung, A. W. K. (2011). Do stock investors value corporate sustainability? Evidence from an
event study. Journal of Business Ethics, 99, 145-165.
Cheung, A. W. K., & Roca, E. (2013). The effect on price, liquidity and risk when stocks are
added to and deleted from a sustainability index: Evidence from the Asia Pacific context.
Journal of Asian Economics, 24(1), 51-65.
Consolandi, C., Jaiswal-Dale, A., Poggiani, E., & Vercelli, A. (2009). Global standards and
ethical stock indexes: The case of the Dow Jones Sustainability Stoxx Index. Journal of
Business Ethics, 87(1), 185-197.
Dorfleitner, G., Halbritter G., & Nguyen, M. (2015). Measuring the level and risk of corporate
responsibility: An empirical comparison of different ESG rating approaches. Journal of
Asset Management, 16(7), 450-466.
Lopez, M. V., Garcia, A., & Rodriguez, L. (2007). Sustainable development and corporate
performance: A study based on the Dow Jones Sustainability Index. Journal of Business
Ethics, 75(3), 285–300.
MacKinlay, A. C. (1997). Event studies in economics and finance. Journal of Economic
Literature, 35(1), 13-39.
Nidumolu, R., Prahalad C.K., & Rangaswami, M.R. (2009). Why sustainability is now the key
driver of innovation. Harvard Business Review, 87(9), 1-18.
Oberndorfer, U., Schmidt P., Wagner M., & Ziegler A. (2013). Does the stock market value the
inclusion in a sustainability index? An event study analysis for German firms. Journal of
Environmental Economics and Management, 66(3), 497-509.
RobecoSAM. (2015). Dow Jones Sustainability North America Composite Index. RobecoSAM.
Retrieved from http://www.robecosam.com/en/sustainability-insights/about-
sustainability/corporate-sustainability-assessment/send.jsp
RobecoSAM. (2016a). CSA guide: RobecoSAM’s Corporate Sustainability Assessment
methodology. RobecoSAM. Retrieved from http://www.sustainability-
indices.com/images/corporate-sustainability-assessment-methodology-guidebook.pdf
RobecoSAM. (2016b). Dow Jones Sustainability North America Index 2016 Component List.
RobecoSAM. Retrieved from
http://www.robecosam.com/images/DJSI2016_ComponentList_NorthAmerica.pdf

Hayward 23
RobecoSAM. (2017a). DJSI family. RobecoSAM. Retrieved from http://www.sustainability-
indices.com/
RobecoSAM. (2017b). The Corporate Sustainability Assessment at a glance. RobecoSAM.
Retrieved from http://www.robecosam.com/en/sustainability-insights/about-
sustainability/corporate-sustainability-assessment/index.jsp
Robinson, M., Kleffner A., & Bertels S. (2011). Signaling sustainability leadership: Empirical
evidence of the value of DJSI membership. Journal of Business Ethics, 101(3), 493-505.
Sadowski, M. (2013). Polling the experts: The 2013 ratings survey. Sustainability.com. Retrieved
from http://10458-presscdn-0-33.pagely.netdna-cdn.com/wp-
content/uploads/2016/07/ratings_research_globe_scan_sustain_ability_survey_2013.pdf
SAM and Dow Jones Indexes. (2009, September 3). SAM, Dow Jones Indexes and STOXX Ltd.
announce results of Dow Jones Sustainability Indexes review [Press Release]. Retrieved
from http://www.sustainability-indices.com/images/press-release-review-2009.pdf
SAM and Dow Jones Indexes. (2010, September 9). SAM and Dow Jones Indexes announce
results of the Dow Jones Sustainability Indexes review [Press Release]. Retrieved from
http://www.sustainability-indices.com/images/press-release-review-2010.pdf
SAM and Dow Jones Indexes. (2011, September 8). SAM and Dow Jones Indexes announce
2011 results of the Dow Jones Sustainability Indexes annual review [Press Release].
Retrieved from http://www.sustainability-indices.com/images/110908-djsi-review-
2011.pdf
Sam Group. (2006, September 6). Sam Group announces results of Dow Jones Sustainability
Indexes review [Press Release]. Retrieved from http://www.sustainability-
indices.com/images/press-release-review-2006.pdf
Sam Group. (2007, September 6). Sam Group announces results of Dow Jones Sustainability
Indexes review [Press Release]. Retrieved from http://www.sustainability-
indices.com/images/press-release-review-2007.pdf
Sam Group. (2008, September 4). Sam Group announces results of Dow Jones Sustainability
Indexes review [Press Release]. Retrieved from http://www.sustainability-
indices.com/images/press-release-review-2008.pdf
S&P Dow Jones Indices. (2016). DJSI North America Index fact sheet. Retrieved from
http://djindexes.com/mdsidx/downloads/fact_info/Dow_Jones_Sustainability_North_Am
erica_Index_Fact_Sheet.pdf

Hayward 24
S&P Dow Jones Indices and RobecoSAM. (2012, September 1). Results announced for 2012
Dow Jones Sustainability Indexes review [Press Release]. Retrieved from
http://www.sustainability-indices.com/images/120913-djsi-review-2012-e-vdef.pdf
S&P Dow Jones Indices and RobecoSAM. (2013, September 12). Results announced for 2013
Dow Jones Sustainability Indices review [Press Release]. Retrieved from
http://www.sustainability-indices.com/images/130912-djsi-review-2013-en-vdef.pdf
S&P Dow Jones Indices and RobecoSAM. (2014, September 11). Results announced for 2014
Dow Jones Sustainability Indices review [Press Release]. Retrieved from
http://www.sustainability-indices.com/images/140911-djsi-review-2014-en-vdef.pdf
S&P Dow Jones Indices and RobecoSAM. (2015, September 14). Results announced for 2015
Dow Jones Sustainability Indices review [Press Release]. Retrieved from
http://www.sustainability-indices.com/images/150910-djsi-review-2015-en-vdef.pdf
S&P Dow Jones Indices and RobecoSAM. (2016, September 12). Results announced for 2016
Dow Jones Sustainability Indices review [Press Release]. Retrieved from
http://www.sustainability-indices.com/images/160908-djsi-review-2016-en-vdef.pdf
U.S. SIF Foundation. (2016). Report on U.S. sustainable, responsible and impact investing
trends. USSIF Foundation. Retrieved from
http://www.ussif.org/files/SIF_Trends_16_Executive_Summary(1).pdf
Van Stekelenburg, A., Georgakopoulos, G., Sotiropoulou, V., Vasileiou K. Z., & Vlachos, I.
(2015). The relation between sustainability performance and stock market returns: An
empirical analysis of the Dow Jones Sustainability Index Europe.” International Journal
of Economics and Finance, 7(7), 74-88.

Hayward 25
Appendix A
Table 1: Companies Added to or Removed from DJSI NA (2005-2016)
3M Co. Boeing Co. eBay Inc.
Abbott Laboratories Bristol-Myers Squibb Co. Ecolab Inc.
AbbVie Inc. Brookfield Asset Management El Paso Corp.
Adobe Systems Inc. CA Inc. Electronic Data Systems Corp.
Advanced Micro Devices Inc. Cameco Corp. EMC Corp.
AES Corp. Campbell Soup Co. Enbridge Inc.
Aetna Inc. Canadian Imperial Bank EnCana Corp.
Aflac Inc. Canadian National Railway Co. Entergy Corp.
Agilent Technologies Inc. Cardinal Health Inc. Equity Office Properties Trust
Agnico-Eagle Mines Ltd. Caterpillar Inc. Exelon Corp.
Air Products & Chemicals Inc. CBRE Group Inc. Exxon Mobil Corp.
Akamai Technologies Inc. Cenovus Energy Inc. FedEx Corp.
Alcan Inc. CGI Group Inc. Fluor Corp.
Alcoa Inc. Chevron Corp. FMC Technologies Inc.
Allergan Inc. Chubb Ltd. Ford Motor Co.
Allergan plc Cisco Systems Inc. Freeport-McMoRan Copper & Gold
Allstate Corp. CIT Group Inc. Gannett Co. Inc.
Altria Group Inc. Citigroup Inc. Gap Inc.
American International Group Inc. CME Group Inc. Genentech Inc.
American Power Conversion Corp. Coach Inc. General Electric
American Water Works Co. Inc. Coca-Cola Co. General Mills Inc.
AmerisourceBergen Corp. Colgate-Palmolive Co. General Motors Co.
Amgen Inc. Comcast Corp. Genzyme Corp.
Applied Materials Inc. ConAgra Brands Inc. Georgia-Pacific Corp.
AT&T Inc. ConocoPhillips Gildan Activewear Inc.
Autodesk Inc. Consolidated Edison Inc. Goldcorp Inc.
Avon Products Inc. Constellation Energy Group Inc. Goldman Sachs Group Inc.
Ball Corp. Cooper Industries Ltd. Guidant Corp.
Bank of America Corp. CSX Corporation H&R Block Inc.
Bank of Montreal Cummins Inc. Halliburton Co.
Bank of New York Mellon Corp. CVS Health Corp. Hanesbrands Inc.
Bank of Nova Scotia Dell Technologies Inc. Hartford Financial Services Group
Barrick Gold Corp. Delphi Automotive PLC Hasbro Inc.
Baxalta Inc. Delta Air Lines Inc. HCP Inc.
Baxter International Inc. DIRECTV Health Net Inc.
BCE Inc. Dow Chemical Co. Hershey Co.
Bear Stearns Cos. Duke Energy Corp. Hess Corp.
Becton Dickinson & Co. Dun & Bradstreet Corp. Hewlett-Packard Co.
Best Buy Co. Inc. E.I. DuPont de Nemours & Co. Humana Inc.
Biogen Inc. Eastman Kodak Co. Inco Ltd.

Hayward 26
Table 1 - continued
Ingersoll-Rand PLC New York Times Co. Sprint Corp.
Intel Corp. Newmont Mining Corp. Stanley Black & Decker Inc.
IBM Corp. Nexen Inc. Staples Inc.
International Game Technology NextEra Energy Inc. Starbucks Corp.
Intuit Inc. Nike Inc. State Street Corp.
Iron Mountain Inc. NiSource Inc. Sun Life Financial Inc.
J.C. Penney Co. Inc. Nortel Networks Corp. Suncor Energy Inc.
Johnson & Johnson Northern Trust Corp. Symantec Corp.
Johnson Controls Inc. Northrop Grumman Corp. Talisman Energy Inc.
Jones Lang LaSalle Inc. Nvidia Corp. Target Corp.
JP Morgan Chase & Co. NYSE Euronext TE Connectivity Ltd.
Kimberly-Clark Corp. Occidental Petroleum Corp. TELUS Corp.
Kimco Realty Corp. Office Depot Inc. Teradata Corp.
Kinross Gold Corp. PepsiCo Inc. Texas Instruments Inc.
Kohl's Corp. Pfizer Inc. Thomson Reuters Corporation
Kroger Co. PG&E Corp. Tiffany & Co.
Las Vegas Sands Corp. Phillips 66 Tim Hortons Inc.
Liberty Global PLC Pinnacle West Capital Corp. Time Warner Inc.
Life Technologies Corp. Plum Creek Timber Co. Inc. Toronto-Dominion Bank
Lincoln National Corp. Potash Corp. of Saskatchewan TransAlta Corp.
Lockheed Martin Praxair Inc. TransCanada Corp.
Lowe's Cos. Procter & Gamble Co. Travelers Cos. Inc.
Macy's Inc. ProLogis Inc. United Parcel Service Inc.
ManpowerGroup Inc. Public Service Enterprise Group United Rentals Inc.
Manulife Financial Corp. Pulte Group Inc. United Technologies Corp.
Masco Corp. PVH Corp. UnitedHealth Group Inc.
Mastercard Inc. Quest Diagnostics Inc. Unum Group
McDonald's Corp. Rackspace Hosting Inc. Verizon Communications Inc.
McKesson Corp. Republic Services Inc. Virgin Media Inc.
Medtronic PLC Reynolds American Inc. Voya Financial Inc.
Merck & Co. Inc. Rockwell Automation Inc. Walt Disney Co.
MetLife Inc. Rockwell Collins Inc. Waste Management Inc.
Microsoft Corp. Royal Bank of Canada Welltower Inc.
Millipore Corp. Safeway Inc. Weyerhaeuser Co.
Molson Coors Brewing Co. Sara Lee Corp. Whirlpool Corp.
Mondelez International Inc. Schlumberger Ltd. Whole Foods Market Inc.
Morgan Stanley Sempra Energy Wyndham Worldwide Corp.
Motorola Mobility Holdings Inc. Sigma-Aldrich Corp. Xcel Energy Inc.
Motorola Solutions Inc. Smith International Inc. Xerox Corp.
Nalco Holding Co. Spectra Energy Corp. Xylem Inc.
Nasdaq Inc.

Hayward 27
Appendix B
Table B1: One-sample t-test for Companies Added to DJSI NA (2005-2016)
Event Sub-Window
(trading days) Mean Std. Dev. N t-statistic
AD-15 to AD-1 0.00210 0.0505 286 0.705
AD-1 to AD+1 0.00372*** 0.0248 286 2.544
AD-2 to AD+2 0.00310* 0.0334 286 1.566
AD-5 to AD+5 0.00326 0.0480 286 1.150
AD to AD+2 0.00220* 0.0232 286 1.607
AD to AD+5 0.00262* 0.0336 286 1.319
AD to AD+15 -0.00570 0.0605 286 -1.594
AD+10 to AD+15 -0.00387 0.0352 286 -1.862
CD to CD+5 -0.00175 0.0345 286 -0.859
CD to CD+7 -0.00103 0.0439 286 -0.396
CD to CD+10 -0.00570 0.0577 286 -1.671
Notes:
(1) *** and * represent statistical significance at one percent and ten percent levels,
respectively.
(2) One-sided t-test with Ha: mean>0
Table B2: One-sample t-test for Companies Removed from DJSI NA (2005-2016)
Event Sub-Window
(trading days) Mean Std. Dev. N t-statistic
AD-15 to AD-1 -0.00397 0.0473 122 -0.927
AD-1 to AD+1 -0.00374** 0.0207 122 -1.997
AD-2 to AD+2 -0.00621** 0.0359 122 -1.909
AD-5 to AD+5 -0.00566 0.0488 122 -1.280
AD to AD+2 -0.00397** 0.0238 122 -1.845
AD to AD+5 -0.00346 0.0332 122 -1.152
AD to AD+15 -0.0112** 0.0674 122 -1.842
AD+10 to AD+15 -0.00455* 0.0364 122 -1.380
CD to CD+5 -0.00696* 0.0494 122 -1.556
CD to CD+7 -0.00698* 0.0520 122 -1.483
CD to CD+10 -0.00654 0.0611 122 -1.181
Notes:
(1) ** and * represent statistical significance at five percent and ten percent levels,
respectively.
(2) One-sided t-test with Ha: mean<0

Hayward 28
Table B3: One-sample t-test for Companies Remaining on DJSI NA (2005-2016)
Event Sub-Window
(trading days) Mean Std. Dev. N t-statistic
AD-15 to AD-1 0.000732 0.0541 1137 0.456
AD-1 to AD+1 -0.000945 0.0236 1137 -1.350
AD-2 to AD+2 -0.00110 0.0343 1137 -1.082
AD-5 to AD+5 0.000380 0.0487 1137 0.264
AD to AD+2 -0.000928 0.0229 1137 -1.363
AD to AD+5 -0.000480 0.0355 1137 -0.456
AD to AD+15 -0.00244 0.0608 1137 -1.354
AD+10 to AD+15 0.000550 0.0379 1137 0.489
CD to CD+5 -0.000986 0.0372 1137 -0.894
CD to CD+7 -0.00183 0.0432 1137 -1.431
CD to CD+10 -0.00193 0.0528 1137 -1.233
Note: Two-sided t-test

Hayward 29
Table B4: Two-Sample t-test - Difference between Additions and Deletions from DJSI NA
(2005-2016)
Event Sub-Window
(trading days)
Difference
Mean
Difference
Standard
Error
t-statistic
AD-15 to AD-1
0.00608 0.00522 1.164
AD-1 to AD+1
0.00746*** 0.00238 3.141
AD-2 to AD+2
0.00930*** 0.00360 2.445
AD-5 to AD+5
0.00892** 0.00525 1.698
AD to AD+2
0.00617*** 0.00255 2.420
AD to AD+5
0.00609** 0.00360 1.689
AD to AD+15
0.00554 0.00707 0.783
AD+10 to AD+15
0.000681 0.00390 0.174
CD to CD+5
0.00520 0.00491 1.059
CD to CD+7
0.00595 0.00537 1.108
CD to CD+10
0.000839 0.00650 0.129
Notes:
(1) Two-sample t-test with unequal variances
(2) *** and ** represent statistical significance at one percent and five
percent levels, respectively.
(3) One-sided t-test with Ha: diff>0

Hayward 30
Table B5: Two-Sample t-test - Difference between Additions and Remains on DJSI NA
(2005-2016)
Event Sub-Window
(trading days)
Difference
Mean
Difference
Standard
Error
t-statistic
AD-15 to AD-1 0.00137 0.00339 0.405
AD-1 to AD+1
0.00467*** 0.00162 2.877
AD-2 to AD+2
0.00420** 0.00222 1.888
AD-5 to AD+5
0.00288 0.00318 0.906
AD to AD+2
0.00313** 0.00153 2.045
AD to AD+5
0.00310* 0.00225 1.380
AD to AD+15
-0.00326 0.00400 -0.813
AD+10 to AD+15
-0.00442 0.00236 -1.871
CD to CD+5
-0.000767 0.00232 -0.0367
CD to CD+7
0.000807 0.00289 0.279
CD to CD+10
-0.00377 0.00375 -1.0043
Notes:
(1) Two-sample t-test with unequal variances
(2) ***, ** and * represent statistical significance at one percent, five percent
and ten percent levels, respectively.
(3) Two-tailed t-test

Hayward 31
Table B6: Two-Sample t-test - Difference between Remains and Deletions from DJSI NA
(2005-2016)
Event Sub-Window
(trading days)
Difference
Mean
Difference
Standard
Error
t-statistic
AD-15 to AD-1
0.00471 0.00458 1.028
AD-1 to AD+1
0.00279* 0.00200 1.397
AD-2 to AD+2
0.00511* 0.00341 1.499
AD-5 to AD+5
0.00604* 0.00465 1.298
AD to AD+2
0.00304* 0.00226 1.348
AD to AD+5
0.00298 0.00319 0.937
AD to AD+15
000880* 0.00636 1.383
AD+10 to AD+15
0.00510* 0.00349 1.464
CD to CD+5
0.00597* 0.00460 1.297
CD to CD+7
0.00514 0.00488 1.0549
CD to CD+10
0.00460 0.00575 0.8010
Notes:
(1) Two-sample t-test with unequal variances
(2) * represents statistical significance at the ten percent level.
(3) Two-tailed t-test
Hayward 32
Appendix C
Table C1: One-Sample t-test for Companies Added to DJSI NA
(2006-2016)
Event Sub-
Window
(trading days)
Mean Std. Dev. N t-statistic
AD-15 to AD-1 0.00244 0.0532 193 0.637
AD-1 to AD+1 0.00197 0.0268 193 1.0223
AD-2 to AD+2 0.00157 0.0371 193 0.587
AD-5 to AD+5 0.00312 0.0521 193 0.831
AD to AD+2 0.00127 0.0256 193 0.691
AD to AD+5 0.00222 0.0370 193 0.833
AD to AD+15 -0.00251 0.0614 193 -0.568
AD+10 to AD+15 -0.00253 0.00271 193 -0.934
CD to CD+5 -0.00427 0.0379 193 -1.564
CD to CD+7 -0.00348 0.0482 193 -1.0041
CD to CD+10 -0.00616 0.0639 193 -1.339
Note: One-sided t-test with Ha: mean>0
Hayward 33
Table C2: Regression Results for Cumulative Abnormal Returns (2006-2016)
Event Sub-
Window
(trading days)
Variable Coefficient Std. Error t-statistic
AD-15 to AD-1
ADD 0.00395 0.00553 0.71
DELETE -0.0110 0.00684 -1.62
Constant -0.00278 0.00191 -1.46
AD-1 to AD+1 ADD 0.00257 0.00210 1.23
DELETE -0.00268 0.00259 -1.04
Constant -0.000907 0.000724 -1.25
AD-2 to AD+2 ADD 0.00209 0.00315 0.66
DELETE -0.00661 0.00389 -1.40
Constant -0.000897 0.00109 -0.82
AD-5 to AD+5 ADD 0.00335 0.00448 0.75
DELETE -0.00891 0.00554 -1.61
Constant 0.000542 0.00155 0.35
AD to AD+2 ADD 0.00262 0.00215 1.22
DELETE -0.00280 0.00265 -1.06
Constant -0.00100 0.000741 -1.35
AD to AD+5 ADD 0.00345 0.00324 1.06
DELETE -0.00443 0.00400 -1.11
Constant -0.000489 0.00112 -0.41
AD to AD+15 ADD 0.00395 0.00553 0.71
DELETE -0.0111 0.00683 -1.62
Constant -0.00278 0.00191 -1.46
AD+10 to AD+15 ADD -0.000428 0.00342 -0.13
DELETE -0.00462 0.00422 -1.09
Constant 0.000157 0.00118 0.13
CD to CD+5 ADD -0.00123 0.00327 -0.38
DELETE -0.00892** 0.00404 -2.21
Constant -0.00101 0.00113 -0.89
CD to CD+7 ADD -0.0000201 0.00385 -0.01
DELETE -0.00932** 0.00475 -1.96
Constant -0.00170 0.00133 -1.28
CD to CD+10 ADD -0.00216 0.00485 -0.45
DELETE -0.00831 0.00600 -1.39
Constant -0.00189 0.00168 -1.13
Note: ** represents statistical significance at the five percent level.

Hayward 34
Appendix D
Figure D1: CAAR by Year (Event Window AD-1 to AD+1 Trading Days)
Figure D2: CAAR by Year (Event Window AD-5 to AD+5 Trading Days)
-0.05
-0.04
-0.03
-0.02
-0.01
0
0.01
0.02
2005 2006 2007 2008 2009 2010 2011 2012 2013 2014 2015 2016
CA
AR
Year
Deletion Remain Addition
-0.05
-0.04
-0.03
-0.02
-0.01
0
0.01
0.02
0.03
2005 2006 2007 2008 2009 2010 2011 2012 2013 2014 2015 2016
CA
AR
Year
Deletion Remain Addition

Hayward 35
Appendix E
Table E1: One-Sample t-test for Companies Added to DJSI NA
using Winsorized Stock Prices (2005-2016)
Event Sub-Window
(trading days) Mean Std. Dev. N t-statistic
AD-15 to AD-1 0.00199 0.0503 286 0.670
AD-1 to AD+1 0.00368*** 0.0246 286 2.531
AD-2 to AD+2 0.00283* 0.0331 286 1.446
AD-5 to AD+5 0.00335 0.0477 286 1.186
AD to AD+2 0.00212* 0.0232 286 1.552
AD to AD+5 0.00276* 0.0336 286 1.387
CD to CD+5 -0.00184 0.0345 286 -0.902
Notes:
(1) *** and * represent statistical significance at one percent and ten percent levels,
respectively.
(2) One-sided t-test with Ha: mean>0
Table E2: One-Sample t-test for Companies Removed from DJSI NA
using Winsorized Stock Prices (2005-2016)
Event Sub-
Window
(trading days)
Mean Std. Dev. N t-statistic
AD-15 to AD-1 -0.00390 0.0474 122 -0.909
AD-1 to AD+1 -0.00374** 0.0207 122 -2.002
AD-2 to AD+2 -0.00614** 0.0358 122 -1.8971
AD-5 to AD+5 -0.00559 0.0487 122 -1.269
AD to AD+2 -0.00387** 0.0238 122 -1.798
AD to AD+5 -0.00327 0.0332 122 -1.0877
CD to CD+5 -0.00644* 0.0504 122 -1.413
Notes:
(1) ** and * represent statistical significance at five percent and ten percent levels,
respectively.
(2) One-sided t-test with Ha: mean<0
Hayward 36
Table E3: One-Sample t-test for Companies Remaining on DJSI NA
using Winsorized Stock Prices (2005-2016)
Event Sub-Window
(trading days) Mean Std. Dev. N t-statistic
AD-15 to AD-1 0.000590 0.0539 1137 0.370
AD-1 to AD+1 -0.00104 0.0236 1137 -1.487
AD-2 to AD+2 -0.00117 0.0342 1137 -1.155
AD-5 to AD+5 0.000315 0.0485 1137 0.219
AD to AD+2 -0.000909 0.0228 1137 -1.134
AD to AD+5 -0.000285 0.0353 1137 -0.272
CD to CD+5 -0.00103 0.0368 1137 -0.942
Note: Two-sided t-test
Table E4: Regression Results for Cumulative Abnormal Returns
using Winsorized Stock Prices (2005-2016)
Event Sub-
Window
(trading days)
Variable Coefficient Std. Error t-statistic
AD-1 to AD+1 ADD 0.00484*** 0.00168 2.89
DELETE -0.00226 0.00249 -0.91
constant -0.00110 0.000710 -0.123
AD-2 to AD+2 ADD 0.00388 0.00250 1.55
DELETE -0.00527 0.00372 -1.42
constant -0.00113 0.00106 -1.06
AD-5 to AD+5 ADD 0.00246 0.00359 0.68
DELETE -0.00785 0.00534 -1.47
constant 0.000575 0.00152 0.38
AD to AD+2 ADD 0.00359** 0.00170 2.11
DELETE -0.00219 0.00252 -0.87
constant -0.00107 0.000720 -1.49
AD to AD+5 ADD 0.00306 0.00258 1.19
DELETE -0.00405 0.00384 -1.05
constant -0.000205 0.00109 -0.19
CD to CD+5 ADD -0.000660 0.00260 -0.25
DELETE -0.00774** 0.00387 -2.00
constant -0.00874 0.00110 -0.79
Notes:
(1) *** and ** represent statistical significance at one percent and five percent levels,
respectively.
(2) Regression results for additional event sub-windows available upon request.

Hayward 37
Table E5: One-sample t-test for Companies Added to DJSI NA
using Winsorized Stock Prices (2006-2016)
Event Sub-Window
(trading days) Mean Std. Dev. N t-statistic
AD-15 to AD-1 0.00233 0.0530 193 0.610
AD-1 to AD+1 0.00201 0.0267 193 1.0512
AD-2 to AD+2 0.00129 0.0367 193 0.489
AD-5 to AD+5 0.00337 0.0521 193 0.899
AD to AD+2 0.00116 0.0256 193 0.629
AD to AD+5 0.00252 0.0370 193 0.945
CD to CD+5 -0.00430 0.0381 193 -1.569
Note: One-sided t-test with Ha: mean>0
Table E6: Regression Results for Cumulative Abnormal Returns
using Winsorized Stock Prices (2006-2016)
Event Sub-
Window
(trading days)
Variable Coefficient Std. Error t-statistic
AD-1 to AD+1 ADD 0.00274 0.00209 1.31
DELETE -0.00278 0.00258 -1.08
constant -0.000990 0.000722 -1.37
AD-2 to AD+2 ADD 0.00200 0.00314 0.63
DELETE -0.00644 0.00388 -1.36
constant -0.000988 0.00109 -0.91
AD-5 to AD+5 ADD 0.00367 0.00448 0.82
DELETE -0.00897 0.00553 -1.62
constant 0.00491 0.00155 0.32
AD to AD+2 ADD 0.00242 0.00213 1.14
DELETE -0.00281 0.00264 -1.07
constant 0.000969 0.00737 1.32
AD to AD+5 ADD 0.00350 0.00323 1.08
DELETE -0.00467 0.00399 -1.17
constant -0.000236 0.00111 -0.21
CD to CD+5 ADD -0.00150 0.00326 -0.46
DELETE -0.00869** 0.00403 -2.16
constant -0.000988 0.0113 -0.88
Notes:
(1) ** represents statistical significance at the five percent level.
(2) Regression results for additional event sub-windows available upon request.


![[ARCHIVE] Trends in Sustainability Disclosure: Benchmarking the World’s Composite Stock Exchanges](https://img.pdfslide.us/doc/110x75/546e500db4af9fc8268b4611/archive-trends-in-sustainability-disclosure-benchmarking-the-worlds-composite-stock-exchanges.jpg)