Embed Size (px)
Citation preview
THE JOURNAL OF FINANCE . VOL. LII, NO. 4 - SEPTEMBER 1997
Does the Specialist Matter? Differential Execution Costs and Intersecurity Subsidization
on the New York Stock Exchange
CHARLES CAO, HYUK CHOE, and FRANK HATHEWAY*
ABSTRACT This article tests for differences in execution costs among specialist firms for New York Stock Exchange listed securities. Execution cost differences provide a measure of the relative performance of specialist firms. We find a substantial difference in effective spreads and order processing costs across specialist firms, controlling for stock characteristics. While economically significant, the differences in execution costs between specialist firms are much smaller than the cross-market differences reported by Huang and Stoll (1996). Within a specialist firm, there is a positive relation between order processing costs and trading activity that is consistent with the hypothesis that active stocks subsidize inactive stocks.
THIS ARTICLE INVESTIGATES WHETHER differential execution costs exist across New York Stock Exchange (NYSE) specialist firms and among stocks traded by the same specialist firm. Execution costs are paid by investors when completing a trade, and are separate from the commission costs paid to a broker. Execution costs arise from the bid-ask spread and the price impact of an investor’s order on the future bid-ask quote. Stoll(1985) shows that a transactionally efficient financial market which minimizes execution costs also minimizes the devia- tion in transaction prices from the true price of the underlying security. Evidence of differential execution costs for similar securities can be used to identify high cost and low cost liquidity providers on the NYSE. Furthermore, differential execution costs among stocks traded by the same specialist firm provide evidence consistent with a subsidy from actively traded to inactively traded stocks.
* Cao and Hatheway are from Pennsylvania State University. Choe is from Seoul National University. We appreciate the comments made by an anonymous referee, participants at the 1995 Conference on Financial Economics and Accounting a t the University of Maryland, the 1996 Utah Finance Conference, the 1996 European Finance Association Meetings in Oslo, and the 1996 Financial Management Association Meetings in New Orleans; by seminar participants at the Pennsylvania State University; and by Jim Angel, David Becher, Russ Ezzell, Gordon Hanka, Burton Hollifield, Eugene Kandel, Bill Kracaw, Ananth Madhavan, Chris Muscarella, Harold Mulherin, Leonard Schneck, Dennis Sheehan and Ren6 Stulz. We also benefited from conversa- tions with Joel Hasbrouck, Roger Huang, Charles Lee, Matthew Spiegel, and Hans Stoll. We thank Linda Corbin, Brian McNamara, James Shapiro, and George Sofianos of the NYSE, Robert Seijas of Merrill Lynch Specialist, Inc., and Bruce Harvey and Jack Shaw of Wagner, Stott and Co. for their descriptions of the workings of the NYSE. All errors are our own.
1615
1616 The Journal of Finance
This article focuses on the effective spread for stocks listed on the NYSE. The effective spread is estimated using the microstructure model of Glosten and Harris (1988). The components of the effective spread include order processing costs, which are established by the specialist firm, and asymmetric informa- tion costs, which are determined by the information characteristics of the stock.
The first academic article to address the role of specialist firms is the proposal of Barnea (1974) for comparing NYSE specialists based on stock volatility. Recently, Corwiin (1996) finds that transitory volatility and trading continuity differ across specialist firms. Additionally, Coughenour and Deli (1996) report that inventory holding costs are associated with the organiza- tional form of the specialist firm. Our article explores the importance of the identity of the specialist firm using several measures of execution costs. We use a cross-sectional regression analysis and a matched sample comparison to control for differences in the stocks assigned to a specialist firm.
Our primary finding is that execution costs differ significantly across spe- cialist firms after controlling for stock specific characteristics. The average effective spread for the 40 specialist firms is estimated to be 9.7 cents per share with a standard deviation of 0.6 cents. The 90th percentile and the 10th percentile effective spreads are 10.68 and 8.64 cents per share with this difference significant at the 5 percent level. This represents a cost difference to investors of over $4.1 million per year based on an average daily volume of 68,600 shares across the 23 stocks assigned to the 90th percentile specialist firm.1 The result indicates that there may be differences in efficiency andor profitability across NYSE specialist firms. While the 2 cent per share differ- ence in execution costs across specialist firms is economically significant, it is dramatically smaller than the 22 cent per share difference reported by Huang and Stoll (1996) between stocks on the NYSE and stocks on the National Association of Security Dealers Automated Quotation (Nasdaq) system. Thus, differences in market structure impose much higher costs relative to differen- tial efficiencies in specialist firms.
For stocks traded by the same specialist firm, the order processing costs associated with providing liquidity, intuitively the noninformational costs of trading, are higher for actively traded stocks. Among 40 specialist firms, 37 firms show a positive relation between order processing costs and the number of trades in the stock, of which 21 are significant at the 5 percent level. This implies that, all else equal: the more actively a stock trades, the greater is the execution cost paid by investors in that stock on a per share basis. The evidence is consistent with the existence of a cross-subsidy from actively traded stocks to inactively traded stocks within a specialist firm.
While we do not formally test for a subsidy, our finding that the costs paid by investors for executing trades increase in trading frequency is consistent with prior beliefs. Easley, Kiefer, O’Hara, and Paperman (1996) note that inactive stocks are assigned to specialists as part of a portfolio of stocks with
1.02 cents X 68,600 sharedday X 256 days X 23 stocks = $4,120,000.
Does the Specialist Matter? 1617
the understanding that frequently traded stocks will subsidize infrequently traded ones.
The structure of the article is as follows. Section I discusses the institutional background of the NYSE specialist firms. Section I1 develops the testable hypotheses, and Section 111 describes the data. In Section IV, we present the microstructure models used to estimate the effective spread and its compo- nents. Section V presents empirical estimates of execution costs, evidence of differential costs across specialist firms, and the nature of differential costs for stocks assigned to each specialist firm. Section VI concludes.
I. Institutional Background
The sole responsibility for making a market (establishing bid and ask prices) in NYSE listed securities is assigned to one NYSE member firm by the Allocation Committee of the NYSE. A specialist firm typically is assigned many common stocks, from 12 to several hundred. Under the rules of the NYSE, the specialist firm accepts an obligation to maintain a “continuous and orderly” market in the stock in return for the informational benefits of a permanent presence at the apex of NYSE trading in that stock. Such an obligation may force the specialist firm to subsidize unprofitable stocks with profitable, actively traded issues.
The NYSE sets several performance criteria for a specialist firm. Four of these are stressed in the NYSE’s report on market quality and performance, and included in the New York Stock Exchange Fact Book (1993): (1) Price continuity: Minimize successive price changes. A change of $Ys or less occurs on 97 percent of all trades. (2) Quotation spreads: Minimize the difference between the quoted bid and asked prices. A difference of $Y4 or less occurs on 89 percent of posted quotes. (3) Market depth: Minimize price changes for trades of 3,000 shares. A change of $Ys or less occurs on 88 percent of such trades. (4) Stabilization: Buy on down-ticks and sell on up-ticks. Stabilizing trades are 78 percent of specialist trades. Similar statistics apply for the 1995 data.
In addition, specialists cannot compete with public orders and must allow all public orders on the same side of the market as the specialist to trade at the current price before the specialist can trade at that price. A formal surveillance process determines how well these criteria are satisfied. Allocation decisions are influenced by the surveillance reports as well as by subjective factors.2 It is uncommon for the NYSE to reassign a stock based on the failure of the existing specialist firm to fulfill its responsibilities. Indeed, only two reassign- ments have occurred in the past five years. Finally, although a specialist firm can request the withdrawal of its specialist registration merely by writing to the NYSE’s Allocation Committee, no specialist firm in recent memory has
A complete list of the allocation criteria is provided in New York Stock Exchange Policy and Procedures, 1995.
1618 The Journal of Finance
done so. In practice, specialist firms are discouraged from surrendering as- signed stocks even though they are unprofitable.
Meeting the performance criteria of the NYSE may be costly since the specialist is mandated to provide liquidity at times when other traders decline to do so. Therefore, the specialist risks incurring undesired, long lived, and potentially costly changes in their inventory as documented by Madhavan and Smidt (1993). Furthermore, the stabilization requirement limits the special- ist’s ability to run the book (hitting successive bids or taking successive offers) in reaction to new information.
The specialist receives compensation for the NYSE requirements in two ways. First, he observes all the order flow on the NYSE, the identity of submitting brokers, and the contents of the limit order book which provide an informational advantage in trading. Second, the specialist is able to capture the bid-ask spread. Hasbrouck and Sofianos (1993) have documented that both advantages are profitable to specialists with the bid-ask spread being the principle source of income.
Historically, specialist firms were relatively small, independent broker- dealers organized as partnerships or closely held corporations. However, the number of specialist firms has been declining over the years with noticeable decreases around certain events. A spate of acquisitions and consolidations followed the deregulation of commissions in 1975. Most recently, 21 specialist firms have merged, been acquired or otherwise been absorbed since the 1987 stock market crash (The Wall Street Journal, July 2, 1992). The current collection of specialist firms includes very small, closely held firms whose only line of business is their specialist activities to financial giants such as Merrill Lynch & Co., Inc.
11:. Testable Hypotheses
This section develops three testable hypotheses. The first two address dif- ferences in execution costs among specialist firms. The third concerns differ- ences in execution costs for stocks traded within specialist firms. Differences in execution costs between specialist firms can provide evidence of the relative efficiency/profitability of specialist firms. Differences in execution costs for stocks traded by a single specialist firm are consistent with the presence of a subsidy in trade executions.
The first two hypotheses are developed from the implications of existing market microstructure studies. These studies have shown that the bid-ask spread can be decomposed into two components: the order processing compo- nent and the asymmetric information component (see Glosten and Harris (1988), Stoll (1989), George, Kaul, and Nimalendran (1991), and Madhavan, Richardson, and Roomans (1994) among others). The order processing compo- nent covers costs to the specialist for transaction services and includes the direct costs of handling the order, inventory costs related to financing inven- tory, exchange seat fees, other fixed costs, and profit. The nature of these costs implies that the costs of transaction services have both a fixed and a variable
Does the Specialist Matter? 1619
component. The existing empirical evidence suggests that the inventory cost is small (for example, Hasbrouck (1988), Stoll(1989) and Madhavan and Smidt (1991)). For this reason, we do not distinguish among order processing, other fixed costs, and inventory costs. All costs to investors other than asymmetric information costs are referred to as order processing costs.
The question of whether there are any differences in execution costs across specialist firms is addressed in the first hypothesis. After controlling for differences in stocks’ characteristics, H1 may be stated as:
H1: The effective spreads per share are equal across specialist firms.
As indicated, the effective spread consists of both order processing costs and asymmetric information costs, so evidence of differences in the effective spread warrants further analysis of the components of the spread. We focus on differences in the order processing cost component. Since we assume that asymmetric information costs are determined exogenously by such factors as insider holdings, volatility of the stock’s cash flows, analysts’ research activi- ties, and others, we do not develop a formal hypothesis about asymmetric information costs. After controlling for differences in stocks’ characteristics, H2 may be stated as:
H2: Order processing costs per share are equal across specialist firms.
Differential order processing costs provide evidence of the relative efficiency and/or profitability of specialist firms. As argued previously, order processing costs consist primarily of internal costs (a measure of specialist firm efficiency) and profit. Under an assumption of zero economic profit, two equally efficient specialist firms would have similar order processing costs. If there are no entry/exit barriers in the market for trade executions, then only efficient specialist firms will survive in the long run and all specialist firms should have similar order processing costs. On the other hand, if we assume specialists are equally efficient, then two equally profitable specialist firms would have sim- ilar order processing costs. Therefore, the zero economic profit assumption for all specialist firms implies that there should not be differences in order pro- cessing costs due to differences in trading skill, organizational structure, or other attributes of the specialist firm. Jointly, under the equal efficiency and zero economic profit assumptions, the only source of differential order process- ing costs should be factors associated with the stock. The identity of the specialist firm should have no impact.
A rejection of H2 would be important because differential order processing costs across specialist firms is consistent with costs attributable to the spe- cialist firm affecting the costs to investors. A rejection of the hypothesis is a rejection of the joint hypotheses of equal efficiency and zero economic profit for specialist firms. Determining the relative importance of efficiency and profit in explaining the differences across specialist firms would require unavailable internal information about the costs and profits of specialist firms and is beyond the scope of this article. However, some insight into the relative impacts of efficiency and profit on order processing costs can be gained by
1620 The Journal of Finance
asking whether there are differences in order processing costs for the stocks assigned to a single specialist firm.
From the specialist firm’s perspective, the internal costs of completing a trade should be decreasing in trading volume as suggested by Stoll (1985) because of economies of scale in transactions. For a given stock, if there are no economies of scale in trading then the internal cost should be the same for all stocks assigned to the firrn as each trade requires the same combination of inputs. If there are economies of scale in trading a given stock, then active stocks should have lower internal costs than inactive stocks. The internal costs of the specialist firm cannlot be directly observed. However, order processing costs include all the internal costs to the firm along with the firms’ gross profit. Therefore, under the joint hypotheses that there are no diseconomies of scale and profits are equal across stocks, H3 is stated as:
H3: Low trading frequency stocks should have per share order processing costs equal to or greater than high trading frequency stocks.
A rejection of H3 would be consistent either with diseconomies of scale within a specialist firm or with differences in profit among the stocks assigned to a specialist firm. Because diseconomies of scale are unlikely, we conclude that there are profit differences across stocks traded by a specialist firm. The presence of differential profits across stocks for NYSE specialist firms is explicit in the premise of Grossman and Miller (1988) and Easley, Kiefer, O’Hara, and Paperman (1996). They conjecture that specialist firms subsidize trading in inactive stocks with revenues from active ones. If there are profit differences across stocks within a specialist firm, then these differences may contribute to the rejection of H2 as well. In Section V, we develop the impli- cations of consumer subsidies for the market for trade executions on the NYSE and present evidence that such subsidies exist.
111. Data
A. Specialist Data
We use the NYSE Specia.list Directory for April, 1993 to identify the NYSE listed security assigned to each specialist firm. The directory lists, by symbol, all stocks that were traded on the NYSE at the start of each quarter. Associ- ated with each stock is a numeric code for each of the specialist firms used in this sample.
B. The Transactions Data
We use intraday transactions data for the period March 1, 1993 to May 31, 1993 to study the execution costs at the stock level. The initial transactions data consist of all trades and quotes for all NYSE stocks that exist on the Trade and Quote (TAQ) database. There are 1,811 common stocks on both the TAQ and Specialist Directory data sets. Trades and quotes flagged as opening,
Does the Specialist Matter? 1621
errors, nonstandard delivery trades, as well as all Best Bidoffer (BBO) inel- igible quotes are eliminated.3
We construct a subsample of available stocks by selecting those stocks that satisfy the following criteria. (i) There must be at least 26 valid weekly return observations in the Center for Research in Security Prices (CRSP) stocks files for the one-year period prior to March 1, 1993. (ii) Any stock delisted by the NYSE during the period from March 1 to May 31, 1993 is excluded from the sample. (iii) The average stock price from the CRSP stock files in the one-year period prior to March 1, 1993 is between $3 and $200.4 (iv) Stocks with less than 300 transactions during the three months sample period are dropped. The application of criteria (i) and (ii) results in the elimination of 122 (6.7 percent) stocks, criteria (iii) and (iv) eliminate 29 (1.6 percent) and 116 (6.4 percent) of the initial stocks respectively. The final sample contains 1,544 stocks.
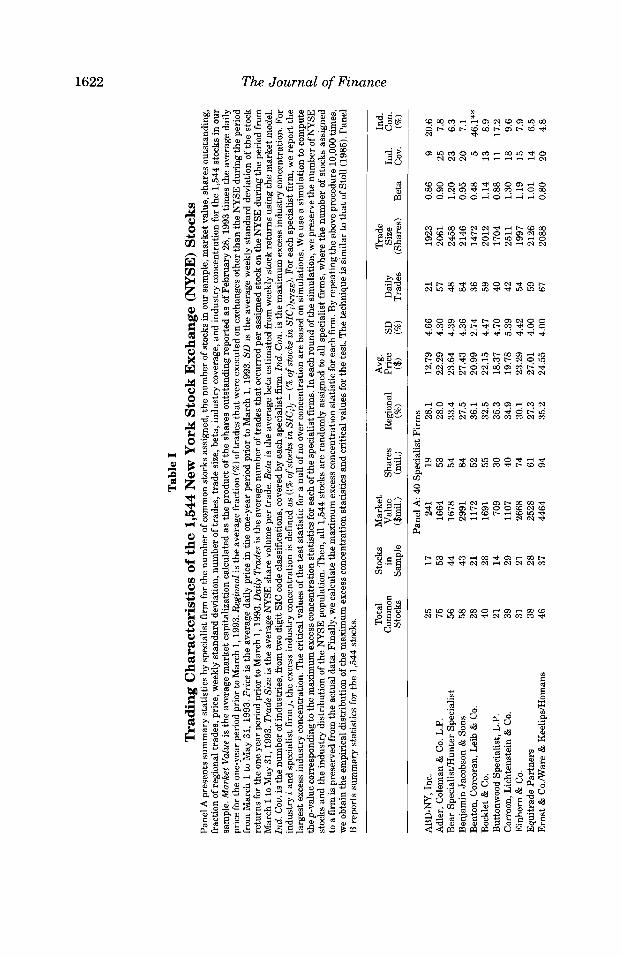
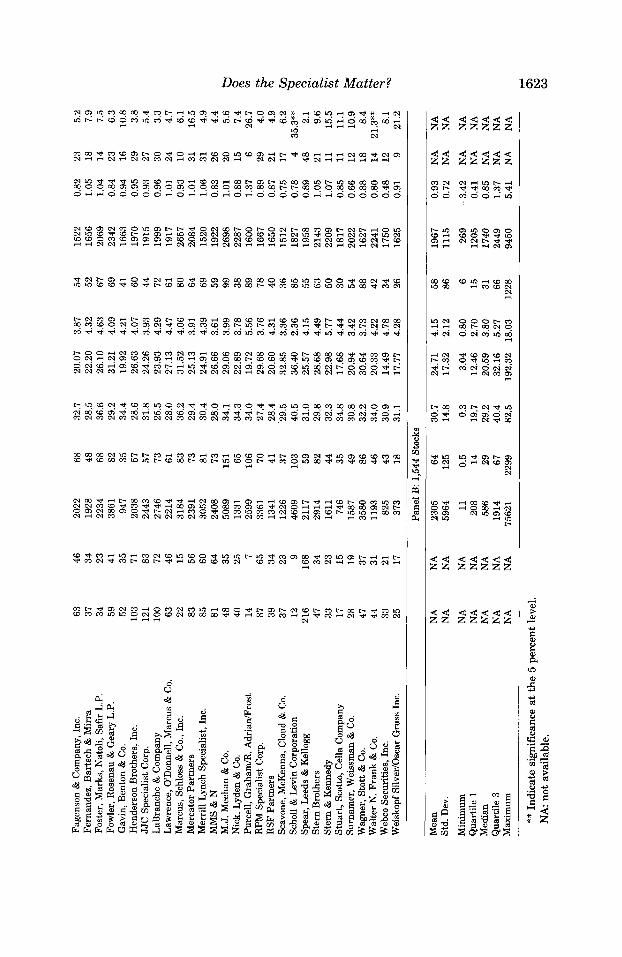
Panel A of Table I provides summary statistics organized by specialist firm for the total number of common stocks assigned to each firm, the number of these stocks in our sample, and summary statistics of several relevant factors including those for variables used in the analysis. On average, there are 53 common stocks assigned to each specialist firm of which 39 stocks remain in our sample. The smallest specialist firm in the sample has 7 of 14 common stocks remaining. Table I also reports the industry coverage measured by the number of two digit Standard Industrial Classification (SIC) codes for stocks assigned to the specialist firm, and a measure of excess industry concentration based on the first two digits of the SIC codes. The average number of industries represented in the sample for each specialist firm is 19. The average specialist firm is 10.2 percent more concentrated than the NYSE floor in its most heavily represented industry. Of the 40 firms, three have maximum concentration measures that are statistically significant at the 5 percent level. This suggests that specialist firms do not specialize in stocks of a certain industry. The stocks handled by each specialist firm are generally well diversified.
Panel B of Table I presents summary statistics for variables used in the analysis for the 1,544 sample stocks. A comparison of Panel B t o the summary statistics for the 2,041 common stocks listed on the NYSE as of March 1, 1993 indicates that the sample is representative of all common stocks traded on the NYSE. For example, the NYSE averages for market value, shares outstanding, and average price for all common stocks are $1,812 million, 53 million, and $27.23, respectively. For our sample, the average market value, shares out- standing and share price are $2,305 million, 64 million, and $24.71, respec- tively.
BBO-ineligible quotes are closing quotations, trading halts, preopening indications, and nonfirm quotations. Trades which are in sequence but are reported late are retained in the data set. The impact of these observations is expected to be small since only a tiny fraction of the observations (0.02 percent) in the sample falls into this category.
For low price stocks, the minimum price increment of $0.125 may distort the analysis. For high price stocks, the large quoted spread (over $100 for Berkshire-Hathaway) may also create distortions. Therefore, we drop both high and low price stocks.
Tab
le I
T
radi
ng C
har
acte
rist
ics
of t
he
1,54
4 N
ew York
Stoc
k E
xch
ange
(NYSE) S
tock
s Pa
nel A
pre
sent
s su
mm
ary
stat
isti
cs by
spe
cial
ist f
irm
for t
he n
umbe
r of c
omm
on s
tock
s as
sign
ed, t
he n
umbe
r of
sto
cks
in o
ur s
ampl
e, m
arke
t val
ue, s
hare
s out
stan
ding
, fr
actio
n of
reg
iona
l tra
des,
pri
ce, w
eekl
y st
anda
rd d
evia
tion,
num
ber
of tr
ades
, tra
de si
ze, b
eta,
indu
stry
cov
erag
e, a
nd in
dust
ry c
once
ntra
tion
for t
he 1
,544
stoc
ks in
our
sa
mpl
e. M
arke
t Val
ue is
the
aver
age
mar
ket c
apita
lizat
ion
calc
ulat
ed a
s th
e pr
oduc
t of
the
shar
es o
utst
andi
ng re
port
ed a
s of
Feb
ruar
y 28
, 199
3 tim
es th
e av
erag
e da
ily
pric
e fo
r the
one
-yea
r per
iod
prio
r to
Mar
ch 1
,199
3. R
egio
nal
is th
e av
erag
e fr
actio
n (%
) of t
rade
s tha
t wer
e ex
ecut
ed o
n ex
chan
ges
othe
r tha
n th
e N
YSE
dur
ing
the
peri
od
[rum
Ivi
arch
i to
ivia
y 31
, i99%
Pric
e is
the
ave
rage
dai
iy p
rice
in th
e on
e-ye
ar p
erio
d pr
ior
to M
arch
1, 1
993.
SD
is t
he a
vera
ge w
eekl
y st
anda
rd d
evia
tion
of t
he s
tock
re
turn
s fo
r the
one
yea
r pe
riod
pri
or to
Mar
ch 1
,199
3. D
aily
Tra
des i
s th
e av
erag
e nu
mbe
r of
tra
des t
hat o
ccur
red
per
assi
gned
stoc
k on
the
NY
SE d
urin
g th
e pe
riod
from
M
arch
1 to
May
31,
1993
. Tra
de Si
ze is
the
aver
age
NY
SE s
hare
vol
ume
per t
rade
. Bet
a is
the
aver
age
beta
est
imat
ed fr
om w
eekl
y st
ock
retu
rns
usin
g th
e m
arke
t mod
el.
Ind.
Cou
. is t
he n
umbe
r of i
ndus
trie
s, fr
om tw
o di
git S
IC c
ode
clas
sifi
catio
ns, c
over
ed by
eac
h sp
ecia
list f
irm
. Ind
. Con
. is t
he m
axim
um e
xces
s ind
ustr
y co
ncen
trat
ion.
For
in
dust
ry i
and
spec
ialis
t fir
mj,
the
exce
ss in
dust
ry c
once
ntra
tion
is d
efin
ed a
s ((
% o
fsto
cks
in S
IC,!,
- (
% o
fsto
cks
in S
ICI)
Nys
EI.
For e
ach
spec
ialis
t firm, w
e re
port
the
larg
est e
xces
s ind
ustr
y co
ncen
trat
ion.
The
cri
tical
val
ues
of t
he te
st s
tati
stic
for a
nul
l of n
o ov
er c
once
ntra
tion
are
base
d on
sim
ulat
ions
. We
use
a si
mul
atio
n to
com
pute
th
e p-v
alue
corr
espo
ndin
g to
the
max
imum
exc
ess c
once
ntra
tion s
tati
stic
s for
eac
h of
the
spec
ialis
t fir
ms.
In e
ach
roun
d of
the
sim
ulat
ion,
we
pres
erve
the
num
ber o
f NY
SE
stoc
ks a
nd th
e in
dust
ry d
istr
ibut
ion
of t
he N
YSE
pop
ulat
ion.
The
n, a
ll 1
,544
stoc
ks a
re ra
ndom
ly a
ssig
ned
to a
ll sp
ecia
list f
irm
s, w
here
the
num
ber
of s
tock
s as
sign
ed
to a
firm
is p
rese
rved
fro
m th
e ac
tual
dat
a. F
inal
ly, w
e ca
lcul
ate
the
max
imum
exc
ess c
once
ntra
tion
stat
isti
c fo
r eac
h fm
. By
repe
atin
g th
e ab
ove
proc
edur
e 10
,000
tim
es,
we
obta
in th
e em
piri
cal d
istr
ibut
ion
of t
he m
axim
um e
xces
s con
cent
ratio
n st
atis
tics
and
cri
tical
val
ues
for t
he te
st. T
he te
chni
que
is s
imila
r to
that
of S
toll
(l98
5). P
anel
B
rep
orts
sum
mar
y st
atis
tics
for t
he 1
,544
stoc
ks.
CL
Q
, N
N
Tot
al
Stoc
ks
Mar
ket
Avg
. C
omm
on
in
Val
ue
Shar
es
Reg
iona
l Pr
ice
SD
Stoc
ks
Sam
ple
($m
il.)
(mil.
) (%
I ($
4 (%
I
AB
D-N
Y, I
nc.
Adl
er, C
olem
an &
Co.
L.P
. B
ear
Spec
ialis
tiHun
ter S
peci
alis
t B
enja
min
Jac
obso
n &
Son
s B
ento
n, C
orco
ran,
Lei
b &
Co.
B
ockl
et &
Co.
B
utto
nwoo
d Sp
ecia
list,
L.P.
C
orro
on, L
icht
enst
ein
& C
o.
Ein
horn
& C
o.
Equ
itra
de P
artn
ers
Ern
st &
Co.
/War
e & K
eelip
sMom
ans
25
75
56
58
28
40
21
39
31
38
46
Pane
l A 4
0 Sp
ecia
list F
irm
s 17
24
1 19
28
.1
53
1664
53
28
.0
44
1678
54
33
.4
43
2991
84
27
.5
21
1172
52
36
.1
28
1691
55
32
.5
14
709
30
35.3
29
11
07
40
34.9
21
26
68
74
30.1
28
25
28
61
27.3
37
44
64
94
35.2
12.7
9 22
.29
23.6
4 27
.43
20.9
9 22
.15
18.3
7 19
.78
23.2
9 27
.01
24.5
5
4.66
4.
30
4.39
4.
36
2.74
4.
47
4.70
5.
39
4.42
4.
00
4.00
Dai
ly
Tra
des
Tra
de
Size
(S
hare
s)
Bet
a In
d.
cov.
Ind.
C
on.
(%I
21
57
48
84
36
59
40
42
54
59
67
1923
20
61
2458
21
46
1472
20
12
1704
25
11
1997
21
26
2088
0.86
0.
90
1.20
0.
95
0.48
1.
14
0.88
1.
30
1.19
1.
01
0.80
9 25
23
20 5 13
11
18
15
14
20
20.6
7.
8 6.
3 7.
1 46
.1**
8.
9 17
.2
9.6
7.9
6.5
4.8
Fage
nson
& C
ompa
ny, I
nc.
Fern
ande
z, B
arts
ch &
Mir
ra
Fost
er, M
arks
, Nat
oli,
Safi
r L.P
. Fo
wle
r, R
osen
au &
Gea
ry L
.P.
Gav
in, B
ento
n &
Co.
H
ende
rson
Bro
ther
s, I
nc.
JJC
Spe
cial
ist C
orp.
L
aBra
nche
& C
ompa
ny
Law
renc
e, O
Don
nell,
Mar
cus
& C
o.
Mar
cus,
Sch
loss
& C
o., I
nc.
Mer
cato
r P
artn
ers
Mer
rill
Lyn
ch S
peci
alis
t, In
c.
MM
S &
N
M.J
. Mee
han
& C
o.
Nic
k, L
yden
& C
o.
Purc
ell,
Gra
ham
R. A
dria
flro
st
RPM
Spe
cial
ist
Cor
p.
RSF
Par
tner
s Sc
avon
e, M
cKen
na, C
loud
& C
o.
Scho
ll &
Lev
in C
orpo
ratio
n Sp
ear,
Lee
ds &
Kel
logg
S
tern
Bro
ther
s S
tern
& K
enne
dy
Stu
art,
Sco
tto, C
ella
Com
pany
Su
rnam
er, W
eiss
man
& C
o.
Wag
ner,
Stot
t & C
o.
Wal
ter
N. F
rank
& C
o.
Web
co S
ecur
ities
, Inc
. W
eisk
opf
Silv
er/O
scar
Gru
ss I
nc.
63
37
34
59
52
103
121
100 63
22
83
85
81
48
40
14
87
39
37
12
216 47
33
17
28
47
44
33
25
46
34
23
41
35
71
83
72
46
15
56
60
64
35
25 7 65
34
23 9
168
34
23
15
19
37
31
21
17
2022
19
28
2234
38
61
947
2038
24
43
2746
22
14
3184
23
91
3052
24
08
5089
13
31
2599
33
61
1341
12
26
4609
21
17
2914
16
11
746
1587
35
80
1193
82
5 37
3
68
48
68
82
35
57
57
73
61
83
73
81
73
151
65
106 70
41
37
103
59
82
44
35
49
86
46
43
18
32.7
28
.5
36.6
29
.2
34.4
28
.6
31.8
25
.5
28.0
36
.2
29.4
30
.4
28.0
34
.1
34.3
34
.0
27.4
28
.4
29.5
40
.5
31.0
29
.8
32.3
34
.8
30.8
32
.2
34.0
30
.9
31.1
20.0
7 3.
87
22.2
0 4.
32
26.1
0 4.
63
31.2
1 4.
09
19.9
2 4.
21
26.6
3 4.
07
24.2
6 3.
93
23.9
3 4.
29
27.1
3 4.
47
31.5
2 4.
06
25.1
3 3.
91
24.9
1 4.
39
26.6
6 3.
61
29.0
6 3.
99
22.8
9 3.
78
19.7
2 5.
56
29.6
8 3.
76
20.6
0 4.
31
32.8
5 3.
36
36.4
0 2.
36
25.5
7 4.
15
28.6
8 4.
49
22.9
8 5.
77
17.6
8 4.
44
20.9
4 3.
42
30.6
4 3.
73
20.3
3 4.
22
14.4
9 4.
78
17.7
7 4.
28
54
52
67
69
41
60
44
72
61
80
64
69
59
99
38
89
78
40
36
85
55
63
50
30
54
88
42
34
26
1522
16
56
2069
23
42
1663
19
70
1915
19
99
1917
26
57
2084
15
20
1922
26
98
2287
16
00
1667
16
50
1512
18
27
1958
21
43
2209
18
17
2022
16
27
2241
17
50
1625
0.82
23
1.
05
18
1.04
14
0.
84
23
0.94
16
0.
95
29
0.93
27
0.
96
30
1.01
24
0.
93
10
1.01
31
1.
06
31
0.83
26
1.
01
20
0.88
15
1.
37
6 0.
89
29
0.87
21
0.
75
17
0.78
4
0.89
48
1.
05
21
1.07
11
0.
85
11
0.66
12
0.
88
18
0.80
14
0.
48
12
0.91
9
5.2
7.9
7.5
6.3
10.8
3.
8 5.
4 3.
3 4.
7 6.
1 16
.5
4.9
4.4
5.6
7.4
26.7
4.
0 4.
9 6.
2 35
.3**
2.
1 9.
6 15
.5
11.1
10
.9
8.4
21.3
**
8.1
21.2
Pane
l B:
1,5
44 S
tock
s
Mea
n St
d. D
ev.
Min
imum
Q
uart
ile 1
M
edia
n Q
uart
ile 3
M
axim
um
NA
N
A
2305
64
30
.7
24.7
1 4.
15
58
1967
0.
93
NA
N
A
NA
N
A
5964
12
5 14
.8
17.3
2 2.
12
86
1115
0.
72
NA
N
A
NA
N
A
11
0.5
0.3
3.04
0.
80
6 26
9 -3
.42
NA
N
A
NA
N
A
208
14
19.7
12
.46
2.70
15
12
05
0.41
N
A
NA
N
A
NA
58
6 29
29
.2
20.5
9 3.
80
31
1740
0.
85
NA
N
A
NA
N
A
1914
67
40
.4
32.1
6 5.
27
66
2449
1.
37
NA
N
A
NA
N
A
7562
1 22
99
82.5
19
2.32
18
.03
1228
94
50
5.41
N
A
NA
** In
dica
te s
igni
fica
nce
at th
e 5
perc
ent l
evel
. N
A n
ot a
vaila
ble.
1624 The Journal of Finance
IV. Estimation of the Spread and its Components
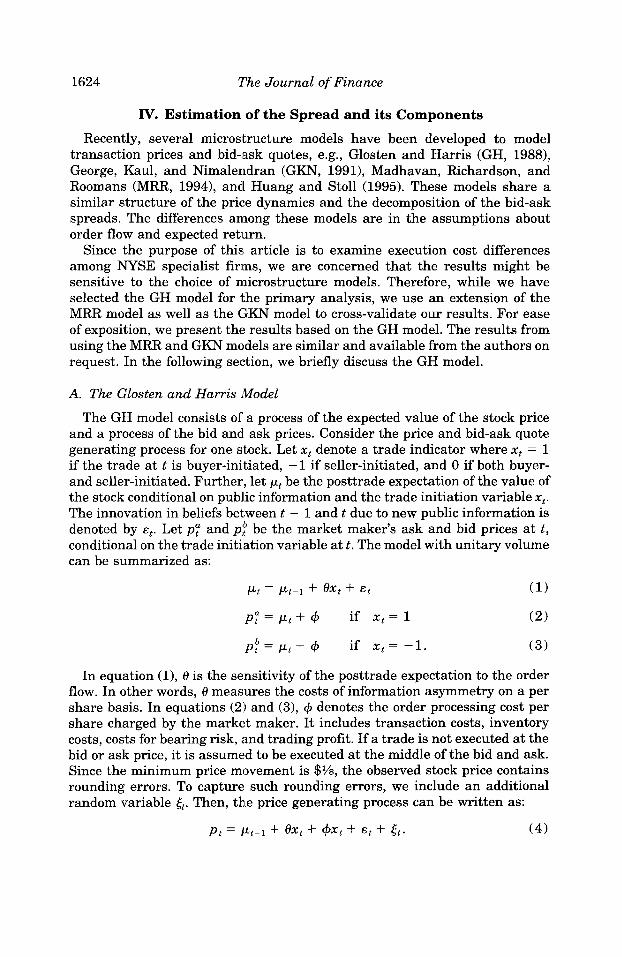
Recently, several microstructure models have been developed to model transaction prices and bid-,ask quotes, e.g., Glosten and Harris (GH, 1988), George, Kaul, and Nimaleridran (GKN, 19911, Madhavan, Richardson, and Roomans (MRR, 19941, and Huang and Stoll (1995). These models share a similar structure of the price dynamics and the decomposition of the bid-ask spreads. The differences among these models are in the assumptions about order flow and expected return.
Since the purpose of this; article is to examine execution cost differences among NYSE specialist firins, we are concerned that the results might be sensitive to the choice of microstructure models. Therefore, while we have selected the GH model for the primary analysis, we use an extension of the MRR model as well as the GKN model to cross-validate our results. For ease of exposition, we present the results based on the GH model. The results from using the MRR and GKN models are similar and available from the authors on request. In the following section, we briefly discuss the GH model.
A. The Glosten and Harris Model
The GH model consists of a process of the expected value of the stock price and a process of the bid and ask prices. Consider the price and bid-ask quote generating process for one stock. Let X , denote a trade indicator where x, = 1 if the trade at t is buyer-initiated, -1 if seller-initiated, and 0 if both buyer- and seller-initiated. Further, let P, be the posttrade expectation of the value of the stock conditional on public information and the trade initiation variable xt . The innovation in beliefs between t - 1 and t due to new public information is denoted by E,. Let p: and p;; be the market maker’s ask and bid prices at t , conditional on the trade initiation variable at t. The model with unitary volume can be summarized as:
In equation (l) , 0 is the sensitivity of the posttrade expectation to the order flow. In other words, 8 measures the costs of information asymmetry on a per share basis. In equations (21) and (3), 4 denotes the order processing cost per share charged by the market maker. I t includes transaction costs, inventory costs, costs for bearing risk, and trading profit. If a trade is not executed at the bid or ask price, it is assumed to be executed at the middle of the bid and ask. Since the minimum price movement is $%, the observed stock price contains rounding errors. To capture such rounding errors, we include an additional random variable 6,. Then, thie price generating process can be written as:
P t = ELt-l + ex, + 4xt + E~ + tt. (4)
Does the Specialist Matter? 1625
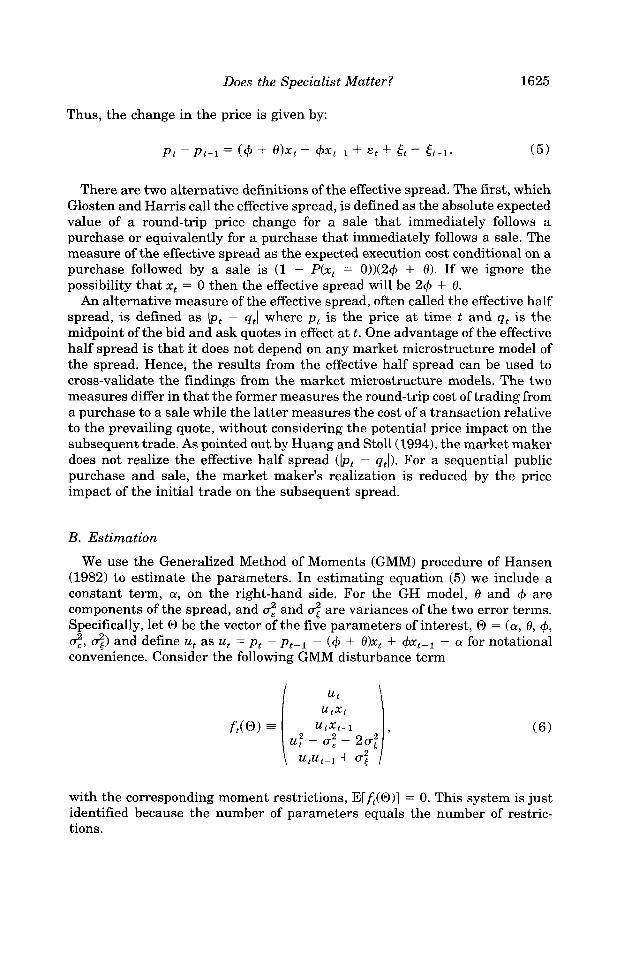
Thus, the change in the price is given by:
Pt - Pt-1 = ( 4 + @ X t - 4xt-1 + E t + 5t - 5 t - 1 . (5)
There are two alternative definitions of the effective spread. The first, which Glosten and Harris call the effective spread, is defined as the absolute expected value of a round-trip price change for a sale that immediately follows a purchase or equivalently for a purchase that immediately follows a sale. The measure of the effective spread as the expected execution cost conditional on a purchase followed by a sale is (1 - P(xt = 0))(24 + 8). If we ignore the possibility that X, = 0 then the effective spread will be 24 + 0.
An alternative measure of the effective spread, often called the effective half spread, is defined as ( P t - qt( where p , is the price at time t and q, is the midpoint of the bid and ask quotes in effect at t . One advantage of the effective half spread is that it does not depend on any market microstructure model of the spread. Hence, the results from the effective half spread can be used to cross-validate the findings from the market microstructure models. The two measures differ in that the former measures the round-trip cost of trading from a purchase to a sale while the latter measures the cost of a transaction relative to the prevailing quote, without considering the potential price impact on the subsequent trade. As pointed out by Huang and Stoll(1994), the market maker does not realize the effective half spread <Ipt - qtl). For a sequential public purchase and sale, the market maker's realization is reduced by the price impact of the initial trade on the subsequent spread.
B. Estimation
We use the Generalized Method of Moments (GMM) procedure of Hansen (1982) to estimate the parameters. In estimating equation ( 5 ) we include a constant term, a, on the right-hand side. For the GH model, 8 and 4 are components of the spread, and 4 and 4 are variances of the two error terms. Specifically, let 0 be the vector of the five parameters of interest, 0 = (a , 8, 4, 3, 4) and define ut as U, = p , - p tP1 - (4 + O)x, + - a for notational convenience. Consider the following GMM disturbance term
with the corresponding moment restrictions, E[f,(O)l = 0. This system is just identified because the number of parameters equals the number of restric- tions.
1626 The Journal of Finance
Table I1 Generalized Method of Moments (GMM) Estimates of the
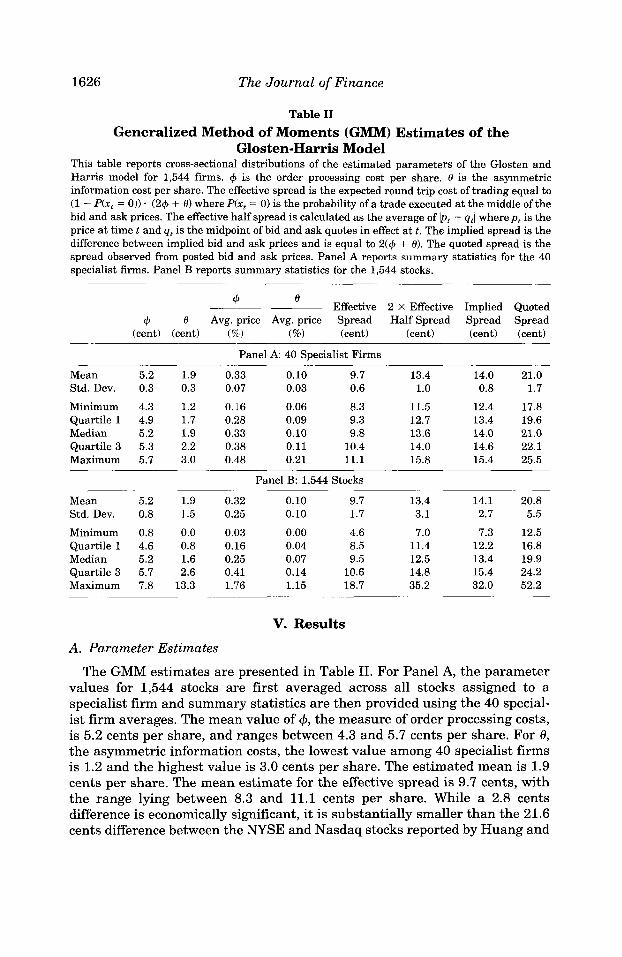
Glosten-Harris Model This table reports cross-sectional distributions of the estimated parameters of the Glosten and Harris model for 1,544 firms. Q is the order processing cost per share. 0 is the asymmetric information cost per share. The ef'fective spread is the expected round trip cost of trading equal to (1 - P(xt = 0)) . (24 + 0) where P(x, = 0 ) is the probability of a trade executed at the middle of the bid and ask prices. The effective half spread is calculated as the average of bt - qtl where p t is the price at time t and qr is the midpoint of bid and ask quotes in effect at t . The implied spread is the difference between implied bid and ask prices and is equal to 2(4 + 0). The quoted spread is the spread observed from posted bid and ask prices. Panel A reports summary statistics for the 40 specialist firms. Panel B reports summary statistics for the 1,544 stocks.
0 Effective 2 X Effective Implied Quoted 4 ____
Q 8 Avg. price Avg. price Spread Half Spread Spread Spread (cent) (cent) (%) (%I (cent) (cent) (cent) (cent)
Panel A 40 Specialist Firms
Mean 5.2 1.9 0.33 0.10 9.7 13.4 14.0 21.0 Std. Dev. 0.3 0.3 0.07 0.03 0.6 1.0 0.8 1.7
Minimum 4.3 1.2 0.116 0.06 8.3 11.5 12.4 17.8 Quartile 1 4.9 1.7 0.28 0.09 9.3 12.7 13.4 19.6 Median 5.2 1.9 0.33 0.10 9.8 13.6 14.0 21.0 Quartile 3 5.3 2.2 0.38 0.11 10.4 14.0 14.6 22.1 Maximum 5.7 3.0 0.48 0.21 11.1 15.8 15.4 25.5
Panel B: 1,544 Stocks
Mean 5.2 1.9 0.32 0.10 9.7 13.4 14.1 20.8 Std. Dev. 0.8 1.5 0.25 0.10 1.7 3.1 2.7 5.5
Minimum 0.8 0.0 0.03 0.00 4.6 7.0 7.3 12.5 Quartile 1 4.6 0.8 0.16 0.04 8.5 11.4 12.2 16.8 Median 5.2 1.6 0.25 0.07 9.5 12.5 13.4 19.9 Quartile 3 5.7 2.6 0.41 0.14 10.6 14.8 15.4 24.2 Maximum 7.8 13.3 1.76 1.15 18.7 35.2 32.0 52.2
V. Results
A. Parameter Estimates
The GMM estimates are presented in Table 11. For Panel A, the parameter values for 1,544 stocks are first averaged across all stocks assigned to a specialist firm and summary statistics are then provided using the 40 special- ist firm averages. The mean value of +, the measure of order processing costs, is 5.2 cents per share, and ranges between 4.3 and 5.7 cents per share. For 8, the asymmetric informatioin costs, the lowest value among 40 specialist firms is 1.2 and the highest value is 3.0 cents per share. The estimated mean is 1.9 cents per share. The mean estimate for the effective spread is 9.7 cents, with the range lying between 8.3 and 11.1 cents per share. While a 2.8 cents difference is economically significant, it is substantially smaller than the 21.6 cents difference between the NYSE and Nasdaq stocks reported by Huang and
Does the Specialist Matter? 1627
Stoll (1996). Thus, the structural differences across markets appear to dwarf the differences within an auction market.
The effective half spread is calculated using the price and quote data from TAQ. For comparability, we report the effective half spread multiplied by two. The average of 2 X effective half spread is 13.4 cents, which is higher than the average effective spread, 9.7 cents, estimated from the GH model. Since a number of factors may affect the costs of trading a stock, we now turn to cross-sectional regressions to evaluate cost differences among specialist firms.
B. Importance of the Specialist Firm
Our analysis builds on cross-sectional studies of the spread (see Glosten and Harris (1988), Stoll(1989), Harris (1994), and Lin, Sanger, and Booth (1995)). Specifically, we regress measures of execution costs on specialist firm indicator variables and stock-specific characteristics. Since there are 40 specialist firms, we create 39 indicator variables to represent each specialist firm and choose Merrill Lynch Specialist, Inc. (henceforth Merrill Lynch), a large, well capital- ized firm, as the benchmark. The effect of each specialist firm on execution costs is measured relative to the ben~hmark .~
The independent variables include trade size, average number of trades, relative trading frequency on regional exchanges, average stock price, and the volatility of the stock return. These factors have been identified to be impor- tant by previous empirical work, and also are very close to the four character- istics selected by the NYSE as part of its new Near Neighbor Analysis to assess specialist performance.6 Including additional potential measures of risk, the market beta, book-to-market ratio, and asset-to-market ratio, does not affect the results. Another important factor is the specialist participation rate. Since it is not publicly available, we use explanatory variables found by Madhavan and Sofianos (1994) to be associated with specialist participation rates. The variables include block turnover, nonblock turnover, a dummy variable for whether the stock is traded on the Intermarket Trading System (ITS), and a dummy variable for whether the stock is a closed-end fund (CEF).
Next, we discuss the anticipated relationship between the measures of the effective spread and the explanatory variables. The effective spread is pre- dicted to be negatively related to trade size and number of trades as the fixed costs of execution are spread over a larger number of shares or a larger number of trades for a stock. The quoted spread should decrease with regional trading activity since competition forces specialists to quote a tighter spread. However, the effective spread could either decrease due to competition, or increase due to increased order fragmentation, which reduces the probability of a crossing trade. Harris (1994) shows that the quoted spread increases with the price
We also rotate the benchmark firm among the 40 specialist firms and find the results are similar.
The NYSE selected characteristics are daily nonblock volume, daily price, market value of the number of shares available for trading that are not closely held (the float), and daily high-low range as a percent of opening price for a measure of volatility.
1628 The Journal of Finance
level. Since the spread measures are related, the two effective spread mea- sures are also expected to be increasing with the price level. All three spreads should increase with the risk of a stock because the asymmetric information cost is higher for riskier stocks. Taking the specialist participation rate as a whole, a greater participation rate implies that a specialist is more aggressive in competing with limit orders. Therefore, the spread is negatively related to the participation rate. Madhavan and Sofianos (1994) show that nonblock turnover is positively associated with participation rates while block turnover, ITS, and CEF are negatively associated with participation rates. Therefore, nonblock turnover should be negatively associated with the spread and the coefficients on block turnover, ITS, and CEF should all be positive.
These predictions generally apply to the components of the spread but with two exceptions. First, order processing costs could be positively or negatively related to regional trading: activity. Greater competition from regional ex- changes could cause the specialist to be more efficient or reduce his profits and thus lower order processing costs. On the other hand, higher order processing costs on the NYSE may enable regional exchanges to attract more order flow. Second, order processing costs are not directly related to risk, so there is no prediction for standard deviation.
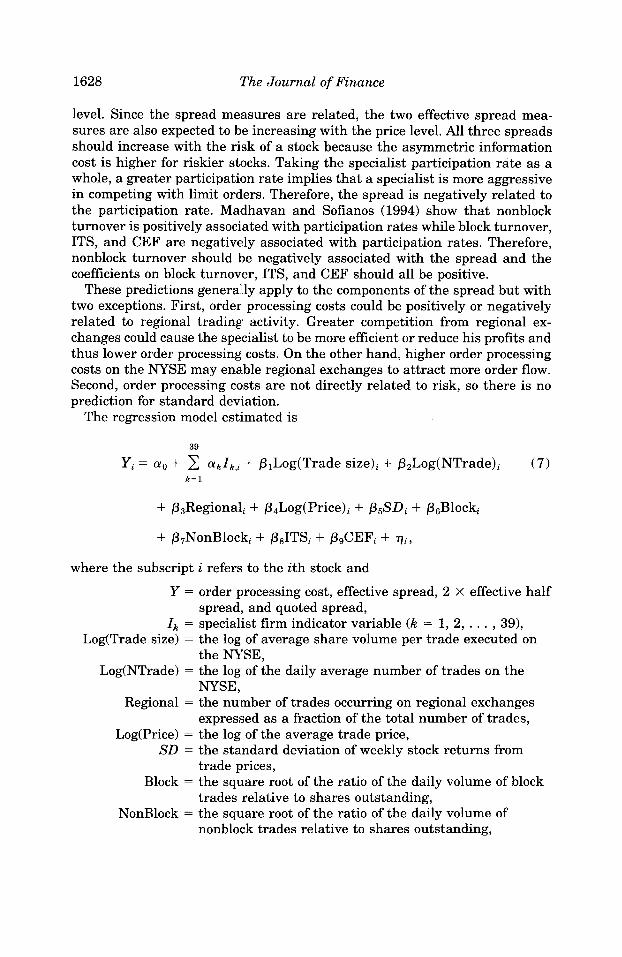
The regression model estimated is
39
Yi = a. + f f k I k , i + plLog(Trade size)i + P,Log(NTrade), ( 7 ) k = l
+ + p4Log(Price)i + &SDi + p6Blocki
+ p7NonBlocki + &,ITSi + PgCEFi + q i ,
where the subscript i refers to the ith stock and
spread, and quoted spread, Y = order processing cost, effective spread, 2 x effective half
Ik = specialist firm indicator variable (k = 1, 2, . . . , 39), Log(Trade size) = the log of average share volume per trade executed on
Log(NTrade) = the log of the daily average number of trades on the the W S E ,
NYSE, Regional = the number of trades occurring on regional exchanges
expressed as a fraction of the total number of trades, Log(Price) = the log of the average trade price,
SD = the standard deviation of weekly stock returns from
Block = the square root of the ratio of the daily volume of block trade prices,
trades relative to shares outstanding, NonBlock = the square root of the ratio of the daily volume of
nonblock trades relative to shares outstanding,
Does the Specialist Matter? 1629
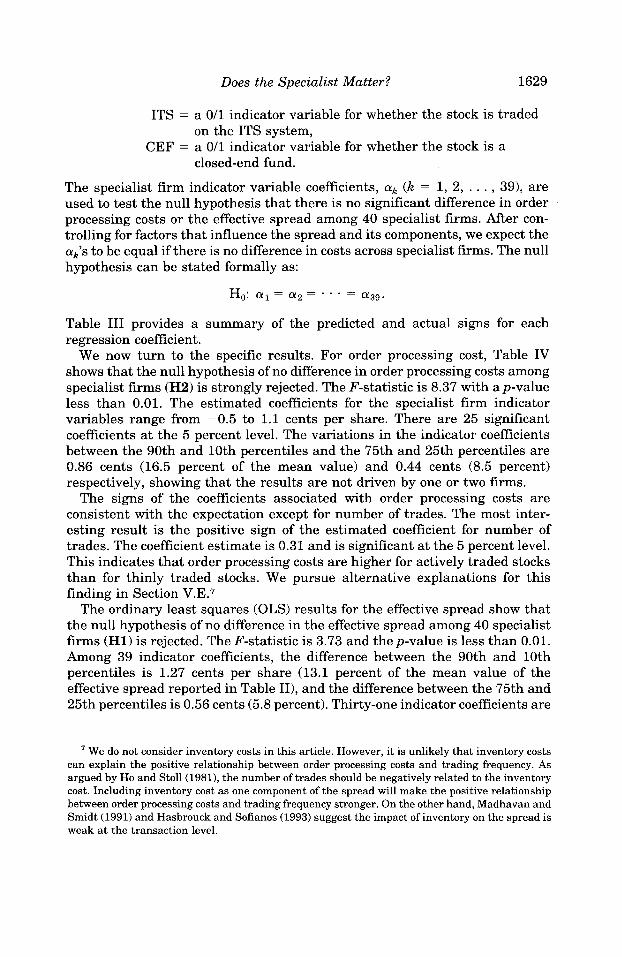
ITS = a 0/1 indicator variable for whether the stock is traded on the ITS system,
closed-end fund. CEF = a 0/1 indicator variable for whether the stock is a
The specialist firm indicator variable coefficients, (k = 1, 2, . . . , 39), are used to test the null hypothesis that there is no significant difference in order processing costs or the effective spread among 40 specialist firms. After con- trolling for factors that influence the spread and its components, we expect the ak7s to be equal if there is no difference in costs across specialist firms. The null hypothesis can be stated formally as:
a 3 9 . Ho: (yl = ( y 2 = . * . =
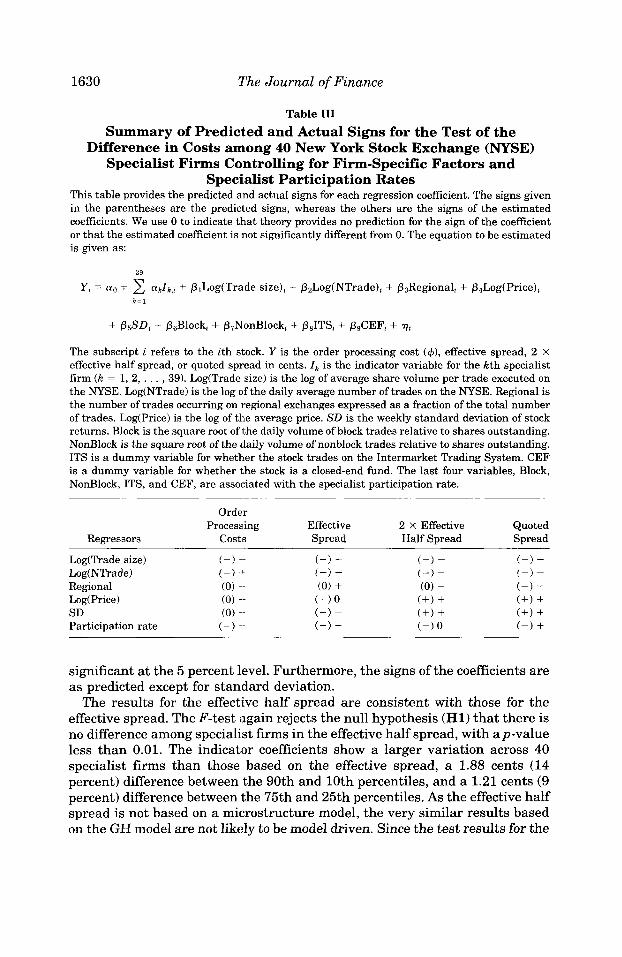
Table I11 provides a summary of the predicted and actual signs for each regression coefficient.
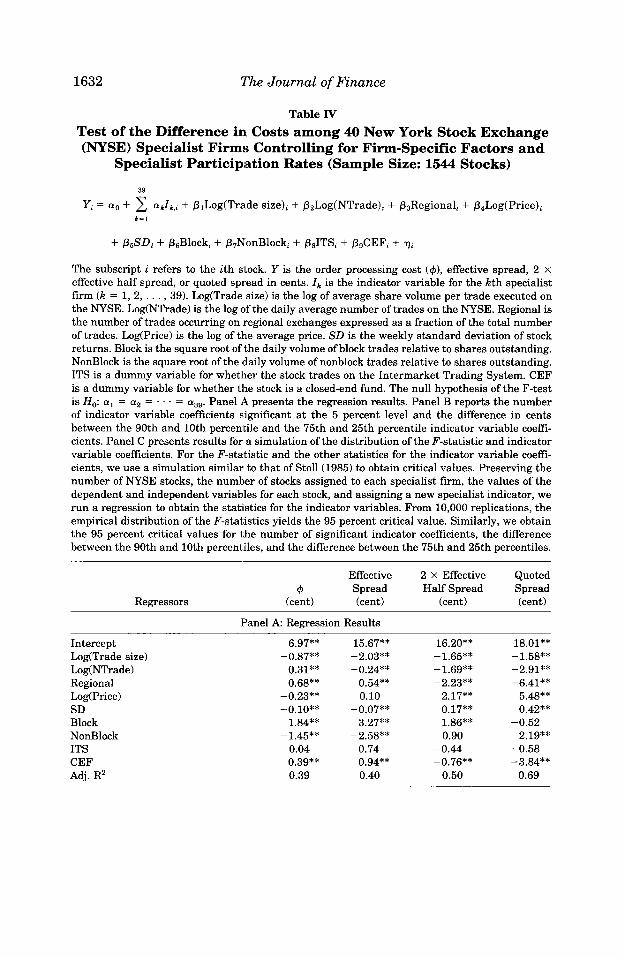
We now turn to the specific results. For order processing cost, Table IV shows that the null hypothesis of no difference in order processing costs among specialist firms (H2) is strongly rejected. The F-statistic is 8.37 with ap-value less than 0.01. The estimated coefficients for the specialist firm indicator variables range from -0.5 to 1.1 cents per share. There are 25 significant coefficients at the 5 percent level. The variations in the indicator coefficients between the 90th and 10th percentiles and the 75th and 25th percentiles are 0.86 cents (16.5 percent of the mean value) and 0.44 cents (8.5 percent) respectively, showing that the results are not driven by one or two firms.
The signs of the coefficients associated with order processing costs are consistent with the expectation except for number of trades. The most inter- esting result is the positive sign of the estimated coefficient for number of trades. The coefficient estimate is 0.31 and is significant at the 5 percent level. This indicates that order processing costs are higher for actively traded stocks than for thinly traded stocks. We pursue alternative explanations for this finding in Section V.E.7
The ordinary least squares (OLS) results for the effective spread show that the null hypothesis of no difference in the effective spread among 40 specialist firms (Hl) is rejected. The F-statistic is 3.73 and thep-value is less than 0.01. Among 39 indicator coefficients, the difference between the 90th and 10th percentiles is 1.27 cents per share (13.1 percent of the mean value of the effective spread reported in Table 11), and the difference between the 75th and 25th percentiles is 0.56 cents (5.8 percent). Thirty-one indicator coefficients are
We do not consider inventory costs in this article. However, it is unlikely that inventory costs can explain the positive relationship between order processing costs and trading frequency. As argued by Ho and Stoll(1981), the number of trades should be negatively related to the inventory cost. Including inventory cost as one component of the spread will make the positive relationship between order processing costs and trading frequency stronger. On the other hand, Madhavan and Smidt (1991) and Hasbrouck and Sofianos (1993) suggest the impact of inventory on the spread is weak at the transaction level.
1630 The Journal of Finance
Table I11 Summary of Predicted and Actual Signs for the Test of the
Difference in Costs among 40 New York Stock Exchange (NYSE) Specialist Firms Controlling for Firm-Specific Factors and
Specialist Participation Rates This table provides the predicted and actual signs for each regression coefficient. The signs given in the parentheses are the predicted signs, whereas the others are the signs of the estimated coefficients. We use 0 to indicate thLat theory provides no prediction for the sign of the coefficient or that the estimated coefficient is riot significantly different from 0. The equation to be estimated is given as:
39
Y , = a. + 2 akIk,, + P,Log(Trade size), + P2Log(NTrade), + P3RegionalL + P4Log(Price), k = l
+ P$D, + P,Block, + P,NonBlock, + P,ITS, + P9CEF, + q, The subscript i refers to the ith stock. Y is the order processing cost (4), effective spread, 2 X effective half spread, or quoted spread in cents. Ik is the indicator variable for the kth specialist firm (k = 1,2, . . . ,391. Log(Trade size) is the log of average share volume per trade executed on the NYSE. Log(NTrade) is the log of the daily average number of trades on the NYSE. Regional is the number of trades occurring on regional exchanges expressed as a fraction of the total number of trades. Log(Price) is the log of the average price. SD is the weekly standard deviation of stock returns. Block is the square root of the daily volume of block trades relative to shares outstanding. NonBlock is the square root of the daily volume of nonblock trades relative to shares outstanding. ITS is a dummy variable for whether the stock trades on the Intermarket Trading System. CEF is a dummy variable for whether the stock is a closed-end fund. The last four variables, Block, NonBlock, ITS, and CEF, are associated with the specialist participation rate.
Order Processing
Regressors COStl3
Log(Trade size) (-1 --
Log(NTrade) (-1 + Regional (0) 4- Log(Price1 (0 ) -- SD (0) -- Participation rate (-) --
Effective Spread
(-1 - (-) - (0 ) + (+) 0 (+) - (-) -
2 X Effective Quoted Half Spread Spread
significant at the 5 percent level. Furthermore, the signs of the coefficients are as predicted except for standard deviation.
The results for the effective half spread are consistent with those for the effective spread. The F-test again rejects the null hypothesis (Hl) that there is no difference among specialist firms in the effective half spread, with ap-value less than 0.01. The indicator coefficients show a larger variation across 40 specialist firms than those based on the effective spread, a 1.88 cents (14 percent) difference between the 90th and 10th percentiles, and a 1.21 cents (9 percent) difference between the 75th and 25th percentiles. As the effective half spread is not based on a microstructure model, the very similar results based on the GH model are not likely to be model driven. Since the test results for the
Does the Specialist Matter? 1631
effective half spread are similar to those for the effective spread, we use one measure, the effective spread, in subsequent tests.
For completeness, we estimate the model using the quoted spread as the dependent variable. For the specialist indicator variables, the F-statistic is 4.26 and thep-value is again less than 0.01. The coefficient for regional trading is particularly interesting. This result is consistent with the negative relation- ship between competition and quoted spreads found by McInish and Wood (1992) and the opposite from that obtained for the effective spread. One possible explanation is that competition forces the specialist to narrow the quoted spread to match the best quote available from other exchanges (Bat- talio, Greene, and Jennings (1995)) but the effective spread is increased by a reduction in crossing trades due to the diversion of order flow away from the NYSE .
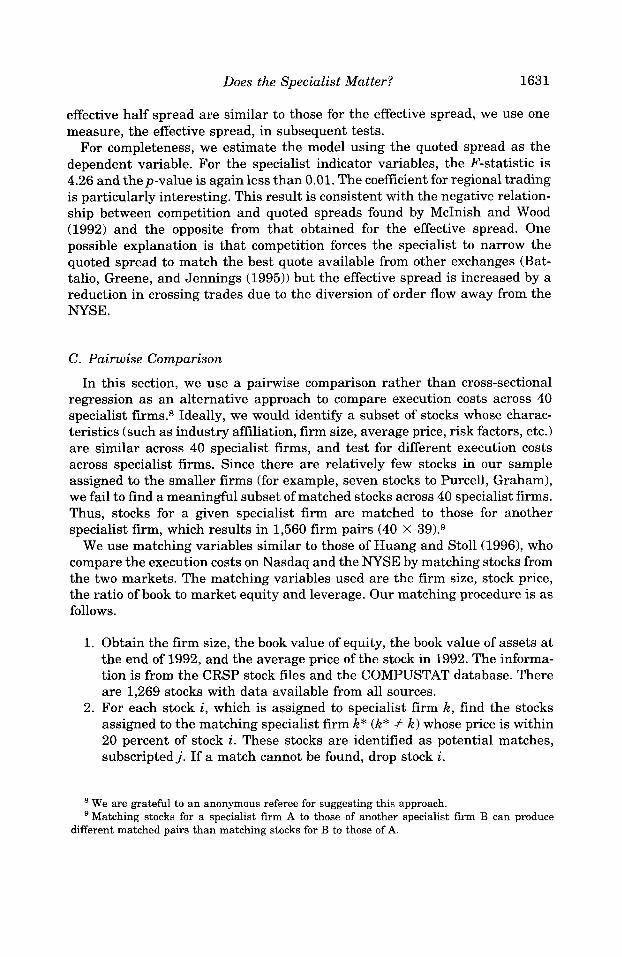
C. Pairwise Comparison
In this section, we use a pairwise comparison rather than cross-sectional regression as an alternative approach to compare execution costs across 40 specialist firms.8 Ideally, we would identify a subset of stocks whose charac- teristics (such as industry affiliation, firm size, average price, risk factors, etc.) are similar across 40 specialist firms, and test for different execution costs across specialist firms. Since there are relatively few stocks in our sample assigned to the smaller firms (for example, seven stocks to Purcell, Graham), we fail to find a meaningful subset of matched stocks across 40 specialist firms. Thus, stocks for a given specialist firm are matched to those for another specialist firm, which results in 1,560 firm pairs (40 X 391.9
We use matching variables similar to those of Huang and Stoll(1996), who compare the execution costs on Nasdaq and the NYSE by matching stocks from the two markets. The matching variables used are the firm size, stock price, the ratio of book to market equity and leverage. Our matching procedure is as follows.
1. Obtain the firm size, the book value of equity, the book value of assets at the end of 1992, and the average price of the stock in 1992. The informa- tion is from the CRSP stock files and the COMPUSTAT database. There are 1,269 stocks with data available from all sources.
2. For each stock i, which is assigned to specialist firm k, find the stocks assigned to the matching specialist firm k* (k* # k) whose price is within 20 percent of stock i. These stocks are identified as potential matches, subscriptedj. If a match cannot be found, drop stock i.
We are grateful to an anonymous referee for suggesting this approach. Matching stocks for a specialist firm A to those of another specialist firm B can produce
different matched pairs than matching stocks for B to those of A.
1632 The Journal of Finance
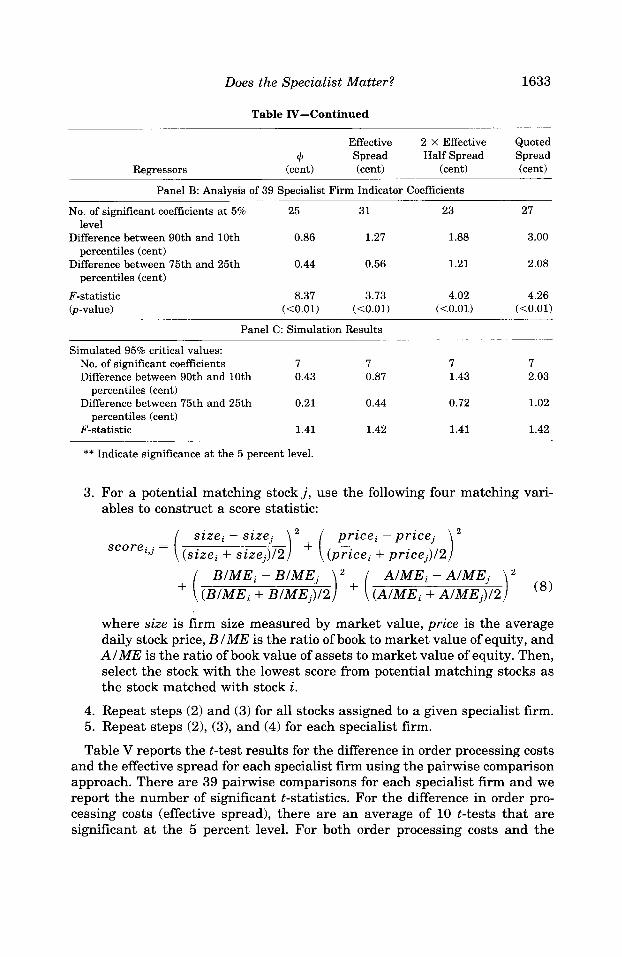
Table IV Test of the Difference in Costs among 40 New York Stock Exchange (NYSE) Specialist Firms Controlling for Firm-Specific Factors and
Specialist Participation Rates (Sample Size: 1544 Stocks)
39
Y, = a. + C Y J ~ , ~ + plLog(Trade size), + P2Log(NTrade), + P3Regional& + P4Log(Price), k = l
+ P5SD, + P6Block, + P7NonBlock, + psITS, + P&EF, + qL The subscript i refers to the ith stock. Y is the order processing cost (4), effective spread, 2 X effective half spread, or quoted spread in cents. Ik is the indicator variable for the kth specialist firm (k = 1,2, . . . ,39). Log(Trade size) is the log of average share volume per trade executed on the NYSE. Log(NTrade) is the log of the daily average number of trades on the NYSE. Regional is the number of trades occurring on regional exchanges expressed as a fraction of the total number of trades. Log(Price) is the log of the average price. SD is the weekly standard deviation of stock returns. Block is the square root of the daily volume of block trades relative to shares outstanding. NonBlock is the square root of the daily volume of nonblock trades relative to shares outstanding. ITS is a dummy variable for whether the stock trades on the Intermarket Trading System. CEF is a dummy variable for whether the stock is a closed-end fund. The null hypothesis of the F-test isH,: (yl = (y 2 - - . . . = ( Y ~ ~ . Panel A presents the regression results. Panel B reports the number of indicator variable coefficients significant at the 5 percent level and the difference in cents between the 90th and 10th percentile and the 75th and 25th percentile indicator variable coefi- cients. Panel C presents results for a simulation of the distribution of the F-statistic and indicator variable coefficients. For the F-statistic and the other statistics for the indicator variable coeffi- cients, we use a simulation similar to that of Stoll(1985) to obtain critical values. Preserving the number of NYSE stocks, the number of stocks assigned to each specialist firm, the values of the dependent and independent variables for each stock, and assigning a new specialist indicator, we run a regression to obtain the statiistics for the indicator variables. From 10,000 replications, the empirical distribution of the F-statistics yields the 95 percent critical value. Similarly, we obtain the 95 percent critical values for the number of significant indicator coefficients, the difference between the 90th and 10th percentiles, and the difference between the 75th and 25th percentiles.
Effective 2 X Effective Quoted 4 Spread Half Spread Spread
Regressors (cent) (cent) (cent) (cent)
Panel A Regression Results
Intercept Log(Trade size) Log( NTrade) Regional Log( Price) SD Block NonBlack ITS CEF Adj. RZ
6.97**
0.31** 0.68**
-0.23** -0.10**
1.84** - 1.45**
0.04 0.39** 0.39
-0.87** 15.67** -2.03** -0.24**
0.54** 0.10
-0.07** 3.27**
-2.58** -0.74
0.94** 0.40
16.20** -1.65** -1.69** -2.23**
2.17** 0.17** 1.86** 0.90
-0.44 -0.76**
0.50
18.01** -1.58** -2.91** -6.41**
5.48** 0.42**
2.19** -0.58 -3.84**
0.69
-0.52
Does the Specialist Matter? 1633
Table IV-Continued
Regressors
Effective 2 X Effective Quoted 4J Spread Half Spread Spread
(cent) (cent) (cent) (cent)
Panel B: Analysis of 39 Specialist Firm Indicator Coefficients
No. of significant coefficients at 5% 25 31 23 27
Difference between 90th and 10th 0.86 1.27 1.88 3.00
Difference between 75th and 25th 0.44 0.56 1.21 2.08
F-statistic 8.37 3.73 4.02 4.26
level
percentiles (cent)
percentiles (cent)
(p-value) (<0.01) (CO.01) (<0.01) (<0.01)
Panel C: Simulation Results
Simulated 95% critical values: No. of significant coefficients 7 7 7 7 Difference between 90th and 10th 0.43 0.87 1.43 2.03
Difference between 75th and 25th 0.21 0.44 0.72 1.02
F-statistic 1.41 1.42 1.41 1.42
percentiles (cent)
percentiles (cent)
~~ ~~~
** Indicate significance at the 5 percent level.
3. For a potential matching stockj, use the following four matching vari- ables to construct a score statistic:
) (8)
where size is firm size measured by market value, price is the average daily stock price, B I ME is the ratio of book to market value of equity, and A I M E is the ratio of book value of assets to market value of equity. Then, select the stock with the lowest score from potential matching stocks as the stock matched with stock i.
4. Repeat steps ( 2 ) and (3) for all stocks assigned to a given specialist firm. 5. Repeat steps (21, (31, and (4) for each specialist firm.
Table V reports the t-test results for the difference in order processing costs and the effective spread for each specialist firm using the pairwise comparison approach. There are 39 pairwise comparisons for each specialist firm and we report the number of significant t-statistics. For the difference in order pro- cessing costs (effective spread), there are an average of 10 t-tests that are significant at the 5 percent level. For both order processing costs and the
l 2 pr ice i - pr ice j (pricei + pr ice j ) /2
AIMEi - AIMEj 1 2 + i s i ze i - s i ze j
( s i z e i + s i ze j ) /2
+i ( B l M E i + B / M E j ) / 2 1 2 + i (AIMEi + A / M E j ) / 2 BIMEi - BIMEj
i score i j =
1634 The Journal of Finance
3 0 11 9 8 16 6 8 3 1 7 9 6 5
24 11 6 16 6 16
30 33 16 7 21 28 18 19 13 6 8 9 6 9 9 9 9 13 8 6
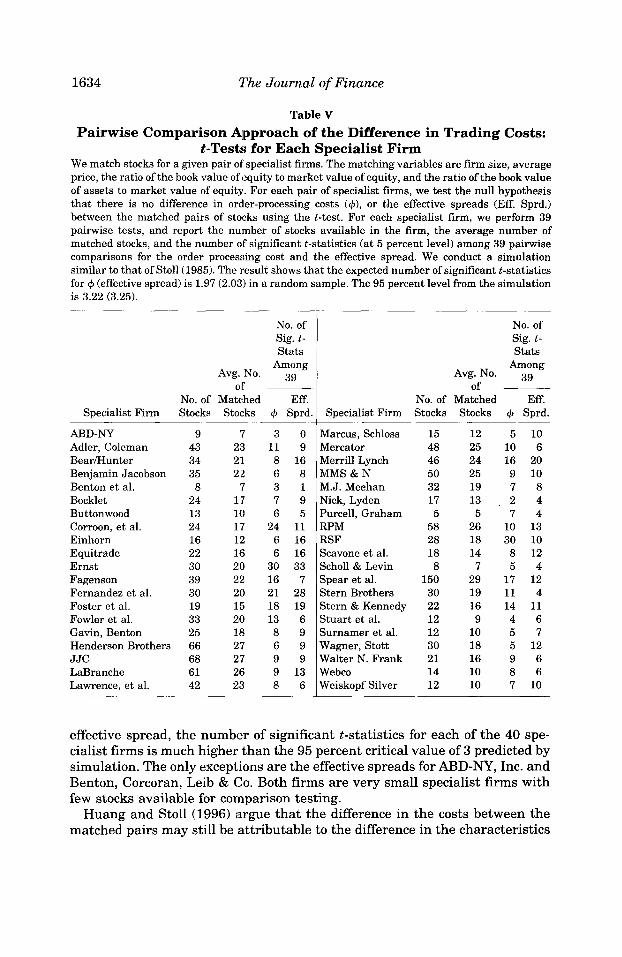
Table V Pairwise Comparison Approach of the Difference in Trading Costs:
&Tests for Each Specialist Firm We match stocks for a given pair of specialist firms. The matching variables are firm size, average price, the ratio of the book value of equity to market value of equity, and the ratio of the book value of assets to market value of equity. For each pair of specialist firms, we test the null hypothesis that there is no difference in ordler-processing costs (4), or the effective spreads (Eff. Sprd.) between the matched pairs of stocks using the t-test. For each specialist firm, we perform 39 pairwise tests, and report the number of stocks available in the firm, the average number of matched stocks, and the number of significant t-statistics (at 5 percent level) among 39 pairwise comparisons for the order processing cost and the effective spread. We conduct a simulation similar to that of Stoll(1985). The result shows that the expected number of significant t-statistics for 4 (effective spread) is 1.97 (2.03) in a random sample. The 95 percent level from the simulation is 3.22 (3.25).
Marcus, Schloss Mercator Merrill Lynch M M S & N M.J. Meehan Nick, Lyden Purcell, Graham RPM RSF Scavone et al. Scholl&Levin Spear et al. Stern Brothers Stern & Kennedy Stuart e t al. Surnamer et al. Wagner, Stott Walter N. Frank Webco Weiskopf Silver
No. of Sig. t- Stats
Among Avg.No. 39
of ___
Specialist Firm Stocks Stocks 4 Sprd. No. of Matched Eff.
No. of Sig. t- Stats
Among Avg.No. 39
of ~
Specialist Firm Stocks Stocks 4 Sprd. No. of Matched Eff.
ABD-NY Adler, Coleman Bearmunter Benjamin Jacobson Benton et al. Bocklet Buttonwood Corroon, e t al. Einhorn Equitrade Ernst Fagenson Fernandez et al. Foster et al. Fowler e t al. Gavin, Benton Henderson Brothers J J C LaBranche Lawrence, et al.
9 43 34 35 8
24 13 24 16 22 30 39 30 19 33 25 66 68 61 42
'7 23 21 2'2
7 1 7 110 1 7 1 2 16 20 22 20 15 20 18 27 27 26 23
~~
15 48 46 50 32 17 5
58 28 18 8
150 30 22 12 12 30 21 14 12
12 25 24 25 19 13 5
26 18 14 7
29 19 16 9
10 18 16 10 10
5 10 10 6 16 20 9 10 7 8 2 4 7 4
10 13 30 10 8 12 5 4
17 12 11 4 14 11 4 6 5 7 5 12 9 6 8 6 7 10
effective spread, the number of significant t-statistics for each of the 40 spe- cialist firms is much higher than the 95 percent critical value of 3 predicted by simulation. The only exceptions are the effective spreads for ABD-NY, Inc. and Benton, Corcoran, Leib & (20. Both firms are very small specialist firms with few stocks available for comparison testing.
Huang and Stoll (1996) argue that the difference in the costs between the matched pairs may still be attributable to the difference in the characteristics
Does the Specialist Matter? 1635
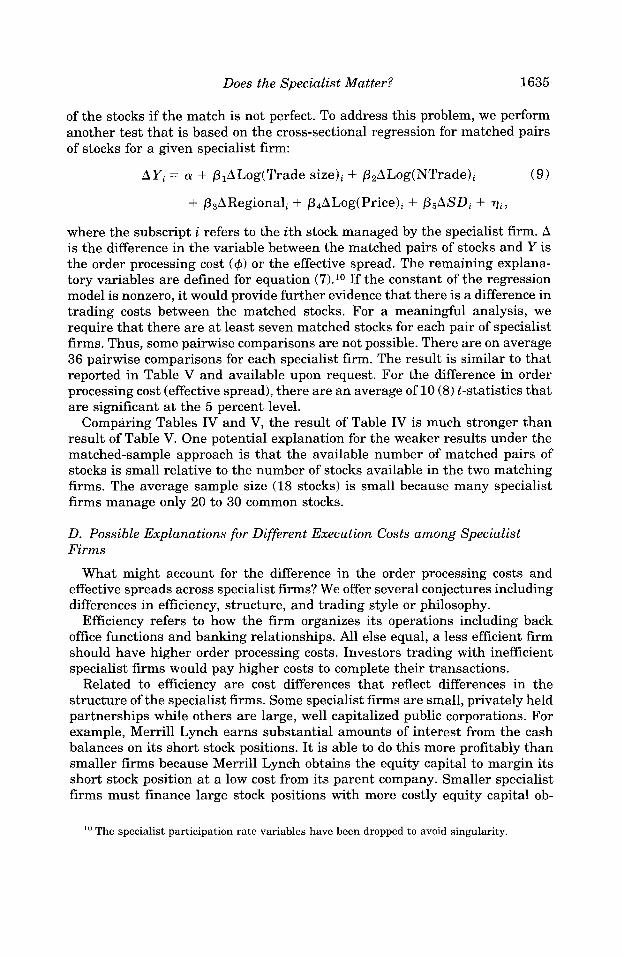
of the stocks if the match is not perfect. To address this problem, we perform another test that is based on the cross-sectional regression for matched pairs of stocks for a given specialist firm:
(9) AYi = CY + plALog(Trade size)i + p,ALog(NTrade)i
+ psARegionali + P,ALog(Price)i + p5ASDi + q i ,
where the subscript i refers t o the ith stock managed by the specialist firm. A is the difference in the variable between the matched pairs of stocks and Y is the order processing cost (4 ) or the effective spread. The remaining explana- tory variables are defined for equation (7).10 If the constant of the regression model is nonzero, it would provide further evidence that there is a difference in trading costs between the matched stocks. For a meaningful analysis, we require that there are at least seven matched stocks for each pair of specialist firms. Thus, some pairwise comparisons are not possible. There are on average 36 pairwise comparisons for each specialist firm. The result is similar to that reported in Table V and available upon request. For the difference in order processing cost (effective spread), there are an average of 10 (8) t-statistics that are significant at the 5 percent level.
Comparing Tables IV and V, the result of Table IV is much stronger than result of Table V. One potential explanation for the weaker results under the matched-sample approach is that the available number of matched pairs of stocks is small relative to the number of stocks available in the two matching firms. The average sample size (18 stocks) is small because many specialist firms manage only 20 to 30 common stocks.
D. Possible Explanations for Different Execution Costs among Specialist Firms
What might account for the difference in the order processing costs and effective spreads across specialist firms? We offer several conjectures including differences in efficiency, structure, and trading style or philosophy.
Efficiency refers t o how the firm organizes its operations including back office functions and banking relationships. All else equal, a less efficient firm should have higher order processing costs. Investors trading with inefficient specialist firms would pay higher costs t o complete their transactions.
Related to efficiency are cost differences that reflect differences in the structure of the specialist firms. Some specialist firms are small, privately held partnerships while others are large, well capitalized public corporations. For example, Merrill Lynch earns substantial amounts of interest from the cash balances on its short stock positions. I t is able to do this more profitably than smaller firms because Merrill Lynch obtains the equity capital to margin its short stock position at a low cost from its parent company. Smaller specialist firms must finance large stock positions with more costly equity capital ob-
lo The specialist participation rate variables have been dropped to avoid singularity.
1636 The Journal of Finance
tained either from borrowing or from investment by their partnershharehold- ers.
Differences in trading styles or philosophies among specialist firms are usually divided into two general categories. Some specialist firms essentially are tick traders and desire a flat book (zero inventory position) by the end of the day. Others are position traders, establishing large speculative inventory positions. Differences in trading styles imply differences in the nature of specialist participation not captured by participation rates. Tick trading firms will be active on both sides of the market but trading relatively small volumes, while position trading firms will be more active and provide greater depth on one side of the market than the other. Since specialist participation is related to execution costs, trading style may explain some of the observed differences.
E. Specialist Pricing and Intersecurity Subsidy
A feature of execution costs within a specialist firm is that order processing costs on a per share basis should be lower for active stocks than for inactive ones. Recall that order processing costs can be interpreted as the noninforma- tional costs paid by investors. Hence, a positive relationship between order processing costs and trading: frequency indicates that the costs to investors are higher in the stocks where demand for trade executions is higher.
To test (H3) we perform the following regression separately for each spe- cialist firm:
$i = (Y + plLog(Trade size)i + p2Log(NTrade)i (10)
+ p3Regionali + p,Log(Price)i + p5SDi + qi the subscript i refers to the ith stock for the specialist firm. The independent variables are as defined for equation (7) without those variables associated with specialist participation rates. Under the null hypothesis, the coefficient p2 should be nonpositive for each specialist firm.
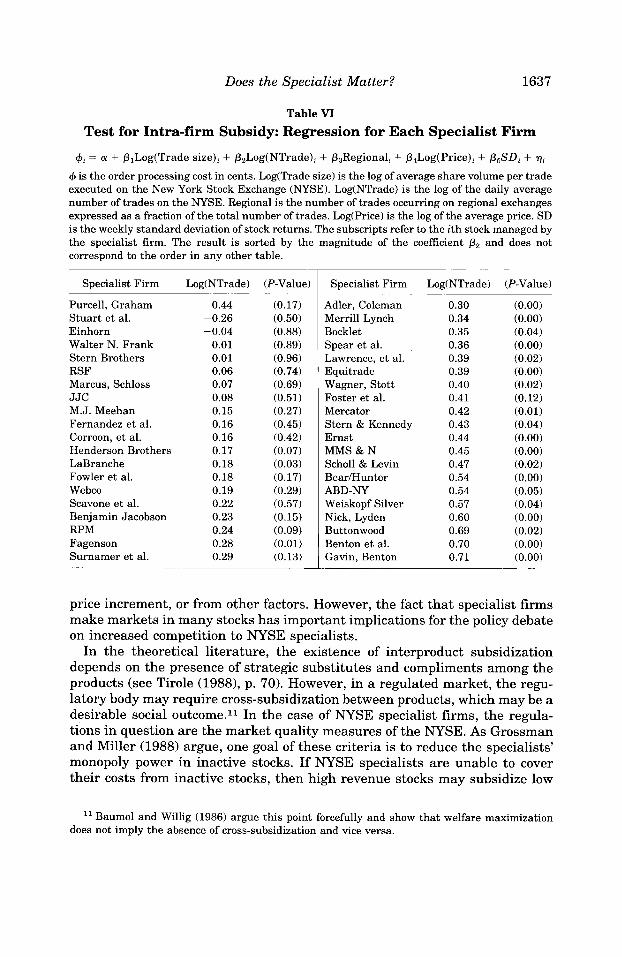
Table VI presents the OLS results. Since we are mainly interested in testing the relationship between trading frequency and order processing costs, we report the pz coefficients only. The estimated coefficients of the other explan- atory variables are generally consistent with those reported in Table IV. The estimated p2 coefficients are positive for 37 of the 40 specialist firms. For the 37 positive coefficients, 21 are significant at the 5 percent confidence level. The t-statistic for the mean of the pz coefficients is 7.46, which is significantly positive. The evidence suggests that, within each specialist firm, per share order processing costs for active stocks are higher than for inactive stocks.
These results indicate that there are higher costs to investors trading in stocks where there is a higher demand for trade executions. This does not imply that specialist firms act as profit maximizing monopolists. Our result does not indicate whether demand sensitive pricing arises from profit maxi- mization by the specialist, from a natural tendency of trading to concentrate at one point, from regulatory restrictions to market entry, from the minimum
Does the Specialist Matter? 1637
Table VI Test for Intra-firm Subsidy: Regression for Each Specialist Firm
c$& = a! + PILog(Trade size), + &Log(NTrade), + P3RegionalL + P4Log(Price), + P&D, + r), I$ is the order processing cost in cents. Log(Trade size) is the log of average share volume per trade executed on the New York Stock Exchange (NYSE). Log(NTrade) is the log of the daily average number of trades on the NYSE. Regional is the number of trades occurring on regional exchanges expressed as a fraction of the total number of trades. Log(Price) is the log of the average price. SD is the weekly standard deviation of stock returns. The subscripts refer to the ith stock managed by the specialist firm. The result is sorted by the magnitude of the coefficient Pz and does not correspond to the order in any other table.
Specialist Firm Log(NTrade) (P-Value) I Specialist Firm Log(NTrade1 (P-Value)
Purcell, Graham Stuart e t al. Einhorn Walter N. Frank Stern Brothers RSF Marcus, Schloss JJC M.J. Meehan Fernandez et al. Corroon, e t al. Henderson Brothers LaBranche Fowler e t al. Webco Scavone et al. Benjamin Jacobson RPM Fagenson Surnamer et al.
-0.44 -0.26 -0.04
0.01 0.01 0.06 0.07 0.08 0.15 0.16 0.16 0.17 0.18 0.18 0.19 0.22 0.23 0.24 0.28 0.29
(0.17) (0.50) (0.88) (0.89) (0.96) (0.74) (0.69) (0.51) (0.27) (0.45) (0.42) (0.07) (0.03) (0.17) (0.29) (0.57) (0.15) (0.09) (0.01) (0.13)
Adler, Coleman Merrill Lynch Bocklet Spear et al. Lawrence, et al. Equitrade Wagner, Stott Foster et al. Mercator Stern & Kennedy Ernst MMS & N Scholl & Levin Bearmunter ABD-NY Weiskopf Silver Nick, Lyden Buttonwood Benton et al. Gavin, Benton
0.30 0.34 0.35 0.36 0.39 0.39 0.40 0.41 0.42 0.43 0.44 0.45 0.47 0.54 0.54 0.57 0.60 0.69 0.70 0.71
(0.00) (0.00) (0.04) (0.00) (0.02) (0.00) (0.02) (0.12) (0.01) (0.04) (0.00) (0.00) (0.02) (0.00) (0.05) (0.04) (0.00) (0.02) (0.00) (0.00)
price increment, or from other factors. However, the fact that specialist firms make markets in many stocks has important implications for the policy debate on increased competition to NYSE specialists.
In the theoretical literature, the existence of interproduct subsidization depends on the presence of strategic substitutes and compliments among the products (see Tirole (19881, p. 70). However, in a regulated market, the regu- latory body may require cross-subsidization between products, which may be a desirable social outcome.ll In the case of NYSE specialist firms, the regula- tions in question are the market quality measures of the NYSE. As Grossman and Miller (1988) argue, one goal of these criteria is to reduce the specialists’ monopoly power in inactive stocks. If NYSE specialists are unable to cover their costs from inactive stocks, then high revenue stocks may subsidize low
l1 Baumol and Willig (1986) argue this point forcefully and show that welfare maximization does not imply the absence of cross-subsidization and vice versa.
1638 The Journal of Finance
revenue stocks. Finally, the presence of a cross-subsidy does not necessarily mean that the total cost to investors is higher than in a competitive market subject to regulatory constraints.
Faulhaber and Levinson (1981) describe two implications of subsidy-free pricing that apply to NYSE specialists. First, if prices are subsidy-free, then no new entrant can provide lower execution costs to a subset of stocks or trades. The NYSE has lost market share to trading alternatives that provide liquidity for small retail orders in active stocks. Recently, Battalio, Greene, and Jen- nings (1995) report that one alternative, Madoff Securities, is competing on cost. Second, trading in each stock and within each identifiable subset of trades is profitable to the specialist. However, Sofianos (1995) has shown that NYSE specialists do not trade inactive stocks profitably.
Cross-subsidization may also be related to the allocation process. This is because the Allocation Cornmittee uses support for the allocation process as one criterion in allocating new listings. Specialist firms are expected to apply for all potential listings. Furthermore, the institutional culture of the NYSE discourages specialist firms requesting that unprofitable listings be reas- signed.
The NYSE may choose to require the cross-subsidization of higher cost stocks for two reasons. First, cross-subsidization may build future demand for liquidity in the low volume stocks. Second, low trading costs for smaller firms may attract more new listings to the NYSE by demonstrating that the costs for investors wishing to trade their securities will be low. As specialist firms also benefit from increased dem-and for trade executions and from new listings, the goals of the NYSE and of specialist firms are compatible.
Formal tests for cross-subsidy, such as Palmer (19921, require internal cost data for the specialist firrn rather than the sum of internal cost and profit estimated as order processing cost. Thus, we leave a rigorous analysis of the presence of a cross-subsidy for future work.
VI. Conclusion
In this article, we document a significant difference in execution costs across specialist firms after controlling for stock-specific characteristics. This result indicates that there may be differences in efficiency and/or profitability for NYSE specialist firms. However, the cost differences between specialist firms are small compared to the cost differences between the NYSE and Nasdaq. Furthermore, we find strong evidence that the order processing costs, which are a proxy for the noninformational costs of trading, are higher for the actively traded stocks assigned to that firm. This finding is consistent with a cross-subsidy from actively traded stocks to inactively traded stocks within a specialist firm.
The existence of specialist firms with relatively low execution costs has implications for the NYSE and regulatory agencies. For the NYSE, low cost specialists may be the most efficient. Less efficient specialists should not be protected from the consequences of being high cost providers of liquidity. From
Does the Specialist Matter? 1639
a regulatory perspective, the existence of differential liquidity costs implies that the market for trade executions both on and off the NYSE does not enforce uniform pricing. Furthermore, if active stocks subsidize inactive stocks, the welfare implications of the expansion of non-NYSE trading in active NYSE stocks warrant more careful analysis. An important area for future research is to identify the determinants of differences in execution costs among specialist firms.
REFERENCES Barnea, Amir, 1974, Performance evaluation of New York Stock Exchange specialists, Journal of
Financial and Quantitative Analysis 9, 511-534. Battalio, Robert, Jason Greene, and Robert Jennings, 1995, Do competing specialists and prefer-
encing dealers affect market quality? An empirical analysis, Working paper, Indiana Univer- sity.
Baumol, William, and Robert Willig, 1986, Contestability: Developments since the book, Oxford Economic Papers 38 (Supplement), 9-36.
Coughenour, Jay, and Daniel Deli, 1996, On the organizational form of NYSE specialist firms, Working paper, University of Massachusetts-Boston.
Corwin, Shane, 1996, Differences in trading behavior across New York Stock Exchange specialist firms, Ph.D. Dissertation, Ohio State University.
Easley, David, Nicholas Kiefer, Maureen OHara, and Joseph Paperman, 1996, Liquidity, infor- mation, and infrequently traded stocks, Journal of Finance 51, 1405-1436.
Faulhaber, Gerald, and Stephen Levinson, 1981, Subsidy-free prices and anonymous equity, American Economic Review 71, 1083-1091.
George, Thomas, Gautam Kaul, and M. Nimalendran, 1991, Estimation of the bid-ask spread and its components: A new approach, Review of Financial Studies 4, 623-656.
Glosten, Lawrence, and Lawrence Harris, 1988, Estimating the components of the bid/ask spread, Journal of Financial Economics 21, 123-142.
Grossman, Sanford, J., and Merton Miller, 1988, Liquidity and market structure, Journal of Finance 43, 617-637.
Hansen, Lars, 1982, Large sample properties of generalized method of moments estimators, Econometrica 50, 1029-1054.
Harris, Lawrence, 1994, Minimum price variations, discrete bid-ask spreads, and quotation sizes, Review of Financial Studies 7, 149-178.
Hasbrouck, Joel, 1988, Trades, quotes, inventories, and information, Journal of Financial Eco- nomics 22, 229-252.
Hasbrouck, Joel, and George Sofianos, 1993, The trades of market makers: An empirical analysis of NYSE specialists, Journal of Finance 48, 1565-1593.
Ho, Thomas, and Hans Stoll, 1981, Optimal dealer pricing under transactions and return uncer- tainty, Journal of Financial Economics 9, 47-13.
Huang, Roger, and Hans Stoll, 1994, Market microstructure and stock return predictions, Review of Financial Studies 7, 179-214.
Huang, Roger, and Hans Stoll, 1995, Components of the bid-ask spread: A general approach, Working paper, Vanderbilt University.
Huang, Roger, and Hans Stoll, 1996, Dealer versus auction markets: A paired comparison of execution costs on Nasdaq and the NYSE, Journal of Financial Economics 41, 313-358.
Lin, Ji-Chai, Gary Sanger, and Geoffrey Booth, 1995, Trade size and components of the bid-ask spread, Review of Financial Studies 8, 1153-1183.
Madhavan, Ananth, Matthew Richardson, and Mark Roomans, 1994, Why do security prices change? A transaction-level analysis of NYSE stocks, Working paper, University of Southern California.
Madhavan, Ananth, and Seymour Smidt, 1991, A Bayesian model of intraday specialist pricing, Journal of Financial Economics 30, 99-134.

1640 The Journal of Finance
Madhavan, Ananth, and Seymour Smidt, 1993, An analysis of changes in specialist inventories and quotations, Journal of Finance 48, 1595-1628.
Madhavan, Ananth, and George ISofianos, 1994, Auction and dealer markets: An empirical anal- ysis of NYSE specialist trading, Working paper, New York Stock Exchange.
McInish, Thomas, and Robert Wood, 1992, An analysis of intraday patterns in bidask spreads for NYSE stocks, Journal of Finance 47, 753-764.
Palmer, Karen, 1992, A test for cross subsidies in local telephone rates: Do business customers subsidize residential customers?, RAND Journal of Economics 23, 415-431.
Sofianos, George, 1995, Specialist gross trading revenues at the New York Stock Exchange, Working paper, New York Stock Exchange.
Stoll, Hans, 1985, The stock exchange specialist system: An economic analysis, The Salomon Brothers Institute Monograph Series in Finance and Economics 1985-2, New York University.
Stoll, Hans, 1989, Inferring the components of the bid-ask spread: Theory and evidence, Journal of Finance 44, 115-134.
Tirole, Jean, 1988, The Theory oflndustrial Organization (MIT Press, Cambridge, Mass.).