Embed Size (px)
Citation preview
Working Paper/Document de travail 2012-25
Does the Buck Stop Here? A Comparison of Withdrawals from Money Market Mutual Funds with Floating and Constant Share Prices
by Jonathan Witmer
2
Bank of Canada Working Paper 2012-25
August 2012
Does the Buck Stop Here? A Comparison of Withdrawals from Money Market Mutual Funds with Floating and Constant Share
Prices
by
Jonathan Witmer
Financial Markets Department Bank of Canada
Ottawa, Ontario, Canada K1A 0G9 [email protected]
Bank of Canada working papers are theoretical or empirical works-in-progress on subjects in economics and finance. The views expressed in this paper are those of the author.
No responsibility for them should be attributed to the Bank of Canada.
ISSN 1701-9397 © 2012 Bank of Canada

ii
Acknowledgements
I thank Henrik Andersen, Jean-Sebastien Fontaine, Sermin Gungor, Scott Hendry, Jesus Sierra Jimenez, Stéphane Lavoie, Iwan Meier and seminar participants at the Bank of Canada – Bank of Spain Workshop on International Financial Markets and the GdRE Annual Symposium on Money Banking and Finance for their helpful comments. All remaining errors are my own.
iii
Abstract
Recent reform proposals call for an elimination of the constant net asset value (NAV) or “buck” in money market mutual funds to reduce the occurrence of runs. Outside the United States, there are several countries that have money market mutual funds with and without constant NAVs. Using daily data on individual fund flows from these countries, this paper evaluates whether the reliance on a constant NAV is associated with a higher frequency of sustained fund outflows. Preliminary evidence suggests that funds with a constant NAV are more likely to experience sustained outflows, even after controlling for country fixed effects and other factors. Moreover, these sustained outflows in constant NAV money market funds were more acute during the period of the run on the Reserve Primary fund, and were subdued after the U.S. Treasury guarantee program for money market funds was put in place. Consistent with the theory that constant NAV funds receive additional implicit support from fund sponsors, fund liquidations are less prevalent in funds with a constant NAV following periods of larger outflows.
JEL classification: F30, G01, G18, G20 Bank classification: Financial markets; Financial stability; Market structure and pricing
Résumé
En vue de réduire le risque de ruée, des propositions de réforme récentes appellent à l’interdiction des fonds communs de placement monétaires à valeur liquidative (VL) constante. Dans plusieurs pays en dehors des États-Unis, les fonds monétaires à VL variable et constante coexistent. À partir de données quotidiennes relatives aux flux financiers issus des fonds de ces pays, l’auteur évalue si le modèle à VL stable est associé à des sorties prolongées de capitaux plus fréquentes. Les résultats préliminaires semblent confirmer que les fonds à VL constante sont plus susceptibles de connaître des sorties prolongées de capitaux, même après prise en compte des effets fixes de pays et d’autres facteurs. En outre, les fuites ont été plus importantes lorsque le fonds Reserve Primary a subi une hémorragie de capitaux, et elles sont tombées après la mise en place par le Trésor américain d’un programme de garantie des fonds monétaires. En accord avec l’idée que les fonds à VL stable reçoivent de leurs promoteurs un soutien implicite supplémentaire, l’auteur constate que les fonds de cette catégorie enregistrent moins de liquidations après des sorties importantes de capitaux.
Classification JEL : F30, G01, G18, G20 Classification de la Banque : Marchés financiers; Stabilité financière; Structure de marché et fixation des prix
2
1. Introduction
In the United States, money market mutual funds maintain a constant share price, also known as a
constant Net Asset Value (NAV), of $1 per share. As such, a share in a money market mutual fund is
similar to a deposit contract since the shareholder is effectively guaranteed the return of her initial
investment upon withdrawal of her money from the fund. Unlike a deposit contract, there is no deposit
insurance for money market mutual funds, so the lack of such insurance may make them susceptible to a
bank run (Diamond and Dybvig, 1983). Indeed, such a run did occur on September 16th 2008, when the
Primary Reserve fund “broke the buck” as its share price was reduced below $1 to $0.97. This was
followed by massive redemptions in other money market mutual funds and the U.S. Treasury introduced a
temporary guarantee program for money market mutual funds to prevent a market-wide run from
occurring (FINRA, 2010). This was complemented by the Federal Reserve’s asset-backed commercial
paper money market mutual fund liquidity facility, which provided liquidity to money market funds that
needed to satisfy an influx of redemptions (Duygan-Bump et al, 2012).
In the aftermath of this event, there have been several proposals to reform the structure of the
money market mutual fund industry, as part of a broader set of proposals to reform shadow banking
(Financial Stability Board, 2010). One of the primary proposals is to abandon the constant share price of
$1 per share in favour of a floating share price.1 In this case, if the intrinsic value of the fund falls in
value, this will be reflected in the share price, and the redeeming shareholders should have less incentive
to run for the exits. Therefore, it is generally believed that moving away from a constant share price
structure will reduce the risk of a run. Nonetheless, there may still be a risk of runs in floating share price
money market mutual funds as well. Jenk and Wedow (2010), for example, find evidence of runs from
illiquid money market mutual funds in Germany, where mutual funds do not have a constant share price
structure. There is also some anecdotal evidence that suggests a floating NAV does little to reduce the
occurrence of runs on money market mutual funds (e.g., Investment Company Institute, 2011; HSBC,
2011; Bengtsson, 2010).
The focus of this paper is to empirically examine whether floating NAVs provide a benefit in
reducing run-like behaviour. To do so, I examine the flow and withdrawal behaviour of money market
mutual funds in the United States and Europe. Unlike the United States, many European countries have
money market mutual funds with and without constant NAVs and hence provide an opportunity to
1 The Technical Committee of the International Organization of Securities Commissions has examined several proposals in a recent consultation report (IOSCO, 2012). Other proposals include calls for money market mutual funds to pay insurance fees (like deposit insurance) and to maintain a minimum buffer (similar to a minimum capital ratio). Following the crisis, several countries have implemented increased disclosure and stricter restrictions on the portfolios of money market mutual funds (See Section 2 for a discussion of these requirements).
3
examine how flow behaviour is different under these structures. This paper fills a void in the academic
literature since it is essentially the first to examine the pricing structure of money market mutual funds.
The only prior paper, to the best of my knowledge, is Lyon (1984), which investigates the effect of the
SEC allowing money market mutual funds to use amortized cost accounting (i.e., a CNAV structure) in
the United States in the late 1970s. This prior paper is concerned with flow behaviour and evidence of
arbitrage in this structure, and not directly on the link between the pricing structure and the incidence of
runs. Nonetheless, the paper is similar to this one in that they both provide evidence of a link between the
constant share price and flow behaviour in money market mutual funds.
This paper is the first to examine the usage of a constant NAV structure across countries. It is
well known that money market funds in some countries, such as the United States, employ a constant
NAV structure. It is less well known to what extent other countries use a different structure. The main
difference between floating NAV and constant NAV money market funds is the use of amortized cost
accounting.2 Floating NAV money market mutual funds measure the value of their positions using fair
value or market prices. For constant NAV money market funds, the value is recorded as the initial cost,
plus the straight line amortization of the position’s premium or discount at the time of purchase through to
the position’s maturity date. This paper shows that many European countries have a mixture of both fund
types.
This paper also contributes to the broader literature that examines the relation between stale share
prices, illiquid fund holdings, and fund flows in equity and bond mutual funds. Arbitrageurs can take
advantage of stale prices in illiquid mutual funds at the expense of the remaining shareholders. These
apparent arbitrage opportunities induce a change in flows in these mutual funds. The paper by Lyon
(1984) finds this arbitrage activity dilutes other shareholders in money market funds by an estimated 10
bps per year. This dilution is even larger in international equity mutual funds, where dilution can be
upwards of 1% per year (e.g., Greene and Hodges, 2002; Zitzewitz, 2003). Chen, Goldstein and Jiang
(2010) use a global games approach to model payoff complementarities and financial fragility in mutual
funds. In their model, investor withdrawals impose a negative externality on the remaining fund
shareholders, especially in those funds that may need to liquidate illiquid asset holdings (Edelen, 1999).
This amplifies the effect of fund performance on flows in illiquid funds, since investors may redeem their
shares on the self-fulfilling belief that other investors also are redeeming shares. They confirm their
model empirically in the flow-performance relation in equity mutual funds.
2 A constant NAV is a function of two components: amortized cost accounting and penny rounding. Some constant NAV funds distribute income (which I will refer to as stable NAV funds) so that their share price always remains constant. I use a broader definition of constant NAV mutual funds to include those that accumulate income, so that the share increases.
4
Money market mutual funds with a constant NAV are similar to funds holding illiquid assets or
funds with a stale share price: in these situations, investors may be able to trade at a price that does not
properly reflect the price that would be received from liquidating the underlying assets, thus imposing a
negative externality on the remaining shareholders. As such, it may create additional financial fragility in
money market mutual funds. A floating NAV may overcome this problem; however, it critically depends
on the extent to which the floating NAV correctly reflects the costs of liquidating the underlying holdings
during a period of heavy redemptions. Thus, it is an empirical question as to whether there is much of a
difference between floating and constant NAV mutual funds in preventing runs.
Using data from international mutual funds, this paper finds that constant share price funds are
more susceptible to periods of prolonged outflows, after controlling for variables such as size and the
fund investor type (e.g., institutional vs. retail) as well as LIBOR-OIS spreads, that may have an impact
on flow behaviour. The 3-month LIBOR-OIS spread is used as a proxy for the performance of the
underlying holdings (since a large portion of money funds hold commercial paper, including from
financial issuers). When LIBOR-OIS spreads increase, these funds also experience more periods of
prolonged outflows. Hence, the results for money market mutual funds provide evidence that is consistent
with arbitrage and stale prices in mutual funds (Lyon, 1984; Greene and Hodges, 2002; Zitzewitz, 2003).
During the first part of September 2008 when there was a run on the Reserve Primary Fund, constant
NAV money market funds experienced more outflows than did floating NAV money market funds.
Further, after the U.S. Treasury implemented its guarantee program for money market funds, constant
NAV U.S.-domiciled U.S. dollar funds performed much better and sustained a decrease in prolonged
outflows during the guarantee period, relative to non-U.S. domiciled U.S. dollar funds.
Fund sponsors provide an implicit guarantee that should mitigate the incidence of runs in constant
NAV money market mutual funds. Funds with sponsors in a better financial condition are more likely to
benefit from such a guarantee. Kacperczyk and Schnabl (2012) do not find any impact of fund sponsor
characteristics on the flow-performance relation and suggest that this is due to a lack of risk adjustment
on the part of investors. This paper complements this work by testing for the presence of such support in
both floating and constant NAV money market funds and by using a different measure of fund net
outflows. There should be less of a need for such sponsor support in floating NAV funds because by
definition there is no guarantee that these funds maintain their value. In this paper I find weak evidence
for a different relation between outflows and sponsor CDS spreads in constant NAV and variable NAV
funds.
5
Constant NAV funds are, however, less likely to be liquidated when the fund is experiencing
heavier outflows, which may be a result of the presence of an implicit guarantee. That is, fund sponsors
may be less likely to support floating NAV funds to prevent them from being liquidated. As expected,
funds that experience more periods of sustained outflows are more likely to be liquidated. All in all, this
suggests a relation between a fund’s use of the constant price structure, implicit fund sponsor guarantees,
and ultimately the fund’s survival.
Although this paper documents an increased frequency of prolonged outflows in constant NAV
mutual funds, it does not necessarily imply that this is the preferred structure since it is not performing a
holistic evaluation of all the benefits and disadvantages of the two structures. Importantly, there are
several advantages of constant NAV money market funds that are not considered in this paper. First, the
CNAV structure may reduce tax, bookkeeping and operational costs for investors. Second, because some
investors can only invest in cash pools with a stable NAV, the industry argues that a switch to a floating
NAV could result in extra risk to the financial system if these funds are directed towards less regulated
vehicles outside of the current regulatory framework (e.g., Investment Company Institute, 2012).
The rest of the paper is organized as follows. In the next section, I provide an institutional
background on the regulation of money market mutual funds in Europe and the United States, focusing on
the pricing and valuation aspects of the regulations. Section 3 develops the main testable hypotheses. In
Section 4, I describe the data and report summary statistics. Section 5 describes the empirical
methodology and presents empirical findings. In Section 6, I discuss robustness checks and provide some
concluding remarks in Section 7.
2. Institutional background on constant NAV
2.1. United States
With the exception of money market mutual funds, all U.S. mutual funds must report a floating
net asset value that represents the market value or fair value of the securities held in its portfolio. The
Securities and Exchange Commission (SEC) officially exempted money market funds from this
requirement in 1983, when it allowed for the use of amortized cost accounting and the penny rounding
method (SEC, 1983).3 These two components allow a money market fund to maintain a constant net asset
value. Under the penny rounding method, a fund company can report the fund’s share price by rounding
the net asset value per share to the nearest cent, assuming a share price of $1. Hence, a fund’s share price
can be reported as $1 if the net asset value is between $0.995 and $1.005. Under amortized cost 3 Prior to this, the SEC had granted individual orders of exemption to money market funds, which allowed those funds to use amortized cost accounting and the penny rounding method (SEC, 1983).
6
accounting, a fund can value its holdings at their acquisition cost, adjusted to linearly amortize the
premium or discount until the holding’s maturity. The fair value or market value may deviate from this
amortized cost accounting valuation, but at maturity the two valuation methods should coincide, provided
there is no default by the security’s issuer.
Along with this change, the SEC added several risk-reducing conditions to “…ensure that any
money market fund that adopts one of the above procedures in an effort to maintain a stable price per
share will be able to maintain that stable price.” In rule 2a-7, the SEC placed restrictions on the portfolio’s
holdings, designed to minimize the funds’ exposure to credit risk and interest rate risk. All the portfolio
investments were to have a remaining maturity of one year or less, and the dollar-weighted portfolio
maturity could not exceed 120 days (this was later reduced to 90 days in 1991).4 Illiquid securities could
not represent more than ten percent of the fund’s assets. Further, the portfolio needed to consist of
securities that a major rating company determined as “high quality”, along with a requirement that the
board determine that the security “…presents minimal credit risk to the fund.”
On top of these restrictions, the fund’s board is obliged to assess the fairness of the fund’s
valuation and pricing methodology and to take steps such that this methodology fairly reflects the fund’s
value per share. In particular, the board must monitor the deviation between the fund’s amortized cost-
based price and the fund’s value based on market prices that the fund would receive based on the sale of
the security. Thus, Fisch and Roiter (2011) argue that U.S. money market funds are really only CNAV
funds under certain circumstances. However, there is the possibility that a board may not adjust its price
in a timely manner, and there could also be incentives against doing so given the stigma associated with
“breaking the buck.”
After the crisis, the SEC amended rule 2a-7 to improve the resiliency of money market mutual
funds. These amendments included tighter restrictions on the credit quality, maturity, and liquidity of
portfolio holdings for money market funds. The maximum dollar-weighted average maturity was reduced
to 60 days, and a maximum dollar-weighted average life to maturity was introduced and set at 120 days.5
As for the liquidity requirements, a minimum of ten percent of a fund’s portfolios must be invested in
“Daily Liquid Assets” and a minimum of thirty percent must be invested in “Weekly Liquid Assets”. The
amended rule 2a-7 also requires monthly website disclosure of portfolio holdings, including information
4 Prior to the crisis, the SEC made significant amendments to rule 2a-7 in 1986, 1991, and 1996. Refer to Money Markets Working Group (2009), Appendix E for a detailed history of the rule 2a-7 amendments. 5 Funds can use the next interest rate reset date for floating rate notes as its maturity when calculating dollar-weighted average maturity, but not when calculating dollar-weighted average life to maturity.
7
on each portfolio security’s amortized cost value. In addition, funds must report the market value of each
portfolio security to the SEC, which becomes publicly available with a 60 day lag.
2.2. Europe
In Europe, most money market funds (and other mutual funds) are structured as Undertakings for
Collective Investment in Transferrable Securities (UCITS). The UCITS Directive outlines rules
concerning the eligible assets for mutual funds. Under this directive, funds are allowed to use amortized
cost accounting for some money market instruments, provided the fund follows the guidelines set out by
the Committee of European Securities Regulators (CESR, 2007). The fund must ensure that there is not a
material discrepancy between the value of the money market instrument and its amortized cost valuation.
Moreover, these CESR guidelines include two principles that state where amortized cost accounting may
be used. It could be applied to money market instruments with a residual maturity of less than three
months and with no specific sensitivity to market parameters, including credit risk. Alternatively, funds
investing solely in high-quality instruments with residual maturities less than or equal to 397 days and
with a weighted average portfolio maturity of 60 days may use the amortized cost method. While these
rules provide for the use of amortized cost accounting, some national regulators, such as those in France
and Ireland, have imposed more stringent rules (International Organization of Securities Commissions,
2012).
A notable difference between European and U.S. funds is in the distribution of income. In the
United States, most funds distribute income to the unitholders, so that the share price maintains a stable
value. In Europe, many funds accumulate income, such that income earned by the fund results in an
increase in the fund’s net asset value. There are also different share classes within some funds that differ
in this regard. Both types of funds may potentially be using amortized cost accounting. Funds state in
their annual report their valuation methodology and in many cases the fund often states that the fund uses
amortized cost accounting except in cases where the market value of the position changes, so it is difficult
to discern the extent of the use of amortized cost accounting from annual reports.
The International Money Market Fund Association (IMMFA) is a European self-regulatory trade
association that sets a code of practice for its members’ triple-A rated CNAV money market mutual funds
(IMMFA, 2011). The code of conduct is similar to the U.S. regulations in that it places restrictions on
portfolio credit quality and maturity. IMMFA funds and securities are priced using the amortized cost
methodology, but deviations between market value and amortized cost value must be monitored at a
weekly frequency or greater. Along with this monitoring, there is an escalation policy that must be
followed once deviations at the portfolio level exceed ten basis points. The code of conduct limits the
8
weighted average portfolio maturity to 60 days and sets minimum credit ratings on the securities in the
fund’s portfolio. After the crisis, the IMMFA amended the code to tighten the risk-limiting conditions
including adding diversification limits, a maximum final legal maturity of 397 days, and requirements on
the credit ratings and minimum criteria on credit ratings. As well, the code requires monthly disclosure of
all portfolio holdings.
3. Hypothesis Development
Financial fragility exists in mutual funds. For example, Chen, Goldstein, and Jiang (2010)
develop a model whereby mutual funds holding illiquid assets experience more outflows following a
period of poor performance than do funds holding liquid assets. This is the result of strategic
complementarities in funds with illiquid assets: withdrawing shareholders impose a negative externality
on remaining shareholders. Specifically, investor redemptions decrease future fund returns, since the fund
incurs direct and indirect costs to readjust its underlying portfolio as a result of these redemptions, and
these costs are not incorporated in the price investors receive for their redemptions (Chordia, 1996;
Nanda, Narayanan & Warther, 2000, Edelen, 1999). Moreover, these costs are likely to be more important
in funds that hold illiquid assets. Self-fulfilling beliefs amplify the effect of fund performance on flows in
illiquid funds, because investors may redeem their shares on the belief that other investors also are
redeeming shares.
Chen, Goldstein and Jiang (2010) find empirical support for their model in the flow-performance
relationship in equity mutual funds. A similar relationship also likely exists in money market mutual
funds, and would likely be more pronounced in CNAV funds. Like illiquid funds in the model discussed
above, CNAV money market funds rely on a share price that does not reflect the true value of the
underlying portfolio. In this sense, redemptions in CNAV mutual funds impose a greater externality on
remaining investors. This would suggest that CNAV money market mutual funds would be associated
with a higher level of outflows and that there should be a greater flow-performance relationship in these
outflows. That is, after a period of poor performance, CNAV mutual funds would be more likely to
experience outflows. Interpreted differently, CNAV mutual funds provide an opportunity for arbitrageurs
to trade on the misevaluations of CNAV mutual funds relative to their mark-to-market value. Lyon (1984)
finds evidence for this arbitrage and estimates that this activity results in losses of about 10 bps per share
to the remaining shareholders in the fund.6
This leads to the first hypothesis: 6 This arbitrage activity also occurs in equity and bond mutual funds that have a floating net asset value, mostly because these funds hold illiquid securities whose prices may be stale and hence are not properly reflected in the fund’s net asset value. Zitzewitz (2003) estimates that this activity results in a dilution of 56 to 114 basis points in international equity funds.
9
Hypothesis 1: CNAV mutual funds are more likely to experience episodes of sustained outflows,
relative to VNAV mutual funds.
In CNAV money market mutual funds, fund sponsors may provide an implicit guarantee to
reduce the likelihood of a self-fulfilling run. Moody’s Investor Services reports that 62 CNAV money
market funds in Europe and the United States received some form of financial support from their fund
sponsor during the 2007-2009 financial crisis. Moreover, sponsors in better financial condition should be
more likely to provide such support. During the run on money market funds in 2008, U.S. CNAV funds
that had sponsors with wider CDS spreads experienced larger outflows (McCabe, 2010). Thus, if
investors rely on these implicit guarantees, fund sponsors in better financial condition should be less
likely to experience fund redemptions in their CNAV funds.
Also impacting the analysis is the fact that risk-taking in funds is lower in funds with sponsors
with limited financial resources and lower in those funds where there are concerns about negative
spillovers to the rest of the fund sponsor’s business (Kacperczyk and Schnabl, 2012). So, this risk-taking
channel may also result in fewer redemptions in funds with sponsors in worse financial condition and
with more reputational concerns, since funds that undertake less risk may be expected, all else equal, to
experience fewer redemptions. The empirical analysis attempts to isolate the effect of the implicit
guarantee by controlling for fund riskiness.
In VNAV mutual funds, on the other hand, it may be less likely that there is an implicit guarantee
by the fund sponsor to maintain the fund’s share price at a certain level. Since the price of a VNAV fund
fluctuates, investors may be more accustomed to the potential to sustain losses in a VNAV fund. If this is
the case, there should be a much weaker relation between fund flows and the fund sponsor’s financial
strength in VNAV money market funds. As far as reputational spillovers are concerned, when a CNAV
fund breaks the buck it receives a lot of negative press and therefore may also be more likely to have a
negative impact on the sponsor’s other business, relative to VNAV funds. Thus, in additional to their
financial strength, fund sponsor reputational concerns may also have an impact on sustained outflows:
Hypothesis 2: Sustained outflows in CNAV mutual funds are more sensitive to the fund sponsor’s
financial condition and fund sponsor reputational concerns, relative to sustained outflows in VNAV
mutual funds.
Implicit guarantees are also likely to effect the survival of money market mutual funds. If a fund
sponsor is likely to step in and provide an implicit guarantee of the CNAV fund’s share price should the
fund underperform, then the fund’s chances of survival should also increase as a result of this implicit
10
guarantee. On the other hand, the first hypothesis would suggest that CNAV money market funds are
more prone to experience episodes of sustained outflows, which could ultimately result in a fund’s
liquidation. To examine the differences between CNAV and VNAV funds, this paper examines how
liquidation differs following periods of heavy redemptions. If the fund sponsor does not provide an
implicit guarantee (such as in the case of a VNAV mutual fund), the fund may be liquidated following a
period of heavy redemptions.
Hypothesis 3: VNAV mutual funds are more likely to be liquidated following periods of heavy
outflows, relative to CNAV mutual funds.
4. Sample and Descriptive Statistics
4.1. Sample
Morningstar is the source of the money market mutual fund data in this paper. I begin by
selecting all money market mutual funds domiciled in the United States and Europe. Funds that are not
denominated in Euros or U.S. dollars are removed from the sample. Morningstar provides information at
the fund share class level. Funds often have several share classes catering to different clients (e.g.,
institutional or retail), with different minimum investment criteria, and with different management fees.
For all of these share classes, I collect daily information on the net asset value per share, the assets under
management at the share class level, as well as the assets under management at the fund level from
January 1, 2006 through December 31, 2011. This paper focuses on those funds that report their fund size
at a daily frequency. To remove data that is not reported at a daily frequency, I count the number of
observations of fund size in every month and remove those observations where the fund does not report
the fund size at least 10 times in that month.
Most of the analysis in this paper is performed at the fund level. Therefore, for each fund, I only
keep share class information from the largest share class and use this information to classify the funds
into different categories. For example, funds can be classified as either institutional funds or retail funds.
A fund is classified as institutional if its largest share class is classified as institutional according to
Morningstar. This information is available for most, but not all funds. For those funds without a
Morningstar Institutional classification, I classify them as institutional if the minimum required
investment is greater than €100,000 or $100,000, depending on the fund’s currency. As well, if the fund’s
largest share class is a class of type “I”, it is classified as institutional.
Funds focusing on government securities are also excluded from the analysis. Government
securities are less information-sensitive than non-government securities and funds holding mostly
11
government securities should be less prone to runs than funds holding private sector securities. This was
the case in the United States in September 2008, when there was a run from prime money market funds to
government money market funds (ICI Factbook, 2008). Funds are classified as a government fund if the
fund name contains “Gov”, “Sovereign” or “Treasury” and are hence removed. Municipal funds,
identified as those with a fund name that contains “Muni”, are also removed. Small funds, with an
average fund size less than €50 million or $50 million, are also excluded.
Morningstar does not categorize funds as having a constant or a floating NAV. Therefore, I use
the following algorithm to determine a fund’s NAV structure. If a fund’s share price is equal to $1, €1,
$10, or €10 throughout the sample period, it is categorized as a constant NAV fund. This is a very strict
interpretation of the definition of a constant NAV mutual fund, because it ignores funds that accumulate
income instead of distribute income. One of the main differences between constant and floating NAV
mutual funds is the extent to which they use amortized cost accounting. A broader definition of a CNAV
fund that attempts to capture the use of amortized cost accounting is examined in the robustness section.
At the end of the third quarter in 2011, Money market funds in France, Luxembourg, Ireland, and
the United States had assets under management of $490 billion, $376 billion, $475 billion, and $2.6
trillion, respectively (European Fund and Asset Management Association, 2011). As Table 1 shows, the
sample examined in this paper covers a substantial portion of these markets. Our sample market size is
smaller as a result of the focus on non-government funds, on funds denominated in Euros and U.S. dollars
(which eliminates Sterling funds in Ireland, for example), and funds that report their fund size at a daily
frequency. From Table 1, it is also apparent that VNAV mutual funds are, on average, smaller than
CNAV mutual funds, with the average CNAV fund size being a multiple of the average VNAV fund size.
Part of this is the result of a skewed distribution in that the very large money market mutual funds are
CNAV funds. The table also categorizes VNAV funds in terms of their variability by splitting them into
three groups: those that experience no share price declines, those that experience share price declines 5%
of the time or less, and those that experience such a decline more than 5% of the time. In each of the
different subsamples, there is a mix of both low-variability and high variability VNAV funds. While no
money market funds in France maintain a stable share price of €1 or €10, a significant portion of funds
show little variation, based on the absence of a share price decrease over the sample period. Of the 262
French Euro-denominated money market funds that are classified as VNAV mutual funds, 49% of them
have never experienced a decline in their fund share price. This could indicate that these funds may be
using amortized cost accounting.
4.2. Fund outflows
12
A concern with CNAV mutual funds is that this structure may be more susceptible to runs. This
paper measures run behaviour using information from fund outflows. Specifically, it measures significant
periods of fund outflows associated with the CNAV and VNAV structures to determine whether there is
any difference in flow behaviour between these two types of money market mutual funds. Several choices
could be used as a measure of economically significant fund outflows. For example, these outflows could
be measured at a daily, weekly, or even a monthly horizon. Using flow behaviour measured over a single
day is problematic for two reasons. First, institutions often deposit cash in money market mutual funds
and withdraw this cash a day or a couple of days later (leading to negative autocorrelation in money
market fund flows as discussed in Wermers (2011)). A measure at a daily frequency may incorrectly
classify this type of flow as a run. Second, a large withdrawal from a fund at a daily frequency may be the
result of a single client removing money from the fund, which also should not be classified as a run. A
measure at a weekly frequency would address the first concern, but may still be susceptible to the second
concern. The measure proposed in this paper looks for evidence of sustained withdrawals, which are less
likely to be the result of a single client withdrawing from the fund. I consider a fund to experience a
sustained outflow if its outflows are greater than 1% of its net assets over a consecutive 3-day period.7
Table 2 and Figure 1a display the frequency of these sustained outflows for U.S. dollar CNAV
mutual funds domiciled in the United States as well as for European VNAV and CNAV U.S. dollar-
denominated mutual funds. Sustained outflows occur relatively infrequently, about 1% of the time for
VNAV funds. Showing the appropriateness of this measure, the frequency of runs spiked during
September 2008, when there was a run on money market mutual funds in the United States. Interestingly,
non-U.S. domiciled CNAV mutual funds experienced a similar pattern, with an even larger increase in
sustained outflows in September 2008. The VNAV mutual funds, on the other hand, showed a milder
increase in sustained outflows during this period, and throughout pretty much the entire sample period. A
similar relation is also evident in Euro denominated funds (Figure 1b). These findings are consistent with
the first hypothesis that CNAV mutual funds are more like to experience sustained outflow behaviour.
But, there are differences between CNAV and VNAV mutual funds, including differences in the average
size of these funds, which may also explain this evidence. This will be investigated in further detail in
Section 5.
5. Empirical Methodology and Findings
5.1. Fund flows and fund share price structure
7 The robustness of the results to different measures of outflows is examined in the robustness section.
13
My first hypothesis is interested in the relation between these sustained outflows and whether a
fund utilizes a constant or floating share price structure. The following daily random effects panel logit
regression is estimated to test the first hypothesis:8
Pr [Outflowit = 1] = Λ(α + β1CNAV + β2Institutional + β3Ln (Fund Size)
+ β4Crisis+ β5CNAV * Crisis + β6Guarantee + β7CNAV * Guarantee
+ β8 CNAV * Guarantee * US + β9Post-Guarantee + β10CNAV * Post-Guarantee
+ β4ΔLIBOR-OIS + β5CNAV * ΔLIBOR-OIS +υi +εit ) (1)
In this regression, the dependent variable is the measure of sustained outflows: it takes the value of 1
when a fund has experienced three consecutive days of outflows greater than 1% of assets under
management. At all other times, it is set equal to zero. Λ(.) is the logistic cumulative distribution
function.
The coefficient of interest in this regression is the β1 coefficient associated with the CNAV
dummy variable (the indicator of whether a fund maintains a constant share price). Under the hypothesis
that CNAV mutual funds are more likely to experience these sustained outflows, this β1 coefficient would
be expected to be positive. Also, this model follows a differences-in-differences approach and includes an
interaction term between the CNAV dummy variable, with three separate dummy variables representing
different time periods. Crisis is a dummy variable that is equal to one from September 1, 2008 through
September 30th, 2008, and zero otherwise. Guarantee is a dummy variable that is equal to one during the
period from September 20th, 2008 through September 19th, 2009, and zero otherwise. This corresponds to
the time when the U.S. Treasury provided a guarantee for U.S. money market mutual funds. Finally, Post-
guarantee is a dummy variable that is equal to one during the period from September 20th, 2009 onwards,
and zero otherwise.
The crisis time period corresponds to the time when the Reserve Primary Fund “broke the buck”,
and there was a sharp decline in assets under management at U.S. prime money market mutual funds. The
interactive coefficient, β5, tests whether the sustained outflows in CNAV funds were different during the
period when the Reserve Primary fund broke the buck. If CNAV money market funds are more
8 Since the dependent variable in this regression is a measure of three-day outflows, the above regression results in overlapping time periods, which could have an impact on the standard error estimates in the regression. To address this concern, the regression is also run using data sampled at three-day intervals to avoid the use of overlapping periods. The regression results using this method are similar. Further, in the robustness section, the results are re-estimated using outflows based on a measure of one-day flows, which would not be subject to the concerns of overlapping periods. Results are also similar using this alternative method.
14
susceptible to runs, this would be the precise period when we should expect to see a higher preponderance
of outflows and hence the β5 coefficient is expected to be positive.
During the period of the U.S. Treasury guarantee program, U.S. money market fund investors
were protected on the downside; therefore, U.S. money market funds should be less likely to experience
sustained outflows during this period and the β8 coefficient in regression (1) should be negative. Note that
this coefficient measures the impact on U.S.-domiciled CNAV money market funds relative to non-U.S.-
domiciled CNAV funds, whereas the β7 coefficient measures the impact on non-U.S.-domiciled money
market mutual funds. The guarantee program only applied to U.S. money market mutual funds, given that
there was no similar guarantee in Europe.
During the post-guarantee period, money market fund regulations were tightened in several
jurisdictions (see Section 2). If these restrictions reduced the riskiness and increased the liquidity of
CNAV money market mutual funds more so than VNAV funds, there should be less of a difference in
outflow behaviour between CNAV money market funds and VNAV money market funds, as measured by
the β10 coefficient.
Of course, several other factors could contribute to sustained outflows so other variables are also
included in this regression. Institutional shareholders are more likely to exhibit different behaviour
regarding fund outflows. Wermers (2011), for example, demonstrates that runs on money market mutual
funds in the United States were much more prevalent in institutional money market mutual funds. Perhaps
this is attributable to a greater level of sophistication among institutional investors combined with better
information relative to retail investors (e.g., due to their economies of scale, they have access to
information on fund flows and fund holdings from data vendors). Along the same reasoning, fund size is
also included as a control variable.
The change in LIBOR-OIS spreads is used to measure sustained outflows related to changes in
the performance of the portfolio underlying the mutual funds. Ideally, the performance should be
measured using the returns of the individual assets held by the funds, but there is an absence of good data
on the performance of the individual assets held by these funds.9 Since most funds hold assets such as
commercial paper that are sensitive to changes in short term funding conditions, this paper uses bank
credit spreads as a measure of these funding conditions. Since CNAV fund outflows may have a different
sensitivity to a change in the LIBOR-OIS spread, the CNAV * LIBOR-OIS interaction term is also
included.
9 The funds provide data on fund returns, but for CNAV funds these are based on amortized cost accounting and may not be representative of the returns on the fund’s holdings.
15
Of course, these spreads will be a better measure of portfolio performance for a fund that holds all
commercial paper, relative to one that holds all government debt. Hence, this measure would be
confounded if VNAV funds, on average, held a different proportion of government securities relative to
CNAV funds. The regressions account for this by examining firms with different risk profiles. The
change in LIBOR-OIS over the previous three-day period is used as the measure of funding conditions for
U.S. dollar funds, while the three-day change in EURIBOR-OIS is used as the measure for Euro-
denominated funds. A three-day period is chosen to correspond to the measure of sustained outflows over
a three-day period.
The results from this regression are presented in Table 3. For both Euro and U.S. dollar funds, the
β1 coefficient associated with the CNAV dummy variable is positive and is statistically significant for U.S.
dollar funds, suggesting a higher likelihood of sustained outflows for CNAV funds relative to VNAV
funds during the pre-crisis period. The coefficient on the interaction CNAV * Crisis is positive and
statistically significant in both Euro and U.S. dollar funds. During the period of the Treasury guarantee,
there was still a heightened level of sustained outflows for VNAV funds, demonstrated by the positive,
statistically significant coefficient on Guarantee Date. However, U.S.-domiciled CNAV funds were
relatively less likely to experience sustained outflows. The statistically significant, negative coefficient on
US * CNAV * Guarantee highlights the fact that U.S.-domiciled funds were less likely than other U.S.
dollar CNAV funds to experience outflows during this period, likely a result of the U.S. Treasury
guarantee program. Finally, in the post-guarantee period, there is an elevated occurrence of sustained
outflows in CNAV mutual funds, since the coefficient on the CNAV * Post Guarantee interaction term is
positive and statistically significant.
The second and third columns examine Low Return and High Return funds, respectively. This
subsample analysis attempts to address the concern that some of the results could be due to differences in
the relative riskiness of CNAV and VNAV funds.10 Low Return funds are defined as those funds whose
return over the period from July 2008 through August 2008 were below the return of the median fund
with the same currency and share price structure (e.g., the median return for U.S. dollar CNAV funds).
Likewise, High Return funds are defined as those funds with a return above the median fund return over
the same period. Returns are being used as a measure of fund riskiness, since funds with higher returns
are likely holding riskier assets such as commercial paper and asset-backed commercial paper that enable
them to generate higher returns. The period of July to August 2008 was chosen to measure the riskiness of
10 Similarly, McCabe (2010) uses gross yields as a proxy for risk and finds that outflows were larger during the crisis for those funds that had higher gross yields in the year prior to the crisis. The volatility of returns could also be used as a measure of fund riskiness, but funds that used amortized cost accounting will have reported returns that are much less volatile than their actual holdings.
16
the fund right before the crisis.11 A short period was chosen since the maturity of money market fund
portfolios is also short by regulation. In Table 3, the Low Return U.S. dollar funds and the High Return
Euro-denominated funds still have a positive, statistically significant β1 coefficient. Even more striking is
the result that there is a statistically significant, negative coefficient on US * CNAV * Guarantee for High
Return funds only, illustrating that the riskier U.S. CNAV funds experienced a lower likelihood of
sustained outflows when the U.S. Treasury guarantee was in effect, relative to the riskier non-U.S. CNAV
funds. The riskier, High Return CNAV funds would have been more likely to experience sustained
outflows in the absence of the guarantee (i.e., the sum of the coefficients on Guarantee Date and CNAV *
Guarantee date is larger for High Return funds). Hence the guarantee should have a larger impact on
these funds.
5.2. Fund flows, fund share price structure, and sponsor financial condition
If there is an implicit guarantee in CNAV money market mutual funds then, according to
Hypothesis 2, a CNAV fund should experience more sustained outflows if there is a lower likelihood of
fund sponsor support. The presence of CDS data on the fund sponsor could be one measure of the
likelihood of support. Large firms and firms that are part of commercial banks or insurance companies are
more likely to have quoted CDS prices, whereas most small firms and standalone investment management
companies do not have quoted CDS prices. In a similar vein, Kacperczyk and Schnabl (2012) use the
level of the CDS spread as a measure of sponsor strength. So, in addition to the presence of CDS data, an
increase in CDS spreads should have a bigger impact on the likelihood of sustained outflows in CNAV
funds vis-à-vis VNAV funds. For funds with sponsors that do not have CDS data, this change is set equal
to zero.12
Pr [Outflowit = 1] = Λ(α + β1CNAV + β2Institutional + β3Ln (Fund Size)
+ β4Crisis+ β5CNAV * Crisis + β6Guarantee + β7CNAV * Guarantee
+ β8 CNAV * Guarantee * US + β9Post-Guarantee + β10CNAV * Post-Guarantee
+ β11ΔLIBOR-OIS + β12CNAV * ΔLIBOR-OIS + β13 Sponsor CDS Data
+ β14 CNAV * Sponsor CDS Data + β15 Sponsor CDS Change
+ β16 CNAV * Sponsor CDS Change + υi + εit) (2)
11 The results in Kazpercyk and Schnabl (2012) suggest that there was an expansion of risk-taking opportunities in money market mutual funds in the year prior to the run on the Reserve Primary fund. 12 For the fixed effect regressions, funds with sponsors that do not have CDS data are excluded.
17
Table 4 presents the results. For U.S. dollar funds, there is no relation between the presence of
CDS data and the likelihood of sustained outflows for CNAV funds. The β13 and β14 coefficients in the
above regression are both statistically insignificant. For VNAV funds, I would expect either no relation or
a small, negative relation between sponsor financial strength and sustained outflows. However, the
opposite is the case: when a fund sponsor’s financial condition worsens, VNAV mutual funds are less
likely to experience a sustained outflow, as evidenced by the negative, statistically significant coefficient
on Sponsor CDS Change.
The coefficient on CNAV * Sponsor CDS Change, on the other hand, is positive and statistically
significant. When the fund sponsor’s financial condition worsens (measured by an increase in CDS
spreads), there is a higher likelihood that a fund is susceptible to sustained outflows, relative to VNAV
funds. This is consistent with Hypothesis 2, which predicts that a weakening of a sponsor’s financial
condition increases sustained outflows, because the value of the sponsor’s implicit guarantee diminishes.
However, the combined effect of the Sponsor CDS Change and Sponsor CDS Change * CNAV
coefficients is close to zero, somewhat diminishing support for this hypothesis given that it is difficult to
justify the relation between VNAV sustained outflows and sponsor financial strength.
In Euro-denominated funds, there is a relation between the presence of CDS data and the
likelihood of sustained outflows for both VNAV and CNAV funds, since the coefficient on Sponsor CDS
Data is positive and statistically significant. The only statistically significant and different relation
between changes in sponsor strength and sustained outflows for CNAV funds is in High Return funds,
where there is a negative, statistically significant coefficient on Sponsor CDS Change and a positive,
statistically significant coefficient on CNAV * Sponsor CDS Change. Again, this is subject to the same
criticism discussed above for U.S. dollar funds.
The paper currently uses the presence of CDS data as a measure of fund sponsor financial
strength. A fund sponsor’s presence in other lines of business may also have an impact on risk-taking in
money market funds and on the decision to provide an implicit guarantee since this may have an impact
on the fund sponsor’s reputation and impact their other lines of businesses. Similar to Kazpercyk and
Schnabl (2012), Fund Business represents the proportion of the fund sponsor’s mutual fund assets under
management that are not in money market mutual funds as at August 2008. Non-Fund Business is a
dummy variable that takes the value of one if the fund sponsor is part of a banking or insurance group.
Both of these measures are demeaned by the average of the measure by fund currency and share price
structure. The results using these measures are examined in Table 5. For U.S. dollar and Euro-
denominated funds, there is no statistically significant relation between Fund Business and sustained
18
outflows. Those funds with a larger Non-Fund Business are, however, less likely to experience sustained
outflows. This could be consistent with less risk taking by these funds if this is interpreted as a measure of
the risk taking in the fund. Alternatively, funds with more reputational concerns may be more likely to
provide support for their funds so this is also consistent with that. However, the sign on the interaction
term, CNAV * Non-Fund Business, negates this effect for CNAV funds such that there is no relation
between Non-Fund Business and sustained outflows for CNAV funds.
5.3. Fund liquidations and fund share price structure
The share price structure of a fund could also affect whether a fund is ultimately liquidated.13 On
the one hand, if CNAV funds are more susceptible to runs, this would suggest that they may also be more
susceptible to being liquidated. On the other hand, CNAV funds may benefit more from an implicit
guarantee from their sponsor, which would lower the probability that CNAV funds get liquidated.
In this subsection, I use a Cox (1972) proportional hazard model to examine the liquidation of
money market funds, and the factors that are associated with a fund’s liquidation. The Cox model can be
used to examine a fund’s liquidation in a panel setting with time-varying independent variables. I estimate
the model on a daily basis, and estimate the likelihood that a fund will be liquidated on day t+1 from the
sample of funds that have not yet been liquidated on day t. Hence, a fund becomes a “failure” once it is
liquidated and it is removed from the analysis in the time period after it has been liquidated. The
instantaneous liquidation rate for fund i is the hazard rate in the model and can be written as a function of
the independent variables:
h(t| xi) = h0(t)exp(xiBx) (3)
The independent variables, xi, include the CNAV dummy, the logarithm of the fund’s size, the
Institutional dummy variable, the Sponsor CDS Data dummy variable, Fund Business, Non-Fund
Business, and Outflows. Outflows is related to the measure of sustained outflows that we used as a
dependent variable in earlier regressions. The dependent variable in previous regressions was equal to one
if a fund experienced outflows greater than one percent of assets for three consecutive days. In this
analysis, I calculate a moving, 30-day average of the fund outflows dummy variable. The 30-day window
was chosen because there may be a time lag between the time when a fund decides to liquidate and the
actual liquidation date. Funds that experience more sustained outflows should, all else equal, be more
likely to be liquidated. To determine whether there is any difference in the behaviour of CNAV funds and
13 The Cox analysis here includes fund closures due to fund mergers as a liquidation event. However, the results are very similar if mergers are excluded and only liquidations are used as a measure of a fund’s failure.
19
VNAV funds, the CNAV dummy variable in this regression is interacted with both the Sponsor CDS Data
dummy variable as well as with the Outflows measure and the Fund Business and Non-Fund Business
variables.
I estimate the Cox proportional hazard model for U.S. dollar funds on the left side of Table 6.
Over the full daily sample period from June 2005 through Feb 2012, there are 277 funds in the survival
analysis that could have been liquidated. Of these, 19, or just over 5% of funds, were liquidated during the
sample period. There is a statistically significant, positive relation between Outflows and fund
liquidations: those funds that experience more sustained outflows over the previous 30 day period are
more likely to be liquidated. CNAV funds, when there are no redemptions, are more likely to be
liquidated relative to VNAV funds, as suggested by the statistical significance on the CNAV dummy
variable.
More importantly, the coefficient on the interaction between CNAV and Outflows is negative and
statistically significant. This is consistent with Hypothesis 3: if CNAV funds are more likely to receive
sponsor support during a period of heavy redemptions, then we should expect to see a weaker relation
between outflows and liquidations in CNAV funds. Moreover, the magnitude of this coefficient is just
about half the magnitude of the coefficient associated with sustained outflows. This suggests that while
there is a relation between sustained outflows and liquidations in VNAV funds, the relation between these
two is much smaller in CNAV funds. Euro-denominated funds display a similar effect. There is no
consistent evidence of a differential relation between sponsor characteristics and fund survival for CNAV
funds.
6. Robustness Tests
An alternative method to measure the effect of the CNAV structure is to examine fund net
inflows directly, rather than constructing a dummy variable measure of Sustained Outflows as has been
done to this point. A test of Hypothesis 1 could be to measure whether there is a higher sensitivity of net
inflows to negative performance in CNAV money market funds. This analysis uses the returns of money
market mutual funds. For CNAV funds, these returns are based upon amortized cost accounting and
hence do not represent the returns based on the fair market value of securities the fund is holding.
The flow-performance relation is examined at a daily frequency using a fixed effects panel
regression that allows for autocorrelation in the disturbance term:
Net Inflowit = α + β1 Net Inflowit-1 + β2 CNAV * Net Inflowit-1 + β3 ΔLIBOR-OIS
20
+ β4 CNAV * ΔLIBOR-OIS + β5 Lagged Return+ + β6 CNAV * Lagged Return+
+ β7 Lagged Return- + β8 CNAV * Lagged Return- +
+ β9 Average Flows+ β10 CNAV * Average Flows
+ β11 Return Volatility + υi + εit (4)
εit = ρεit-1 + ηit (5)
Fund fixed effects are included to control for fund characteristics that could have an impact on
flows. For example, an additional dollar of flows would have a larger effect on percentage flows for
smaller funds. As well, since differences in fund riskiness could lead to differences in flows as well,
Return Volatility is included in the regression.14 This measures the volatility of the fund’s return over the
previous 30 trading days. Average Flows measures the average daily net inflows to funds with the same
currency and pricing structure. The change in LIBOR-OIS spreads, ΔLIBOR-OIS, is included to control
for changes in spreads that could have an effect on flows to all funds. This is also interacted with the
CNAV dummy variable to allow for differences in the flow response to LIBOR-OIS between CNAV and
VNAV funds. Lagged Return + is the excess daily return on a fund relative to the average return on
funds. It is set to zero if excess returns are negative. Lagged Return – is similarly defined. A higher
coefficient on Lagged Return -, relative to the coefficient on Lagged Return +, would be indicative of a
higher sensitivity of flows to performance for VNAV funds. In fact, Table 7, column 1 shows that there is
a higher sensitivity of flows to performance in poorly performing VNAV U.S. dollar funds, whereas there
is no sensitivity of flows to performance in positively performing VNAV funds. For the High Return U.S.
dollar and Euro-denominated funds, this pattern is even stronger for CNAV funds, given that there is a
significant, positive coefficient on the CNAV * Lagged Excess Return - interaction term, suggesting that
investors react more strongly to negative returns in these funds.
Lynch and Musto (2003) and Sirri and Tufano (1998) document a convex flow-performance
relation using mutual fund flows, and Christoffersen (2001) finds a convex relation for money market
fund flows. Essentially a convex flow-performance relation means that investors’ flows are less sensitive
to poor performance than they are to good performance. The results here are contrary to a convex-flow
performance since flows are more sensitive to poor returns then they are to good returns. Some of this
difference could be attributable to differences in the frequency of measurement, since this paper studies
flows at a daily frequency while the others examine flows at a less frequent interval. As well, during the
14 Return volatility is likely biased downward for CNAV funds since their returns are based upon amortized cost accounting values.
21
sample period here, investors in money market funds are likely interested in preserving their capital and
there is little upside in money market funds given that there are restrictions on the investment portfolio of
money market funds. This may also explain why there is no reaction to positive excess returns, whereas
there is an outflow when there are negative excess returns. The results for High Return U.S. dollar funds
suggest a negative sensitivity of fund inflows to changes in the LIBOR-OIS spread. This makes sense
since High Return funds are likely invested in more risky assets that should be related to LIBOR-OIS
spreads so this is a better measure of performance for these funds.
So far, the analysis has examined sustained outflows as a proxy for run behaviour. An alternative
interpretation of the earlier results is that flows in CNAV funds may just be more volatile, and this would
manifest itself in a higher likelihood of sustained outflows and inflows for CNAV funds.15 As a
robustness check, this section tests whether sustained inflows produce a similar result. Sustained inflows
are defined similarly to sustained outflows: three consecutive days of net flows greater than 1% of net
assets. These results are examined in Table 8. There is also a higher likelihood of sustained inflows for
CNAV funds in the pre-crisis period as indicated by the positive and statistically significant coefficient on
the CNAV dummy variable. During the crisis period and the guarantee period, sustained inflows are not
more likely to occur in CNAV funds. In fact, several of the coefficients on the interaction terms, CNAV *
Crisis and CNAV * Guarantee and are statistically significant and negative. Therefore, these results
cannot simply be attributed to higher volatility of flows for CNAV funds.
The U.S. dollar sample is dominated by funds domiciled in the United States that may lead to
results that reflect the difference between U.S.-domiciled funds and non-U.S. domiciled funds, despite the
presence of country dummy variables in the analysis. To address this concern, the U.S. dollar regression
in Table 3 is re-run excluding funds domiciled in the United States (see Table 9). Most of the results from
the earlier regression still stand. CNAV funds experience more outflows, especially in the period around
the run on the Reserve Primary fund. There is no difference in behaviour during the Guarantee period,
which is consistent with the fact that non-U.S. domiciled funds were not subject to the U.S. Treasury
guarantee program.
This paper also utilizes a rather strict definition of CNAV funds, but this reduces the sample of
CNAV funds in the analysis. But, the results may be different for a broader definition of CNAV funds
15 There may exist an incentive to contribute to a CNAV fund if the price of the CNAV fund (i.e., $1) is less than the market value of the underlying securities in the fund. In his research, Lyon (1984) finds that arbitrageur activity as a result of fund misvaluation results in both inflows and outflows. For U.S. dollar funds, the coefficient associated with the CNAV * LIBOR-OIS Change interaction term is positive and significant, indicating that CNAV funds have a higher likelihood of experiencing sustained inflows when LIBOR-OIS spreads increase. This is contrary to the idea of mispricing: there should be a lower likelihood of sustained inflows for CNAV funds when LIBOR-OIS rates increase because an increase in LIBOR-OIS rates indicates that the value of the portfolio is decreasing, and a fund with a constant NAV should not experience more inflows when the portfolio value decreases.
22
that not only looks at funds with a stable net asset value but also those that use amortized cost accounting
and accumulate distributions. I use changes in each fund’s share price to detect the usage of amortized
cost accounting. I classify funds whose daily price never decreases during the sample as constant NAV
mutual funds according to this broader measure. Otherwise, the fund is considered a floating NAV fund.
The results using this broader definition are examined in Table 9. For U.S. dollar funds, the results are
similar to the earlier regressions. CNAV funds are more likely to experience outflows, even during the
crisis period. During the Treasury guarantee period, U.S.-domiciled funds are still less likely (on a
relative basis) to experience sustained outflows.
The results are only slightly weaker for Euro-denominated funds when compared to earlier
regressions.16 The coefficients on the CNAV dummy variable and the CNAV * Crisis interactions terms
are of a smaller magnitude but are both statistically significant. This suggests that there are some
differences in outflow behaviour between CNAV funds defined using a more narrow definition where the
NAV is maintained at a fixed price (e.g., $1) and those defined using a more broad definition. The main
difference between these two types of funds is whether they distribute income to maintain a stable share
price or whether they accumulate income, resulting in an increasing share price. There should be no
strong reason why the distribution policy itself should result in a difference in outflow behaviour. This
small difference could be a result of several different factors. First, the broader definition may actually be
capturing some funds that are, in reality, VNAV funds. The broader definition defined a fund as a CNAV
fund if its price never decreased during our sample period, which could inadvertently result in some
VNAV funds being classified as CNAV funds, resulting in a weaker relation (especially for Euro-
denominated funds, where fewer funds fall under the more narrow definition of CNAV funds). Second,
CNAV funds under the narrow definition may attract a different clientele of investors, who are more risk
averse and hence are more likely to redeem their shares and transfer to a safer option such as a Treasury-
only money market fund.
The analysis to this point in the paper has relied on a specific measure of redemptions: three days
of consecutive outflows greater than 1% of total assets. This measure was used because it overcame some
of the data limitations in our sample, and because this measure also portrayed the run behaviour in
September 2008 in the United States. But other measures should also be able to capture extreme outflows
from money market funds, and in this section I test the results relative to another measure of outflows:
daily outflows greater than 10%. The results are also robust to this measure of runs. The coefficient on the
CNAV dummy variable is positive, albeit a bit smaller in magnitude but it is still statistically significant.
16 I also rerun the results within country/currency pairs and generally obtain similar results. For the broad definition, I investigated Luxembourg U.S. dollar and Euro-denominated funds as well as French Euro-denominated funds. For the narrow definition, I investigated U.S. dollar funds in the U.S. and Ireland, as well as Euro-denominated funds in Ireland.
23
The coefficient on the interaction tern, CNAV * Crisis, remains positive and statistically significant for
U.S. dollar funds. During the Treasury guarantee period, the results are even stronger for U.S.-domiciled
funds, with a larger negative coefficient (and statistically significant).
7. Concluding Remarks
The purpose of this paper was to investigate the relation between money market funds’ use of the
constant price structure and fragility in these funds. Overall, I find that funds using this structure
experience a more frequent occurrence of sustained outflows, relative to VNAV mutual funds. This paper
also illustrates the effectiveness of the U.S. Treasury’s money market fund guarantee program, by
comparing outflow behaviour in the U.S. during the period of the guarantee to outflow behaviour of
VNAV and CNAV U.S. dollar funds domiciled in other countries not covered by the guarantee. During
this period, sustained outflows in U.S.-domiciled funds were reduced relative to outflows in non-U.S.-
domiciled U.S. dollar money market funds.
If CNAV funds benefit more from an implicit guarantee from their fund sponsor, this will also
likely have an effect on their survival. That is, if a fund sponsor is likely to step in and provide an implicit
guarantee of the CNAV fund’s share price should the fund underperform, then the fund’s chances of
survival should also increase as a result of this implicit guarantee. This paper finds that CNAV funds are
less frequently liquidated after a period of heavy redemptions, which is suggestive of an implicit
guarantee for CNAV funds and the lack of such a guarantee in VNAV funds.
This paper has several important policy implications. There is an active push to reform money
market mutual funds in the wake of the financial crisis and more specifically following the run on the
Reserve Primary Fund and subsequent government support of money market funds in the United States.
One of the primary proposals is to move away from the CNAV money market fund structure and towards
the VNAV structure. Some observers have contended that such a move does little to reduce the
occurrence of runs in money market mutual funds, based on anecdotal evidence of run behaviour in
ultrashort bond funds in the United States and enhanced money market funds in Europe, both of which
maintain a VNAV structure (Investment Company Institute, 2011; HSBC, 2011). These funds, however,
are not subject to the same liquidity, credit, and maturity restrictions as money market funds. This paper
compares a large number of money market mutual funds across several countries and finds that, on the
contrary, the VNAV structure is less susceptible to run-like behaviour relative to CNAV money market
funds.
24
However, the VNAV structure does not fully eliminate this run-like behaviour. This is consistent
with the model of Chen, Goldstein, and Jiang (2011), which shows that mutual funds holding illiquid
assets experience more outflows following a period of poor performance, relative to funds holding liquid
assets (their empirical examination focuses on equity mutual funds). That is, in their model investors may
redeem on the self-fulfilling belief that others will be redeeming, imposing the costs of liquidating the
fund’s illiquid assets on remaining shareholders. While money market funds generally hold liquid, short-
term assets, these assets may become illiquid during periods of stress or, put another way, during periods
when there is a belief that a fire sale of some money market fund holdings may occur.17 Even during
periods of stress, however, CNAV money market funds are more prone to run-like behaviours, relative to
VNAV money market funds.
Not only does the CNAV structure have a higher occurrence of sustained outflows, but also there
is some evidence to suggest that it is associated with an implicit guarantee provided by fund sponsors.
This implicit guarantee has both advantages and disadvantages. The presence of an implicit guarantee can
reduce moral hazard and reduce risk-taking in money market mutual funds, since the fund sponsor would
be concerned that the poor performance of the fund may have negative spillovers on the sponsor’s other
businesses (Kazpercyk and Schnabl, 2012). The amount of risk-taking depends upon both the sponsor’s
financial strength as well as the reputational concerns about the effect of “breaking the buck” on the rest
of the sponsor’s fund and non-fund businesses. On the other hand, an implicit guarantee is a potential
channel for contagion between the banking sector and money market mutual funds. Losses in a money
market mutual fund may be passed onto the fund sponsors should they provide support to the fund. As
well, a weakening of a fund sponsor could be passed onto the money market fund sector through a
reduction in the value of the implicit guarantee.
17 Even in normal times, the secondary market for commercial paper is generally thin. Most of the liquidity is provided by dealers, who face their own liquidity and capital pressures during times of stress (Duygan-Bump et al, 2012; Covitz and Downing, 2007).
25
Appendix A. Variable descriptions. CNAV A money market mutual fund is defined as a CNAV fund if it maintains a fixed share
price of $1 or $10, or if it has never experienced a decline in its net asset value. Otherwise, the fund is considered to be a VNAV fund.
Institutional This dummy variable is set equal to 1 if the fund is a fund serving institutional investors. A fund is classified as institutional if its largest share class is classified as institutional according to Morningstar. This information is available for most, but not all funds. For those funds without a Morningstar Institutional classification, they are classified as institutional if the minimum required investment is greater than €100,000 or $100,000, depending on the fund’s currency. As well, if the fund’s largest share class is a class of type I, it is classified as institutional.
Ln (Fund Size) This is the logarithm of the fund’s assets under management, measured at a daily frequency.
LIBOR-OIS Change This variable measures the three day change in the LIBOR-OIS spread.
EURIBOR-OIS Change This variable measures the three day change in the EURIBOR-OIS spread.
Sponsor CDS Data This is a dummy variable that takes the value of 1 if the fund sponsor has an available CDS price reported by Markit.
Sponsor CDS Change This variable is equal to the 3-day change in the fund sponsor’s 5 year CDS spread reported by Markit. CDS data is for US Dollar contracts. For firms where US Dollar contract data is unavailable, Euro contracts are used. If the fund sponsor does not have any CDS data reported by Markit, the change is set equal to zero.
Flow This variable equals the net inflows to the money market fund, scaled by the fund size.
Liquidate This is a dummy variable that takes the value of 1 if the fund was liquidated during the sample period.
Pre-Crisis A dummy variable that is equal to one prior to September 1, 2008.
Crisis A dummy variable that is equal to one from September 1, 2008 through September 30th, 2008, and zero otherwise.
Guarantee A dummy variable that is equal to one during the period from September 20th, 2008 through September 18th, 2009, and zero otherwise. This corresponds to the time when the U.S. Treasury provided a guarantee for U.S. money market mutual funds.
Post Guarantee A dummy variable that is equal to one during the period from September 20th, 2009 onwards, and zero otherwise.
Low Return Funds Those funds whose return over the period from August 2007 through August 2008 was below the return of the median fund with the same currency and share price structure (e.g., the median return for U.S. dollar CNAV funds).
High Return Funds Those funds whose return over the period from August 2007 through August 2008 was above the return of the median fund with the same currency and share price structure (e.g., the median return for U.S. dollar CNAV funds).
Return volatility This measure is the standard deviation of the returns of the fund over the previous 30 trading days.
Average Flows This variable measures the average daily net inflows to funds with the same currency and pricing structure.
Fund Business Fund Business represents the proportion of the fund sponsor’s mutual fund assets under management that are not in money market mutual funds as at August 2008. It is demeaned by the average of Fund Business by fund currency and share price structure.
Non-Fund Business Non-Fund Business is a dummy variable that takes the value of one if the fund sponsor is part of a banking or insurance group. It is demeaned by the average of Non-Fund Business by fund currency and share price structure.
26
References
Bengtsson, E., 2011. Shadow banking and financial stability: European money market funds in the global
financial crisis. Sveriges Riksbank Working paper. Bernardo, A., Welch, I., 2004. Liquidity and financial market runs. Quarterly Journal of Economics 119,
135-158. Chalmers, J., Edelen, R., Kadlec, G., 2001. On the perils of financial intermediaries setting security prices:
the mutual fund wild card option. Journal of Finance 56, 2209-2235. Chen, Q., Goldstein, I., Jiang, W., 2010. Payoff complementarities and financial fragility: evidence from
mutual fund outflows. Journal of Financial Economics 97, 239-262. Cherkes, M., Sagi, J., Stanton, R., 2006. A liquidity-based theory of closed-end funds. Working Paper,
University of California at Berkeley. Chernenko, S., Sunderam, A., 2011. The quiet run of 2011: money market funds and the European debt
crisis. Unpublished Working Paper. Chevalier, J., Ellison, G., 1997. Risk taking by mutual funds as a response to incentives. Journal of
Political Economy 105, 1167-1200. Chordia, T., 1996. The structure of mutual fund charges. Journal of Financial Economics 41, 3-39. Christoffersen, S., 2001. Why do money fund managers voluntarily waive their fees? Journal of Finance
56, 117-1140. Covitz, D., Downing, C., 2007. Liquidity or credit risk? The determinants of very short-term corporate
yield spreads. Journal of Finance 62, 2308-2328. Diamond, D.W., Dybvig, P.H., 1983. Bank runs, deposit insurance, and liquidity. Journal of Political
Economy. Duygan-Bump, B., Parkinson, P., Rosengren, E., Suarez, G., Willen, S., 2012. How effective were the
Federal Reserve emergency liquidity facilities? Evidence from the asset-backed commercial paper money market mutual fund liquidity facility. Journal of Finance, forthcoming.
Edelen, R., 1999. Investor flows and the assessed performance of open-end mutual funds. Journal of
Financial Economics 53, 439-466. European Fund and Asset Management Association, 2011. International statistical release Q3 2011,
supplementary table S4. Fernando, D., Klapper, L., Sulla, V., Vittas, D., 2003. The global growth of mutual funds. World Bank
Policy Research Working Paper 3055. FINRA, 2010. Treasury’s guarantee program for money market mutual funds: what you should know.
July.
27
Fisch, J., Roiter, E., 2011. A floating NAV for money market funds: fix or fantasy? University of
Pennsylvania Law School Research Paper No 11-30. Gorton, G., Pennacchi, G., 1992. Money market funds and finance companies: are they the banks of the
future? Structural Change in Banking, 173-214. Greene, J.T., Hodges, C.W., 2002. The dilution impact of daily fund flows on open-end mutual funds.
Journal of Financial Economics 65, 131-159. HSBC, 2011. Run risk in money market funds. Investment Company Institute, 2012. A bad idea: forcing money market funds to float their NAVs. Jank, S., Wedow, M., 2010. Sturm und drang in money market funds: when money market funds cease to
be narrow. Unpublished Working Paper. Kacperczyk, M., Schnabl, P., 2012. How safe are money market funds? AFA 2012 Chicago Meetings
paper. Lyon, A.B., 1984. Money market funds and shareholder dilution. Journal of Finance 39, 1011-1020. Massa, M., Rehman, Z., 2008. Information flows within financial conglomerates: evidence from the
banks-mutual funds relationship. McCabe, P., 2010. The cross section of money market fund risks and financial crises. Finance and
Economics Discussion Series 2010-51, Board of Governors of the Federal Reserve System. Miles, W., 2001. Can money market funds provide sufficient liquidity to replace deposit insurance?
Jounral of Economics and Finance 25, 328-342. Money Market Working Group, 2011. Report of the Money Market Working Group. Nanda, V., Narayanan, M., Warther, V., 2000. Liquidity, investment ability, and mutual fund structure.
Journal of Financial Economics 57, 417-443. Pennacchi, G., 2006. Deposit insurance, bank regulation, and financial system risks. Journal of Monetary
Economics 53, 1-30. Rakowski, D., Wang, X., 2009. The dynamics of short-term mutual fund flows and returns: a time series
and cross-sectional investigation. Journal of Banking and Finance. Shilling, H., 2010. Sponsor support key to money market funds. Moody’s Investor Service Special
Comment (August 9, 2010). Sirri, E., Tufano, P. 1998. Costly search and mutual fund flows. Journal of Finance 53, 1589-1622. Stein, J., 2005. Why are most funds open-end? Competition and the limits of arbitrage. Quarterly Journal
of Economics 120, 247-272. Squam Lake Group, 2011. Reforming money market funds. Unpublished Working Paper.

28
Technical Committee of the International Organization of Securities Commissions, 2012. Money market
fund systemic risk analysis and reform options. Consultation Report CR07/12. Zitzewitz, E., 2003. Who cares about shareholders? Arbitrage-proofing mutual funds. Journal of Law,
Economics and Organization 19, 245-279.
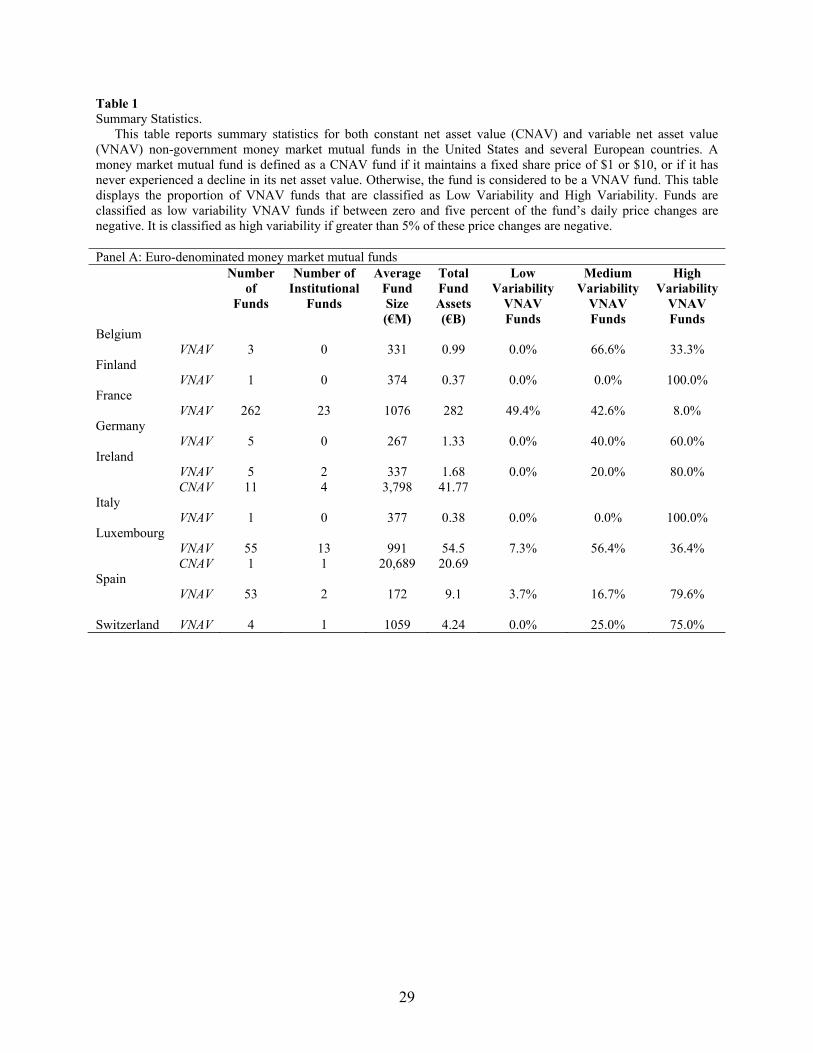
29
Table 1 Summary Statistics.
This table reports summary statistics for both constant net asset value (CNAV) and variable net asset value (VNAV) non-government money market mutual funds in the United States and several European countries. A money market mutual fund is defined as a CNAV fund if it maintains a fixed share price of $1 or $10, or if it has never experienced a decline in its net asset value. Otherwise, the fund is considered to be a VNAV fund. This table displays the proportion of VNAV funds that are classified as Low Variability and High Variability. Funds are classified as low variability VNAV funds if between zero and five percent of the fund’s daily price changes are negative. It is classified as high variability if greater than 5% of these price changes are negative. Panel A: Euro-denominated money market mutual funds Number
of Funds
Number of Institutional
Funds
Average Fund Size (€M)
Total Fund Assets (€B)
Low Variability
VNAV Funds
Medium Variability
VNAV Funds
High Variability
VNAV Funds
Belgium VNAV 3 0 331 0.99 0.0% 66.6% 33.3% Finland VNAV 1 0 374 0.37 0.0% 0.0% 100.0% France VNAV 262 23 1076 282 49.4% 42.6% 8.0% Germany VNAV 5 0 267 1.33 0.0% 40.0% 60.0% Ireland VNAV 5 2 337 1.68 0.0% 20.0% 80.0% CNAV 11 4 3,798 41.77 Italy VNAV 1 0 377 0.38 0.0% 0.0% 100.0% Luxembourg VNAV 55 13 991 54.5 7.3% 56.4% 36.4% CNAV 1 1 20,689 20.69 Spain VNAV 53 2 172 9.1 3.7% 16.7% 79.6% Switzerland VNAV 4 1 1059 4.24 0.0% 25.0% 75.0%
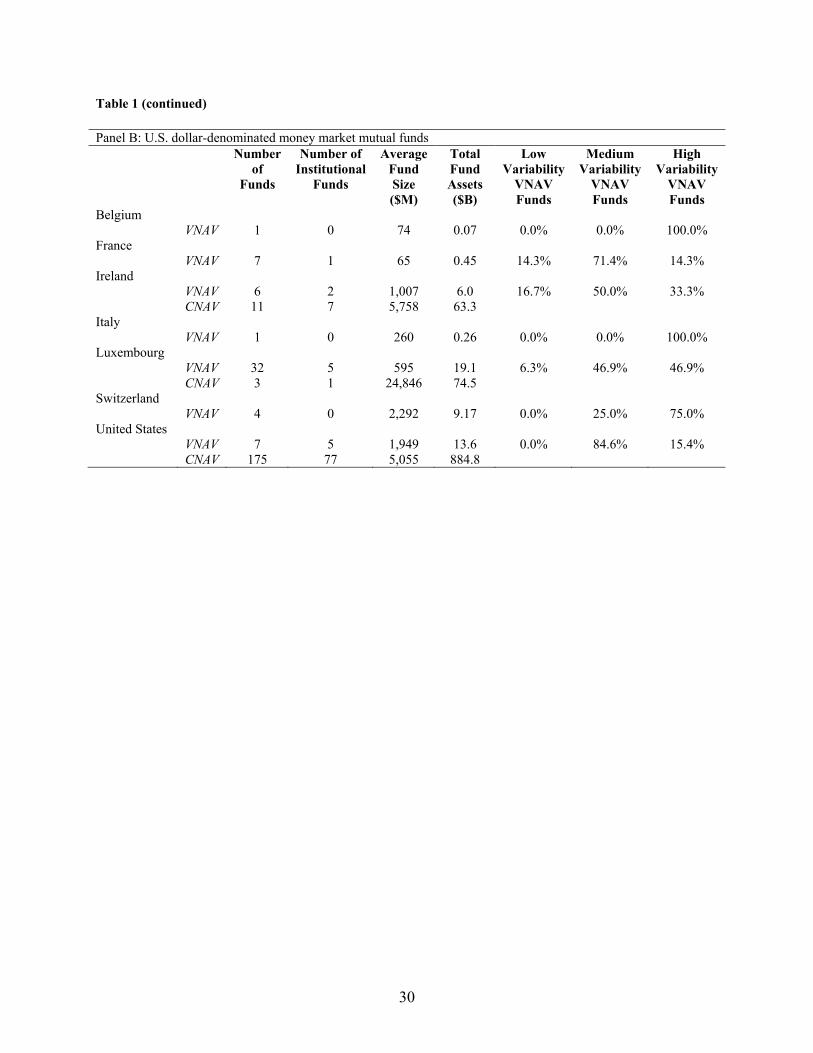
30
Table 1 (continued) Panel B: U.S. dollar-denominated money market mutual funds Number
of Funds
Number of Institutional
Funds
Average Fund Size ($M)
Total Fund Assets ($B)
Low Variability
VNAV Funds
Medium Variability
VNAV Funds
High Variability
VNAV Funds
Belgium VNAV 1 0 74 0.07 0.0% 0.0% 100.0% France VNAV 7 1 65 0.45 14.3% 71.4% 14.3% Ireland VNAV 6 2 1,007 6.0 16.7% 50.0% 33.3% CNAV 11 7 5,758 63.3 Italy VNAV 1 0 260 0.26 0.0% 0.0% 100.0% Luxembourg VNAV 32 5 595 19.1 6.3% 46.9% 46.9% CNAV 3 1 24,846 74.5 Switzerland VNAV 4 0 2,292 9.17 0.0% 25.0% 75.0% United States VNAV 7 5 1,949 13.6 0.0% 84.6% 15.4% CNAV 175 77 5,055 884.8
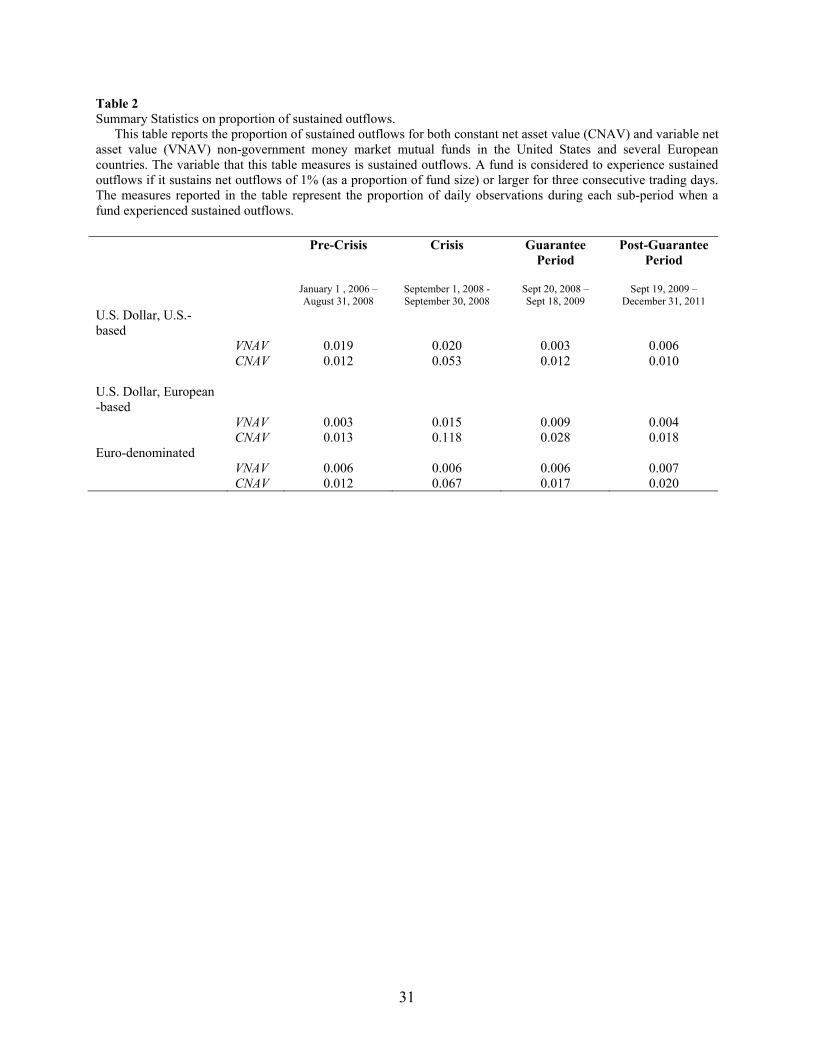
31
Table 2 Summary Statistics on proportion of sustained outflows.
This table reports the proportion of sustained outflows for both constant net asset value (CNAV) and variable net asset value (VNAV) non-government money market mutual funds in the United States and several European countries. The variable that this table measures is sustained outflows. A fund is considered to experience sustained outflows if it sustains net outflows of 1% (as a proportion of fund size) or larger for three consecutive trading days. The measures reported in the table represent the proportion of daily observations during each sub-period when a fund experienced sustained outflows. Pre-Crisis Crisis Guarantee
Period Post-Guarantee
Period
January 1 , 2006 – August 31, 2008
September 1, 2008 - September 30, 2008
Sept 20, 2008 – Sept 18, 2009
Sept 19, 2009 – December 31, 2011
U.S. Dollar, U.S.-based
VNAV 0.019 0.020 0.003 0.006 CNAV 0.012 0.053 0.012 0.010 U.S. Dollar, European -based
VNAV 0.003 0.015 0.009 0.004 CNAV 0.013 0.118 0.028 0.018 Euro-denominated VNAV 0.006 0.006 0.006 0.007 CNAV 0.012 0.067 0.017 0.020
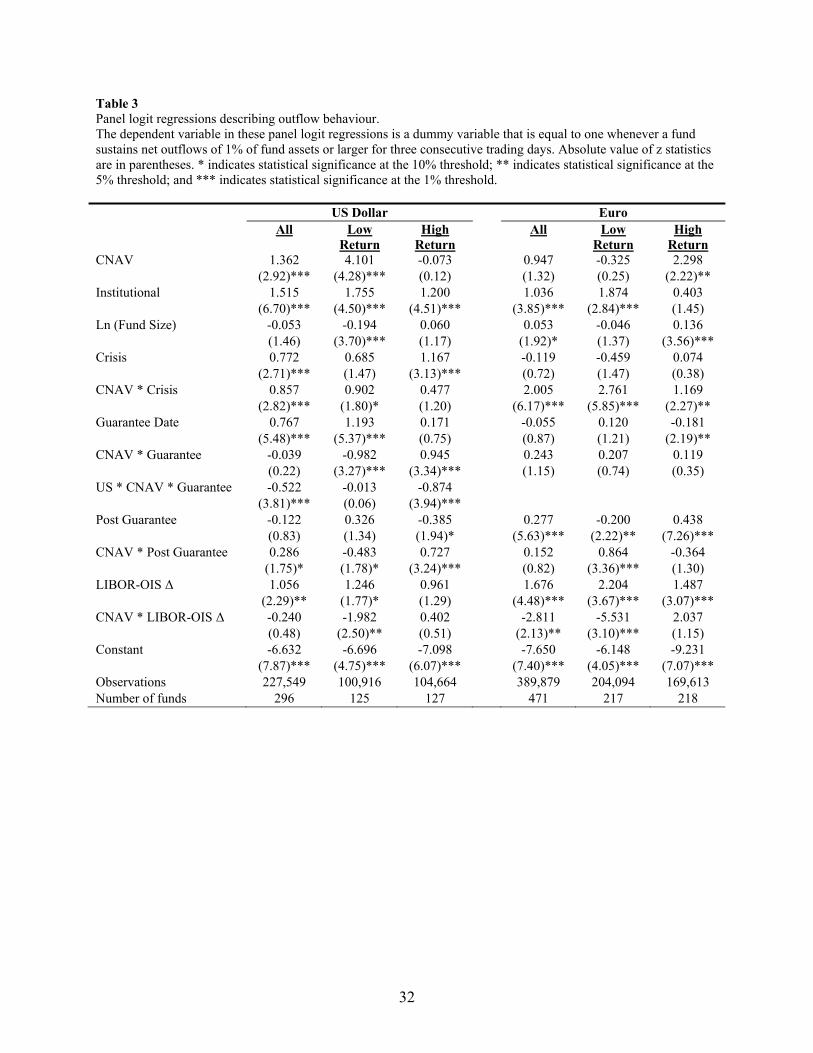
32
Table 3 Panel logit regressions describing outflow behaviour. The dependent variable in these panel logit regressions is a dummy variable that is equal to one whenever a fund sustains net outflows of 1% of fund assets or larger for three consecutive trading days. Absolute value of z statistics are in parentheses. * indicates statistical significance at the 10% threshold; ** indicates statistical significance at the 5% threshold; and *** indicates statistical significance at the 1% threshold. US Dollar Euro All Low
Return High
Return All Low
Return High
Return CNAV 1.362 4.101 -0.073 0.947 -0.325 2.298 (2.92)*** (4.28)*** (0.12) (1.32) (0.25) (2.22)** Institutional 1.515 1.755 1.200 1.036 1.874 0.403 (6.70)*** (4.50)*** (4.51)*** (3.85)*** (2.84)*** (1.45) Ln (Fund Size) -0.053 -0.194 0.060 0.053 -0.046 0.136 (1.46) (3.70)*** (1.17) (1.92)* (1.37) (3.56)*** Crisis 0.772 0.685 1.167 -0.119 -0.459 0.074 (2.71)*** (1.47) (3.13)*** (0.72) (1.47) (0.38) CNAV * Crisis 0.857 0.902 0.477 2.005 2.761 1.169 (2.82)*** (1.80)* (1.20) (6.17)*** (5.85)*** (2.27)** Guarantee Date 0.767 1.193 0.171 -0.055 0.120 -0.181 (5.48)*** (5.37)*** (0.75) (0.87) (1.21) (2.19)** CNAV * Guarantee -0.039 -0.982 0.945 0.243 0.207 0.119 (0.22) (3.27)*** (3.34)*** (1.15) (0.74) (0.35) US * CNAV * Guarantee -0.522 -0.013 -0.874 (3.81)*** (0.06) (3.94)*** Post Guarantee -0.122 0.326 -0.385 0.277 -0.200 0.438 (0.83) (1.34) (1.94)* (5.63)*** (2.22)** (7.26)*** CNAV * Post Guarantee 0.286 -0.483 0.727 0.152 0.864 -0.364 (1.75)* (1.78)* (3.24)*** (0.82) (3.36)*** (1.30) LIBOR-OIS Δ 1.056 1.246 0.961 1.676 2.204 1.487 (2.29)** (1.77)* (1.29) (4.48)*** (3.67)*** (3.07)*** CNAV * LIBOR-OIS Δ -0.240 -1.982 0.402 -2.811 -5.531 2.037 (0.48) (2.50)** (0.51) (2.13)** (3.10)*** (1.15) Constant -6.632 -6.696 -7.098 -7.650 -6.148 -9.231 (7.87)*** (4.75)*** (6.07)*** (7.40)*** (4.05)*** (7.07)*** Observations 227,549 100,916 104,664 389,879 204,094 169,613 Number of funds 296 125 127 471 217 218
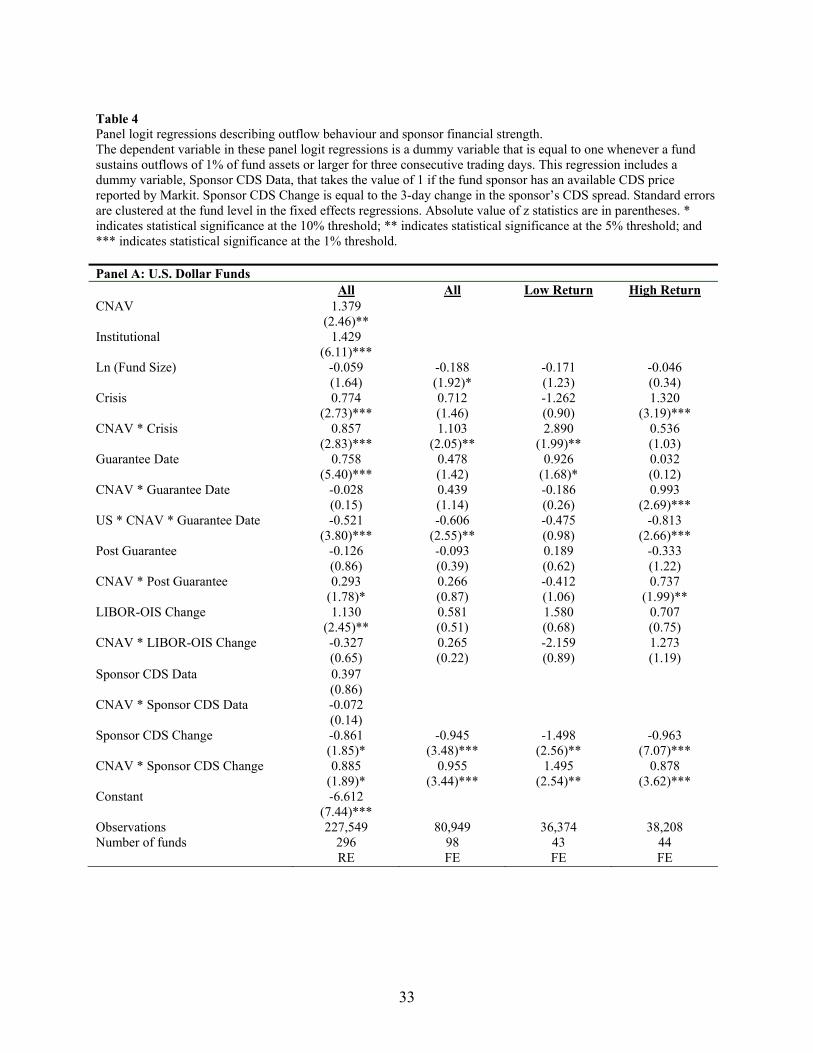
33
Table 4 Panel logit regressions describing outflow behaviour and sponsor financial strength. The dependent variable in these panel logit regressions is a dummy variable that is equal to one whenever a fund sustains outflows of 1% of fund assets or larger for three consecutive trading days. This regression includes a dummy variable, Sponsor CDS Data, that takes the value of 1 if the fund sponsor has an available CDS price reported by Markit. Sponsor CDS Change is equal to the 3-day change in the sponsor’s CDS spread. Standard errors are clustered at the fund level in the fixed effects regressions. Absolute value of z statistics are in parentheses. * indicates statistical significance at the 10% threshold; ** indicates statistical significance at the 5% threshold; and *** indicates statistical significance at the 1% threshold. Panel A: U.S. Dollar Funds All All Low Return High Return CNAV 1.379 (2.46)** Institutional 1.429 (6.11)*** Ln (Fund Size) -0.059 -0.188 -0.171 -0.046 (1.64) (1.92)* (1.23) (0.34) Crisis 0.774 0.712 -1.262 1.320 (2.73)*** (1.46) (0.90) (3.19)*** CNAV * Crisis 0.857 1.103 2.890 0.536 (2.83)*** (2.05)** (1.99)** (1.03) Guarantee Date 0.758 0.478 0.926 0.032 (5.40)*** (1.42) (1.68)* (0.12) CNAV * Guarantee Date -0.028 0.439 -0.186 0.993 (0.15) (1.14) (0.26) (2.69)*** US * CNAV * Guarantee Date -0.521 -0.606 -0.475 -0.813 (3.80)*** (2.55)** (0.98) (2.66)*** Post Guarantee -0.126 -0.093 0.189 -0.333 (0.86) (0.39) (0.62) (1.22) CNAV * Post Guarantee 0.293 0.266 -0.412 0.737 (1.78)* (0.87) (1.06) (1.99)** LIBOR-OIS Change 1.130 0.581 1.580 0.707 (2.45)** (0.51) (0.68) (0.75) CNAV * LIBOR-OIS Change -0.327 0.265 -2.159 1.273 (0.65) (0.22) (0.89) (1.19) Sponsor CDS Data 0.397 (0.86) CNAV * Sponsor CDS Data -0.072 (0.14) Sponsor CDS Change -0.861 -0.945 -1.498 -0.963 (1.85)* (3.48)*** (2.56)** (7.07)*** CNAV * Sponsor CDS Change 0.885 0.955 1.495 0.878 (1.89)* (3.44)*** (2.54)** (3.62)*** Constant -6.612 (7.44)*** Observations 227,549 80,949 36,374 38,208 Number of funds 296 98 43 44 RE FE FE FE

34
Panel B: Euro Funds All All Low Return High Return CNAV 0.953 (0.97) Institutional 0.944 (3.61)*** Ln (Fund Size) 0.060 0.085 -0.052 0.231 (2.16)** (0.59) (0.57) (1.19) Crisis -0.273 -0.056 -0.623 0.206 (1.63) (0.20) (1.22) (0.67) CNAV * Crisis 1.962 1.317 1.782 1.027 (6.02)*** (3.27)*** (2.26)** (2.47)** Guarantee Date 0.496 -0.090 0.289 -0.253 (5.45)*** (0.46) (0.80) (1.40) CNAV * Guarantee Date 0.194 0.237 0.105 0.181 (0.91) (1.04) (0.24) (0.92) Post Guarantee 1.374 0.312 -0.091 0.419 (10.02)*** (2.45)** (0.35) (3.40)*** CNAV * Post Guarantee 0.133 -0.069 0.828 -0.517 (0.73) (0.28) (2.06)** (1.91)* LIBOR-OIS Change 1.054 1.807 3.085 1.298 (3.03)*** (2.43)** (2.63)*** (1.37) CNAV * LIBOR-OIS Change -2.261 -2.119 -5.919 2.022 (1.88)* (0.64) (1.86)* (0.62) Sponsor CDS Data 0.708 (3.94)*** CNAV * Sponsor CDS Data -0.213 (0.23) Sponsor CDS Change -0.400 -0.481 -0.348 -1.406 (2.89)*** (2.76)*** (2.11)** (4.25)*** CNAV * Sponsor CDS Change 0.134 0.132 0.049 1.831 (0.66) (0.52) (0.19) (4.44)*** Constant -8.787 (8.55)*** Observations 389,879 118,390 48,630 66,716 Number of funds 471 154 57 91 RE FE FE FE
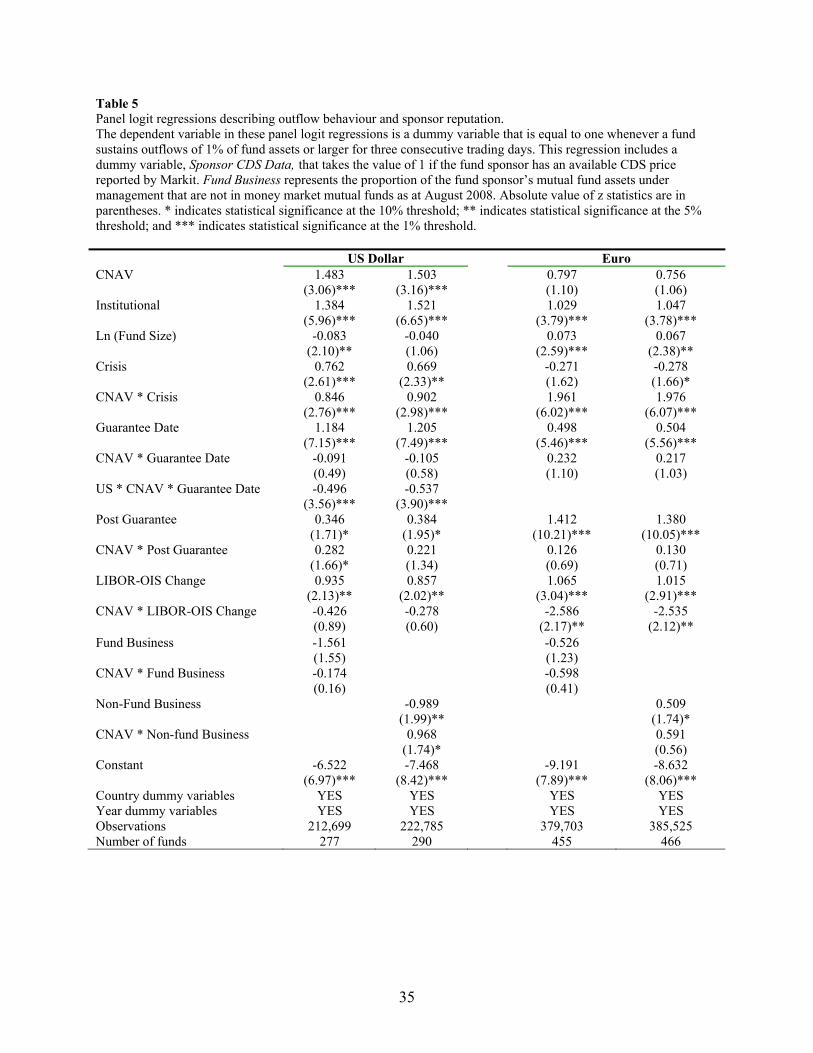
35
Table 5 Panel logit regressions describing outflow behaviour and sponsor reputation. The dependent variable in these panel logit regressions is a dummy variable that is equal to one whenever a fund sustains outflows of 1% of fund assets or larger for three consecutive trading days. This regression includes a dummy variable, Sponsor CDS Data, that takes the value of 1 if the fund sponsor has an available CDS price reported by Markit. Fund Business represents the proportion of the fund sponsor’s mutual fund assets under management that are not in money market mutual funds as at August 2008. Absolute value of z statistics are in parentheses. * indicates statistical significance at the 10% threshold; ** indicates statistical significance at the 5% threshold; and *** indicates statistical significance at the 1% threshold. US Dollar Euro CNAV 1.483 1.503 0.797 0.756 (3.06)*** (3.16)*** (1.10) (1.06) Institutional 1.384 1.521 1.029 1.047 (5.96)*** (6.65)*** (3.79)*** (3.78)*** Ln (Fund Size) -0.083 -0.040 0.073 0.067 (2.10)** (1.06) (2.59)*** (2.38)** Crisis 0.762 0.669 -0.271 -0.278 (2.61)*** (2.33)** (1.62) (1.66)* CNAV * Crisis 0.846 0.902 1.961 1.976 (2.76)*** (2.98)*** (6.02)*** (6.07)*** Guarantee Date 1.184 1.205 0.498 0.504 (7.15)*** (7.49)*** (5.46)*** (5.56)*** CNAV * Guarantee Date -0.091 -0.105 0.232 0.217 (0.49) (0.58) (1.10) (1.03) US * CNAV * Guarantee Date -0.496 -0.537 (3.56)*** (3.90)*** Post Guarantee 0.346 0.384 1.412 1.380 (1.71)* (1.95)* (10.21)*** (10.05)*** CNAV * Post Guarantee 0.282 0.221 0.126 0.130 (1.66)* (1.34) (0.69) (0.71) LIBOR-OIS Change 0.935 0.857 1.065 1.015 (2.13)** (2.02)** (3.04)*** (2.91)*** CNAV * LIBOR-OIS Change -0.426 -0.278 -2.586 -2.535 (0.89) (0.60) (2.17)** (2.12)** Fund Business -1.561 -0.526 (1.55) (1.23) CNAV * Fund Business -0.174 -0.598 (0.16) (0.41) Non-Fund Business -0.989 0.509 (1.99)** (1.74)* CNAV * Non-fund Business 0.968 0.591 (1.74)* (0.56) Constant -6.522 -7.468 -9.191 -8.632 (6.97)*** (8.42)*** (7.89)*** (8.06)*** Country dummy variables YES YES YES YES Year dummy variables YES YES YES YES Observations 212,699 222,785 379,703 385,525 Number of funds 277 290 455 466
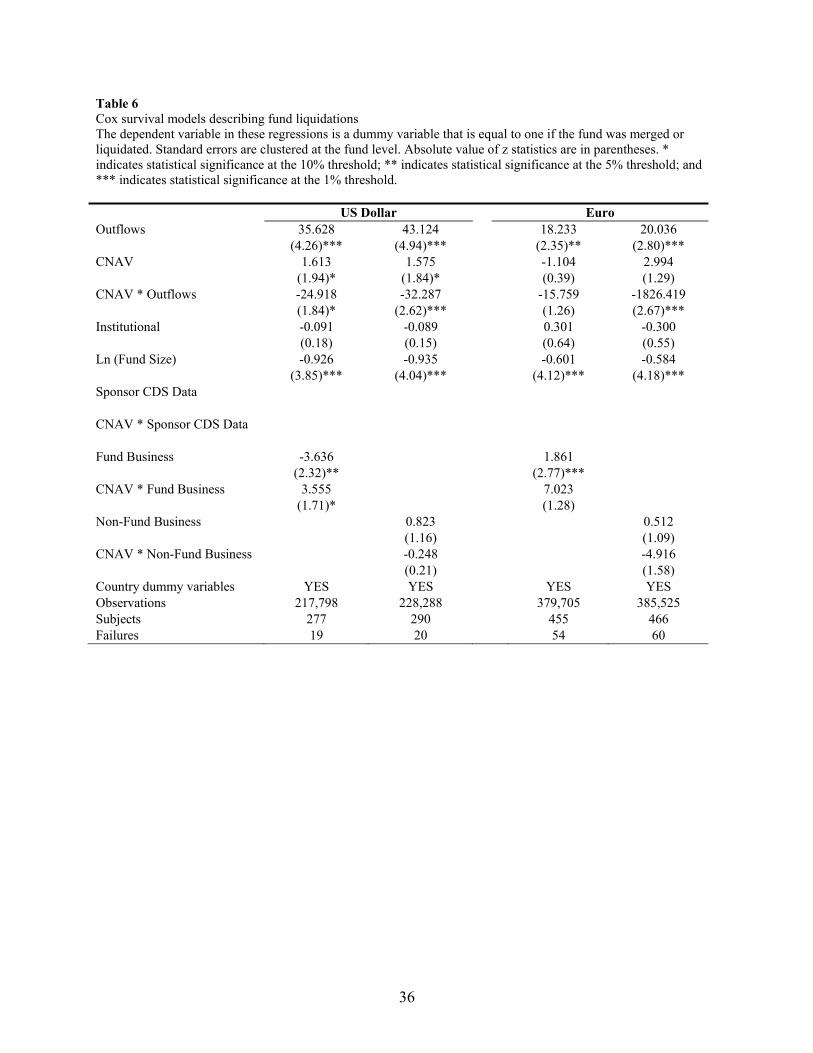
36
Table 6 Cox survival models describing fund liquidations The dependent variable in these regressions is a dummy variable that is equal to one if the fund was merged or liquidated. Standard errors are clustered at the fund level. Absolute value of z statistics are in parentheses. * indicates statistical significance at the 10% threshold; ** indicates statistical significance at the 5% threshold; and *** indicates statistical significance at the 1% threshold. US Dollar Euro Outflows 35.628 43.124 18.233 20.036 (4.26)*** (4.94)*** (2.35)** (2.80)*** CNAV 1.613 1.575 -1.104 2.994 (1.94)* (1.84)* (0.39) (1.29) CNAV * Outflows -24.918 -32.287 -15.759 -1826.419 (1.84)* (2.62)*** (1.26) (2.67)*** Institutional -0.091 -0.089 0.301 -0.300 (0.18) (0.15) (0.64) (0.55) Ln (Fund Size) -0.926 -0.935 -0.601 -0.584 (3.85)*** (4.04)*** (4.12)*** (4.18)*** Sponsor CDS Data CNAV * Sponsor CDS Data Fund Business -3.636 1.861 (2.32)** (2.77)*** CNAV * Fund Business 3.555 7.023 (1.71)* (1.28) Non-Fund Business 0.823 0.512 (1.16) (1.09) CNAV * Non-Fund Business -0.248 -4.916 (0.21) (1.58) Country dummy variables YES YES YES YES Observations 217,798 228,288 379,705 385,525 Subjects 277 290 455 466 Failures 19 20 54 60
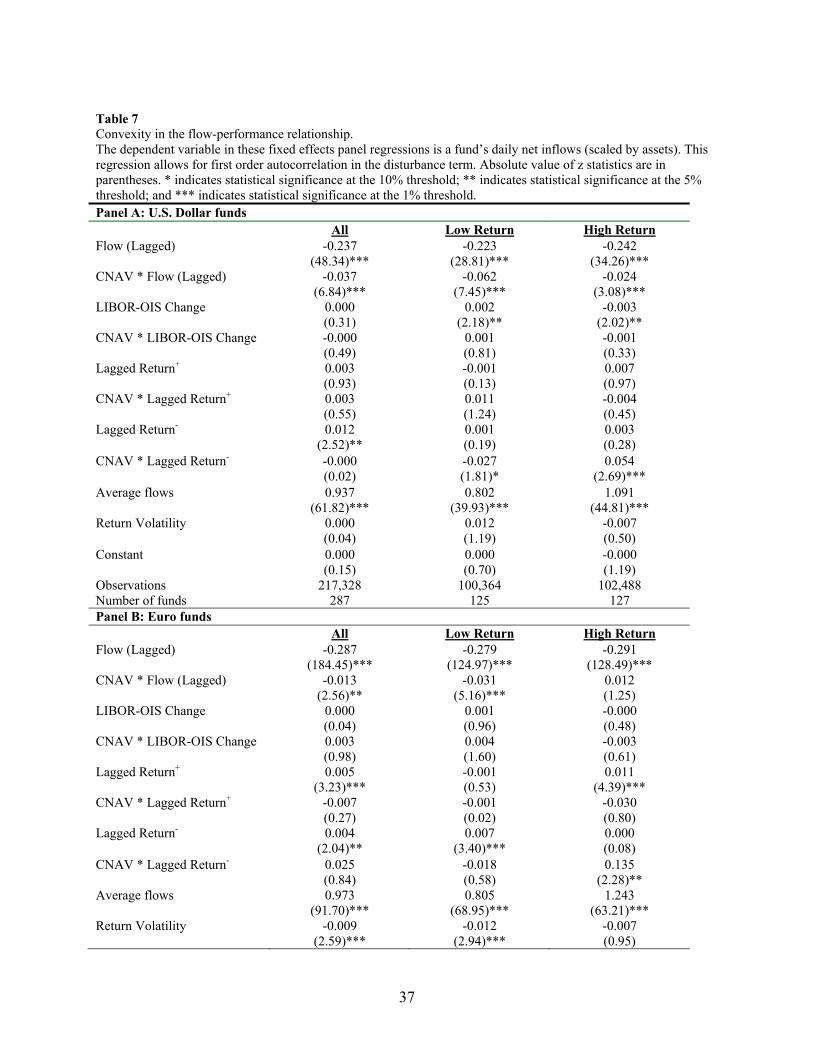
37
Table 7 Convexity in the flow-performance relationship. The dependent variable in these fixed effects panel regressions is a fund’s daily net inflows (scaled by assets). This regression allows for first order autocorrelation in the disturbance term. Absolute value of z statistics are in parentheses. * indicates statistical significance at the 10% threshold; ** indicates statistical significance at the 5% threshold; and *** indicates statistical significance at the 1% threshold. Panel A: U.S. Dollar funds All Low Return High Return Flow (Lagged) -0.237 -0.223 -0.242 (48.34)*** (28.81)*** (34.26)*** CNAV * Flow (Lagged) -0.037 -0.062 -0.024 (6.84)*** (7.45)*** (3.08)*** LIBOR-OIS Change 0.000 0.002 -0.003 (0.31) (2.18)** (2.02)** CNAV * LIBOR-OIS Change -0.000 0.001 -0.001 (0.49) (0.81) (0.33) Lagged Return+ 0.003 -0.001 0.007 (0.93) (0.13) (0.97) CNAV * Lagged Return+ 0.003 0.011 -0.004 (0.55) (1.24) (0.45) Lagged Return- 0.012 0.001 0.003 (2.52)** (0.19) (0.28) CNAV * Lagged Return- -0.000 -0.027 0.054 (0.02) (1.81)* (2.69)*** Average flows 0.937 0.802 1.091 (61.82)*** (39.93)*** (44.81)*** Return Volatility 0.000 0.012 -0.007 (0.04) (1.19) (0.50) Constant 0.000 0.000 -0.000 (0.15) (0.70) (1.19) Observations 217,328 100,364 102,488 Number of funds 287 125 127 Panel B: Euro funds All Low Return High Return Flow (Lagged) -0.287 -0.279 -0.291 (184.45)*** (124.97)*** (128.49)*** CNAV * Flow (Lagged) -0.013 -0.031 0.012 (2.56)** (5.16)*** (1.25) LIBOR-OIS Change 0.000 0.001 -0.000 (0.04) (0.96) (0.48) CNAV * LIBOR-OIS Change 0.003 0.004 -0.003 (0.98) (1.60) (0.61) Lagged Return+ 0.005 -0.001 0.011 (3.23)*** (0.53) (4.39)*** CNAV * Lagged Return+ -0.007 -0.001 -0.030 (0.27) (0.02) (0.80) Lagged Return- 0.004 0.007 0.000 (2.04)** (3.40)*** (0.08) CNAV * Lagged Return- 0.025 -0.018 0.135 (0.84) (0.58) (2.28)** Average flows 0.973 0.805 1.243 (91.70)*** (68.95)*** (63.21)*** Return Volatility -0.009 -0.012 -0.007 (2.59)*** (2.94)*** (0.95)

38
Constant -0.000 -0.000 0.000 (2.43)** (2.04)** (0.45) Observations 405,471 212,029 183,316 Number of funds 468 217 218
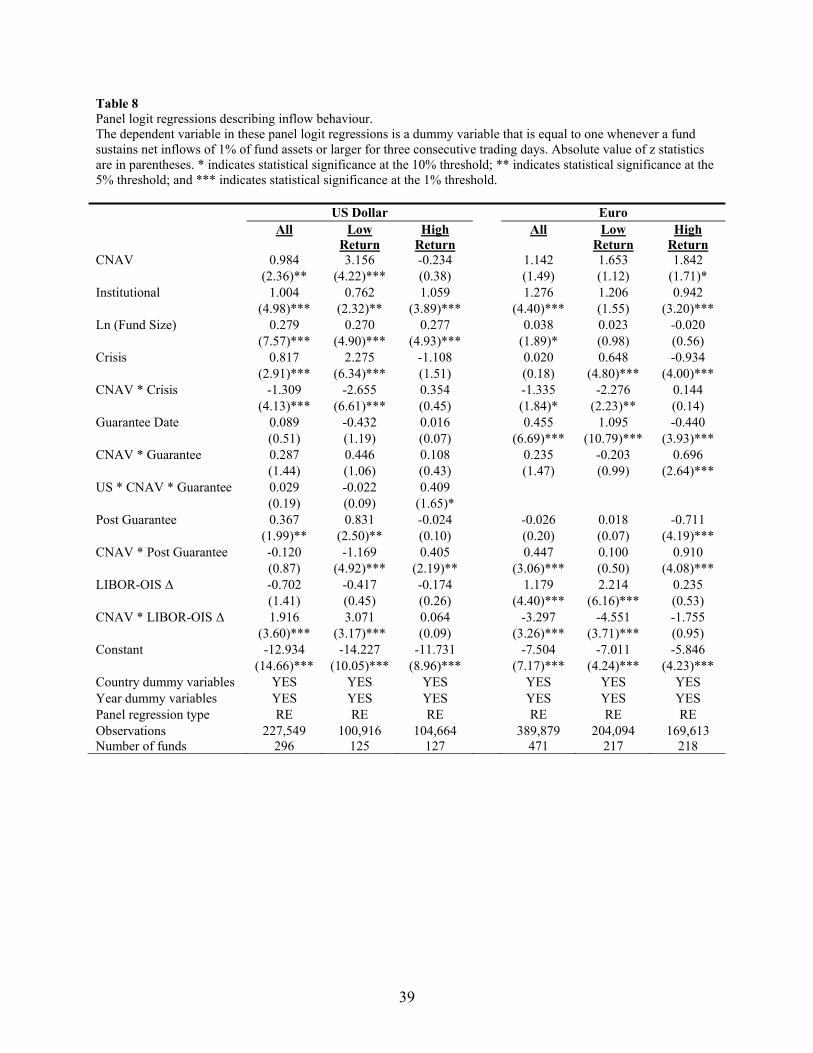
39
Table 8 Panel logit regressions describing inflow behaviour. The dependent variable in these panel logit regressions is a dummy variable that is equal to one whenever a fund sustains net inflows of 1% of fund assets or larger for three consecutive trading days. Absolute value of z statistics are in parentheses. * indicates statistical significance at the 10% threshold; ** indicates statistical significance at the 5% threshold; and *** indicates statistical significance at the 1% threshold. US Dollar Euro All Low
Return High
Return All Low
Return High
Return CNAV 0.984 3.156 -0.234 1.142 1.653 1.842 (2.36)** (4.22)*** (0.38) (1.49) (1.12) (1.71)* Institutional 1.004 0.762 1.059 1.276 1.206 0.942 (4.98)*** (2.32)** (3.89)*** (4.40)*** (1.55) (3.20)*** Ln (Fund Size) 0.279 0.270 0.277 0.038 0.023 -0.020 (7.57)*** (4.90)*** (4.93)*** (1.89)* (0.98) (0.56) Crisis 0.817 2.275 -1.108 0.020 0.648 -0.934 (2.91)*** (6.34)*** (1.51) (0.18) (4.80)*** (4.00)*** CNAV * Crisis -1.309 -2.655 0.354 -1.335 -2.276 0.144 (4.13)*** (6.61)*** (0.45) (1.84)* (2.23)** (0.14) Guarantee Date 0.089 -0.432 0.016 0.455 1.095 -0.440 (0.51) (1.19) (0.07) (6.69)*** (10.79)*** (3.93)*** CNAV * Guarantee 0.287 0.446 0.108 0.235 -0.203 0.696 (1.44) (1.06) (0.43) (1.47) (0.99) (2.64)*** US * CNAV * Guarantee 0.029 -0.022 0.409 (0.19) (0.09) (1.65)* Post Guarantee 0.367 0.831 -0.024 -0.026 0.018 -0.711 (1.99)** (2.50)** (0.10) (0.20) (0.07) (4.19)*** CNAV * Post Guarantee -0.120 -1.169 0.405 0.447 0.100 0.910 (0.87) (4.92)*** (2.19)** (3.06)*** (0.50) (4.08)*** LIBOR-OIS Δ -0.702 -0.417 -0.174 1.179 2.214 0.235 (1.41) (0.45) (0.26) (4.40)*** (6.16)*** (0.53) CNAV * LIBOR-OIS Δ 1.916 3.071 0.064 -3.297 -4.551 -1.755 (3.60)*** (3.17)*** (0.09) (3.26)*** (3.71)*** (0.95) Constant -12.934 -14.227 -11.731 -7.504 -7.011 -5.846 (14.66)*** (10.05)*** (8.96)*** (7.17)*** (4.24)*** (4.23)*** Country dummy variables YES YES YES YES YES YES Year dummy variables YES YES YES YES YES YES Panel regression type RE RE RE RE RE RE Observations 227,549 100,916 104,664 389,879 204,094 169,613 Number of funds 296 125 127 471 217 218
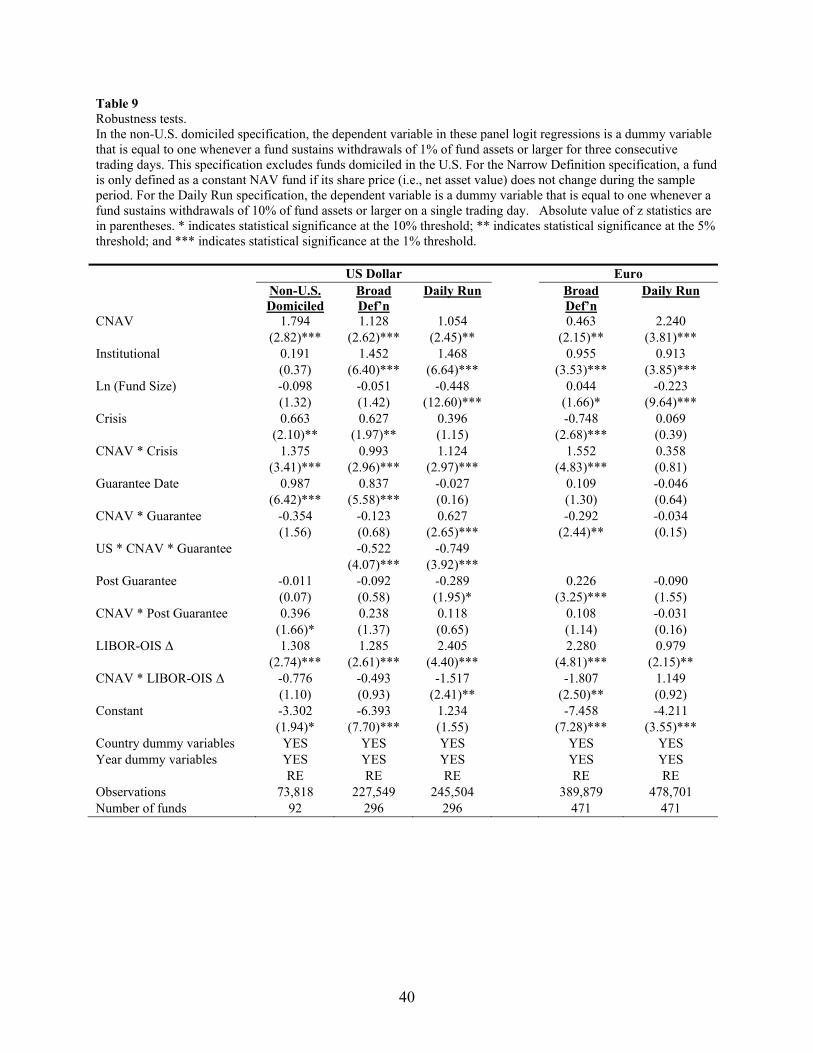
40
Table 9 Robustness tests. In the non-U.S. domiciled specification, the dependent variable in these panel logit regressions is a dummy variable that is equal to one whenever a fund sustains withdrawals of 1% of fund assets or larger for three consecutive trading days. This specification excludes funds domiciled in the U.S. For the Narrow Definition specification, a fund is only defined as a constant NAV fund if its share price (i.e., net asset value) does not change during the sample period. For the Daily Run specification, the dependent variable is a dummy variable that is equal to one whenever a fund sustains withdrawals of 10% of fund assets or larger on a single trading day. Absolute value of z statistics are in parentheses. * indicates statistical significance at the 10% threshold; ** indicates statistical significance at the 5% threshold; and *** indicates statistical significance at the 1% threshold. US Dollar Euro Non-U.S.
Domiciled Broad Def’n
Daily Run Broad Def’n
Daily Run
CNAV 1.794 1.128 1.054 0.463 2.240 (2.82)*** (2.62)*** (2.45)** (2.15)** (3.81)*** Institutional 0.191 1.452 1.468 0.955 0.913 (0.37) (6.40)*** (6.64)*** (3.53)*** (3.85)*** Ln (Fund Size) -0.098 -0.051 -0.448 0.044 -0.223 (1.32) (1.42) (12.60)*** (1.66)* (9.64)*** Crisis 0.663 0.627 0.396 -0.748 0.069 (2.10)** (1.97)** (1.15) (2.68)*** (0.39) CNAV * Crisis 1.375 0.993 1.124 1.552 0.358 (3.41)*** (2.96)*** (2.97)*** (4.83)*** (0.81) Guarantee Date 0.987 0.837 -0.027 0.109 -0.046 (6.42)*** (5.58)*** (0.16) (1.30) (0.64) CNAV * Guarantee -0.354 -0.123 0.627 -0.292 -0.034 (1.56) (0.68) (2.65)*** (2.44)** (0.15) US * CNAV * Guarantee -0.522 -0.749 (4.07)*** (3.92)*** Post Guarantee -0.011 -0.092 -0.289 0.226 -0.090 (0.07) (0.58) (1.95)* (3.25)*** (1.55) CNAV * Post Guarantee 0.396 0.238 0.118 0.108 -0.031 (1.66)* (1.37) (0.65) (1.14) (0.16) LIBOR-OIS Δ 1.308 1.285 2.405 2.280 0.979 (2.74)*** (2.61)*** (4.40)*** (4.81)*** (2.15)** CNAV * LIBOR-OIS Δ -0.776 -0.493 -1.517 -1.807 1.149 (1.10) (0.93) (2.41)** (2.50)** (0.92) Constant -3.302 -6.393 1.234 -7.458 -4.211 (1.94)* (7.70)*** (1.55) (7.28)*** (3.55)*** Country dummy variables YES YES YES YES YES Year dummy variables YES YES YES YES YES RE RE RE RE RE Observations 73,818 227,549 245,504 389,879 478,701 Number of funds 92 296 296 471 471
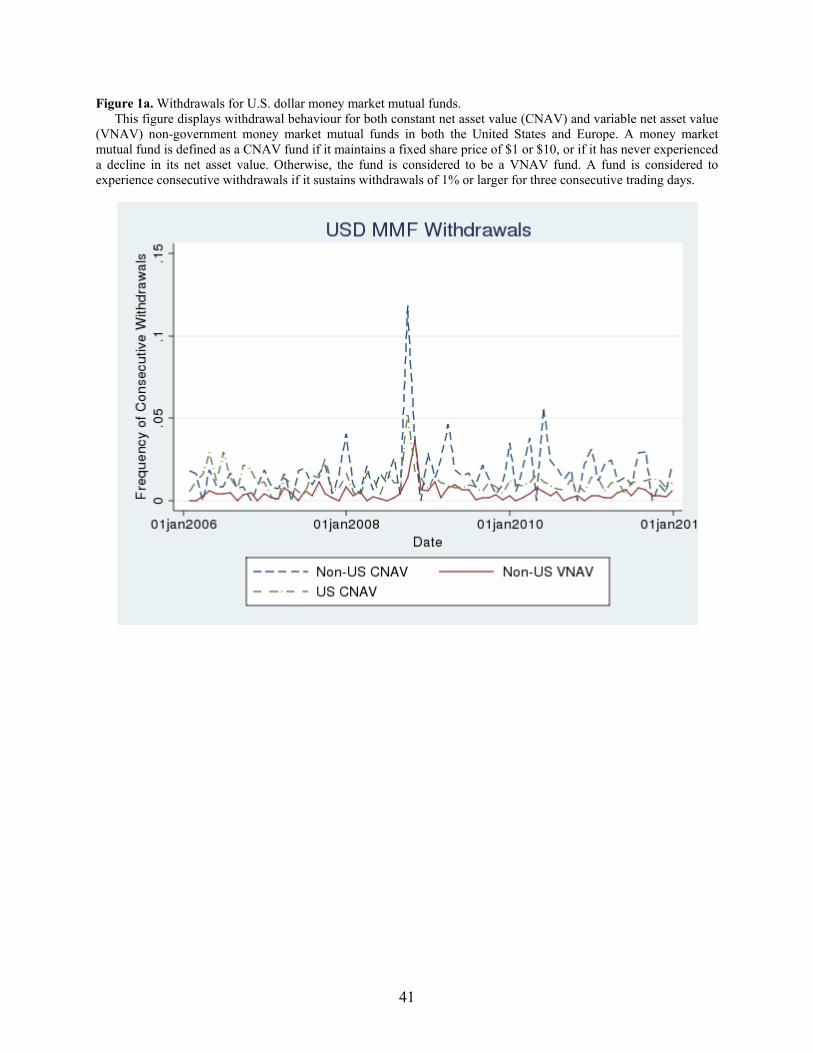
41
Figure 1a. Withdrawals for U.S. dollar money market mutual funds. This figure displays withdrawal behaviour for both constant net asset value (CNAV) and variable net asset value
(VNAV) non-government money market mutual funds in both the United States and Europe. A money market mutual fund is defined as a CNAV fund if it maintains a fixed share price of $1 or $10, or if it has never experienced a decline in its net asset value. Otherwise, the fund is considered to be a VNAV fund. A fund is considered to experience consecutive withdrawals if it sustains withdrawals of 1% or larger for three consecutive trading days.
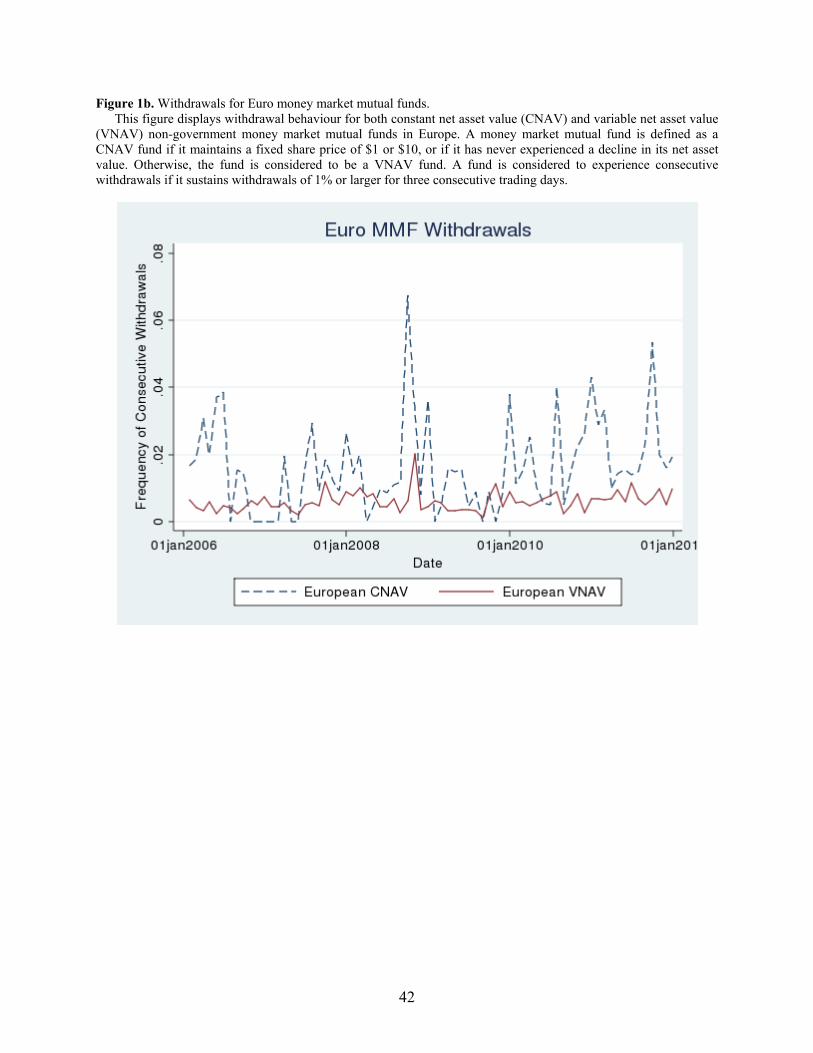
42
Figure 1b. Withdrawals for Euro money market mutual funds. This figure displays withdrawal behaviour for both constant net asset value (CNAV) and variable net asset value
(VNAV) non-government money market mutual funds in Europe. A money market mutual fund is defined as a CNAV fund if it maintains a fixed share price of $1 or $10, or if it has never experienced a decline in its net asset value. Otherwise, the fund is considered to be a VNAV fund. A fund is considered to experience consecutive withdrawals if it sustains withdrawals of 1% or larger for three consecutive trading days.