Embed Size (px)
Citation preview

Does Sick Pay Affect Workplace Absence?
Alex Bryson Harald Dale-Olsen
Department of Quantitative Social Science
Working Paper No. 17-12
November 2017

Disclaimer
Any opinions expressed here are those of the author(s) and not those of the UCL Institute of Education. Research published in this series may include views on policy, but the institute itself takes no institutional policy positions. DoQSS Workings Papers often represent preliminary work and are circulated to encourage discussion. Citation of such a paper should account for its provisional character. A revised version may be available directly from the author. Department of Quantitative Social Science, UCL Institute of Education, University College London,
20 Bedford Way, London WC1H 0AL, UK

3
Does Sick Pay Affect Workplace Absence? Alex Bryson1 and Harald Dale-Olsen2
Abstract
Higher replacement rates often imply higher levels of absenteeism, yet even in generous welfare economies, private sick pay is provided in addition to the public sick pay. Why? Using comparative workplace data for the UK and Norway we show that the higher level of absenteeism in Norway compared to UK is related to the threshold in the Norwegian public sick pay legislation. This threshold’s importance is confirmed in a Regression Kinked Design (RKD) analysis on the Norwegian micro-data. Private sick pay is provided as an employer-provided non-wage benefit and when training costs are high. JEL codes: H31, J22, J28, J32 Keywords: Absenteeism, Public sick pay, Private sick pay, Comparative
Contact Details: Alex Bryson ([email protected]), University College London, National
Institute of Social and Economic Research and Institute for the Study of Labor
Acknowledgement: We thank participants at the COPE2017-workshop in Zurich and at the IZA Workshop on
Health and the Labor Market in Bonn 2017 for fruitful discussions and helpful suggestions. We thank the
Norwegian Research Council for funding (grant No. 202647 and No. 227117). Alex Bryson thanks the sponsors
of the Workplace Employment Relations Survey 2011 (Department for Business Innovation and Skills, Acas,
ESRC and NIESR) and the UK Data Archive for access to the WERS data. Corresponding author: Harald Dale-
Olsen, hdo @socialresearch.no.
1 University College London, National Institute of Social and Economic Research and Institute for the Study of
Labor 2 Institute for Social Research, Oslo

4
1. Introduction
Absenteeism can be expensive to employers when they must pay for non-productive
labour and where it disrupts the production of other workers. Absenteeism is also a
concern in redistributive welfare regimes with generous public sick pay. Since public
sick pay constitutes insurance against income loss from sickness absence, and moral
hazard is a common problem in insurance, the danger of moral hazard is greater under
public sick pay than when the cost of sick leave is covered to a larger extent by the
individual worker.3 When the sick pay system is not so generous, as in the U.S. or UK,
the cost of presenteeism is often a greater concern (Goetzel et al., 2004; Hemp,
2004).4
In this paper, we study how absenteeism relates to employer-provided sick pay
and publicly provided sick pay, thus shedding light on how societies deal with the costs
associated with absenteeism and presenteeism. The consensus is that economic
incentives affect absenteeism. Analyses of reforms of the public sick pay legislation in
several countries reveal that absenteeism and replacement rates are positively related
(Johansson and Palme, 1996; Johansson and Palme, 2002; Henrekson and Persson,
2004; Ziebarth and Karlsson, 2010; Ziebarth, 2013; Csillag, 2017). Similarly, when
public or private incentives increase returns to working absenteeism drops (Barmby et
al., 1995; Brown et al., 1999; Dale-Olsen, 2012, 2013b). However, several studies
identify heterogeneous effects (Ziebarth, 2013; Ziebarth and Karlsson, 2013), where
certain worker groups are unaffected by financial incentives. One hypothesis is that
such heterogeneous effects are partially the result of offsetting private pay schemes
and sick pay schemes.
Our contribution is two-fold. First, we establish the role played by the public sick
pay compensation regime by comparing sickness absence in Britain and Norway,
3 In Norway, for example, public sick pay constitutes 1.5% of GDP (The government budget, 2010). See (http://www.statsbudsjettet.dep.no/upload/Statsbudsjett_2010/dokumenter/pdf/summary_ national%20_budget_2010.pdf). Even in the UK where the sick pay system is less generous, the direct cost of sick pay was £11.6 billion in 2003 (Barham and Begum, 2005). The European sickness absence insurance schemes are quite similar to the US temporary disability insurance, and temporary disability insurance benefits amounted in California in 2005 to $4.2 billion, just slightly less than the amount spent on unemployment insurance (Ziebarth and Karlsson, 2010). 4 Regardless of system, sick pay can provide sick workers with incentives to take time off to stop the spread of illness (Skatun, 2003). Thus absenteeism and presenteeism are associated with costs, and firms and the society should be concerned about the relative costs and benefits of sick pay. Treble and Barmby (2011) discuss this is detail. The human capital health-model of Grossman (1972) ignores the moral hazard issue in absenteeism, but instead presents health as an investment object such as education. In a recent paper, Pichler and Ziebarth (2016) merge absenteeism and presenteeism modelling to present a unified strategy analysing sick leave behaviour.

5
identifying effects using distinctive features in the Norwegian “kink” in compensation
that occurs at a point in the earnings distribution. In this sense, our paper is similar in
design to the regression kink design of Böckerman et al. (2014) who identify a strong
behavioural absence response from a kink in the Finnish sick pay legislation, implying
an elasticity of the duration of sickness absence with respect to the replacement rate
in the order of 1.4.5 Like Böckerman et al. (2014) we use worker-level data to establish
worker responses to the kink. But an important difference is that our study also
compares the difference this kink makes to a scenario – Britain – where no such kink
exists, using micro workplace data that also nets out heterogeneity across workplaces.
Second, we investigate the factors associated with employer-provided
supplementation to the public sick pay compensation system. Barmby et al. (2002)
show that in many countries public sick pay legislation is supplemented by additional
privately funded sick pay, as might occur if employers use such pay to attract and retain
valuable workers. However, with few exceptions (Barmby, 2002; Dale-Olsen, 2013b),
there is little empirical evidence regarding the interaction between public and private
sick pay.
As discussed by Treble and Barmby (2011), firms provide non-pecuniary goods
such as private sick insurance (sick pay) and set wages to maximize profits, and do
this while taking into account several different dimensions of labour costs, absence
costs being one dimension. Training costs and turnover costs could be other relevant
dimensions.6 Trade unions might also bargain for private sick insurance if this non-
pecuniary good is highly valued by union members.
The motivation for comparing sick pay regimes in Norway and Britain is two-fold.
First, they are polar opposites in terms of redistribution and welfare regimes, as
characterised by typologies such as Esping-Andersen’s (1990) (he differentiated
between the U.S. and Sweden), creating potentially quite different incentives for firms
to offer sick pay compensation, and for workers to take absence. Second, and relatedly,
these countries are quite different when it comes to absence levels: Norway has among
the highest absence rates in Europe, whereas Britain is among those with the lowest
rates (OECD, 2010; Gimeno et al., 2004). Others who have conducted cross-country
5 Following a reform of German statutory sick pay Ziebarth and Karlsson (2013) identify (based on SOEP data), that the elasticity of sickness absence w.r.t. the benefit level is around 0.9, a response which is somewhat weaker than that found by Böckerman et al. for Finland. 6 See appendix for a simple shirking-model incorporating turnover costs. See also note 2.
6
studies have suggested such differences relate to sick pay systems, rather than
differences in employment protection legislation (Frick and Malo, 2008).
The structure of the paper is as follows: In Section 2 we describe the sick pay
legislation in the UK and Norway. The econometric strategy is described in Section 3.
Data is described in Section 4. Our empirical findings are presented in Section 5, while
Section 6 concludes.
2. The sick pay legislation and privately supplementary sick pay
The British public sick pay legislation (Statutory Sick Pay (SSP)) is relatively simple:
each worker receives £81.60 per week for 28 weeks for sickness absence (2011
figures), a figure close to the minimum wage. The first three days of sick leave are
“qualifying days” with no pay. Norwegian public sick pay, on the other hand, provides
from day 1 for up to one year’s full compensation for annual pay up to what is defined
as 6G, where G is the baseline figure in the Social Service benefit system (1G is
equivalent to £8685).7 For pay above this threshold, only 6G is paid in public sick pay.
As such the Norwegian sick pay legislation is comparable to the Finnish system: both
are kinked (the Finns have more than one kink) (Böckerman et al., 2014).
[ FIGURE 1 AROUND HERE ]
Both in the UK and Norway employers are free to offer top-up publicly provided sick
pay compensation. In 2003 40% of the Norwegian private sector workplaces offered
additional compensation for those above the threshold (Dale-Olsen, 2012). The
employer-provision of top-up sick pay compensation is seen in other countries as well
(Barmby et al., 2002). In the UK and Norway a worker usually needs a physician to
certify his or her illness after a designated number of sick leave days. In the UK, this
occurs after 7 days, in Norway this is usually after 3 consecutive absence days. In
Norway employees are limited to four self-declared spells per annum after which all
absences (regardless of longevity) have to be physician-certified. A minority of firms
allow longer and more periods.
7 All money values in the paper are based on 2011 pounds (PPP-adjusted), where 1£=9.032 Norwegian krones (NOK)).

7
During the period under study UK SSP was paid by the employers, but due to a
Percentage Threshold Scheme (PTS) employers could recover SSP costs for their
employees’ sick leave if the total SSP paid in a tax month exceeded 13 percent of the
employer’s (Class 1) National Insurance contribution in the same month. In 2014 the
PTS was replaced with programs aimed at individuals and not employers, including Fit
to Work, an occupational health advisory service, which aims to provide advice for
managing absence and improve return-to-work rates, but does not provide financial
support. In Norway, the first 16 days of the absence spell are covered or paid by the
employer. The remaining spell is covered by the public authorities (limited upwards to
the 6G-threshold).
3. Empirical strategy
We apply three empirical strategies in this paper; two establish how absenteeism is
affected by sick pay, and one targets the provision of private sick pay (above the
statutory limit).
First, to study how the employer provision of sick pay is related to training costs,
other work organization measures, non-wage benefits, work characteristics and unions,
we estimate simple Spearman bivariate correlations, but also apply simple linear
probability (regressions) models to study how these workplace conditions vary
between countries and across the levels of the statutory sick pay. By doing this, we
map out the similarities and differences between the UK and Norway in the employer
provision of sick pay.
Second, to identify the role played by public sick pay provision we exploit
differences in public sick pay provision across Norway and Britain. As described in
Section 2 the Norwegian public sick pay system is kinked: full compensation occurs
until the earnings threshold of 6G, thereafter no further earnings increase the sick pay.
Since no such kink exists in Great Britain, the empirical strategy of directly comparing
the relationship between absenteeism and pay between Norway and Great Britain
under and above the Norwegian threshold should provide insight into how sick pay
affects absenteeism.
Let a denote the workplace sick leave rate. The sick leave rate is highly non-
normally distributed, thus we use the logit-transform to normalise our dependent
variable (i.e., ln[a/(1-a)]). Then we apply simple difference-in-difference OLS

8
regressions of this transformed workplace sickness rate on the workplace average of
log hourly wage and interactions with a country dummy and a dummy for pay above
the threshold and other controls.
6) Ln[𝑎
1−𝑎]f=α1Norwayf+α2lnwf+α3lnw(>6G)f+ α4lnwXNorwayf +α5lnw(>
6G)XNorwayf+X’b+εf,
where X’b is a vector of controls (which we vary in sensitivity tests), and ε expresses a
standard error term. Note that due to the logit transformation, to derive the average
elasticity of absence rate w.r.t. wages in these regressions, one has to multiply the
estimated variable by the average (1-a).
First, we expect the UK to experience lower sick leave rates than Norway, at
least partly because of the less generous sick pay legislation (and thus in accordance
with Frick and Malo (2008) and those studies revealing a positive relationship between
absence rates and replacement rates). Second, we expect to see less or no impact
from wages in Norway under the 6G-threshold relative to the impact observed in the
UK, but for workers earning above the 6G-limit behaviour should be similar in the two
countries since the replacement rate falls for Norwegian workers above this threshold.
In Norway we should see that absenteeism becomes more negatively related to wages
compared to those workers earning under the 6G-threshold. Our analyses take into
account employer-provided sick pay, other benefits and pay systems.
Finally, since Norwegian sick pay is kinked, we can apply a regression kink
design a la Böckerman et al. (2014) where, in contrast to previous studies, we can take
into account employer-provided sick pay and self-declared absences. Thus, we can
identify a causal impact of sick pay compensation on absenteeism by comparing the
sick leave behaviour of workers located below and above the threshold. The regression
kink design is established by the work of Card et al. (2015, 2016) and of Cattaneo and
co-authors in a series of studies (Cattaneo et al., (2014, 2015, 2016)). The literature
referred to in Section 1 and as pointed out in the theoretical model presented in the
Appendix means we have good reasons to believe that any negative relationship
between sick leave days and earnings is weak below the public sick pay threshold,
since for these workers the replacement rate is 100 percent and the monitoring

9
intensity low. In the KRD-approach, one identifies the changes in the slope of the
outcome variable, i.e., sick days, below and above the kink, and divides this by
changes in the slope of the running variable, i.e., sick pay. To illustrate, let SD and lnE
denote sick days and log yearly earnings, let lnG denote the log of the 6G-threshold
(in yearly terms), and D expresses a dummy taking the value of 1 if earnings are above
the kink. Then one estimates:
7) SDi= α0+α1(lnE-lnG)i+α2(lnE-lnG)i*Di + …. +μi,
on a data-determined interval around the kink. The estimate for α2 then identifies the
impact of the slope of sick days. Let B now denote the sick pay. Note that below the
kink, B increases with E at a rate of 1. Above the kink, B does not change with W, i.e.,
this slope changes by -1.
We follow and apply the methods of Cattaneo et al. (2014, 2015, 2016)) in
identifying the appropriate bandwidth, and apply local linear regression estimation.
Two assumptions are essential for the KRD-analysis to be valid. First, the replacement
rate function has to be continuous and differentiable, but non-differentiable at the kink
with unequal left and right derivatives. The Norwegian system, with the clearly defined
kink at 6G, satisfies this condition. Second, the allocation of observations around the
kink should be as good as random, i.e., endogenous bunching of observations around
the kink (creating discontinuities in the derivative of the density function) would
invalidate the analysis. We test this by running the analyses on other outcome
variables and showing that the kink only affects sickness absence, and then by
applying the automatic manipulation tests based on density discontinuity, constructed
using the results for local polynomial density estimators by Cattaneo et al. (2017). As
further robustness tests, we test out different placebo-kinks, by letting the kink-point
vary.
5. Data
Our data are the British Workplace Employment Relations Survey 2011 (WERS 2011)
and the Norwegian Workplace Employment Relations Survey 2012 (NWERS 2012)
supplemented by Norwegian population-wide register data (for the period 2000-2012).
Although WERS (NWERS) covers workplaces with at least 5(10) employees in all

10
sectors of the British (Norwegian) economy, we confine our analyses to the private
sector workplaces with at least 10 employees where the market setting means the
profit-maximising assumptions invoked earlier are most likely to hold. Information in
WERS was acquired through face-to-face interviews, which were conducted with the
manager at the workplace responsible for employment relations. The response rate in
2011 was 46%. Information in NWERS was acquired through computer-assisted tele-
phone interviews, which were conducted with the daily manager at the workplace or
the manager responsible for employment relations. The response rate was 54%, but
since the main reason for non-response was respondents not being reached by
Statistics Norway (36 percentage points) and not by respondents refusing to participate,
selection issues are unlikely to be a problem.8 WERS is documented in van Wanrooy
et al. (2013), while NWERS is documented in Holmøy (2013).
The British WERS survey comprises information on absenteeism at the
workplace level, while wage information is available at the worker level (and
aggregated to workplace). Absenteeism is measured as the total number of days
during the last 12 months that workers were absent due to illness, and is measured
relative to the number of workers. In addition, WERS contains information on a range
of organisational practices, risks, injuries, additional sick pay and pay systems. The
Norwegian WERS comprises similar data on organisational issues, pay systems, risk
and self-certified absence rates. Absenteeism is measured as the total number of days
during the last 12 months that workers were absent due to illness (regardless whether
this was self-certified or physician-certified), and is measured relative to the number of
worker-days. Note that physician-certified sick spells in Norway might be partial, e.g.
20 or 50 percent on sick leave. We take this into account by creating two measures;
one measure based on the observed absence days, and one measure where we
weight the absence days by how partial the absence is. For example, 1 day on 100
percent sick leave is equal to 2 days on 50 percent sick leave.
All money values in the comparative analyses are 2011 pounds (PPP-adjusted)
(1£=9.032 Norwegian krones(NOK)). We pool the Norwegian and British workplace
level data, and create an absence measure transformed to normality, the logit of the
8 In NWERS 12.7 percent of the issued sample refused to participate. In both NWERS and WERS detectable
response biases were corrected using sampling weights.

11
sick leave rate, similarly to what is done previously in the literature on absenteeism
(Heywood and Jirjahn, 2004).
However, wages and physician-certified sick leave in Norway are collected from
the public administrative registers at the worker level (or actually job level), thus
allowing analyses of individual behaviour. While the comparative analyses rest on a
retrospective absence measure (absence last 12 month), to identify causal impact of
pay (and sick pay) on sick leave, the outcome (sick leave days) should be measured
after the causing factor (pay/sick pay). The KRD-analyses therefore rest on a sample
of workers not absent in 2011, but employed in 2011 and 2012 in a workplace with
more than 10 employees, earning between 3G and 10G. A sub-sample of these
workers constitutes those employed by the NWERS-workplaces. We measure the
running variable as: log (earnings) -log (6G), where earnings and 6G express total
earnings (including overtime and bonuses) in 2011 and 6G the threshold in the public
sick pay legislation. The number of physician-certified sick leave days is then
measured from May 1st, 2012 to May 1st, 2013.
6. Results
6.1 Descriptive aggregate evidence
We start by looking at aggregate statistics. In Table 1 we present figures for private
sector workplaces with more than 10 employees in the Great Britain and Norway. The
first and obvious finding is that the sick leave rate is considerably higher in Norway
than in Great Britain.
[ TABLE 1 AROUND HERE ]
[ FIGURE 2 AROUND HERE ]
Employer-provided sick pay is equally prevalent in Norway as in Britain (48%
vs. 44%), but distributed quite differently as expected due to the kink in the Norwegian
sick pay scheme. High wage workplaces (defined as workplaces with an average wage
above 6G (=52110£), comprise 30% and 37% of the workplaces in Norway and Britain,
respectively. Close to 45 percent of the Norwegian workplaces providing additional
private sick pay have mean earnings above 6G, compared with fewer than 20 percent

12
of the workplaces with mean earnings above 6G. In Britain, the percentage of
workplaces offering sick pay above the statutory minimum is similar above and below
the 6G threshold (36% vs. 39%), since no kink in public provision exists at this (or,
indeed any other) point in the earnings distribution.
Note that employer-provided supplementary sick pay is only relevant for a
minority of the Norwegian workers employed by those employers who provide
supplementary sick pay (those earning above 6G)9, it is potentially relevant for all
British workers employed at similar workplaces since statutory sick pay is so low in
Britain. It is also evident that the non-wage benefits such as supplementary sick pay
are bundled together with other health-related non-wage benefits such as extended
sick leave in the UK and to a certain degree, the provision of private health insurance.
This is not the case in Norway. Two other aspects are worth considering. First, both in
the UK and Norway, employers are more likely to offer sick pay above the statutory
minimum where it takes longer for new workers to be trained in their jobs. This indicates
that training costs could be important for the provision of sick pay in excess of the
statutory minimum. Second, sick pay in excess of the statutory minimum is positively
associated with trade union coverage in Britain but not in Norway. Since sick pay in
excess of the statutory minimum is a benefit important for most workers in Britain, but
only high wage workers in Norway, this is more important for unions in Britain than
Norway (high wage workers are less unionised in both countries).
6.2 The provision of supplementary employer-provided sick pay in addition to public
sick pay and other benefits and characteristics. Cross-country differences and
similarities.
In this sub-section, we consider the relationship between the provision of sick pay in
excess of statutory sick pay and other workplace characteristics. We start by mapping
out the country-differences regarding several organisational characteristics and
benefits, such as sick pay in excess of statutory sick pay, private health insurance,
extended sick leave arrangements, risky work, trade union agreements, quick
9 Based on the Norwegian individual wage data comprising the whole population of workers for 2011, we see that the 6G-threshold in 2011 constitutes roughly the 68th percentile in the wage distribution.

13
training10 and high turnover (above median in sample). We do this by estimating
several models related to the provision or existence of these characteristics. We
estimate two sets of models (one with 2-digit industry controls), for both countries.
Table 2 presents our results.
[ TABLE 2 AROUND HERE ]
Employer-provided benefits such as health insurance, extended sick leave (self-
declared) and sick pay in excess of statutory sick pay, and high-powered incentive
schemes are more prevalent among high wage workplaces in both countries, but that
sick pay in excess of statutory sick pay is particularly common in Norwegian high wage
workplaces. Sick pay above the statutory minimum and these other health related
benefits are akin to fringe benefits. Employers do not provide sick pay in excess of
statutory sick pay when their workers are employed under risky working conditions,
suggesting that employers are sensitive to the potential costs associated with such
provision. However, we see that most of the country differences and the differences
between high wage and low wage workplaces relate to industry variation, and are thus
hard to differentiate from other industry characteristics. Even so, privately provided sick
pay in excess of statutory sick pay is more prevalent among Norwegian high wage
workplaces within-industry. This is a natural consequence of the 6G-threshold in the
Norwegian public sick pay.
At same time, the similarities between the countries along these dimensions are
perhaps surprising, as indicated in Table 3. Estimating bivariate Spearman correlations
separately for each country, we see health related privately provided benefits are
correlated in both countries. Similarly, in both countries easy-to-train workers (quick-
training), high turnover and risky work are linked to less extensive employer provision
of extended sick leave and sick pay in excess of statutory sick pay.
[ TABLE 3 AROUND HERE ]
10 Quick training time is defined as when the answer to the question “About how long does it normally take before new recruitments in the main occupational group are able to do their job as well as more experienced employees already working here?” is less than one month, in contrast to longer.

14
6.3 The impact of the Norwegian sick pay threshold – comparative analyses
Next, we turn to the OLS regression analyses of how pay (and thus indirectly sick pay)
affect sickness absence. In Table 4 we report the estimated elasticity of sickness
absence rate with respect to wages for different models. The elasticities are estimated
based on several linear regressions. The results from these are presented in Appendix
Table A2.11
The sick leave level is much higher in Norway than in Great Britain, in line with
our theoretical predictions in the appendix and as seen in Figure 2. Second, when we
take into account wages (and thus implicitly sick pay) (Table A2 Models 1-6) then
Norway is not different from Great Britain. However, we see that the 6G-threshold
matters for sick leave in Norway, but not in Britain.
[ TABLE 4 AROUND HERE ]
In Table 4 we show that the elasticity of sick leave with respect to wages is strongly
negative in Britain, but does not differ below and above the Norwegian 6G-threshold,
which is as expected since this threshold does not exist in Britain. Overall in the UK
we find elasticities around -0.5, but the elasticity of sickness absence w.r.t. pay
becomes strongly more negative when focussing on employment relationships in
workplaces where the employer does not provide additional sick pay in excess of
statutory sick pay. For Norway, however, no significant relationship between sick leave
and wages is found below the 6G-threshold for all models with one exception (Model
4)12, but a strong negative elasticity appears for the high wage workplaces, and then
particularly when focussing on those workplaces where no additional private sick pay
is provided. These relationships survive a wide range of controls with respect to
industry, pay schemes (performance and merit pay, employee share scheme (ESS)
and Company Share Ownership Programs (CSOPs), and work organisation (e.g.,
11 In Appendix Table A2 Panel A) we report the parameter estimates associated with our key variables. In Panel B) in Table A2 we report the estimates (and standard errors) of the estimated linear expressions. Note in models 1-6, when we allow the relationship between wages and absenteeism to be kinked (at 6G), we do not allow a jump at the kink (thus following the KRD-approach). Incorporating such a jump, would not have qualitatively have changed our results. 12 In Model 4 exclude all observations from workplaces where the employer provide private sick pay. Since our analyses rest on workplace averages, these averages will be influenced by workers earning more than the 6G-threshold, and this might show up as a negative relationship between absenteeism and wages even for those workplaces with average earnings below the 6G-threshold.

15
teams). These regressions indicate that the replacement rate matters for Norwegian
workers' sick leave behaviour. They also reveal that when employers provide sick pay
in excess of statutory sick pay, the negative relationship between pay and sick leave
becomes less strong.
6.4 The impact of the Norwegian sick pay threshold – micro analyses
In the previous sub-section we provide evidence based on comparative workplace data
that the threshold (and implicitly the replacement rate) matter for sick leave in Norway.
However, this approach might be criticised for comparing two economies which differ
along a series of institutional dimensions in ways that might make causal inference
difficult. To test the impact of public sick pay provision further we focus on the
Norwegian job level data only and conduct a regression kinked design (RKD) analysis.
We apply the RKD-approach to job-level observations of both the observed number of
sick days and the number of sick days adjusted for partial sick leaves for Norwegian
workers in 2012 employed by workplaces with more than 10 employees. We conduct
the analyses separately for men and women.
In Table 5 we present the result of RKD-analyses for men and women. The table
presents 6 models. Model 1 presents the main result, based on the NWERS-sample.
Models 2 and 3 focus on those workers employed in workplaces providing extended
leave and additional private sick pay in excess of statutory sick pay, respectively.13 In
Model 4 we take into account the occurrence of partial sick leaves, while Model 5
incorporates a control vector, taking into account industry and occupation differentials,
education and age and workplace size differences. Finally, in Model 6 we present a
model for all workers based solely on administrative data, as opposed to focusing on
the NWERS sample.
[ TABLE 5 AROUND HERE ]
13 We cannot provide separate analyses of employees in workplaces where employers do not provide additional sick pay, because the number of observations necessary to conduct the KRD-analyses (observations around 6G) is not sufficiently high. The provision of extended sick leave and additional sick pay is correlated at the workplace-level, but not fully. However, they differ in that extended (self-certified) sick leave might affect the measurement of physician-certified sick leave days. Thus by focusing on these two separately, we focus on two different reasons why the relationship between sick leave days and earnings could be weaker.

16
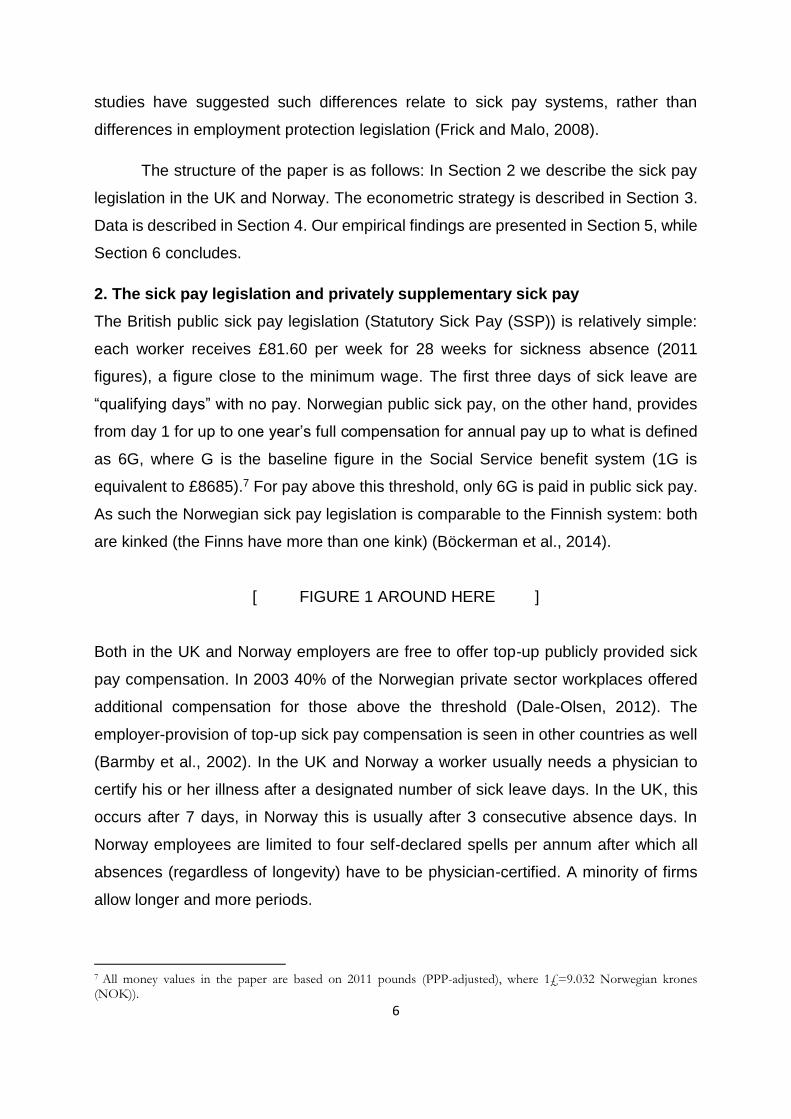
For men, we see in Table 5 that regardless of model, the number of sick leave
days drops considerably as pay starts to be uncompensated. The marginal
replacement rate changes from 1 to 0 (above the kink an absent worker only receives
6G in sick pay regardless of wages). The estimate of Model 1 implies that if earnings
increase by 1 percent above the threshold in the sick pay legislation, the number of
days drops by 3.44. The average number of sick days for this sample is 8.175 (as seen
in Table A1), although absent workers stay on sick leave 50 days on average (close to
80 percent is not absent at all). Regardless which group (all workers or those at least
experiencing one spell of sick leave) you compare with, the drop is considerable.
Figure 3 illustrates the kink effect for men
[ FIGURE 3 AROUND HERE ]
If we focus on employees employed in workplaces, which provide extended
leave (Model 2) or additional sick pay in excess of statutory sick pay (Model 3), we
observe a similar drop. The effect is slightly smaller when we take into account partial
sick leave in Model 4, while the inclusion of additional covariates in Model 5 yields no
qualitative changes. We also identify a significant negative slope-parameter for men
based on the administrative data (Model 6). This impact is clearly weaker, implying that
1 percent increase in uncompensated earnings causes a 0.86 day drop in sick days,
or roughly 10 percent.
For women, the picture is starkly different. As is seen in Table 5, no significant
impact is found regardless of the model, and Figure 3 does not reveal a clear kink in
the relationship between wages and sick leave days. This is not a complete surprise.
Dale-Olsen (2013a) did not find any evidence in Norway that financial incentives matter
for female absenteeism in 2003. Similarly, Ziebarth and Karlsson (2013) did not find
any female response following increased generosity of the statutory sickness
insurance system in Germany. This lack of response to financial incentives is thus a
characteristic of female sick leave behavior found in other countries as well.14 In our
14 The evidence from the experimental literature is mixed. In this literature a common finding is that, at least in a Western patriarchal society, women have a tendency to avoid strong competition and underperform when the competitive pressure increase (Gneezy et al., 2003; Niederle and Vesterlund; 2007) (this relationship might be different in other cultures, as shown by Gneezy, Leonard and List (2008)). The issue is, however, complicated, as seen in the survey of Niederle (2015) on gender differences in competitiveness, risk aversion and altruism. Currently we cannot conclude that financial incentives in general influence female sick leave behavior less than men.

17
case, one has to bear in mind that the 6G-threshold affect workers with above-average
wages, particularly for women, since women on average earn less than men and more
often work part-time. These women in our sample work fulltime, in high-wage
occupations and high-wage industries. Thus, they are clearly selected, and might be
less oriented towards financial incentives when it comes to sick leave.
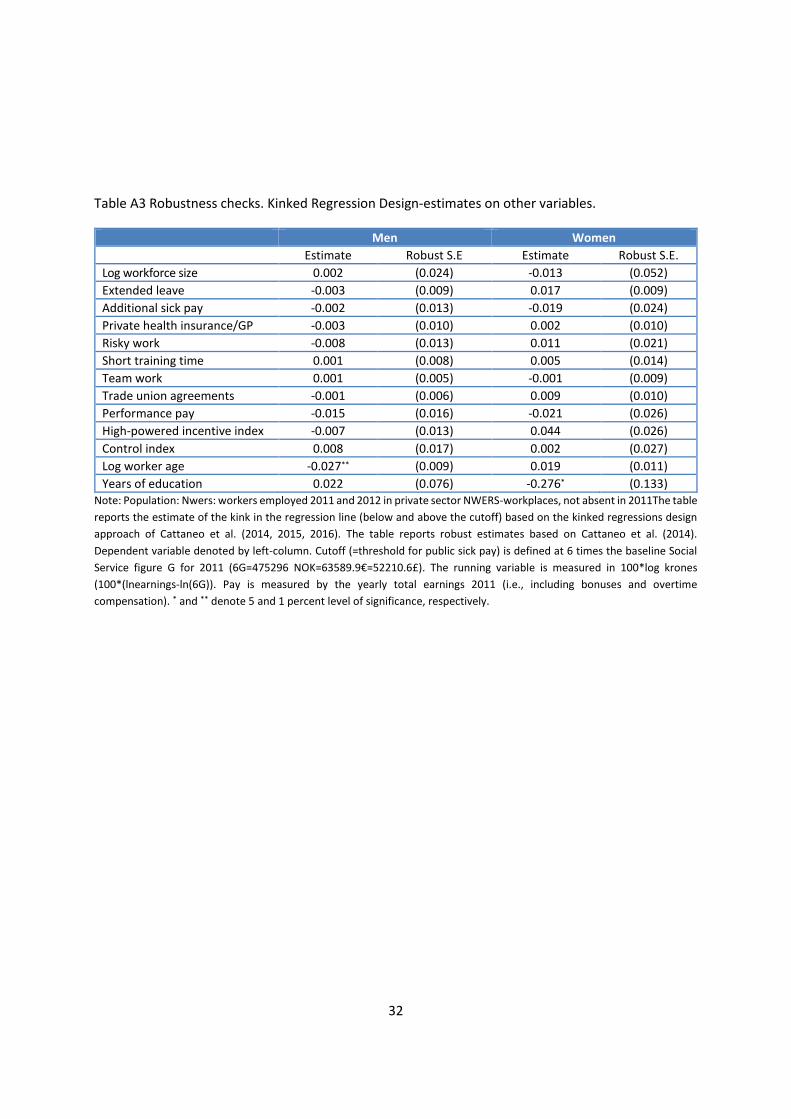
Potentially one worry in the RD- and RKD-approach is a bunching of workers
on one side of the kind, i.e., workers are able to manipulate the running variable. The
standard approach is to estimate how other variables are sensitive to the kink or
discontinuity. In Table A3 we present the KRD-estimate associated with several other
variables (whereof some have previously been used as controls). Table A3 reveals
that with two exceptions, education for men and age for women, these analyses do not
reveal any significant bunching around the kink. Next, we look closer at our running
variable to see whether this reveals any bunching. As is seen in Figure A1, no strong
evidence for bunching around 6G (=0 in the figure’s X-axis) is found, neither for men
nor women. Finally, we apply the methods of Cattaneo et al. (2017) and formally test
the bunching hypothesis. The results of this are presented in Table A4. Once again,
we find no evidence of bunching.
Another worry in the RD- and RKD-approach is that factors other than the real
incentive difference made by the kink in sick pay replacement rates cause the results.
To address this worry, we have estimated the models applying several placebo-kinks,
i.e., kinks where in reality there are none. In our case, we have estimated the model
for four placebo-kinks; for 4G, 5G, 7G and 8G (two placebo points below and two points
above the true threshold 6G). As is seen in Table A5, these do not reveal any
significant evidence of other kinks.
7. Conclusion
In this paper, we have studied the provision of private sick pay in excess of statutory
sick pay in Great Britain and Norway, two very different welfare regimes. In contrast to
the majority of Norwegian workers who face a 100 percent replacement rate when
absent from work due to illness, UK workers receive statutory sick pay on a par with
the minimum wage. However, due to a 6G-threshold for sick pay in Norway, not all

18
Norwegians face a 100 percent replacement rate. We utilize this difference and show
that the threshold and pay and thus indirectly sick pay are crucial for explaining the
higher sick leave rate in Norway compared to the Great Britain. Conditional on the
threshold and pay absenteeism is actually equal in the two countries, but absenteeism
is much more sensitive to pay in the Great Britain than in Norway even when we focus
on employees in workplaces with no provision of sick pay in excess of statutory sick
pay. The important observation is that when pay is no longer fully compensated, the
sick leave rate drops. This notion is further supported when applying a regression
kinked design to the Norwegian job level data, at least for male workers. Our estimate
of the elasticity of sickness absence w.r.t. the benefit level for men is roughly one third
of what Ziebarth and Karlsson (2013) found for Germany, and one fourth of what
Böckerman et al. (2014) found in Finland. However, Ziebarth and Karlsson observed
that the elasticity dropped when focusing on high paid workers. In our case, our
identification rest on the response of rather highly paid workers. Still, although the
replacement rate clearly influences absenteeism, employers provide benefits that raise
this compared to what is provided by statutory sick pay.
Given the generous Norwegian public sick pay it is no big surprise that private
sick pay in excess of statutory sick pay is less prevalent in Norway than Great Britain,
and Norwegian employers primarily provide for high-wage workforces. However, in
both these countries the provision of excess sick pay is clearly part of health-related
benefits package provided by employers, and employers provide this when recruitment
costs are high and the working conditions are beneficial to workers. Firms provide non-
pecuniary goods such as private sick insurance (sick pay) and set wages to maximize
profits, and do this while taking into account several different dimensions of labour
costs, absence costs being just one dimension. Training costs and turnover costs could
be other relevant dimensions. In addition, trade union agreements raise the probability
of sick pay in excess of statutory sick pay.
For policymakers on sick pay our paper provides three important lessons. First,
sick pay compensation matters for absenteeism, but the sick leave response to
economic incentives is heterogeneous. Second, firms might provide additional benefits
to worker groups if by doing so they profit, thus if replacement rates are cut, worker
groups with good outside options or strong bargaining position could be less affected
by the reduction in replacement rates. Third, when reforming the public sick pay

19
legislation, policymaker should take care so that such reforms do not cause unwanted
inequality and unexpectedly affect the level of living of vulnerable worker groups.
Appendix
A simple model of shirking
Workers mainly take sick leave due to illness, but there is a rich literature focussing on
the shirking aspect of absenteeism. In this literature, there is a margin at which
employees can choose whether to take sick leave or not, depending on the costs and
benefits of doing so. At this margin sick leave can be interpreted as a reduction in
worker effort.
By choosing a sick leave level, a, when facing imperfect monitoring, N identical
workers maximise expected utility. Let the monitoring probability be 0<m<1. Our focus
is privately supplied sick pay, thus we simplify and assume that all firms monitor at the
same level and costs. Monitoring intensity is usually treated as a key firm choice
variable. Public sick pay is also ignored for simplicity.
a can also be interpreted as the sick leave probability. By staying home on sick
leave the worker receives sick pay S. By showing up to work a worker undertakes the
contracted effort. As is common in “shirking”-models, work effort is assumed to be
associated with disutility, i.e., one can derive a cost of effort function, C, expressed as
a function of the presence probability (1-a). We assume that C is a convex function,
i.e., C’(1-a)>0 and C’(1-a)’>0). An absent and monitored worker is fired. Each worker
then maximises:
1) (1-a)U(W)+a(1-m)U(S)+amU(R)-C(1-a),
where U expresses a Von Neumann-Morgenstern utility function, U’>0, U’’<0, R
expresses the workers outside options, and C(.) expresses a convex cost function of
providing effort as a function of a (C’>0, C’’>0). Workers’ first order condition for
maximization is given by:
2) U(W)-U(S) + m[U(S)-U(R)]=C’(1-a*),
i.e., the marginal cost of providing effort equals the marginal gain from showing up at
work plus the added marginal loss if caught shirking.

20
This simple model then yields different predictions for the UK and Norway on
absenteeism. Assume that the cost of providing effort can be represented by a quadric
function, C(1-a)=c(1-a)2. The sick pay in the UK could be interpreted as being equal to
the outside options, i.e, S=R. For Norway, S=W for wage levels below 6G, but fixed at
S=6G above. Thus (1-a)UK=[U(W)-U(R)]/2c, implying that 𝜕𝑎𝑈𝐾
𝜕𝑊=-U’(W)/2c<0. .For
Norway and W<6G then (1-a)Norway=m[U(W)-U(S)]/2c, implying that 𝜕𝑎𝑁𝑜𝑟𝑤𝑎𝑦
𝜕𝑊=-
mU’(W)/2c<0. If monitoring of workers in Norway is very low or absent, then absence
will not diminish with wages for wages less than 6G.15 Above 6G, this becomes equal
to the UK, 𝜕𝑎𝑁𝑜𝑟𝑤𝑎𝑦
𝜕𝑊=-U’(W)/2c<0. Thus we should see less or no impact from wages in
Norway under the 6G-threshold relative to the impact observed in the UK, but for
workers earning above the 6G-limit the behaviour should be similar in the two countries.
For the Norwegian workers we should see that absenteeism becomes more negatively
related to wages.
The utility set up above could be interpreted as the utility of a staying worker,
Ustay=U. Then worker mobility could be modelled as: q=q(W,S)=Pr(U(wage offer
competing firm)>Ustay).
We easily see that 𝜕𝑈𝑠𝑡𝑎𝑦
𝜕𝑊>0 and
𝜕𝑈𝑠𝑡𝑎𝑦
𝜕𝑆>016, i.e., since q(w,a), then
𝜕𝑞
𝜕𝑊<0 and
𝜕𝑞
𝜕𝑆<0.
In this modelling framework firms maximize profits by choosing the optimum mix
of wages and sick pay (since all firms monitor at the same intensity and cost,
monitoring costs can be ignored). Firm profits may be described by Equation 3), where
workforce size is normalised to 1:
3) Π=(1-q)[(1-a)P-(1-a)W –(1-m)aS-Z(m)-T(q)]-qT(q),
where P expresses the value of the final product (product priceXquantum produced),
W and S denote the wage and sick pay, respectively, a and m express the absence
rate and the monitoring-and-found-shirking intensity (0<m<1), respectively. Z
expresses the cost of monitoring, where Z’>0 and Z’’>0. Finally, we have entered a
15 Note that we focus on physician-certified sick leaves. It might be close to impossible to define such an absence as shirking. In addition, as in the other Scandinavian countries, Norwegian physicians seldom deny sickness certificates (Wahlström and Alexanderson, 2004; Carlsen and Nyborg, 2009).
16 This is easily seen differentiating Ustay: 𝜕𝑈𝑠𝑡𝑎𝑦
𝜕𝑊= (1 − 𝑎)𝑈′(𝑊) − [𝑈(𝑊) − (1 − 𝑚)𝑈(𝑆) − 𝑚𝑈(𝑅)]
𝜕𝑎
𝜕𝑊>0 and
𝜕𝑈𝑠𝑡𝑎𝑦
𝜕𝑆= 𝑎(1 − 𝑚)𝑈′(𝑆) − [𝑈(𝑊) − (1 − 𝑚)𝑈(𝑆) − 𝑚𝑈(𝑅) − 𝐶′(1 − 𝑎)]
𝜕𝑎
𝜕𝑆>0 (note that the last term in
bracket is 0 since it is the FOC).

21
turnover (training) cost element, T, where T’> and T’’>0, in line with Salop (1979). Firm
maximizes Π w.r.t. W and S. This yields two first-order conditions (FOCs):
4) -{[(1-a)P-(1-a)W –(1-m)aS-Z(m)-T(q)]+T(q)+ T’(q)} 𝜕𝑞
𝜕𝑆 = (1-q)[(1-m)a +(P-W –
(1-m)S) 𝜕𝑎
𝜕𝑆,
5) -{[(1-a)P-(1-a)W –(1-m)aS-Z(m)-T(q)]+T(q)+ T’(q)} 𝜕𝑞
𝜕𝑊 = -(1-q)[(1-a) +(P-W –
(1-m)S) 𝜕𝑎
𝜕𝑊.
The first FOC expresses that the marginal turnover costs saved by increasing sick
pay should be equal to the marginal shirking costs. This shows that firms might
rationally increase (or introduce) private sick pay even if it increases absenteeism, if
the gains in turnover costs compensate for this. The second FOC expresses that the
marginal wage costs (and thus profit) should be equal to the saved marginal turnover
and absence costs.
Tables
[ TABLE A1 AROUND HERE ]
[ TABLE A2 AROUND HERE ]
[ FIGURE A1 AROUND HERE ]

22
References
Barham, C. and N, Begum (2005), ”Sickness absence from work in the UK‟ Labour Market
Trends, Office for National Statistics, April: 149-158.
Barmby, T.A., Orme, C., and Treble, J. (1995), “Worker Absence Histories: A Panel Data
Study”, Labour Economics, Vol. 2(1), pp. 53 – 65.
Barmby, T.A., Ercolani, M. G. and Treble, J. G. (2002), “Sickness Absence: An International
Comparison”, Economic Journal, 112, F315 – F331.
Brown, S., Fakhfakh, F. and Sessions, J.G. (1999), “Absenteeism and Employee Sharing: An
Empirical Analysis based in French Panel Data, 1981 – 1991”, Industrial and Labor
Relation Review, 52, 234 – 251.
Böckerman, P. O. Kanninen and I. Suoniemi (2014), A Kink that Makes You Sick: the Incentive
Effect of Sick Pay on Absence in a Social Insurance System. IZA DP. 8205.
Calonico, S. M. D. Cattaneo, and R.Titiunik (2014a), “Robust data-driven inference in the
regression-discontinuity design,” Stata Journal, 14, 909 – 946.
Calonico, S. M. D. Cattaneo, and R.Titiunik (2014b), “Robust nonparametric confidence
intervals for regression-discontinuity design,” Econometrica, 82, 2295 – 2326.
Calonico, S. M. D. Cattaneo, and R.Titiunik (2015), “Optimal data-driven regression-
discontinuity plots,” Journal of the American Statistical Association, 110, 1753 – 1769.
Carlsen, B. and Nyborg, K. (2009), “The Gate is Open: Primary Care Physicians as Social
Security Gatekeepers”, memo 7/2009, Department of Economics, University of Oslo.
Card, D., D. S. Lee, Z. Pei and A. Weber (2015), “Inference on Causal Effects in a
Generalized Regression Kink Design,” Econometrica, 83, 2453 – 2483.
Card, D., D. S. Lee, Z. Pei and A. Weber (2016), Regression Kink Design: Theory and Practice.
NBER Working Paper #22781.
Cattaneo, M.D., B. R. Frandsen, and R. Titiunik (2015), «Randomization inference in the
regression discontinuity desig: An applicattion to party advantages in the U.S. Senate,»
Journal of Causal Inference, 3, 1 – 24.
Cattaneo, M. D., R. Titiunik, and G. Vasquez-Bare (2016a), ”Inference in regression
discontinuity design under local randomization,” The Stata Journal, 16, 331 – 367.
Cattaneo, M. D., R. Titiunik, and G. Vasquez-Bare (2016b), Comparing inference approaches
for RD designs: A re-examination of the effect of head start on child mortality. Working
paper. University of Michigan.
Cattaneo, M. D., M. Jansson and X. Ma (2017), Simple Local Polynomial Density Estimators.
Mimeo. University of Berkeley.
Csillag, M. (2017), The incentive Effects of Sickness Absence Compensation – Analysis of a
“Natural Experiment” in Eastern Europe,” mimeo., Budapest Institute for Policy Analysis.

23
Dale-Olsen, H. (2013a), “Sickness absence, sick leave pay and pay schemes,” LABOUR, 28,
40-63..
Dale-Olsen, H. (2013b). “Absenteeism, efficiency wages, and marginal taxes.” Scandinavian
Journal of Economics, 115, 1185 – 85 (DOI: 10.1111/sjoe.12028).
Esping-Andersen, G. (1990), The Three Worlds of Welfare Capitalsm. Princeton, NJ: Princeton
University Press.
Frick, B. and M.A. Malo (2008), “Labor Market Institutions and Individual Absenteeism in the
European Union: The Relative Importance of Sickness Benefit Systems and Employment
Protection Legislation”, Industrial Relations, 47, 505 – 529.
Gimeno, D., F. G. Benavides, B. C. Amick, J. Benach, and J. M. Martínez. (2004).
“Psychosocial factors and work related sickness absence among permanent and non-
permanent employees”, Journal of Epidemiology and Community Health, 58, 870-76.
Gneezy, U., K. L. Leonard, and J. A. List (2009), “Gender Differences in Competition: Evidence
from a Matrilineal and a Patriarchal Society”, Econometrica, 77, 637–1664.
Gneezy, U., M. Niederle, and A. Rustichini (2003), “Performance in Competitive Environments:
Gender Differences”, Quarterly Journal of Economics, 118, 1049-1074.
Goetzel, R. Z., Long, S.R., Ozminkowski, R. J., Hawkins, K., Wang, S. and Lynch, W. (2004),
“Health, Absence, Disability, and Presenteeism Cost Estimates of Certain Physical and
Mental Health Conditions Affecting U. S. Employers,” Journal of Occupational and
Environmental Medicine, 46: 398 – 412.
Grossman, M. (1972), “On the Concept of Health Capital and the Demand for Health,” The
Journal of Political Economy, 80, 223 – 255.
Hahn, J., Todd, P. and van der Klaauw, W. (2001), “Identification and Estimation of Treatment
Effects with a Regression-Discontinuity Design,” Econometrica, 69, 201 – 209.
Haley, H. R. (2003), The response of worker effort to piece Rates. Evidence from the Midwest
Logging Industry,“ Journal of Human Resources, 38, 225 – 49.
Hassink, W. and Koning, P.(2009), “Do Financial Bonuses Reduce Employee Absenteesim?
Evidence from a Lottery,” Industrial & Labor Relations Review, 62, 327 – 342.
Hemp, P. (2004), “Presenteeism – At work, but out of it,” Harvard Business Review, October 2004,
1 – 9.
Henrekson, M. and Persson, M. (2004), “The Effects on Sick Leave of Changes in the Sickness
Insurance System”, Journal of Labor Economics, 22, 87 – 113.
Heywood, J.S. and Jirjahn, U. (2004). ”Teams, Teamwork and Absence.” Scandinavian Journal
of Economics, 106: 765 – 782.
Holmøy, A. (2013), Arbeids- og bedriftsundersøkelsen 2012. Dokumentasjonsrapport. Notater
38/2013. Oslo og Kongsvinger: Statistisk sentralbyrå.

24
Johansson, P. and M. Palme (1996), “Do Economic Incentives AffectWorker Absence?
Empirical Evidence Using Swedish Data”, Journal of Public Economics, 59, 195-
218.
Johansson, P. and Palme, M. (2002), “Assessing the Effect of Public Policy on Worker
Absenteeism,” Journal of Human Resources, 37, 381 – 409.
Niederle, M. and L. Vesterlund (2007), “Do Women Shy Away from Competition? Do Men
Compete Too Much?”, Quarterly Journal of Economics, 122, 1067- 1101.
Niederle, M. (2015), “Gender”. In Kagel, J. and A. E. Roth (Eds.), Handbook of Experimental
Economics, Vol. 2, 481 – 562. Princeton, New Jersey: Princeton University Press
Nielsen, H. S., T. Sørensen, and C. R. Taber (2010), “Estimating the Effects of Aid on College
Enrollment: Evidence from a Government Grant Policy Reform,” American Economic
Journal: Economic Policy, 2, 185 – 215.
OECD (2010), Sickness, Disability and Work: Breaking the Barriers. A synthesis of findings
across OECD countries. Paris: OECD.
Pichler, S. and N. R. Ziebarth (2016), The Pros and Cons of Sick Pay Schemes: A Method to
Test for Contagious Presenteeism and Shirking Behavior. IZA DP No. 8850.
Salop, S. C. (1979), “A Model of the Natural Rate of Unemployment,” American Economic
Review, 69, 117 – 125.
Skatun, J.D. (2003), “Take some days off, why don’t you? – Endogenous sick leave and pay,”
Journal of Health Economics, 22, 379 – 402.
Treble, J. and T. Barmby (2011), Worker Absenteeism and Sick Pay. Cambridge, UK: Cambridge
University Press.
van Wanrooy, B., H. Bewley, A. Bryson, J. Forth, S. Freeth, L. Stokes and S. Wood (2013),
Employment Relations in the Shadow of Recession. Findings from the 2011 Workplace
Employment Relations Study. London: Palgrave Macmillan.
Wahlström, R. and Alexanderson, K. (2004), “Chapter 11. Physicians' sick-listing practices”,
Scandinavian Journal of Public Health, Vol. 32 (63 Supplement), 222-255.
Ziebarth, N. R. and Karlsson, M. (2010), “A natural experiment on sick pay cuts, sickness
absence, and labor costs,” Journal of Public Economics, 94, 1108 – 1122.
Ziebarth, N. R. and Karlsson, M. (2013), “The effects of expanding the generosity of the
statutory sickness insurance system,” Journal of Applied Econometrics, 29, 208 – 230.
Ziebarth, N. R. (2013), “Long-Term Absenteeism and Moral Hazard – Evidence from a Natural
Experiment”, Labour Economics, 24, 277 – 292.

25
Table 1 The private sector sick leave rate and sick pay regimes. UK 2011 and Norway 2012.
UK Norway
All Public sick pay
only
Additional private sick pay
All Public sick pay
only
Additional private sick pay
Sick leave rate 0.044 0.045 0.042 0.068 0.069 0.066
Sick leave rate-adjusted - - - 0.055 0.057 0.053
Ln hourly wage 2.199 2.053 2.353 3.110 2.957 3.220
Over 6G in earnings 0.369 0.358 0.386 0.299 0.178 0.449
Private sick pay 0.484 0 1 0.477 0 1
Extended leave 0.480 0.256 0.720 0.189 0.182 0.405
Private health insurance/GP 0.156 0.095 0.220 0.190 0.233 0.341
Risky work 0.342 0.382 0.299 0.262 0.337 0.226
Work control index 1.751 1.680 1.841 1.585 1.574 1.598
(Design, discretion, pace)
Short time before new recruits perform as well as more experienced workers
0.321 0.385 0.253 0.387 0.456 0.269
Log workforce size 2.683 2.486 2.893 2.948 2.783 3.089
High worker turnover
Trade union agreement(s) 0.172 0.063 0.289 0.793 0.688 0.711
High powered incentive index 0.671 0.511 0.876 0.739 0.667 0.845
Note: Population: 2680(1858) WERS2011- and 1888 (1107) NWERS2012-workplaces (private sector workplaces in
parentheses). All observations are weighted to be representative for the population of workplaces with at least 10
employees.

26
Table 2 Pay and benefit schemes, working conditions, and statutory pay in UK and Norway.
Sick pay
Extend
ed
leave
Health
In
suran
ce
Trade
un
ion
Risky w
ork
Qu
ick train
ing
High
tu
rno
ver
Co
ntro
l in
dex
High
po
wer-
incen
tive-
ind
ex
A) Basic Intercept 0.427** 0.439** 0.159** 0.077** 0.334** 0.334** 0.584** 1.785** 0.658**
(0.033) (0.034) (0.022) (0.012) (0.043) (0.033) (0.031) (0.040) (0.061)
Norway -0.045 -0.231** 0.067 0.686** -0.042 0.117 -0.033 -0.262** -0.090
(0.042) (0.037) (0.034) (0.039) (0.037) (0.063) (0.060) (0.067) (0.069)
> 6G in earnings
0.151* 0.140* 0.231* 0.041 -0.067 -0.118* 0.063 0.081 0.396*
(0.071) (0.070) (0.109) (0.044) (0.085) (0.055) (0.074) (0.126) (0.185)
NorwayX> 6G in earnings
0.185* 0.127 -0.044 -0.260** 0.020 -0.166* -0.267* 0.156 0.205
(0.074) (0.087) (0.074) (0.074) (0.082) (0.032) (0.031) (0.148) (0.062)
R2 0.094 0.072 0.036 0.050 0.002 0.071 0.234 0.210 0.104
B) Within industry Intercept 0.453** 0.440** 0.203** 0.109* 0.378** 0.291** 0.554** 1.774** 0.685**
(0.035) (0.034) (0.030) (0.048) (0.030) (0.053) (0.048) (0.083) (0.073)
Norway -0.053 -0.211** 0.055 0.614** -0.083* 0.115* -0.038 -0.167 0.011
(0.036) (0.041) (0.034) (0.053) (0.031) (0.058) (0.051) (0.086) (0.080)
> 6G in earnings
0.118 0.112 0.153 0.191** -0.021 0.001 0.067 0.168 0.080
(0.077) (0.078) (0.087) (0.070) (0.072) (0.094) (0.131) (0.143) (0.183)
NorwayX> 6G in earnings
0.157* 0.081 -0.077 -0.271** -0.037 -0.127 -0.155 0.116 0.078
(0.072) (0.106) (0.085) (0.087) (0.030) (0.106) (0.135) (0.153) (0.073)
R2 0.222 0.187 0.117 0.235 0.258 0.202 0.234 0.210 0.271 Note: Population: WERS 2011- and NWERS 2012-workplaces. 2317 observations. All observations are weighted to be
representative for the population of workplaces with at least 10 employees. The industry control vector in Panel B) takes into
account 2-digit SIC industry differentials. Industry clustered standard errors presented in parentheses. * and ** denote 5 and
1 percent level of significance, respectively.

27
Table 3 Coordinated pay and benefit schemes and working conditions. Spearman correlations.
Sick pay
Extend
ed
leave
Health
In
suran
ce
Trade
un
ion
Risky w
ork
Qu
ick train
ing
High
tu
rno
ver
Co
ntro
l in
dex
High
po
wer-
incen
tive-
ind
ex
A) UK
Ext.leave 0.52**
Health ins. 0.22** 0.16**
T. union 0.36** 0.33** -0.02
Risky work -0.07* -0.05 -0.15** 0.12**
Quick train. -0.17** -0.18** -0.10** -0.05 0.06*
High turn. -0.05 -0.07* 0.05 -0.12** -0.05 0.02
Control in. 0.06* 0.04 0.13** -0.06* -0.10** -0.09** 0.03
HP.incentives 0.24** 0.30** 0.29** 0.19** -0.08** -0.10** 0.04 0.01
Over 6G 0.14** 0.10** 0.17** 0.07* -0.06* -0.05** 0.01 -0.01 0.14**
B) Norway
Ext.leave 0.30**
Health ins. 0.15** 0.15**
T. union 0.02 -0.08** -0.06
Risky work -0.10** -0.03 0.01 0.13**
Quick train. -0.23** -0.16** -0.07* 0.10** 0.03
High turn. -0.16** -0.13** -0.04 -0.03 -0.08* 0.22**
Control in. 0.04 0.08** -0.01 -0.20** -0.11** -0.16** -0.03
HP.incentives 0.20** 0.24** 0.19** -0.21** -0.05 -0.20** -0.06 0.15**
Over 6G 0.38** 0.30** 0.19** -0.15** -0.05 -0.30** -0.22** 0.12** 0.38**
Note: Population: WERS 2011- and NWERS 2012-workplaces. All observations are weighted to be representative for the
population of workplaces with at least 10 employees. The industry control vector in Panel B) takes into account 2-digit SIC
industry differentials. Industry clustered standard errors presented in parentheses. x, *, and ** denote 10, 5, and 1 percent
level of significance, respectively.

28
Table 4 The relationship between pay, sick pay and absenteeism in UK and Norway. Estimated elasticities of the sickness absence rate w.r.t. the hourly wage
Sick leave rate Sick leave rate adjusted
Model 1 Model 2 Model 3 Model 4 Model 5 Model 6 UK:Lnw<G6 -0.574** -0.609** -0.548** -1.409** -0.653** -1.331**
(0.150) (0.151) (0.146) (0.370) (0.152) (0.390)
UK:Lnw>G6 -0.413** -0.471** -0.548** -1.195** -0.503** -1.152**
(0.152) (0.167) (0.146) (0.317) (0.158) (0.326)
N:Lnw<G6 -0.085 -0.169 -0.169 -0.240* -0.118 -0.158
(0.076) (0.104) (0.104) (0.103) (0.160) (0.195)
N:Lnw>G6 -0.171** -0.250** -0.250** -0.515** -0.340** -0.414*
(0.065) (0.091) (0.150) (0.148) (0.171) (0.210)
Controls:
Basic Yes Yes Yes Yes
Industry Yes Yes Yes Yes
Selection No No No No private sick pay
No No private sick pay
R2 0.057 0.075 0.075 0.069 0.070 0.066
Observations 2150 2082 2082 1297 2082 1297 Note: Population: WERS2011- and NWERS2012-workplaces. All observations are weighted to be representative for the
population of workplaces with at least 10 employees. OLS regressions. Dependent variable: ln(a/(1-a))(= the logit of the sick
leave rate). Lnw expresses log hourly wage measured in pounds. Lnw>G6 and Lnw<G6 express log hourly wages for those
with earnings above and below 6G (the earnings threshold for public sick pay in Norway). N: and UK: then denote which
country for the marginal effect of log hourly wage is calculated. Basic control vector: dummy for trade union agreement,
working conditions such as risk (1), pollution (1), and physical (1), pay regimes (4), benefits (3), worker discretion and design
(2), team (1) and recruitment costs (1). The industry control vector takes into account 2-digit SIC industry differentials. See
Table A2 for parameter estimates and estimates of linear expressions. * and ** denote 5 and 1 percent level of significance,
respectively.

29
Table 5 The impact of public sick pay on the duration of sick leaves. 2012.
1 2 3 4 5 6
Sick days Sick days Sick days Sick days adjusted
Sick days Sick days
A) Men
Kinked RD-robust -3.440** -3.334** -4.608** -2.152* -2.914** -0.857**
(1.124) (1.662) (1.831) (0.864) (1.025) (0.319)
Total observations 45103 15616 21995 45103 44805 333118
Obs. left cutoff 6524 3673 3192 6286 6894 58667
Obs. right cutoff 7552 3539 3788 7252 8072 60562
B) Women
Kinked RD-robust -0.800 -2.668 -1.686 -0.800 -0.735 -0.098
(0.858) (2.282) (2.153) (0.584) (0.806) (0.460)
Total observations 31347 6486 7693 31347 31170 260820
Obs. left cutoff 8435 1429 1932 8048 8840 52325
Obs. right cutoff 6268 1384 1690 6099 6414 38631
C) Elasticity of sick days w.r.t. benefits
Men 0.295** 0.448** 0.442** 0.236* 0.249** 0.095**
Women 0.083 0.160 0.136 0.038 0.026 0.008
Population, selection and covariates Population Nwers Nwers Nwers Nwers Nwers All
Selection Extended leave
Private sick pay
Covariates No No No No Yes No Note: Population: Nwers: workers employed 2011 and 2012 in private sector NWERS-workplaces, not absent in 2011; All:
workers employed 2011 and 2012 in private sector workplaces with more than 10 employees, not absent in 2011. Selection:
Private sick pay: Only employees in workplaces where employer provides private sick pay above public statutory sick pay;
Extended leave: Only employees in workplaces where employer allow longer self-declared sick leaves than what is required
by the public sick pay legislation. The table reports the estimate of the kink in the regression line (below and above the cutoff)
based on the kinked regressions design approach of Cattaneo et al. (2014, 2015, 2016). The table reports robust estimates
based on Cattaneo et al. (2014). Panel A) and B) report the results for men and women, respectively. Dependent variable is
sick leave days, except for Model 4 where the measure of sick leave days takes into account the occurrence of partial sick
leaves. Cutoff (=threshold for public sick pay) is defined at 6 times the baseline Social Service figure G for 2011 (6G=475296
NOK=63589.9€=52210.6£). The running variable is measured in 100*log krones (100*(lnearnings-ln(6G)). Pay is measured by
the yearly total earnings 2011 (i.e., including bonuses and overtime compensation). Covariates: log workforce size, years of
education, log worker age, occupation (8 dummies) and industry (8 dummies). * and ** denote 5 and 1 percent level of
significance, respectively.

30
Table A1 Descriptive statistics on earnings, wages and sick leaves
Establishment-level analysis
Individual-level analysis
UK Norway Men Women
All <6G >6G All <6G >6G
A) Private sector WERS/NWERS-establishments
Sick leave rate(sr) 0.051 0.067 - - - - - -
(0.089) (0.050) - - - - - -
Logit (sr) -3.715 -2.837 - - - - - -
(1.450) (0.733) - - - - - -
Ln hourly wage 2.182 3.081 - - - - - -
(0.470) (0.442) - - - - - -
N 1062 1095 - - - - - -
B) KRD-sample, Workers employed by private sector NWERS-establishments
Certified sick days - - 8.175 8.522 7.861 13.018 13.728 12.166
- - (31.057) (32.079) (30.102) (40.479) (40.950) (39.866)
Certified sick days
(absent workers)
Ln earnings 2011 - - 13.074 13.019 13.124 13.064 13.017 13.121
- - (0.061) (0.032) (0.029) (0.060) (0.032) (0.030)
Age - - 44.858 44.219 45.436 46.502 46.004 47.100
- - (11.186) (11.420) (10.937) (9.965) (10.251) (9.577)
Education(years) - - 4.210 3.905 4.487 5.642 5.352 5.989
- - (2.851) (2.700) (2.956) (2.646) (2.572) (2.692)
N - - 13937 6624 7313 8906 4857 4049
C) KRD-sample, All private sector workers
Certified sick days - - 8.509 9.033 8.002 13.763 14.406 12.943
- - (31.990) (33.052) (30.917) (41.598) (42.486 (40.424)
Certified sick days - -
(absent workers) - -
Ln earnings 2011 - - 13.072 13.013 13.130 13.062 13.011 13.126
- - (0.068) (0.034) (0.034) (0.067) (0.035) (0.034)
Age - - 44.430 43.665 45.171 47.119 46.468 47.952
- - (11.183) (11.338) (10.978) (9.823) (10.058) (9.449)
Education(years) - - 3.998 3.727 4.242 5.598 5.347 5.919
- - (2.675) (2.584) (2.737) (2.436) (2.421) (2.416)
N - - 116374 57295 59080 78436 43997 34441
Note: Populations: Workplace level analyses: private sector WERS2011(UK) - and NWERS2012(Norway)-workplaces.
Individual-level analyses: KRD-NWERS=workers employed 2011 and 2012 in private sector NWERS-workplaces earning
between 3G and 10G in 2011 and not absent in 2011. KRD-All=all workers employed 2011 and 2012 in private sector
workplaces earning between 3G and 10G in, and not absent in 2011. Log hourly pay for UK and Norway is based on 2011
pounds (PPP-adjusted), where 1£=9.032 Norwegian krones (NOK)). The workplace sick leave rate is measured as the absence
rate (for both self-declared and physician-certified sickness absence) the last year (prior to interview). logit (sr) denotes
ln(sr/(1-sr)). Ln earnings is measured in Norwegian krones. The 6G-threshold in 2011 is 475296 NOK=63589.9€=52210.6£.
Certified sick days denotes physician certified sick days measured from May 1st, 2012 and until April 31st, 2013.

31
Table A2 The relationship between pay, sick pay and absenteeism in UK and Norway.
Observed sick leave rate Sick leave rate adjusted
Model 1 Model 2 Model 3 Model 4 Model 5 Model 6
A) Parameter estimates Norway(N) -0.046 0.090 0.211 -1.468 -0.425 -1.874
(0.477) (0.554) (0.546) (1.013) (0.657) (1.201)
Lnw -0.605** -0.642** -0.577** -1.485** -0.668** -1.403**
(0.158) (0.159) (0.154) (0.390) (0.160) (0.411)
Lnw>G6 0.170 0.146 0.225 0.138 0.189
(0.106) (0.122) (0.180) (0.118) (0.172)
NorXLnw 0.514** 0.461* 0.396x 1.228** 0.542* 1.234*
(0.199) (0.227) (0.219) (0.445) (0.256) (0.522)
NorXLnw>G6 -0.263** -0.233x -0.087** -0.295 -0.238x -0.275
(0.113) (0.129) (0.029) (0.181) (0.124) (0.177)
B) Estimated linear expressions UK:Lnw<G6 -0.605** -0.642** -0.577** -1.485** -0.668** -1.403**
(0.158) (0.159) (0.154) (0.390) (0.160) (0.411)
UK:Lnw>G6 -0.435** -0.496** -0.577** -1.259** -0.530** -1.214**
(0.160) (0.176) (0.154) (0.334) (0.167) (0.343)
N:Lnw<G6 -0.091 -0.181 -0.181 -0.257* -0.127 -0.169
(0.082) (0.112) (0.112) (0.111) (0.172) (0.209)
N:Lnw>G6 -0.184** -0.268** -0.268** -0.552** -0.364* -0.444*
(0.070) (0.098) (0.098) (0.189) (0.184) (0.225)
Controls:
Basic Yes Yes Yes Yes
Industry Yes Yes Yes Yes
Selection No No No No private sick pay
No No private sick pay
R2 0.057 0.075 0.075 0.117 0.070 0.110
Observations 2150 2082 2082 785 2082 785 Note: Population: WERS2011- and NWERS2012-workplaces. All observations are weighted to be representative for the
population of workplaces with at least 10 employees. OLS regressions. Dependent variable: ln(a/(1-a))(= the logit of the sick
leave rate). Lnw expresses log hourly wage measured in pounds. Lnw>G6 expresses lnw*I(earnings>6G), i.e., the interaction
between log hourly wage and the dummy for whether earnings are above 6G (the earnings threshold for public sick pay in
Norway). “NorX” then expresses the interaction with the Norway dummy. Basic control vector: dummy for trade union
agreement, working conditions such as risk (1), pollution (1), and physical (1), pay regimes (4), benefits (3), worker discretion
and design (2), team (1) and recruitment costs (1). The industry control vector takes into account 2-digit SIC industry
differentials. x, *, and ** denote 10, 5, and 1 percent level of significance, respectively.
32
Table A3 Robustness checks. Kinked Regression Design-estimates on other variables.
Men Women
Estimate Robust S.E Estimate Robust S.E.
Log workforce size 0.002 (0.024) -0.013 (0.052)
Extended leave -0.003 (0.009) 0.017 (0.009)
Additional sick pay -0.002 (0.013) -0.019 (0.024)
Private health insurance/GP -0.003 (0.010) 0.002 (0.010)
Risky work -0.008 (0.013) 0.011 (0.021)
Short training time 0.001 (0.008) 0.005 (0.014)
Team work 0.001 (0.005) -0.001 (0.009)
Trade union agreements -0.001 (0.006) 0.009 (0.010)
Performance pay -0.015 (0.016) -0.021 (0.026)
High-powered incentive index -0.007 (0.013) 0.044 (0.026)
Control index 0.008 (0.017) 0.002 (0.027)
Log worker age -0.027** (0.009) 0.019 (0.011)
Years of education 0.022 (0.076) -0.276* (0.133) Note: Population: Nwers: workers employed 2011 and 2012 in private sector NWERS-workplaces, not absent in 2011The table
reports the estimate of the kink in the regression line (below and above the cutoff) based on the kinked regressions design
approach of Cattaneo et al. (2014, 2015, 2016). The table reports robust estimates based on Cattaneo et al. (2014).
Dependent variable denoted by left-column. Cutoff (=threshold for public sick pay) is defined at 6 times the baseline Social
Service figure G for 2011 (6G=475296 NOK=63589.9€=52210.6£). The running variable is measured in 100*log krones
(100*(lnearnings-ln(6G)). Pay is measured by the yearly total earnings 2011 (i.e., including bonuses and overtime
compensation). * and ** denote 5 and 1 percent level of significance, respectively.

33
Table A4 The bouncing of observations of earnings around the kink-point.
Men Women
Test-value 0.172 -0.910 -1.066 -0.567 0.078 0.874 0.779 -1.271
(0.864) (0.363) (0.287) (0.571) (0.938) (0.382) (0.436) (0.204)
Population Nwers Nwers Nwers All Nwers Nwers Nwers All
Selection Extended leave
Private sick pay
Extended leave
Private sick pay
Note: Population: Nwers: workers employed 2011 and 2012 in private sector NWERS-workplaces, not absent in 2011; All:
workers employed 2011 and 2012 in private sector workplaces with more than 10 employees, not absent in 2011. Selection:
Private sick pay: Only employees in workplaces where employer provides private sick pay above public statutory sick pay;
Extended leave: Only employees in workplaces where employer allow longer self-declared sick leaves than what is required
by the public sick pay legislation. The table reports a test of the bouncing in the density distribution of earnings (below and
above the cutoff) based on the approach of Cattaneo et al. (2017). The table reports robust and bias-corrected test-estimates
and the corresponding p-values (in parentheses). * and ** denote 5 and 1 percent level of significance, respectively.

34
Table A5 The impact of public sick pay on the duration of sick leaves. 2012. Placebo-analyses
4G 5G 7G 8G
A) MEN
Kinked RD-robust 1.579 0.184 -0.173 1.023
(3.008) (0.985) (0.532) (1.905)
Total observations 31483 39362 46767 41325
Obs. left cutoff 1185 5157 11626 4435
Obs. right cutoff 2428 7912 10184 3972
B) WOMEN
Kinked RD-robust 0.111 0.023 2.047 2.972
(2.463) (0.873) (2.240) (3.207)
Total observations 27571 29998 28374 20748
Obs. left cutoff 2248 7212 3017 1454
Obs. right cutoff 3687 8459 2050 1062 Note: Population: workers employed 2011 and 2012 in private sector NWERS-workplaces, not absent in 2011. Table elements express the parameter estimate of the kinked regression line (above the cutoff) based on the kinked regressions design approach of Cattaneo et al. (2014, 2015, 2016). Dependent variable is sick leave days. Column head denote Cutoff (=pseudo thresholds for public sick pay) is defined at X times the baseline Social Service figure G for 2011 (the real threshold is 6G=475296 NOK=63589.9€=51550.6£). The running variable is measured in 100*log krones (100*(lnearnings-ln(XG)). The table reports robust estimates based on Cattaneo et al. (2014). Pay is measured by the yearly total earnings 2011 (i.e., including bonuses and overtime compensation). * and ** denote 5 and 1 percent level of significance, respectively.

35
Figure 1 The public sick pay in UK and Norway
Note: The figure is based on 2012-legislation and a currency exchange rate of 1£=9.22Nok.

36
Figure 2 Distribution of the sick leave rate. 2011/2012. Kernel densities. Uk and Norway
Note: The sick leave rate is measured by: ln(sr/(1-sr))(= the logit of the sick leave rate). The adjusted sick leave rate take into
account graded sick leaves, i.e., when workers are partly on sick leave (for example, 50%).
0.2
.4.6
De
nsity
-10 -5 0 5 10ln[sick leave rate/(1-sick leave rate) ]
UK
Norway
Norway-adjusted
kernel = epanechnikov, bandwidth = 0.2733

37
Figure 3 The kink at 6G in the Norwegian sick pay legislation. 2012.
Note: Note: Population: workers employed 2011 and 2012 in private sector NWERS-workplaces. Table elements express the
parameter estimate of the kinked regression line (above the cutoff) based on the kinked regressions design approach of
Cattaneo et al. (2014, 2015, 2016). Dependent variable is sick leave days.
05
10
15
20
25
Sic
k leave d
ays
-20 -10 0 10 20Deviation (earnings) from 6G in percentage points
Sample average within bin
Men0
10
20
30
40
Sic
k leave d
ays
-20 -10 0 10 20Deviation (earnings) from 6G in percentage points
Polynomial fit of order 1
Women

38
Figure A1 Bunching at the kink at 6G in the Norwegian sick pay legislation.
Note: Population: workers employed 2011 and 2012 in private sector NWERS-workplaces. Kernel densities of the running
variable in the KRD-analyses (separately for men and women).
0.0
05
.01
.015
.02
De
nsity
-100 -50 0 50100*ln(earnings/6G)
Men Women

39