Embed Size (px)
Citation preview
1
Does Service Predictability Affect Household Welfare and State-Society Relations?
Field Experimental Evidence from Bangalore’s Water Sector*
Tanu Kumar [email protected]
Alison E. Post**
Isha Ray [email protected]
[April 25, 2016 DRAFT; PLEASE DO NOT CITE]
Throughout the developing world, intermittency and unpredictability are the hallmarks of public service delivery. Yet service predictability has received much less attention than patterns of access to, or government expenditures on, these services. Through a cluster-randomized experiment in Bangalore, we examine the effects of introducing a text-message based notification scheme providing households with advance warning of the timing of water services. We assess whether the NextDrop notification system reduced the time spent waiting for water, expenditures on substitutes for piped water services, and stress levels on account of uncertain and irregular deliveries and uncertainty. We also examine if the receipt of real-time information changed how citizens “see the state,” whom they hold responsible for service quality and problems, and whom they approach about service concerns. We find that while the service worked well when piloted in a smaller city near Bangalore, the notifications had little impact when rolled out in Bangalore itself. We attribute this divergence primarily to differences in the degree of cooperation by front line workers. Our findings suggest that extent to which front line worker cooperation drives positive or negative results needs systematic investigation and exposition in experimental studies of local public services. * This project has been funded through a “DIL Innovate” grant through the Development Impact Laboratory, Blum Center for Developing Economies, U.C. Berkeley (USAID Cooperative Agreement AID-OAA-A-13- 00002). We thank C. Sharada Prasad, Zachary Burt, Francesc Pardo, Mary Rose Fissinger, and Megan Otsuka for their considerable contributions to this project. We also thank Maria Chang, Eugenia Giraudy, S. Krishna Kumar, Rajani Sampath, and Christine Thao Tyler for research assistance. We also thank Ben Arnold, Adam Auerbach, Jennifer Bussell, Pradeep Chhibber, Thad Dunning, Christopher Hyun, Francesca Jensenius, Katerina Linos, Aila Matanock, Malini Ranganathan, Jasjeet Sehkon, Laura Stoker, Erik Wibbels, seminar participants at U.C. Berkeley and Duke, and especially Joel Middleton and Guadalupe Tunon for advice. We also thank NextDrop, the Public Affairs Foundation (esp. Lalita Pulavarti and Narendra LV), and the Bangalore Water Supply and Sewerage Board for their collaboration with the project. The project has been approved through IRB protocol 2014-04-6259 and approved by BWSSB, the Bangalore water utility. Pre-Analysis Plan ID 20150514AA registered with egap.org. **Corresponding author.
2
Introduction
Throughout the developing world, intermittency and unpredictability are the
hallmarks of public service delivery: buses do not run on a standard schedule, water
supplies are variable in terms of arrival times, and electricity blackouts occur
unexpectedly. For instance, 400 million people worldwide rely on intermittent water,
often receiving services only a few days a week for a few hours (van den Berg and
Danilenko 2011). Moreover, the poor state of the underlying urban infrastructure—prone
to unexpected pipe leaks and power outages that put pumps out of service—often means
that services are not only intermittently delivered, but are also unpredictable. Yet the
causes and consequences of unpredictable urban services have received much less
attention than patterns of access to, or government expenditures on, these services.
In this paper, we examine the effect of an intervention designed to increase
service predictability on household welfare and on citizens’ relationship with the local
state. There are strong reasons to expect that improving service predictability will
improve household welfare, particularly for low-income households. Buses that do not
arrive on time or on a standard schedule can make it difficult to consistently arrive at
work on time; lower income populations who cannot afford personal cars or private taxis
are more likely to develop reputations as unreliable employees under such circumstances
(e.g. Smith 2007). Coping with electricity blackouts is also more difficult for poorer
households, who often cannot afford private generators (UNDP 2010). Similarly, low-
income households receiving intermittent and unpredictable water services suffer in a
number of ways: they must spend time waiting at home for water to arrive and then fill
household storage containers, as substitutes such as vended water tend to be more

3
expensive than municipal water. Service unpredictability may also weaken bonds
between individuals the state. Citizens who cannot depend upon regular services may be
less likely to view government service providers as competent and respectful of citizen
concerns. If citizens see (or think) that those with stronger political connections find it
easier to obtain information regarding when services might resume, they will not see the
state as universalistic. They may also direct inquiries to local intermediaries, such as
neighborhood leaders or party brokers, rather than to state agencies themselves.
Our study examines the household-level impact of delivering prior notification
regarding the arrival of water at household taps and communal standpipes. Through a
cluster-randomized experiment in Bangalore, we evaluate the impact of a service
developed by a social enterprise called NextDrop, which provides households with text
message notifications regarding water arrival times and supply cancellations. Water
utilities in the developing world typically do not possess sensors that allow them to
monitor exactly where water is within their network. NextDrop developed a novel system
in which the “valvemen,” or utility employees who operate the valves allowing water to
flow into areas of 50-200 households, notify them when they are opening and closing
valves. NextDrop then sends notifications to individual households, which they have
cataloged by “valve area” through the collection of household GPS coordinates.
While NextDrop’s pilot of their system in the second-tier Indian city of Hubli-
Dharwad was successful, our study of their recent rollout in Bangalore suggests that their
services had no significant impacts on households. This discrepancy, we will show,
stems primarily from differences in the behavior of the utility’s valvemen between the
two contexts. While NextDrop was able to incentivize valvemen to provide them with
4
sufficiently frequent and accurate valve opening and closing time data in Hubli-Dharwad,
they proved unable to do so in Bangalore.
The fact that the ‘same’ development intervention performed well in one city and
poorly in another underscores the importance of systematically investigating the extent to
which front line workers drive both positive and null results in experimental studies. The
international development community increasingly promotes randomized controlled trials
(RCTs) to assess the efficacy of new technologies or programs prior to funding or
promoting general rollouts. This trend reflects the ability of well-executed RCTs to avoid
long-standing problems in program evaluation, such as self-selection biases of
individuals and jurisdictions that voluntarily opt into new programs.
More often than not, development interventions evaluated are embedded within
particular organizational and political contexts. In particular, front line workers assist
with or manage the implementation of the interventions under investigation. In some
cases, evaluations are conducted in partnership with the same types of organizations that
administer programs under a general rollout, but evaluations are limited to particular
sites. In other cases, researchers or funders may commission “implementing partners” to
administer an intervention, such as a civic education or vaccination program, to treatment
group households. In either case, the cooperation of, and choices made by, front line
workers and implementing partners are crucial to explaining the success or failure of
development interventions. Yet few articles discuss the extent to which RCT results of
RCTs depend upon their contribution, especially in cases where the interventions are
deemed successful.
5
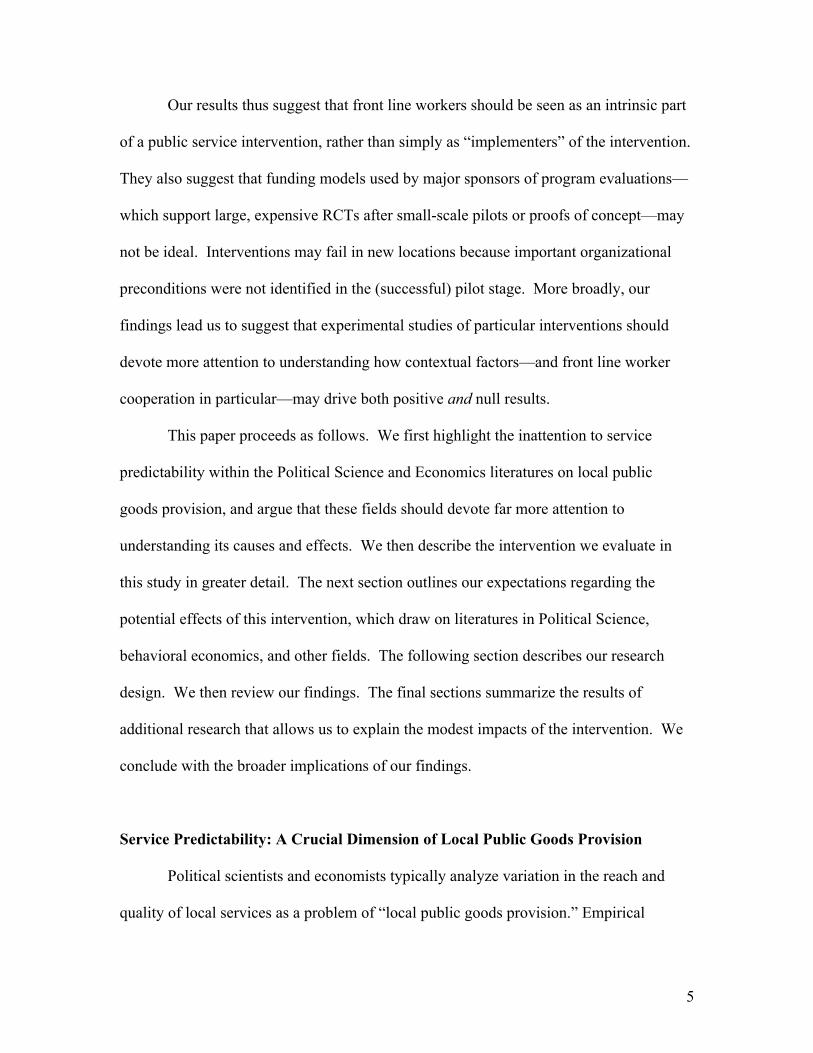
Our results thus suggest that front line workers should be seen as an intrinsic part
of a public service intervention, rather than simply as “implementers” of the intervention.
They also suggest that funding models used by major sponsors of program evaluations—
which support large, expensive RCTs after small-scale pilots or proofs of concept—may
not be ideal. Interventions may fail in new locations because important organizational
preconditions were not identified in the (successful) pilot stage. More broadly, our
findings lead us to suggest that experimental studies of particular interventions should
devote more attention to understanding how contextual factors—and front line worker
cooperation in particular—may drive both positive and null results.
This paper proceeds as follows. We first highlight the inattention to service
predictability within the Political Science and Economics literatures on local public
goods provision, and argue that these fields should devote far more attention to
understanding its causes and effects. We then describe the intervention we evaluate in
this study in greater detail. The next section outlines our expectations regarding the
potential effects of this intervention, which draw on literatures in Political Science,
behavioral economics, and other fields. The following section describes our research
design. We then review our findings. The final sections summarize the results of
additional research that allows us to explain the modest impacts of the intervention. We
conclude with the broader implications of our findings.
Service Predictability: A Crucial Dimension of Local Public Goods Provision
Political scientists and economists typically analyze variation in the reach and
quality of local services as a problem of “local public goods provision.” Empirical
6
scholarship within the local public goods literature has focused primarily on explaining
levels of government expenditure, the efficiency of service delivery, and service access,
including the geographic allocation of such goods and services within larger
jurisdictions.1 Alesina et al.’s classic 1999 study, for example, examines the relationship
between ethnic diversity and public expenditure. More recently, Baldwin and Huber’s
prominent 2010 study examines the association between ethnic diversity and expenditure
on and access to public goods. In contrast, Banerjee and Somanathan (2007) find that in
rural India, social heterogeneity is not a good predictor of local public goods provision,
which they measure through access to public facilities and infrastructure. Service
intermittency and predictability, however, have received very little attention in this
literature.2
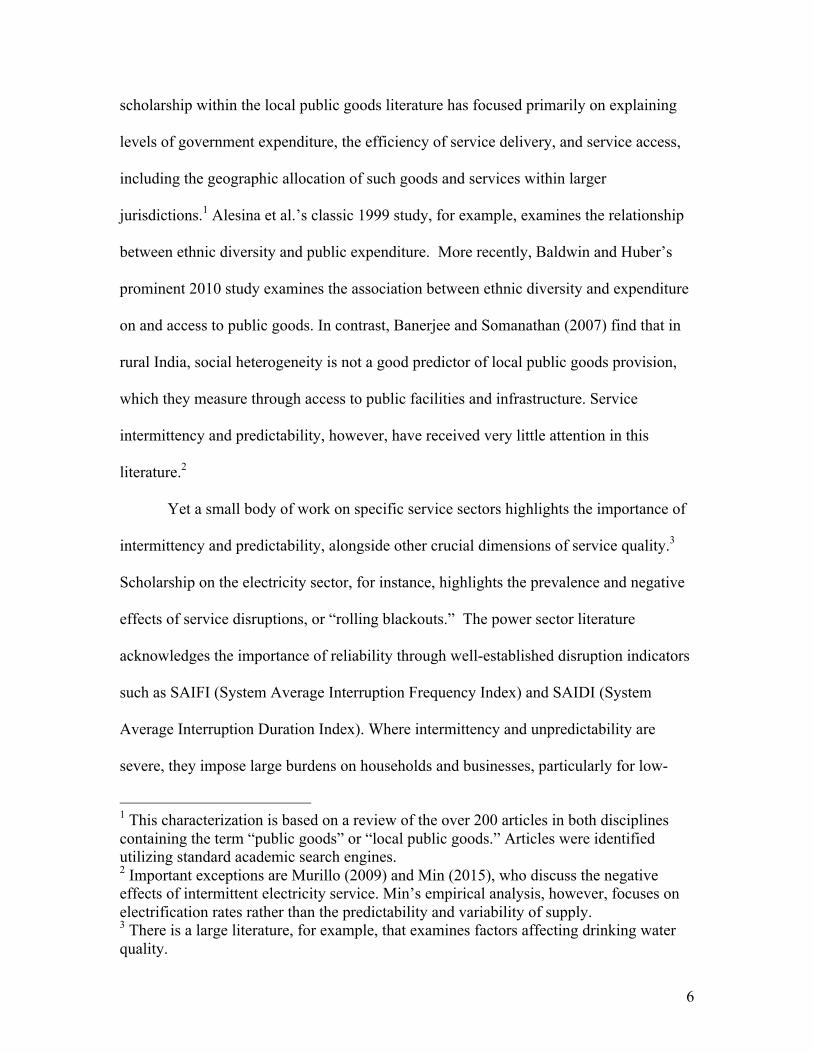
Yet a small body of work on specific service sectors highlights the importance of
intermittency and predictability, alongside other crucial dimensions of service quality.3
Scholarship on the electricity sector, for instance, highlights the prevalence and negative
effects of service disruptions, or “rolling blackouts.” The power sector literature
acknowledges the importance of reliability through well-established disruption indicators
such as SAIFI (System Average Interruption Frequency Index) and SAIDI (System
Average Interruption Duration Index). Where intermittency and unpredictability are
severe, they impose large burdens on households and businesses, particularly for low-
1 This characterization is based on a review of the over 200 articles in both disciplines containing the term “public goods” or “local public goods.” Articles were identified utilizing standard academic search engines. 2 Important exceptions are Murillo (2009) and Min (2015), who discuss the negative effects of intermittent electricity service. Min’s empirical analysis, however, focuses on electrification rates rather than the predictability and variability of supply. 3 There is a large literature, for example, that examines factors affecting drinking water quality.
7
income groups who cannot “opt out” by purchasing private generators that kick in when
utility services are down (UNDP 2010).
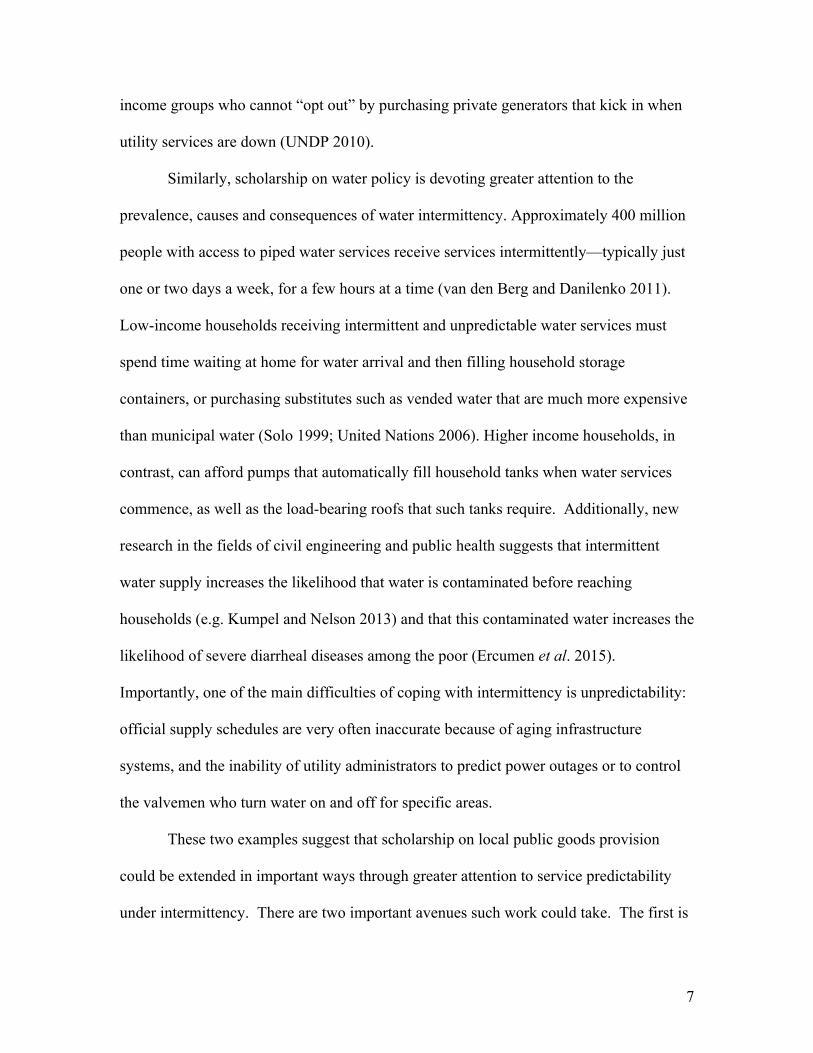
Similarly, scholarship on water policy is devoting greater attention to the
prevalence, causes and consequences of water intermittency. Approximately 400 million
people with access to piped water services receive services intermittently—typically just
one or two days a week, for a few hours at a time (van den Berg and Danilenko 2011).
Low-income households receiving intermittent and unpredictable water services must
spend time waiting at home for water arrival and then filling household storage
containers, or purchasing substitutes such as vended water that are much more expensive
than municipal water (Solo 1999; United Nations 2006). Higher income households, in
contrast, can afford pumps that automatically fill household tanks when water services
commence, as well as the load-bearing roofs that such tanks require. Additionally, new
research in the fields of civil engineering and public health suggests that intermittent
water supply increases the likelihood that water is contaminated before reaching
households (e.g. Kumpel and Nelson 2013) and that this contaminated water increases the
likelihood of severe diarrheal diseases among the poor (Ercumen et al. 2015).
Importantly, one of the main difficulties of coping with intermittency is unpredictability:
official supply schedules are very often inaccurate because of aging infrastructure
systems, and the inability of utility administrators to predict power outages or to control
the valvemen who turn water on and off for specific areas.
These two examples suggest that scholarship on local public goods provision
could be extended in important ways through greater attention to service predictability
under intermittency. There are two important avenues such work could take. The first is
8
to focus on service predictability as an outcome to be explained. While this has been
difficult historically due to data constraints, the advent of crowd-sourced and remote
sensing data, as well as the installation of low cost sensors in many utility networks, is
making this more feasible.4 A second avenue of research is to examine how service
predictability affects other outcomes of interest. Service predictability is likely to affect
household welfare for many of the reasons illustrated above in the cases of water and
electricity. Political behavior or attitudes may also vary with the extent to which citizens
receive services regularly. Voters may be less likely to vote for an incumbent who
cannot make the “trains run on time.” They may also turn to intermediaries such as party
brokers for information on when services will arrive, particularly if supplies are limited.
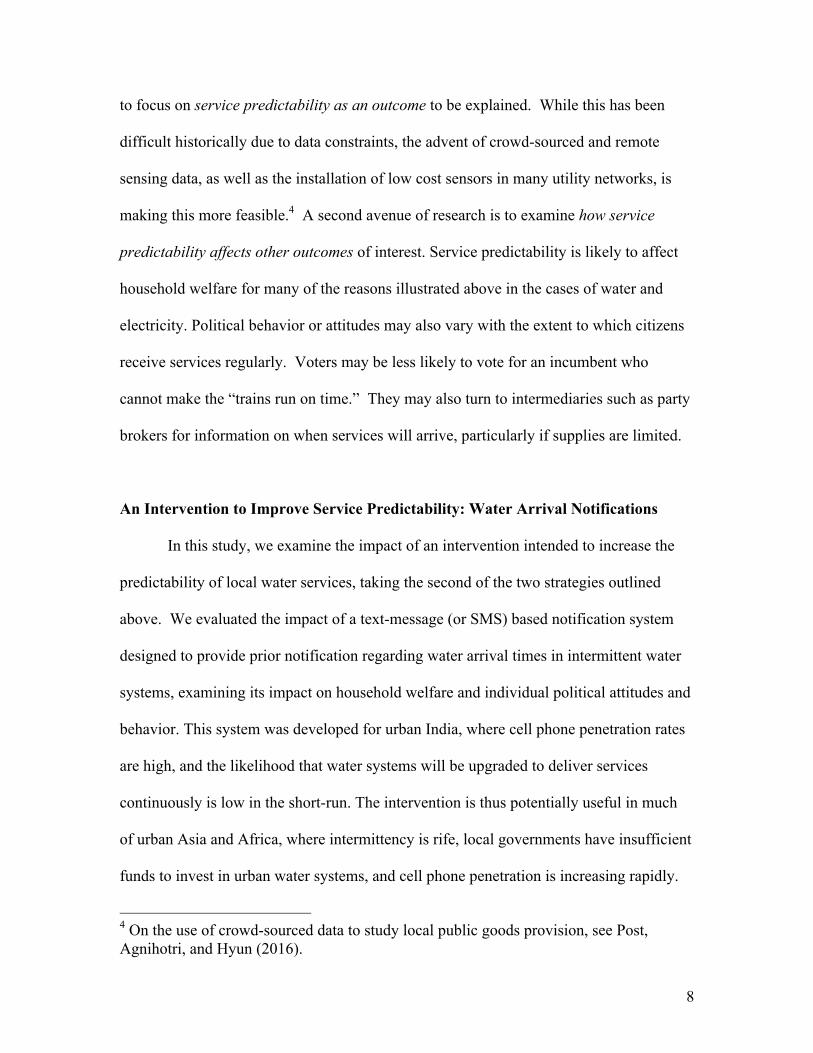
An Intervention to Improve Service Predictability: Water Arrival Notifications
In this study, we examine the impact of an intervention intended to increase the
predictability of local water services, taking the second of the two strategies outlined
above. We evaluated the impact of a text-message (or SMS) based notification system
designed to provide prior notification regarding water arrival times in intermittent water
systems, examining its impact on household welfare and individual political attitudes and
behavior. This system was developed for urban India, where cell phone penetration rates
are high, and the likelihood that water systems will be upgraded to deliver services
continuously is low in the short-run. The intervention is thus potentially useful in much
of urban Asia and Africa, where intermittency is rife, local governments have insufficient
funds to invest in urban water systems, and cell phone penetration is increasing rapidly.
4 On the use of crowd-sourced data to study local public goods provision, see Post, Agnihotri, and Hyun (2016).
9
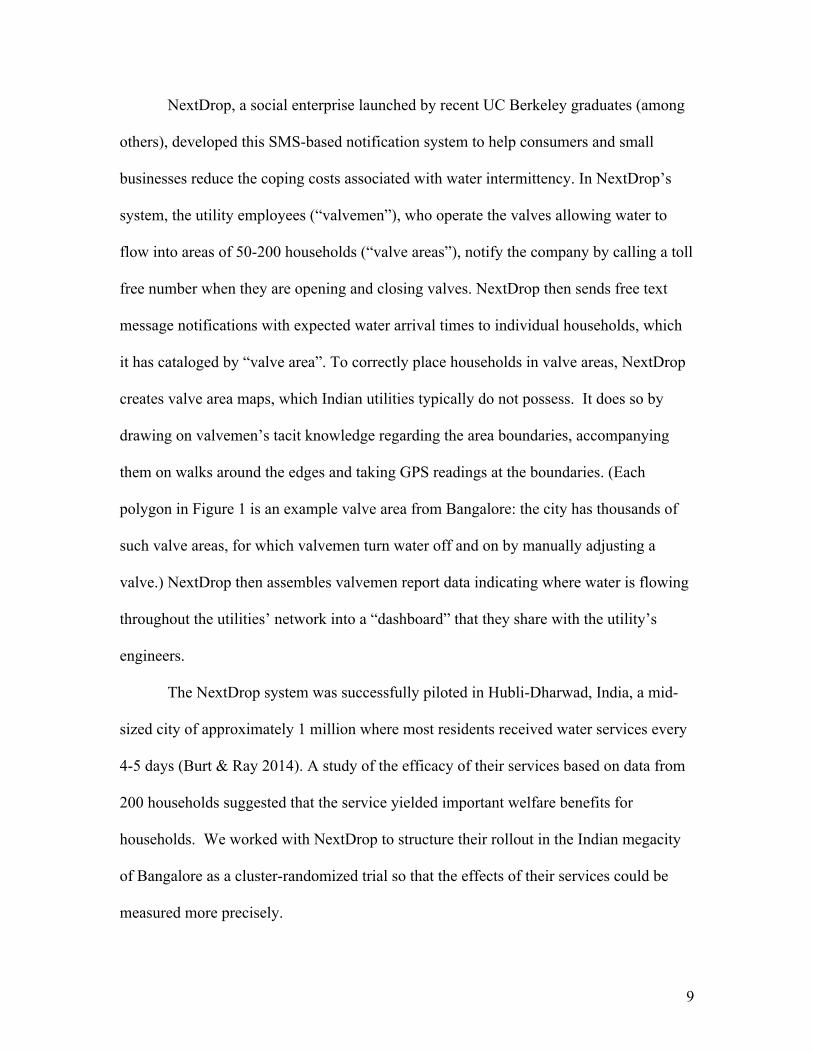
NextDrop, a social enterprise launched by recent UC Berkeley graduates (among
others), developed this SMS-based notification system to help consumers and small
businesses reduce the coping costs associated with water intermittency. In NextDrop’s
system, the utility employees (“valvemen”), who operate the valves allowing water to
flow into areas of 50-200 households (“valve areas”), notify the company by calling a toll
free number when they are opening and closing valves. NextDrop then sends free text
message notifications with expected water arrival times to individual households, which
it has cataloged by “valve area”. To correctly place households in valve areas, NextDrop
creates valve area maps, which Indian utilities typically do not possess. It does so by
drawing on valvemen’s tacit knowledge regarding the area boundaries, accompanying
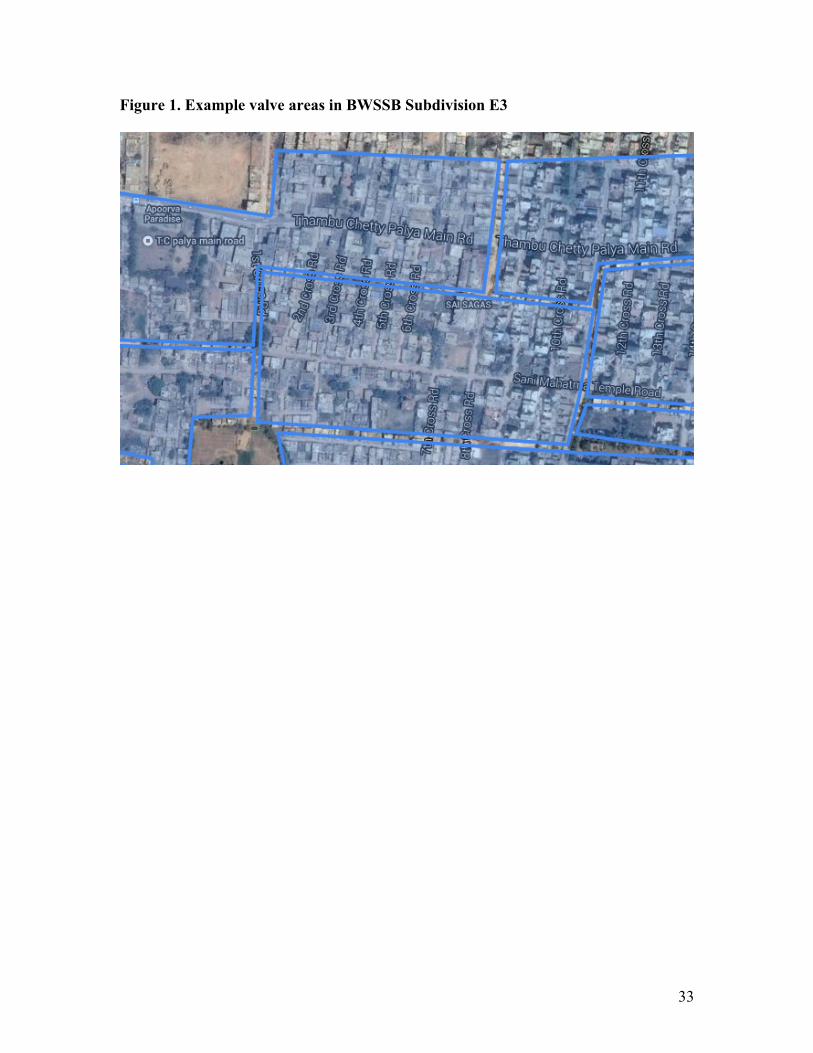
them on walks around the edges and taking GPS readings at the boundaries. (Each
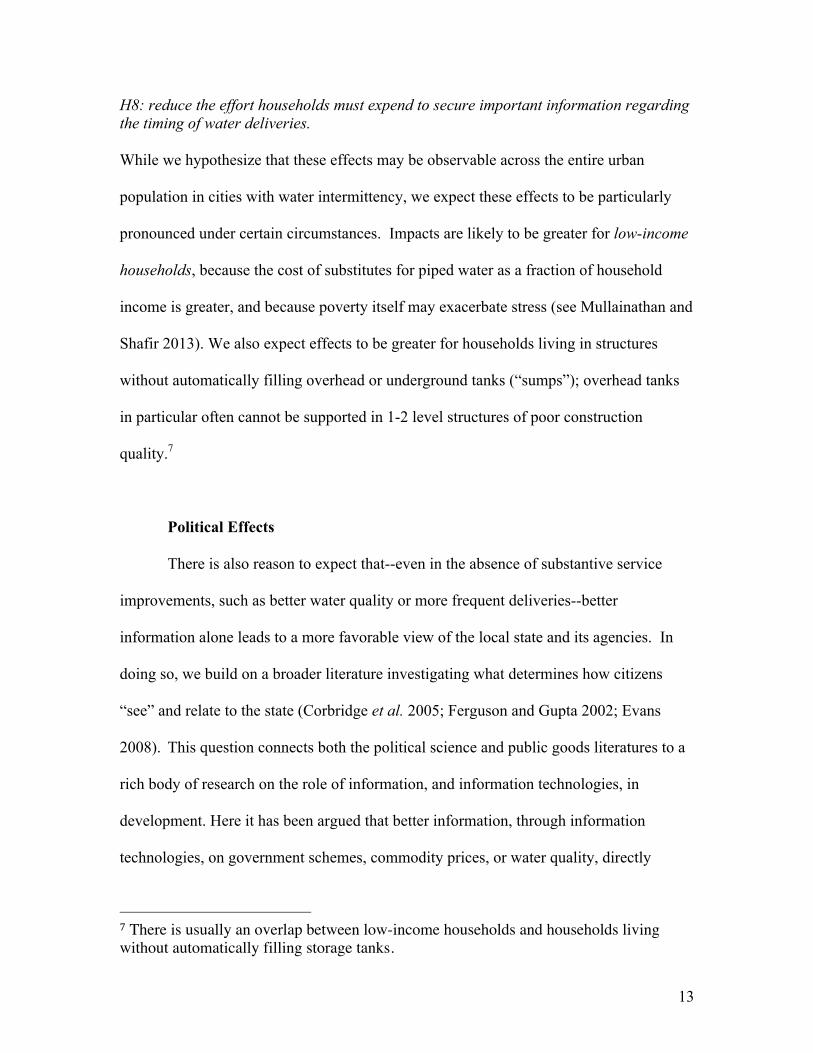
polygon in Figure 1 is an example valve area from Bangalore: the city has thousands of
such valve areas, for which valvemen turn water off and on by manually adjusting a
valve.) NextDrop then assembles valvemen report data indicating where water is flowing
throughout the utilities’ network into a “dashboard” that they share with the utility’s
engineers.
The NextDrop system was successfully piloted in Hubli-Dharwad, India, a mid-
sized city of approximately 1 million where most residents received water services every
4-5 days (Burt & Ray 2014). A study of the efficacy of their services based on data from
200 households suggested that the service yielded important welfare benefits for
households. We worked with NextDrop to structure their rollout in the Indian megacity
of Bangalore as a cluster-randomized trial so that the effects of their services could be
measured more precisely.
10
Theoretical Discussion and Hypotheses
This project draws on several literatures from political science, behavioral
economics and development studies that speak to the potential effects of improving the
predictability of urban services—and NextDrop’s notifications in particular—on: a)
household welfare; and b) citizens’ relationship with the state. Building on these
literatures, we focused our study on two sets of hypotheses. As our discussion of
potential heterogeneous treatment effects will suggest, however, there are reasons to
expect household welfare effects and political effects to be related.5 Households that
experience a change in welfare indicators such as reduced time waiting for water will
presumably be more likely to exhibit changes in political attitudes and behavior.
Household Welfare Effects
The water policy literatures suggest that intermittent water supply imposes
significant costs on households. While some researchers have studied the effects of water
service intermittency on water quality and human health (e.g. Kumpel and Nelson 2013;
Ercumen et al. 2015), few have quantified or modeled the coping costs and inefficiencies
associated with unreliable water deliveries.6 This is the first study, to our knowledge, that
estimates empirically the impacts of greater predictability of intermittent water services.
The first set of coping costs we examine relate to the time spent waiting for water
services to commence. In low income households that cannot afford maids or
5 Our hypotheses and research design were recorded in pre-analysis plan 20150514AA, registered with EGAP prior to the receipt of our baseline data. 6 For exceptions, see Zérah (2000) and Baisa et al. (2010).
11
automatically-filling storage tanks, household members—and particularly women—may
need to restrict their activities to the household for substantial periods of time in order to
ensure they are at home, and thus able to store water, whenever water services commence
(e.g. Zérah 2000). The “waiter” thus devotes time to waiting for water that might
otherwise be spent on work, community activities, religious functions, etc. Receiving
notifications regarding the time of water delivery on a given supply day, or a notification
of supply cancellation, it stands to reason, would reduce the amount of time spent waiting
and allow more time for these other activities. This leads us to a first set of hypotheses.
If household members receive accurate prior notifications regarding delivery times and service disruptions, they will: H1: spend less time waiting for water on a weekly basis H2: be better able to participate in community, social or religious activities H3: be less likely to forego earnings. The literature on urban water supply also documents the extent to which water
obtained through a city’s piped water network costs less than substitutes such as bottled
water and bulk water from water vendors (e.g. Estache et al. 2001; United Nations 2006).
Obtaining substitute sources, especially at short notice, requires time and energy spent
fetching and carrying water from wells, or arranging for special deliveries with vendors,
etc. (Kjellén and McGranahan 2006). In light of these studies, we would expect that
notifications regarding the timing of water delivery would reduce the necessity to rely
upon substitutes, because they would decrease the probability of missing a supply period.
This leads us to a second set of hypotheses.
12
Receiving accurate prior notifications regarding water delivery times and service disruptions will: H4: reduce HH expenditure on substitutes, such as bottled, vended, or tanker-supplied water H5: reduce the effort households spend securing alternative sources of water. Finally, waiting for water and supply unpredictability may impose psychological
costs. Given that water is such a vital resource for households, and that substitutes for
piped water can be much more expensive or less desirable, the household member
responsible for obtaining and managing a household’s water supply may incur a great
deal of stress when services are unpredictable or water storage cannot be planned. This
argument builds directly on empirical studies of psychosocial stress related to water
insecurity (e.g., Wutich and Ragsdale 2008; Stevenson et al 2012), as well as the
behavioral economics literature, which has shown that many dimensions of poverty
impose cognitive stresses upon the poor (e.g. Mullainathan and Shafir 2013). Such
stresses manifest themselves in a number of ways: consciously worrying about water
provision, preoccupation (i.e. thinking about water delivery while doing other things), or
stress incurred through the hassle of repeatedly trying to obtain information regarding
water supply from utility valvemen, or local intermediaries such as neighborhood leaders.
This leads us to a third set of hypotheses.
Receiving accurate prior notifications regarding water delivery times and service disruptions will: H6: reduce respondents’ sense that missing or delayed water supply is a constant worry H7: reduce the extent to which respondents finding themselves thinking about water supply while doing other things, such as household chores or paid work
13
H8: reduce the effort households must expend to secure important information regarding the timing of water deliveries. While we hypothesize that these effects may be observable across the entire urban
population in cities with water intermittency, we expect these effects to be particularly
pronounced under certain circumstances. Impacts are likely to be greater for low-income
households, because the cost of substitutes for piped water as a fraction of household
income is greater, and because poverty itself may exacerbate stress (see Mullainathan and
Shafir 2013). We also expect effects to be greater for households living in structures
without automatically filling overhead or underground tanks (“sumps”); overhead tanks
in particular often cannot be supported in 1-2 level structures of poor construction
quality.7
Political Effects
There is also reason to expect that--even in the absence of substantive service
improvements, such as better water quality or more frequent deliveries--better
information alone leads to a more favorable view of the local state and its agencies. In
doing so, we build on a broader literature investigating what determines how citizens
“see” and relate to the state (Corbridge et al. 2005; Ferguson and Gupta 2002; Evans
2008). This question connects both the political science and public goods literatures to a
rich body of research on the role of information, and information technologies, in
development. Here it has been argued that better information, through information
technologies, on government schemes, commodity prices, or water quality, directly
7 There is usually an overlap between low-income households and households living without automatically filling storage tanks.
14
influences citizens’ views of the state (though not necessarily in a positive direction)
(Madon and Sahay 2002; Tolbert and Mossberger 2006).
Our first intuition is that increasing the predictability of services will lead citizens
to revise their judgments of state competence. Even if services are still delivered
intermittently, and with less frequency than citizens may desire, receiving accurate, prior
information regarding service timing (and cancellations) should not only make services
easier to access, but also convey greater state capacity and control. In addition, the
innovative application of text messaging to disseminate service schedule information to
citizens could make the state seem more “modern,” and thus further improve citizen
perceptions of governmental competence (Harriss 2006; Kuriyan and Ray 2009; Ghertner
2011). This leads us to the following hypotheses.
Receiving accurate prior notifications regarding water delivery times and service disruptions will: H9: improve citizen perceptions of the competence of state water providers. H10: lead citizens to perceive state water providers as more innovative and modern than previously. We also expect notifications that increase service predictability to shift citizen
perceptions regarding who is responsible for addressing their concerns regarding
services, and the state’s level of universalism. The literature on citizen-state interactions
in the developing world suggests that citizens (and especially low and middle income
populations) tend to turn to lower level bureaucrats or political intermediaries regarding
service problems.8 When such mechanisms do not work, a group of households and
8 On the Bangalore case, see Ranganathan (2014); on similar dynamics elsewhere in India, see Berenschot (2010) and Krishna (2011). On the importance of intermediaries
15
community leaders may collectively protest at government offices.9 These patterns may
slowly shift with the introduction of a universally administered notification system that
connects citizens more directly to the urban service provider. Citizens are more likely to
view government agencies themselves, rather than their local intermediaries, as
responsible for addressing their problems, and redirect their complaints (or lodge
additional complaints) with government bureaucracies.
This shift would be tied, at least in part, to an increasing sense that notifications
are sent not just to favored groups, but also to marginalized populations. It would also
stem from the fact that information is arriving automatically, without effort on the part of
the citizen; it no longer requires cumbersome and time-consuming efforts to proactively
solicit information—which may even involve reliance upon personal connections, favors,
or bribes. To the extent that this perceptual shift occurs, we would expect that more
people would lodge individual (rather than group-only) complaints, thinking that their
complaints will be heard. These intuitions lead us to the following hypotheses.
Receiving accurate prior notifications regarding water delivery times and service disruptions will: H11: lead citizens to be more likely to perceive state water providers as more universalistic service providers that care about “people like us” H12: lead citizens to view state water providers as directly responsible for correcting service problems than previously, when local political leaders and/or intermediaries might have been held responsible H13: lead citizens to be more likely to contact the central water bureaucracy directly than previously
within clientelistic party systems in the developing world, see Stokes et al. (2013) for a review. 9 See Ranganathan (2014) regarding water protests in Bangalore; see also Auerbach (2016) regarding urban services in Indian cities.
16
While we hypothesize that these effects may be observable across the entire urban
population in cities with water intermittency, we expect these effects to be particularly
pronounced under certain circumstances. Effects may be particularly strong among
households that consider themselves marginal in religious, social (e.g. caste), or linguistic
terms, because they are less likely to have politically influential intermediaries prior to
the intervention. 10 We also expect effects to be stronger for populations that experience
greater coping costs, such as households with less money to buy substitutes for tap water,
and those without automatically-filling overhead or underground storage tanks.
Research Design
We evaluated the effects of NextDrop’s notifications in the context of the
organization’s rollout in the Indian city of Bangalore, a megacity of over 8 million that is
often called India’s Silicon Valley. This section outlines the main feature of our study
design, which consisted of a cluster-randomized field experiment conducted during 2015.
Study Site Characteristics
We conducted our impact evaluation in a socio-economically diverse section of
Bangalore chosen to maximize similarities with other Indian urban centers. Nextdrop had
recently received approval from the Bangalore Water Supply and Sewerage Board
10 We expect this to be the case even though recent studies suggest that India’s marginal populations are now better able to exert pressure upon the state than previously (e.g. Corbridge et al. 2005; Banerjee & Somanathan 2007).
17
(BWSSB) to introduce services in the city through a staged rollout.11 Because NextDrop
was required to serve at least 2/3 of the city by the end of 2014 under the terms of a DFID
grant—in addition to the firm’s desire to respond to BWSSB’s request to roll out
quickly—we were asked to restrict our evaluation to only one of the utility’s 32
subdivisions. We therefore limited our search to utility subdivisions not scheduled for
immediate expansion, which restricted us primarily to areas outside the city center.
Because water services are typically more intermittent and unreliable further from the
city center, this meant we were considering areas where the intervention was more likely
to have an impact. It also meant that our study location was more likely to possess water
supply conditions typical of urban India more broadly, as BWSSB performs well in
relation to other South Asian utilities according to benchmarking exercises and research
reports (Connors 2005; McKenzie and Ray 2009).
After review of the limited (and only somewhat accurate) available government
data on low-income settlements and population densities in Bangalore, and extensive site
visits throughout the city in the summer and fall of 2014, we chose to conduct our
evaluation in BWSSB subdivision E3. Exploratory fieldwork during summer 2014
increased our confidence in our original intuitions that the impacts of NextDrop’s
services were likely to be higher in low-income areas with residential structures of 1-2
stories, because the roofs for such buildings typically cannot support overhead storage
tanks. We thus sought a utility subdivision that contained a diverse population (where
roughly 1/3 of our sample could be drawn from the bottom third of the city’s income
11 NextDrop signed a memorandum of understanding with the state water utility providing water and sanitation services in the city, Bangalore Water Supply and Sewerage Board (BWSSB), in May 2014, allowing it to collect information from BWSSB valvemen and provide notifications throughout the city.
18
distribution), and that still possessed a reasonable number of low rise structures—a type
of building environment that is growing less common in megacities like Bangalore, but is
typical of urban India more generally. This subdivision possessed the ideal combination
of some low-rise residential neighborhoods, as well as several low and middle-income
neighborhoods of sufficient size.12 Data from our baseline survey suggests that
approximately 33% of the area’s residents – 14% of whom include recent migrants from
states such as Tamil Nadu, Andhra Pradesh – could be classified as Bangalore’s bottom
third of the income distribution. Over 85% of residents receive services 1-2 times a week,
which is typical for urban India and also frequent enough that it is likely we could
observe the notifications having an effect on our outcomes of interest, if they are indeed
useful for households. Moreover, 28% of residents possessed neither an overhead tank
nor sump, making it difficult to store water for use during times of no service. The area
thus promised to allow us to analyze how the impact of NextDrop’s intervention may
vary according to the variety of criteria we had outlined, and in a setting that is
reasonably representative for urban India.13
Randomization and Sampling Strategies
Within BWSSB subdivision E3, we employed a cluster-randomized experimental
design. We chose a cluster-randomized design, rather than one with household-level
randomization, because of concerns regarding information sharing between treatment and
12 As subsequent sections will explain, we employ a skip of 3 between sampled households, which increases the size of the low-income areas required to obtain a sufficiently large sample from low-income groups. 13 Data from our baseline survey will allow us to compare in more precise terms the E3 population with the Indian urban population more generally.
19
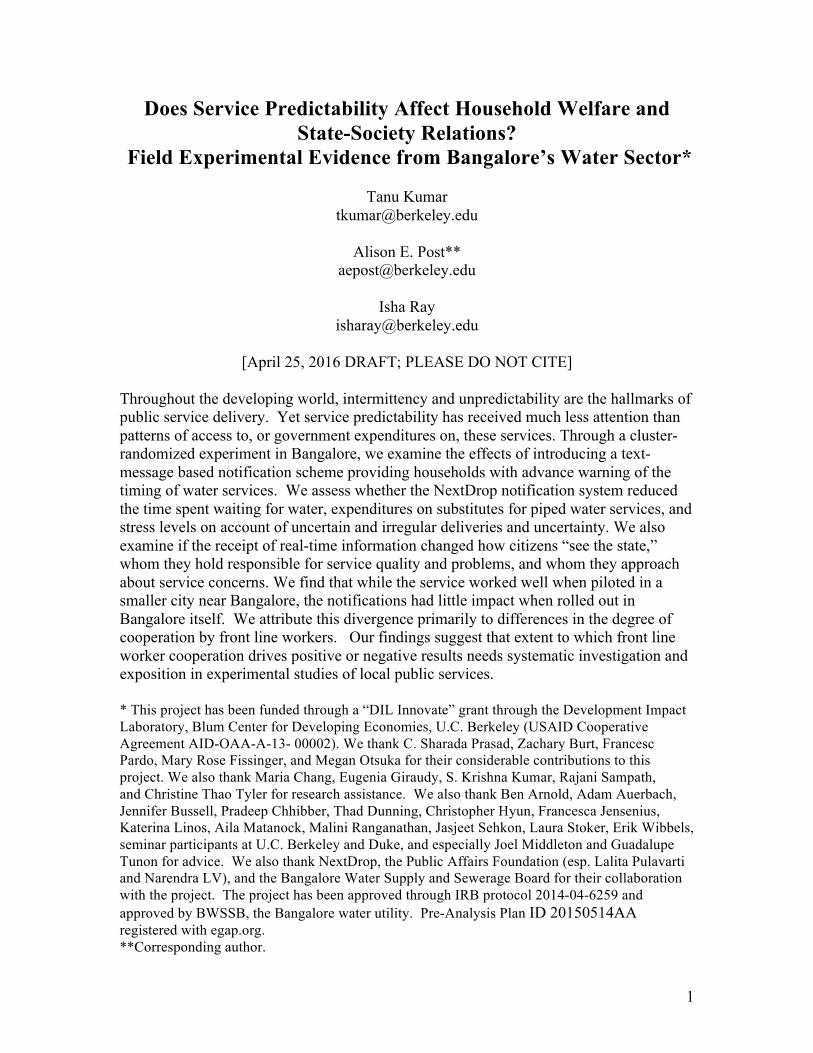
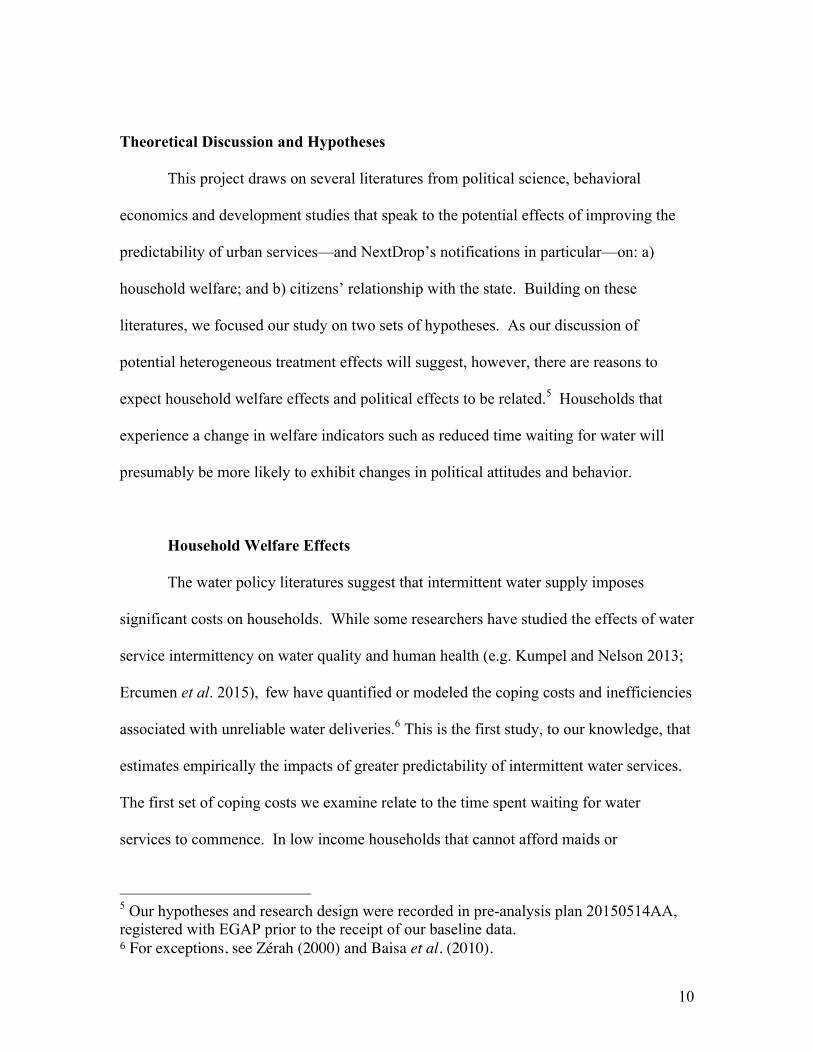
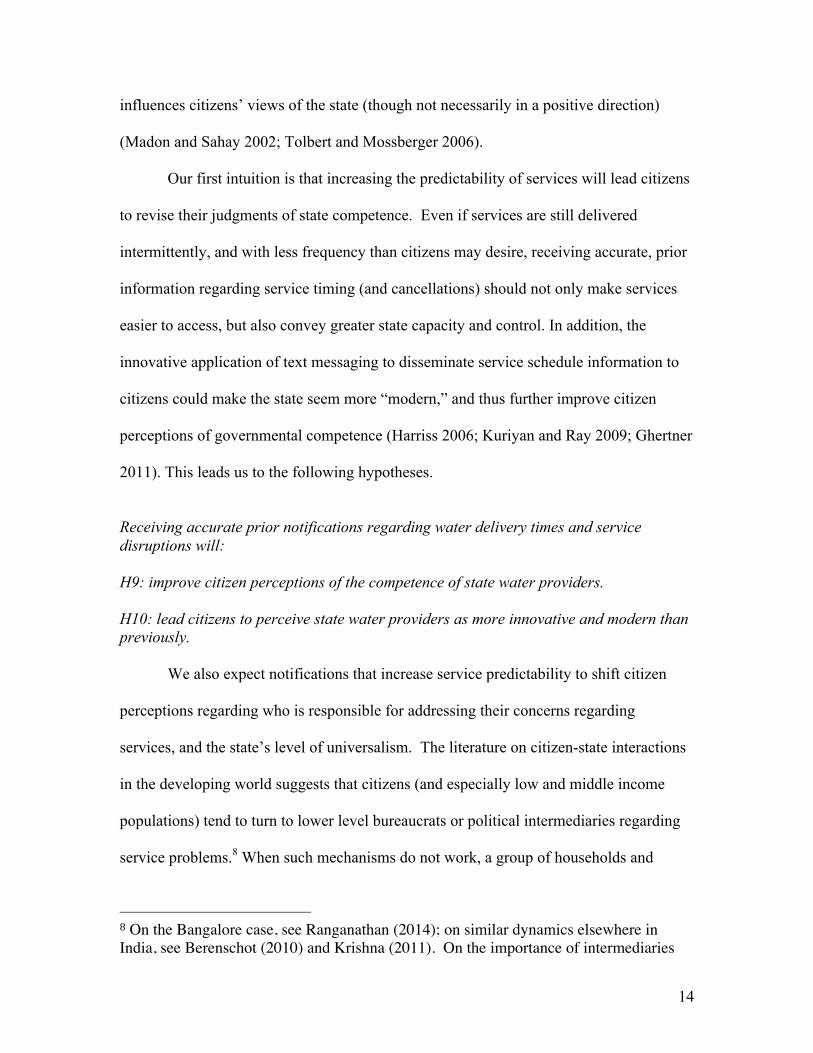
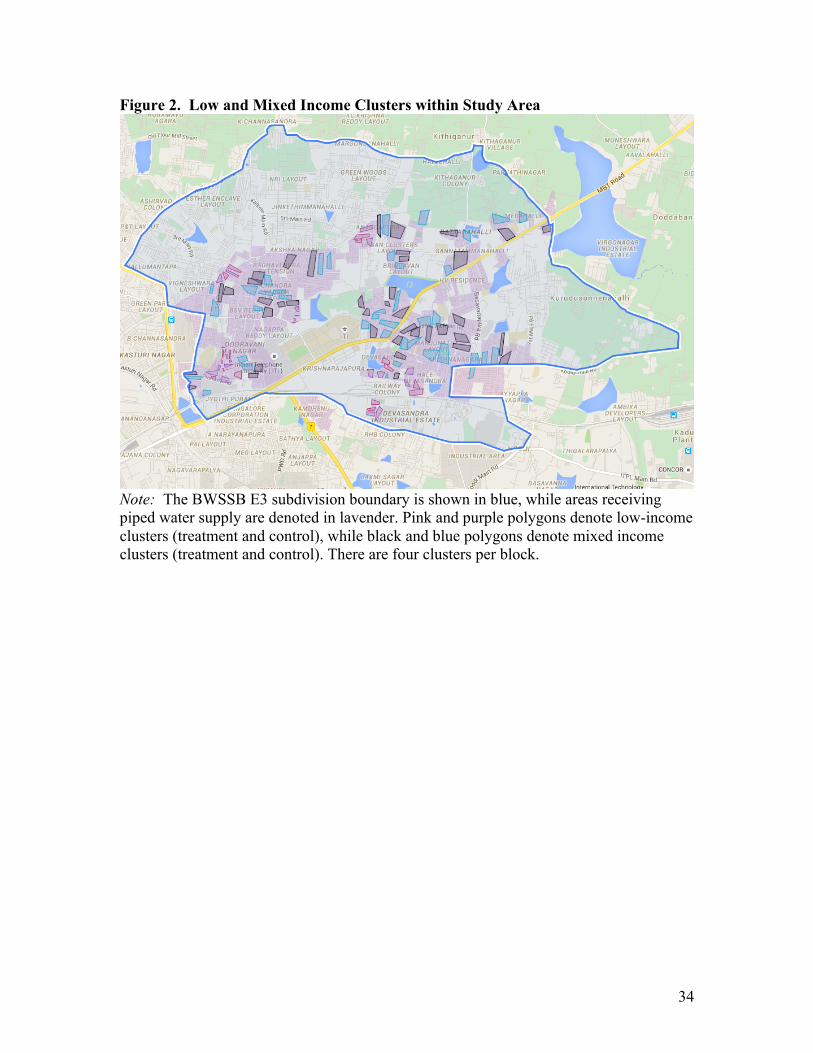
control households.14 We separated clusters of households in our study from one another
by at least two streets so as to create physical buffers preventing information sharing
between our treatment and control groups (Figure 2). Because information on water
arrival times is only relevant to individuals within the same valve areas (typically only 50
to 200 households), individuals would have little incentive to share information with
those living in other clusters.15 After conducting power calculations using pilot data, we
decided to separate a sample of 3000 households into 120 clusters. The study was
powered in order to capture a significant reduction in the time spent waiting for water.16
Because blocking on a variable associated with the outcome of interest can
improve the precision of causal estimates in the context of cluster-randomized
experiments (Imbens 2011), we employed a geographic approach to stratification. Based
on site surveys, we designated 30 geographic areas with a particular socio-economic
character, either low income (10 blocks) or mixed income (20 blocks). We expected
blocks in either one of these two categories to be similar not only in socio-economic
terms, but also in terms of the state of the underlying water infrastructure. By blocking on
socio-economic geography, we thus laid the groundwork for analyses of subsets of the
14 Our concerns regarding interference under household-level randomization were heightened when we conducted a small phone survey of existing NextDrop consumers in utility subdivision NE3, asking if information was shared with immediate neighbors. Those who found the service useful said they shared information. In small survey pilots in E3, we also found that information of various types is shared with immediate neighbors, particularly in low-income neighborhoods. 15 In an ideal world, we would have randomized assignment to valve areas rather than clusters we ourselves designated. After extensive discussions with our survey team, however, we realized that valve area randomization would be unworkable in practice. Valve area boundaries are not visible above ground and do not follow the street layout. Survey enumerators would therefore have had difficulty understanding the boundaries, even if drawn on maps. As discussed below, substituting cluster-level for valve area randomization led to only minimal spillovers. 16 For more details, see our pre-analysis plan.
20
data corresponding to areas where we expect to observe stronger effects: areas with
poorer residents and with poorer quality water infrastructure.
Blocks and clusters were designated following preliminary fieldwork by our
team, which involved extensive site visits throughout E3.17 Within each of these blocks,
we outlined four clusters separated by two streets or lanes from one another.18 Cluster
boundaries were drawn so that clusters within a block were very similar to one another in
terms of socio-economic mix. Within each block, we randomized two clusters to
treatment and two to control.19
Within each cluster, we utilized systematic sampling, employing a skip of three
between households on every street. After piloting the survey in low-income areas, we
decided that a skip of three between households would be sufficient to avoid group
interview sessions in which neighbors group together to ‘help’ respondents answer
survey questions. The skip of three was also sufficiently small to allow us to still obtain a
sample of 25 households per cluster, despite the fact that our clusters were quite small in
17 As mentioned previously, fine-grained census data on income does not exist for urban India. Our team therefore relied on visual cues such as dwelling type, number and type of vehicles parked along streets, and conversations with local residents to designate low and mixed income blocks.18 We include four clusters per block rather than two (the pairwise approach to blocking), following Imbens (2011). 19 We dropped one block of treatment and control clusters due to the fact that NextDrop decided (after we had designated clusters and randomized units to treatment and control) that it would be too difficult administratively for them to solicit notifications for a small set of the valve areas in E3. In particular, valve areas in utility subdivision E3 fall in two categories: a) CMC valve areas which draw on borewell water, and which pre-date BWSSB’s administration of services in the area; and b) Cauvery valve areas, which draw on water from the Cauvery river. Subsequent to the design of our study, NextDrop found it more difficult to work with the CMC area valvemen, so decided not to solicit notifications from them. This problem affects one of our treatment clusters; as a result, we dropped all four clusters (two treated, two control) that form the block within which this particular treatment cluster lies.
21
geographic terms, given the need to ensure comparability between clusters within a
block.
Data and Measurement
We measured the impact of the intervention through two surveys administered to
the treatment group as well as to the control group. A baseline survey was conducted
prior to the intervention in April and May of 2015, and a follow-up one after households
in the treatment cluster had received services for four months, in October and November
2015. We chose to run the trial for 4 months to allow households sufficient time to adapt
their daily routines to the service. Allowing the trial to run longer would have meant
losing a larger portion of our study participants due to household moves, etc.
Enumerators asked to speak with the individual who managed and stored water for the
household. If the waiter was unavailable, his or her name was noted and an appointment
made to return for an interview. Because women typically manage water, 80% of our
respondents were women.
During the baseline survey, enumerators concluded the survey by offering all
households the opportunity to enroll in NextDrop services when they were available in
their area by submitting their cell phone number and offering consent. Offering services
to both treatment and control allowed us to employ a placebo design helping us to
identify compliers—i.e., those who would accept treatment—in both the treatment and
control groups. NextDrop enrolled the households in our treatment group following the
completion of the baseline survey, and waited until the end of our study to enroll the
control group.
22
Enumerators also collected GPS coordinates from each household. This allowed
NextDrop to correctly place treatment group households in valve areas (so they received
correct information), to help our team to verify that enumerators had not strayed outside
cluster boundaries, and assist with re-location of the same households in the second
wave. To ensure that GPS readings were within the 5m precision required by NextDrop,
we configured our survey software to prevent enumerators from beginning each survey
until sufficiently precise coordinates had been obtained.20
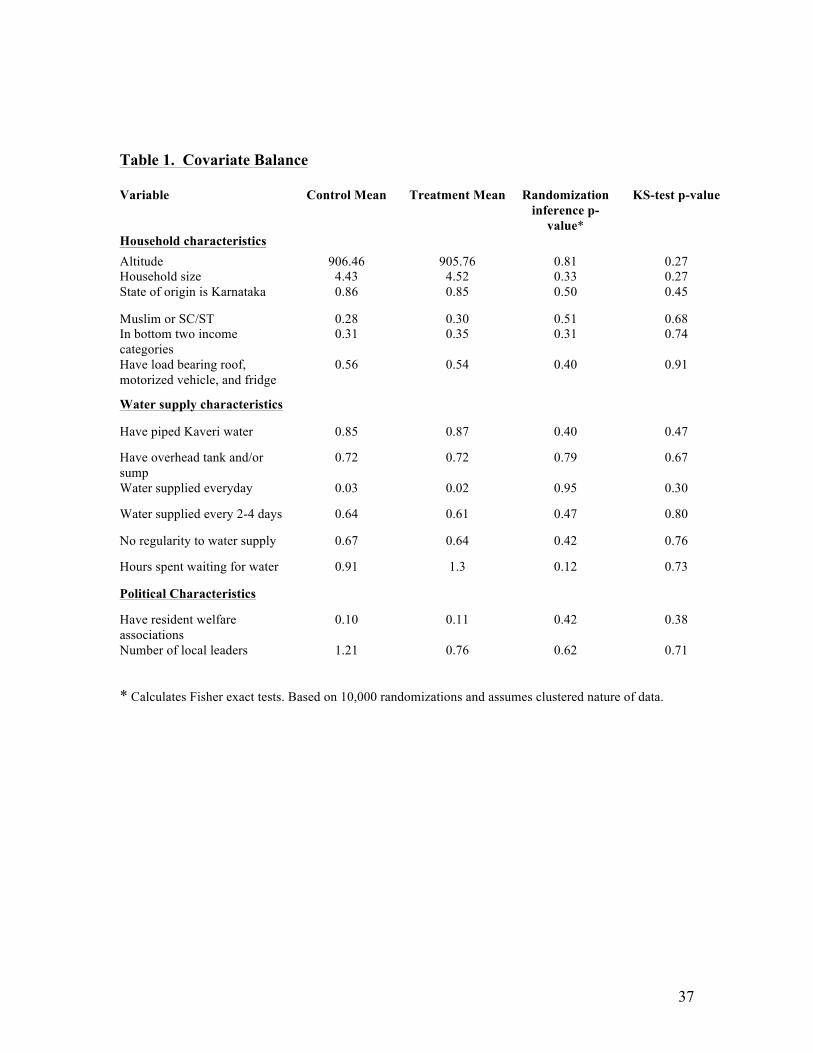
Comparing measures of key characteristics between our treatment and control
groups, we see that our cluster-randomized design achieved balance between treatment
and control with respect to household characteristics, water supply conditions, and
political factors (Table 1). As is to be expected with two-wave designs, our sample did
shrink because of attrition: we lost 16% of our initial sample between wave 1 and wave 2,
due to factors such as households moving to other neighborhoods.
Findings
As explained above, there are strong reasons to expect that NextDrop notifications would
generate important welfare effects for households, especially low-income households
without automatically-filling water tanks. Analysis of our data from subdivision E3,
however, suggests that these effects were very limited. Overall, we find that the
intervention prompted few of the expected effects, even within the groups we expected to
benefit most from the services. We only observe two changes: low-income treatment
20 The tablet computers we used relied on assisted GPS, and data network connectivity was uneven in our study area.
23
households without automatically filling tanks are less likely to rely on substitutes for tap
water. They are also more likely to contact the water utility directly regarding service
problems, rather than turning to local intermediaries.
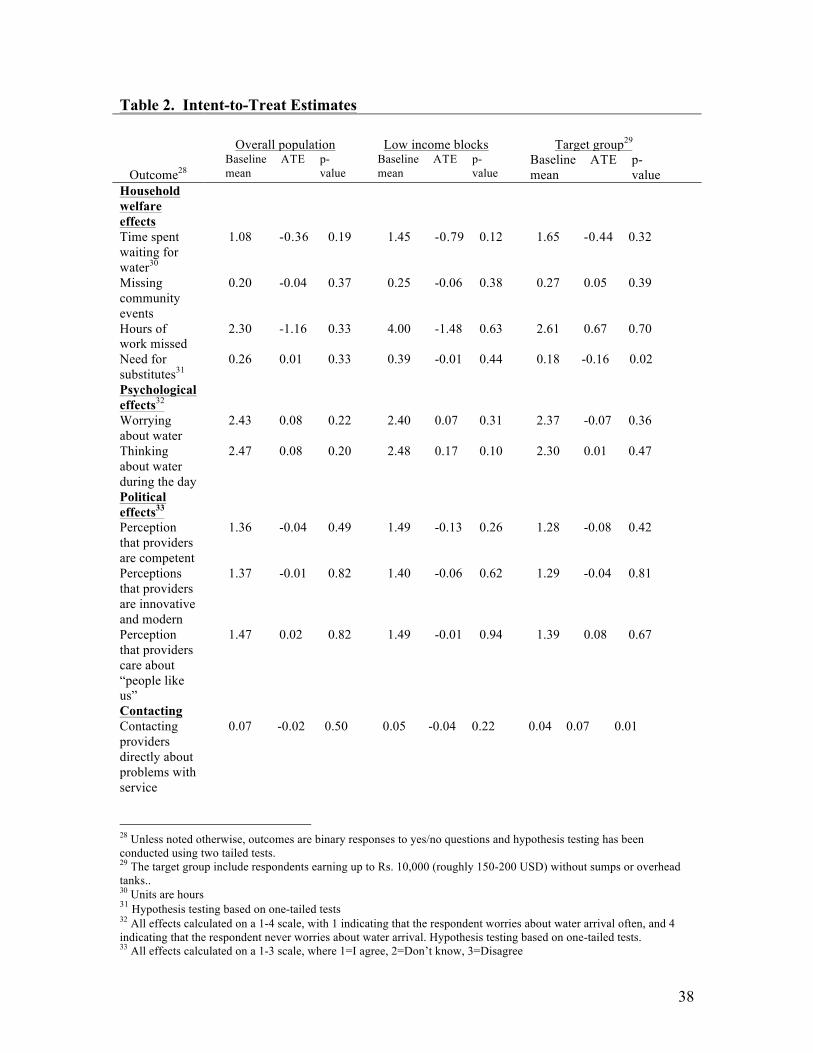
Simple ITT estimates for the entire population show no statistically significant
effects for the entire study population (Table 2). They also show no effects when we
restrict our analysis to our ten low-income blocks, which contain lower income
populations and more comparable water infrastructure. They also show no effects for our
target group, low-income households without automatically filling tanks located
throughout the entire study area. Tests for other heterogeneous effects outlined in our pre-
analysis plan also did not yield statistically significant or substantively important
effects.21
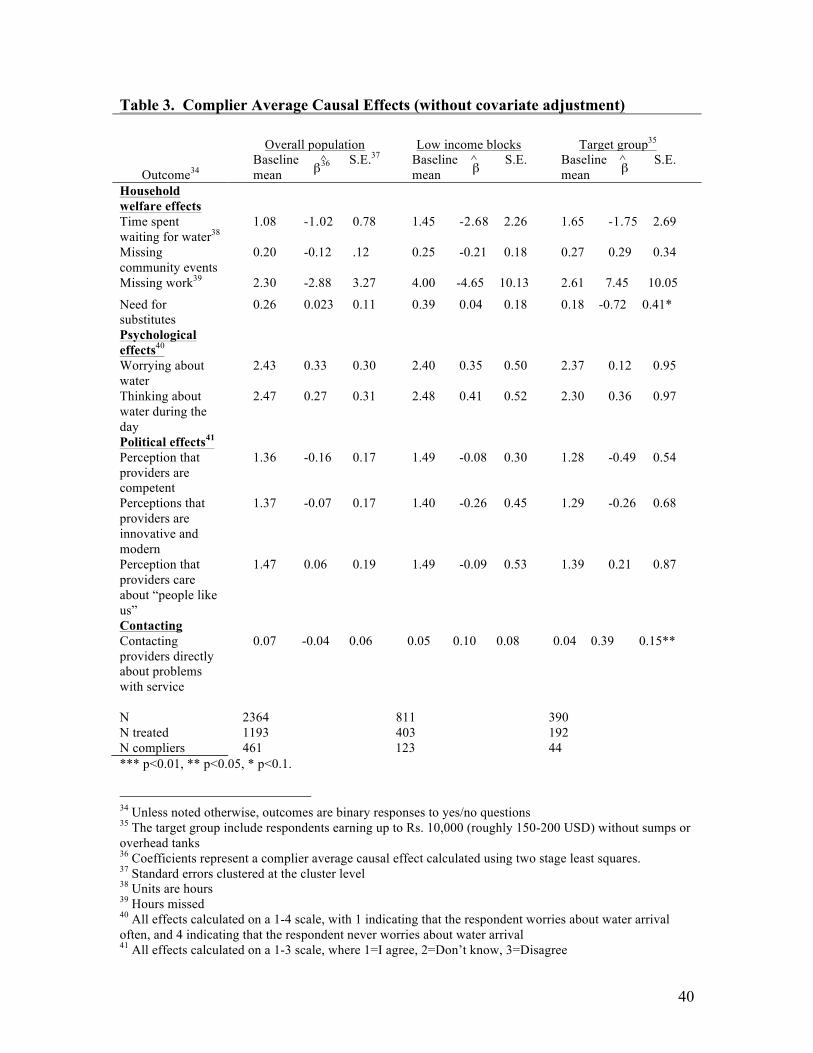
Analysis of the causal effects of the intervention on “compliers,” or those who
actually received treatment, suggests that the intervention may have had some impact
among the target group. There are several important sources of noncompliance in our
study. First, 3% of households in both the treatment and control groups chose not to
enroll in the service. In addition, of the enrolled households, not all acknowledged
receiving notifications: only 461 of our 1193 treatment group households reported
receiving them regularly. Notifications failed to reach the person responsible for
managing water for a variety of reasons outlined in the next section. Given these high
rates of noncompliance, or “incomplete administration of treatment” (Angrist 2006), a
more precise assessment of impact entails analyzing the causal effects for compliers.
21 Results available upon request.
24
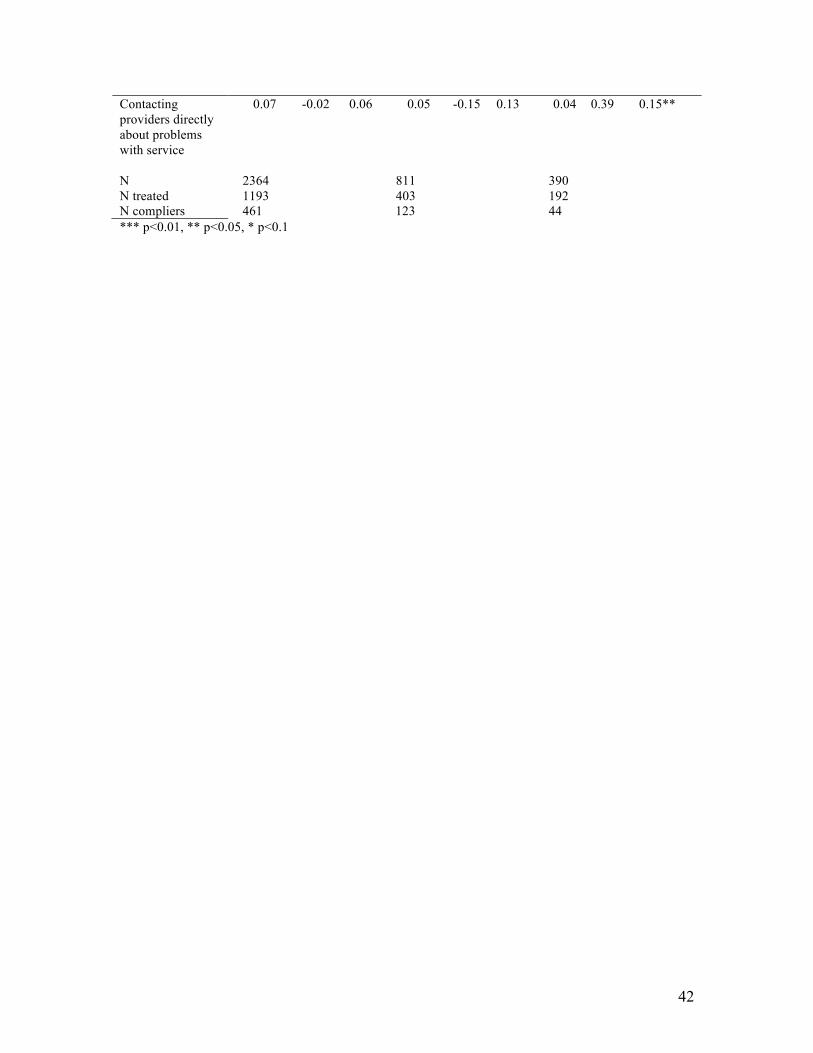
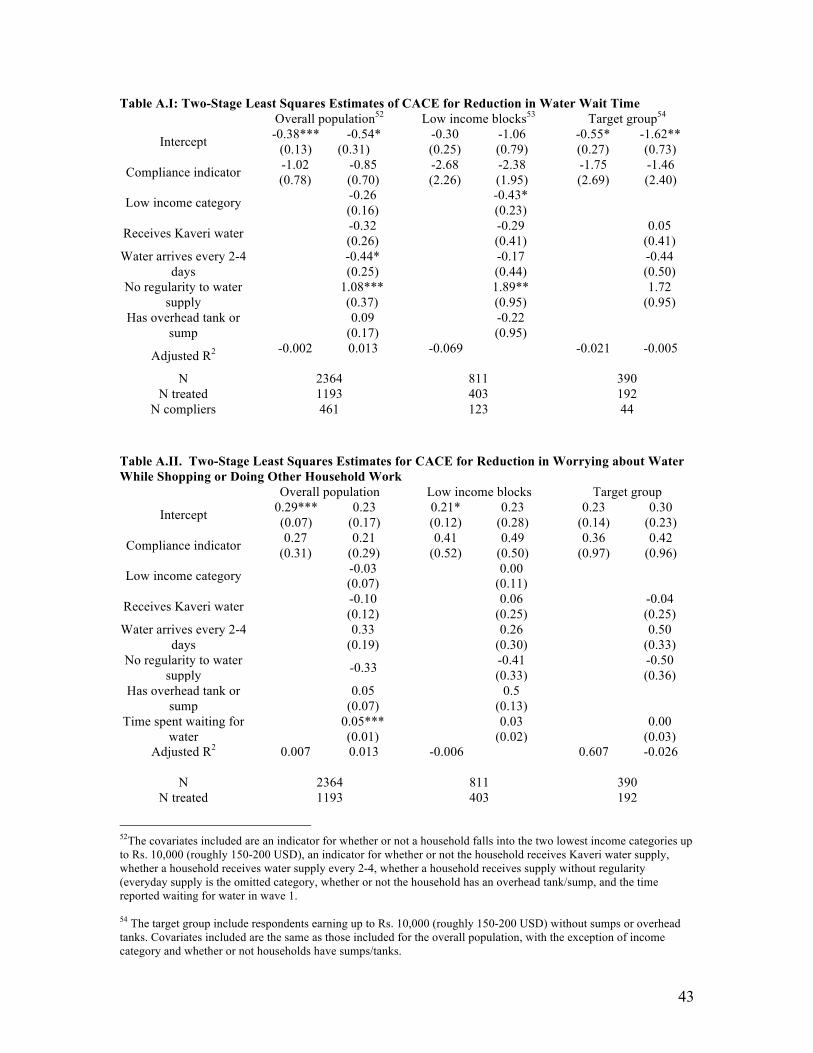
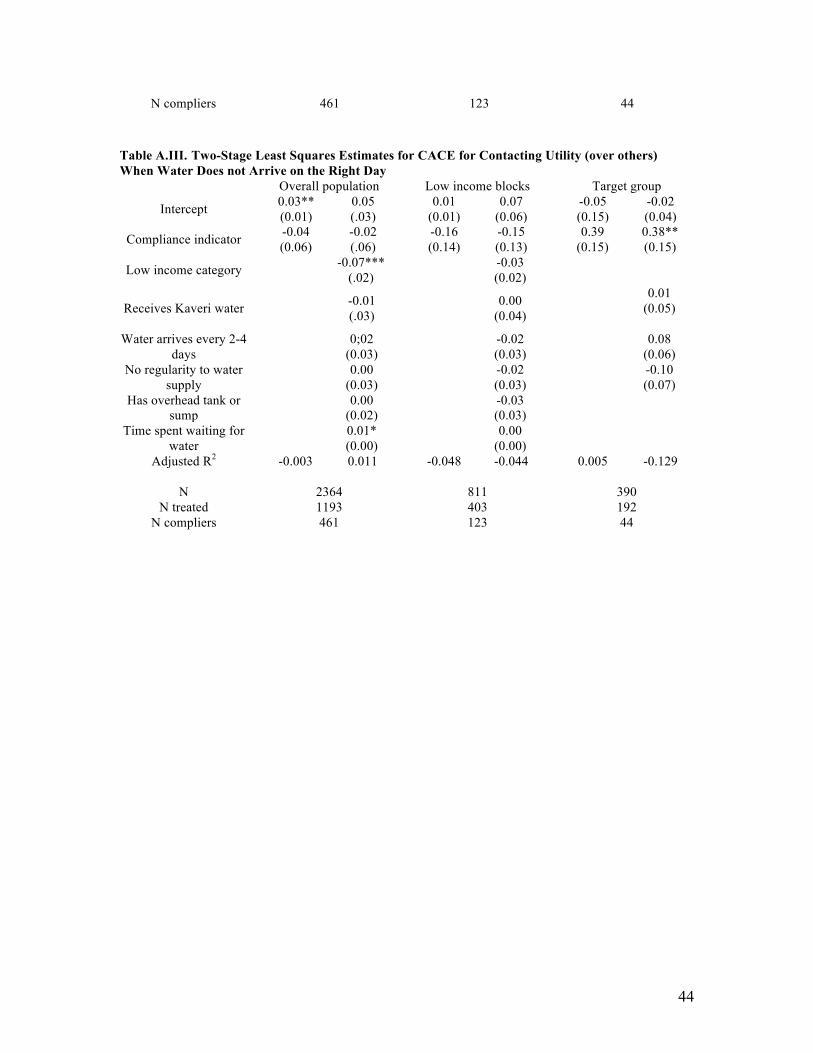
Table 3 presents CACE estimates for our outcome variables for the entire study
population, low-income blocks, and our target households.22 Similar to the ITT results,
we see do not see significantly greater reductions in wait time for water among treatment
group members, significantly greater reductions in missing community events, or greater
reductions in water-related stress. Low-income treatment group households without
automatically filling tanks, however, are significantly less likely to turn to substitutes for
piped drinking water. And while we see few changes in political attitudes regarding the
utility among treatment group members, low-income households without automatically
filling tanks in the treatment group are more likely to contact the utility directly regarding
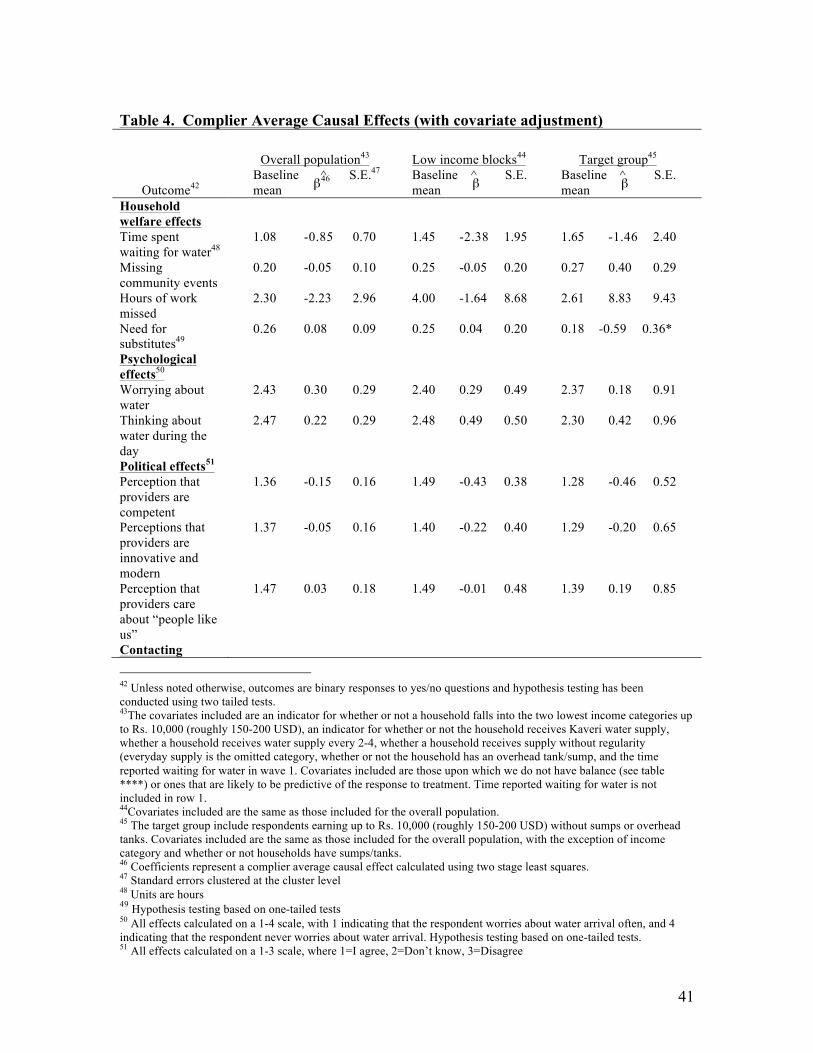
service problems. Results are almost identical in models with covariate adjustment (Table
4).23
Explaining the Modest Impact
The NextDrop service is premised on the assumption that providing citizens with
accurate information can improve the predictability of public services, and thus reduce
coping costs associated with intermittent services. To understand why NextDrop
notifications appear to have had modest-to-no impacts in our Bangalore study site, while
their performance in Hubli-Dharwad was apparently more successful, we conceptualized
22 See Tables A.I, A.II, and A.III for full results for outcomes where we detected an effect.23 Importantly, these results do not appear to be driven by spillovers between the treatment and control group. In our second wave survey, we specifically asked respondents who reported that they had received notifications whether they had received them from the utility, BWSSB, or other sources. Only 11 respondents reported receiving notifications from anyone other than BWSSB.
25
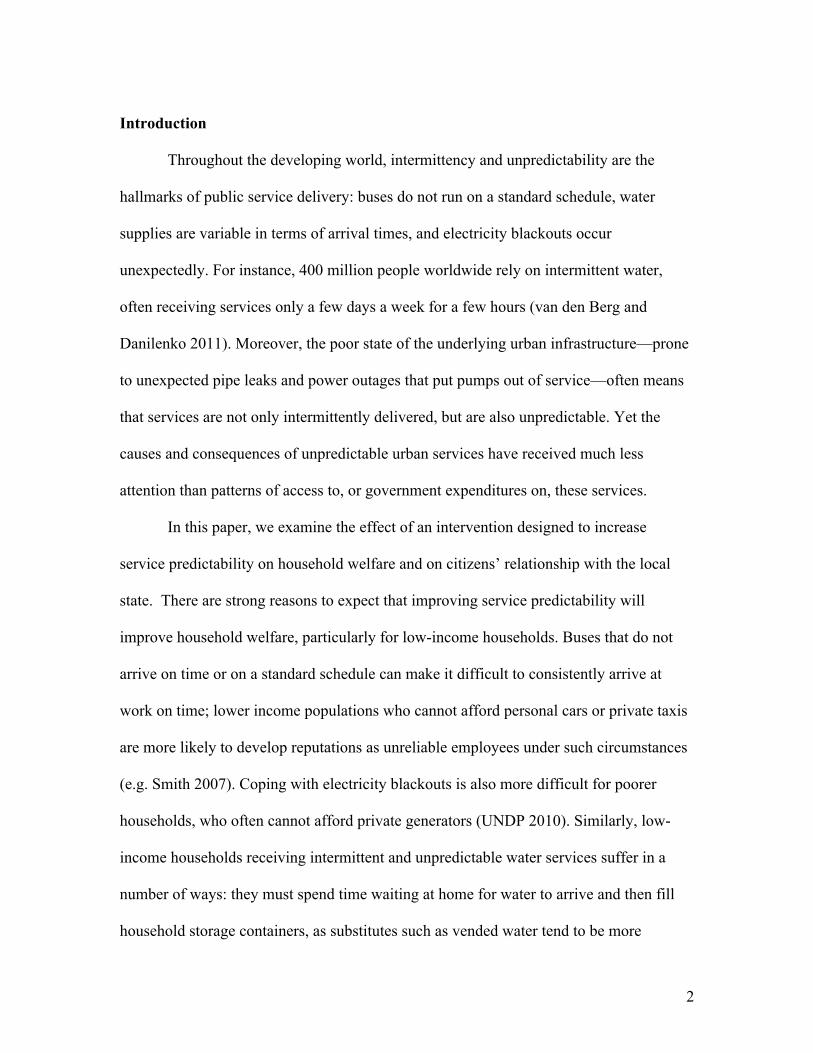
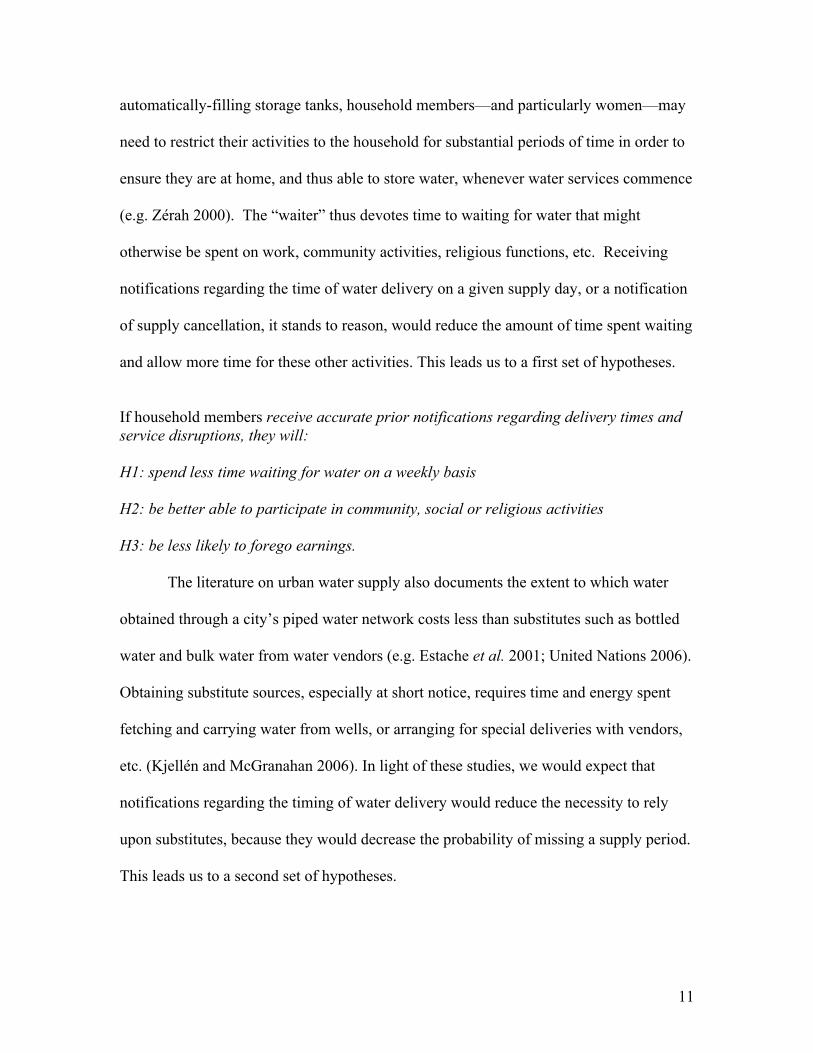
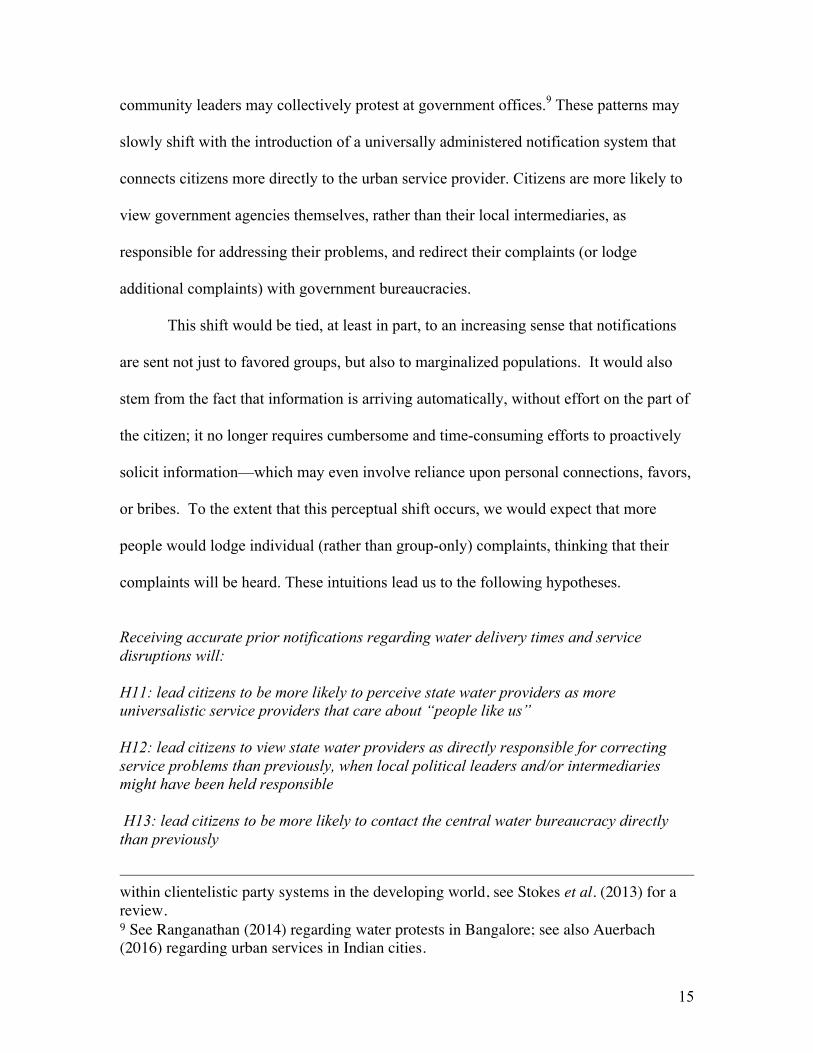
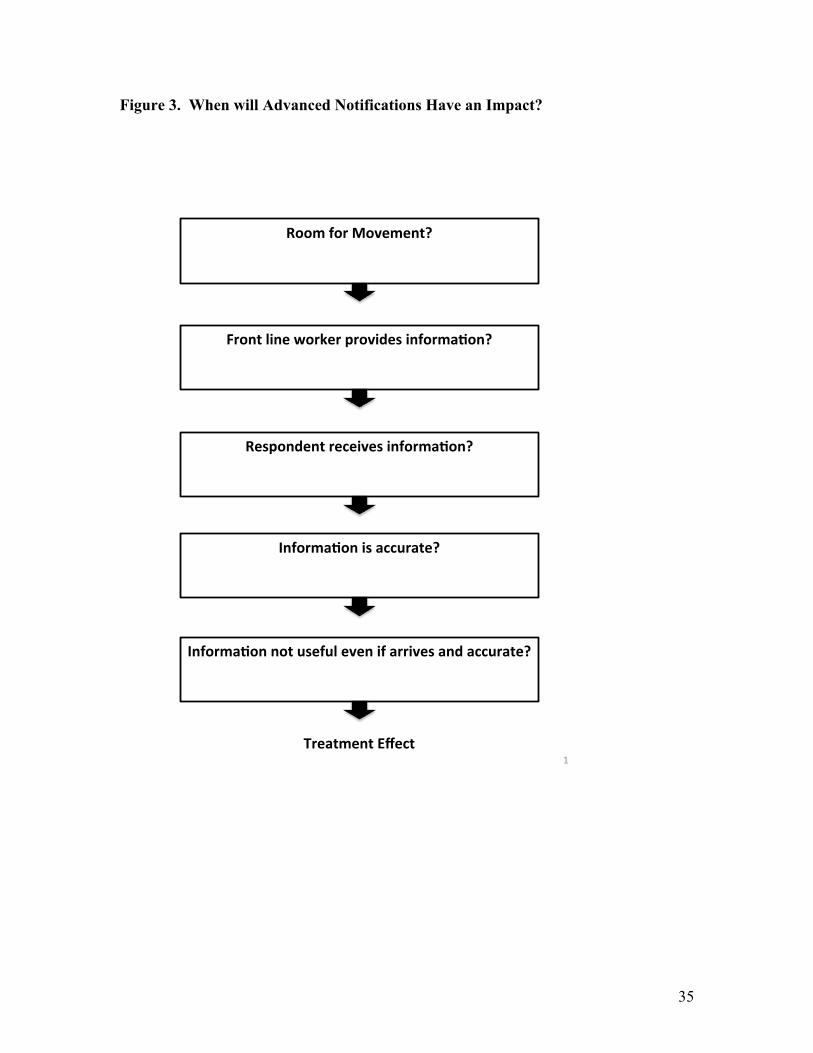
the different stages of information production and flow involved in their service. These
stages are presented in Figure 3.
A first condition for the intervention to generate a treatment effect would be that
treatment group members indeed faced difficulties associated with the unpredictability of
water deliveries. If households were not spending time waiting for water, spent no
money on substitutes for tap water, viewed the utility as highly competent, and already
contacted the utility directly for services, there is little chance the intervention would
generate shifts in behavior and attitudes. We conducted pilot surveys in subdivision E3,
prior to confirming our choice of this area for the impact evaluation, and these pilots
suggested room for movement on key outcomes of interest. However, these pilots were
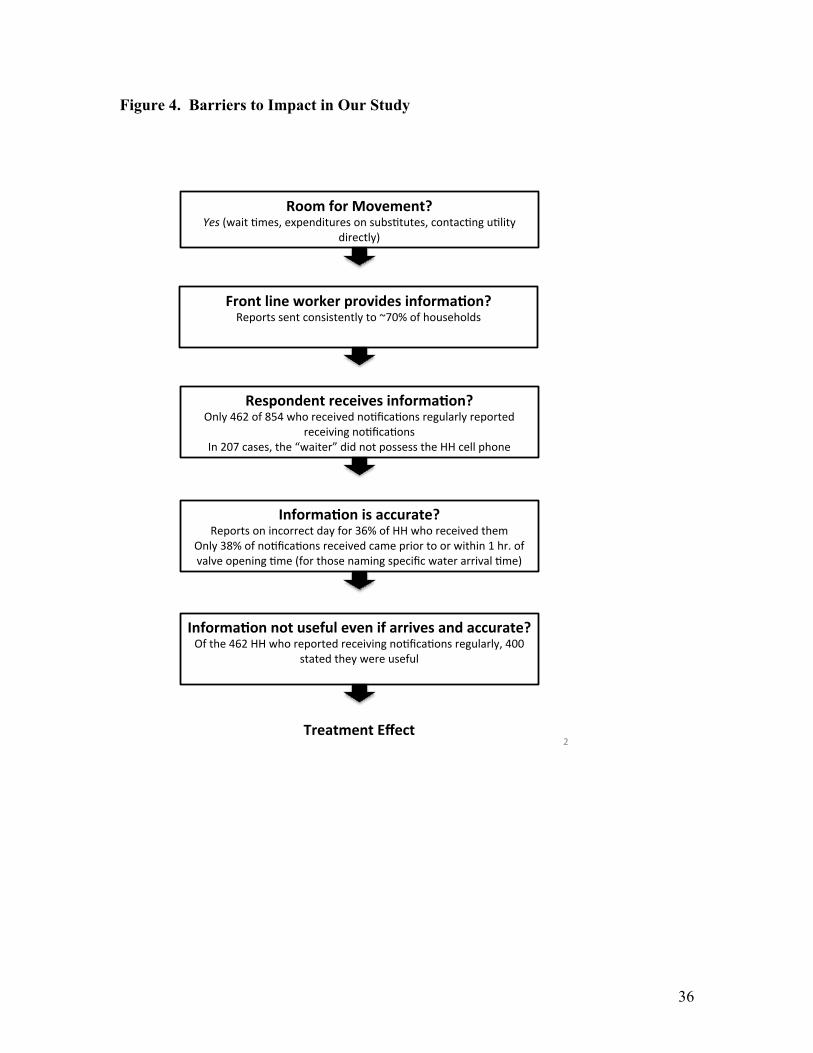
limited in reach due to time and cost constraints.24 Analysis of population means from
our baseline survey also showed that there was room for movement for outcomes such as
of waiting times for water, utilization of substitutes for piped water, and tendency to
contact the utility directly regarding service problems (Figure 4). There was far less
room for movement, however, for outcomes such as missing work due to the need to wait
for water, and attitudes towards the utility, which tended to already be quite favorable
prior to the intervention. These suggest that NextDrop’s choice to expand in Bangalore, a
city with better water services, and where households appear to be less inconvenienced
overall than those in Hubli-Dharwad, meant that we were likely to detect smaller effects
than we might have done in a city with more deficient services.
24 For outcomes such as wait time and expenditures on substitutes we also consulted survey data from Hubli-Dharwad, collected during one of the authors’ previous research efforts, which suggested substantial room for movement.
26
For water notifications to have an impact, many other conditions must be met.
Perhaps most fundamentally, valvemen must regularly send information (box 2, Figure
3). They must place calls with NextDrop’s system to log valve opening and closing times
as they turn water on and off for particular valve areas. NextDrop has long understood the
critical importance of securing valveman cooperation, and has developed a variety of
techniques to incentivize reporting. In Hubli-Dharwad, NextDrop introduced schemes
under which valvemen could earn points towards vouchers that could be redeemed for
school supplies and other items. The organization also actively addressed barriers faced
by individual valvemen, for instance paying for motorcycle repairs for valvemen who
could not visit their valves due to inadequate transportation. In Bangalore, NextDrop’s
MOU with the utility added NextDrop notifications to the valvemen’s job description.
NextDrop could therefore turn to the normal utility organizational hierarchy to augment
its own efforts to incentivize valveman participation. Turning to our geo-coded survey
responses and logs of the valvemen reports to NextDrop, we found that valvemen sent
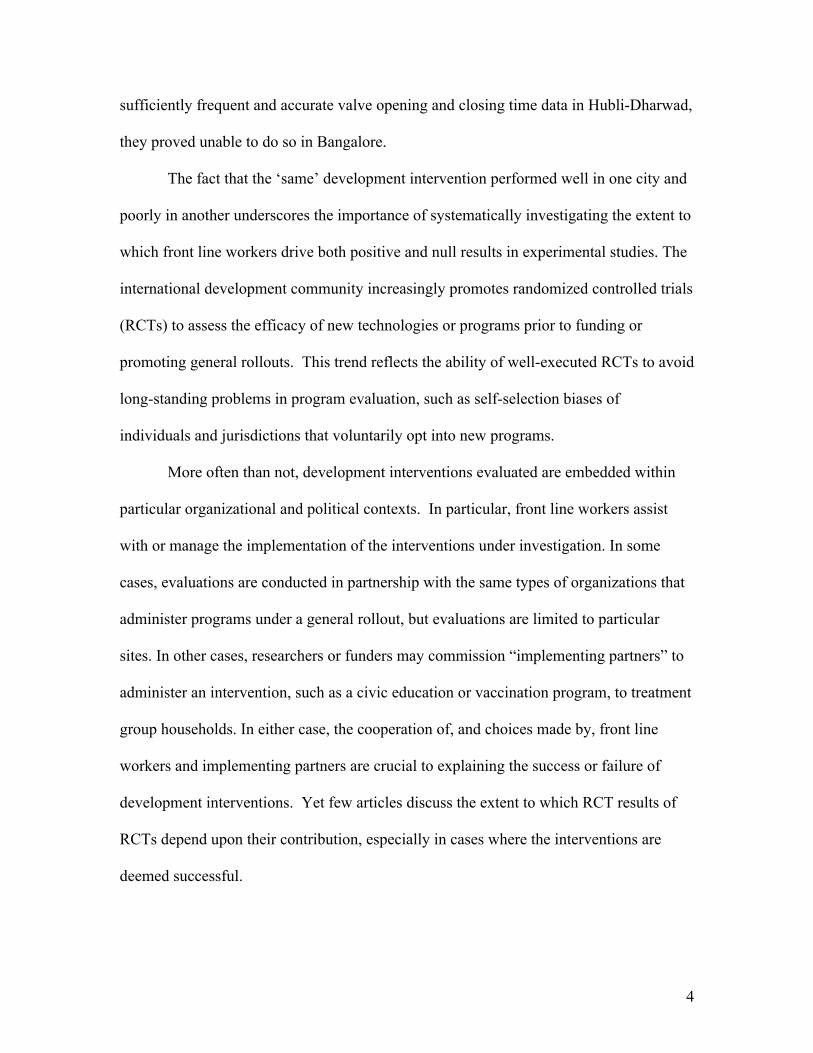
reports to NextDrop approximately 70% of the time (Figure 4).25 Valveman non-
reporting, it appears, accounts for a fair amount of leakage in the information pipeline. In
the context of our analysis, this is responsible for some loss of statistical power, as this
reduces the percentage of “compliers” in our analysis substantially.
Furthermore, for information to have an impact, it must not only be sent, but must
also be received. The difference between the number of households in the treatment
25 We reached the same percentage through two different calculations. First, we analyzed the number of valvemen reports a week to NextDrop as a percentage of expected reports for each valve area based on the official utility supply schedule for 4 weeks prior to the endline survey. In addition, we compared household survey responses naming the last water supply day with valvemen reports for each valve area for the week preceding the endline survey. The geo-coded nature of our data facilitated this analysis.
27
group and the number of households reporting that they received notifications is larger
than 30% (our “compliers” in Tables 3 and 4); only 38% of treatment group members
reported receiving notifications. Notably, this gap between treatment assignment and
actual receipt of messages becomes larger for the populations where we expect the
intervention to have the greatest effect, i.e., lower income households without tanks. For
this target group, only 23% of treatment households report receiving notifications. In a
significant fraction of the cases of non-receipt (43%), it turns out, the household member
responsible for managing and collecting water was not in possession of the household
phone they had registered with NextDrop.26 Gender differentials in mobile access, then,
also detracted from our sample size of compliers, further weakening our ability to
measure the effect of the intervention.
Information receipt, however, is also insufficient to generate the hypothesized
treatment effects. The information must also be accurate. Notifications regarding water
arrival times received after the water arrives, after all, would be of little use for
households. To assess the accuracy of the information of the valveman notifications, we
placed households in valve areas using their GPS coordinates, and compared household
survey responses regarding the last day they had received water and the average time of
water arrival with geo-coded valveman reports to NextDrop, which are time stamped.
Our analysis suggests that in valve areas where valve men had submitted valve opening
reports in the week prior to our endline survey, 36% of households reported receiving
water on a different day than that reported by the valveman. Perhaps more tellingly, a
26 We asked all respondents in the endline survey whether they kept the phone associated with the phone number that they had given for the NextDrop sign-up in the baseline survey.
28
comparison of household reports regarding average water arrival times and valveman
report data suggests that only 38% of households received reports before water arrived.27
In other words, serious problems of data accuracy further compounded already significant
problems with non-reporting. Inaccuracies may also help explain why a significant
number of households who were sent notifications did not perceive receiving them; they
may have not understood their purpose and begun ignoring them.
Finally, it is important to assess whether or not those who acknowledged
receiving messages found them to be useful. We asked a number of questions at the
conclusion of our endline survey regarding the perceived utility of NextDrop
notifications. Of those respondents who we intended to treat, 85% that the notifications
were useful, including those who either had not received regular notifications, or did not
receive them on time. Moreover, 66% of respondents stated that they would recommend
the service to others.
In aggregate, it appears that the NextDrop information pipeline was very leaky in
our Bangalore study area. While the intervention—from the outset—was less likely to
have impacts than it would have in a second or third tier city with worse infrastructure—
many valvemen did not report valve openings regularly. Large numbers of messages
were lost because women did not have everyday control of the household cell phone.
Valvemen appear to have often sent notifications on the wrong day, and very often well
after rather than prior to water arrival. NextDrop’s model, which appeared so promising
in Hubli-Dharwad, broke down in the Bangalore context.
27 This percentage calculated for the 33% percentage of households who were able to name a specific time when their water typically arrived residing in valve areas where valvemen had issued reports in the month prior to their survey interview.
29
Conclusion and Discussion
Populations throughout the developing world suffer from unpredictable service
delivery. Erratic public transportation makes commuting across congested cities
extremely difficult, while unpredictable power outages make it very difficult to complete
basic household tasks for children to complete homework. Our study focuses on the
predictability of perhaps the most important service for human development outcomes:
tap water. By highlighting the prevalence of and important costs imposed by intermittent
and erratically timed water services, we hope to encourage scholars of political economy,
and, in particular, of local public goods provision, to expand their usual focus on
expenditures and service access to include measures of service quality such as
predictability. This is familiar territory for policy-focused scholarship in engineering,
public health, and interdisciplinary sector-specific research, but considerably less so for
the mainstream social sciences.
The specific findings of our study—namely, that an intervention designed to
increase the predictability of water services only generated modest impacts, and that this
lack of impact can be attributed primarily to uncooperative front line workers —have
broad implications for the analysis of field experiments. First, that our results hinged on
the cooperation of water valvemen serves as a reminder of the crucial role of front line
workers in local public goods provision. While many studies in Political Science and
Economics examine variation in infrastructure access, the roles played by electricity
linemen, water valvemen, and toll road fee collectors receive little attention. Here also,
30
our field has much to learn from sector-specific literatures that devote greater attention to
the human “last mile” of infrastructure systems.
More broadly, the contrast between NextDrop’s experience in Hubli-Dharwad and
Bangalore highlights the importance of systematically investigating the extent to which
both negative and positive field experimental results depend upon the cooperation of
front line workers or implementing partners. Many of the most influential and best-
executed RCT evaluations in the development literature, for example, clarify the
expected roles of the human last mile in their methods discussion, but do not return to
their potentially critical roles when discussing (and explaining) their findings. This is
especially the case for studies that report a “successful” result. For example, through an
RCT in Kenya, Cohen and Dupas (2010), find that free bednets significantly raise the
numbers of households that use insecticide-treated bednets, relative to bednet distribution
that called for cost-sharing. While other aspects of the paper are very convincing, it does
not discuss how well or how poorly bednets distribution was managed or monitored (with
the exception of a couple of collaborators being thanked for “smooth implementation”). It
therefore remains unclear whether their findings would be replicated under other
conditions. Similarly, Banerjee et al. (2010) find that small incentives such as 1 kg of
dried lentils significantly increase the probability that a mother will take her baby to a
clinic to be immunized when these immunization services are reliable. The study was
conducted in partnership with an NGO, but the characteristics of, efficacy of, and
incentives for the NGO field workers are not discussed in the paper.
Prominent field experiments from the Political Science literature can also ignore
the extent to which positive findings hinge on the cooperation or implementation styles of
31
front line workers. Blattman et. al (2014) evaluate a challenging field experiment in
Liberia, in which treatment communities were trained in alternate dispute resolution
mechanisms in the hope that more disputes would be solved by bargaining than by
violence. The UN High Commission for Refugees and a Liberian NGO undertook the
task of education and implementation. The authors find a significant positive impact on
negotiated conflict resolution (especially around land claims), and a significant increase
in cooperative language and attitudes around dispute resolution. It seems plausible that
the skills and motivation level of the UN and NGO facilitators were critical for the
program, and yet the paper makes no mention of this in explaining the positive results.
Similarly, in what must have been an exceptionally difficult experiment, Fearon et al
(2009) test the impacts of a community-driven reconstruction effort, also in post-conflict
Liberia. An outside agency – in this case the International Rescue Committee (IRC) –
sensitized community members and oversaw democratically elected leadership once
groups had been randomly assigned to treatment; the authors find that, in a short time,
significant gains were made in trust, inclusion of the marginalized, and other features of
social cohesion. Again, the results, discussion and scale-up implications make no mention
of the key role of the IRC’s “last mile” workers.
The lack of attention to these workers constitutes an important omission: if an
RCT suggests that a program is effective, funders may decide to replicate it elsewhere (to
test for external validity) or to roll it out more generally (either in the experimental site or
in a “similar” context). Successful replication would need successful implementation by
front-line workers whose existence we cannot take for granted; not every town, village or
community has access to experienced NGOs or trusted facilitators or charismatic elders.
32
To the extent that motivated and skilled last mile workers are necessary for a positive
outcome, this may be a potential barrier to large-scale rollouts. Furthermore, successful
rollout will presumably be conducted by a large entity with broad geographic reach, such
as the public sector. This is the realistic scenario for most rollouts – as opposed to those
few implemented by reputable outsiders such as the IRC or a stalwart NGO – and is
indeed the scenario in which NextDrop rolled out the intervention in this study. It is safe
to assume that the public sector employees who would ultimately staff a general rollout
would respond to different incentives and motivations, and may even need different
training methods, than staff members of initial “implementing partners.”
The social sciences have a rich tradition of analyzing the motivations,
performance and discretionary power of street level bureaucrats, or last mile workers, on
access to local public services such as education, healthcare, policing and social security
(e.g., Lipsky 1980; Portillo and Rudes 2014). But, as we have found, they are generally
absent from the discussion of positive findings in intervention experiments. Yet they are
an inextricable component of these interventions, as opposed to ‘merely’ implementers
who smooth things over. Failure to recognize their central role along the causal pathway
from intervention to result risks the continued explanation of successful outcomes in
terms of “the intervention” and the explanation of failures in terms of poor
implementation. In reality, as we have argued, the human last mile is central to both.
33
Figure 1. Example valve areas in BWSSB Subdivision E3
34
Figure 2. Low and Mixed Income Clusters within Study Area
Note: The BWSSB E3 subdivision boundary is shown in blue, while areas receiving piped water supply are denoted in lavender. Pink and purple polygons denote low-income clusters (treatment and control), while black and blue polygons denote mixed income clusters (treatment and control). There are four clusters per block.
35
Figure 3. When will Advanced Notifications Have an Impact?
1
RoomforMovement?
Frontlineworkerprovidesinforma6on?
Respondentreceivesinforma6on?
Informa6onisaccurate?
TreatmentEffect
Informa6onnotusefulevenifarrivesandaccurate?
36
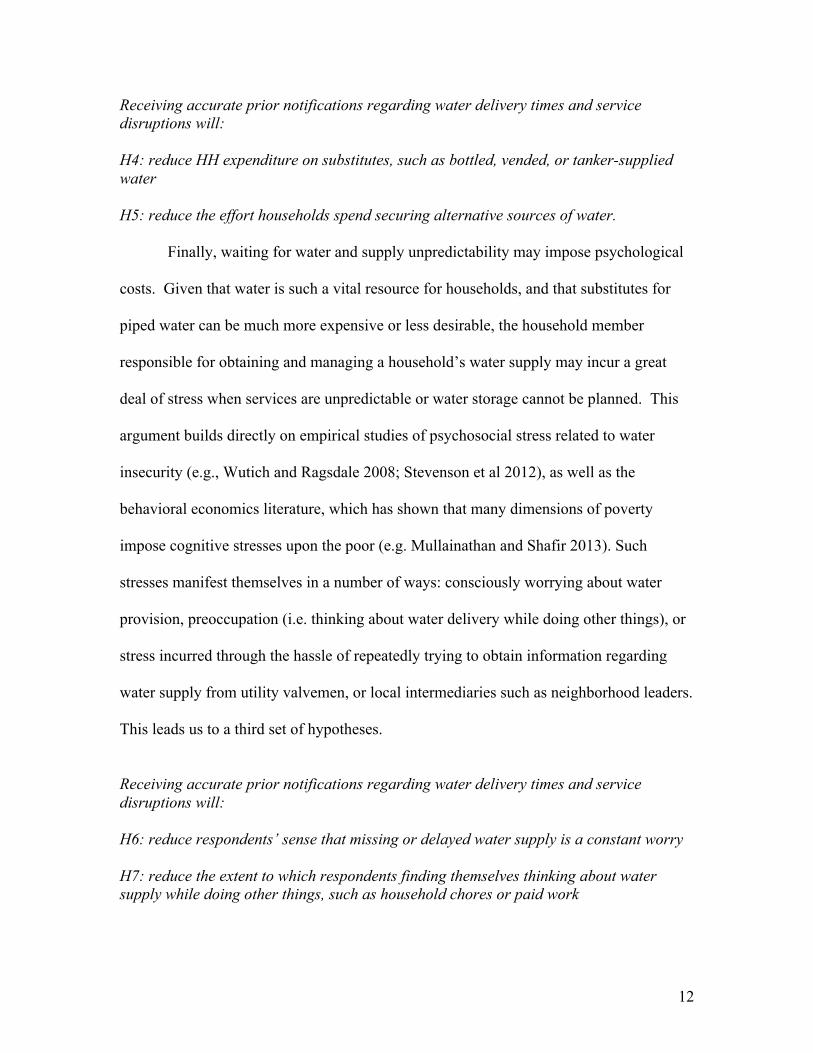
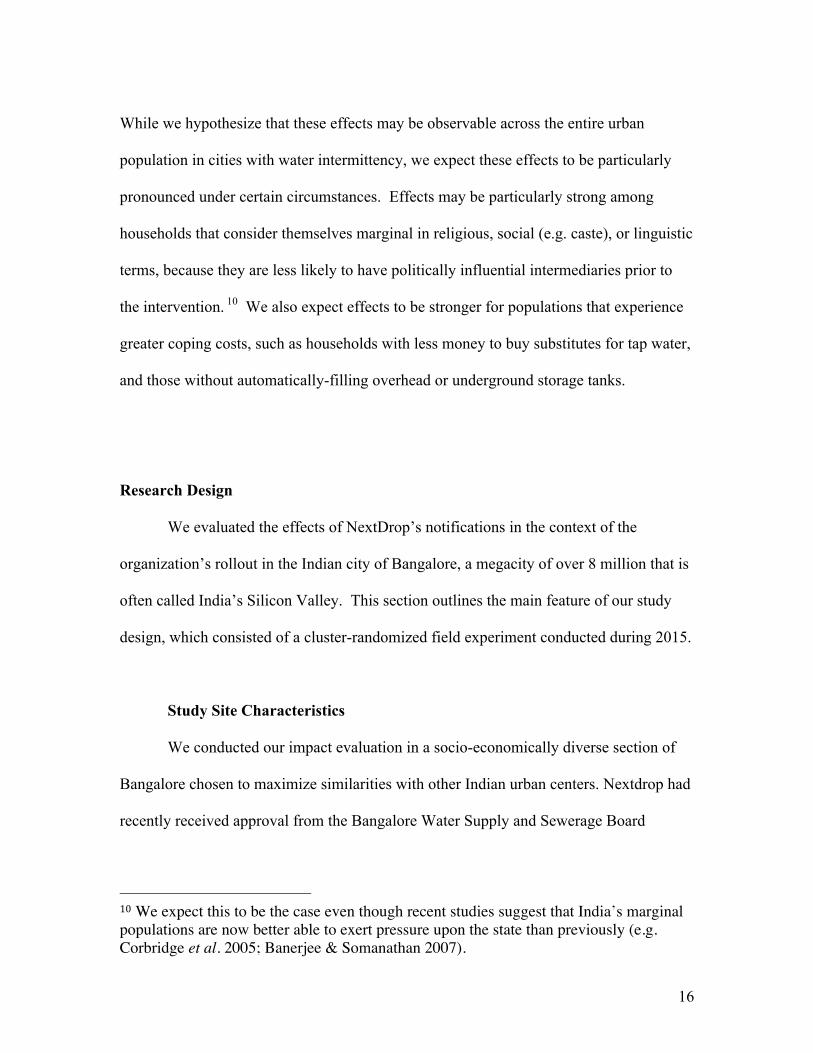
Figure 4. Barriers to Impact in Our Study
2
RoomforMovement?Yes(wait(mes,expendituresonsubs(tutes,contac(ngu(lity
directly)
Frontlineworkerprovidesinforma6on?Reportssentconsistentlyto~70%ofhouseholds
Respondentreceivesinforma6on?Only462of854whoreceivedno(fica(onsregularlyreported
receivingno(fica(onsIn207cases,the“waiter”didnotpossesstheHHcellphone
Informa6onisaccurate?Reportsonincorrectdayfor36%ofHHwhoreceivedthem
Only38%ofno(fica(onsreceivedcamepriortoorwithin1hr.ofvalveopening(me(forthosenamingspecificwaterarrival(me)
TreatmentEffect
Informa6onnotusefulevenifarrivesandaccurate?Ofthe462HHwhoreportedreceivingno(fica(onsregularly,400
statedtheywereuseful
37
Table 1. Covariate Balance Variable Control Mean Treatment Mean Randomization
inference p-value*
KS-test p-value
Household characteristics Altitude 906.46 905.76 0.81 0.27 Household size 4.43 4.52 0.33 0.27 State of origin is Karnataka 0.86 0.85 0.50 0.45
Muslim or SC/ST 0.28 0.30 0.51 0.68 In bottom two income categories
0.31 0.35 0.31 0.74
Have load bearing roof, motorized vehicle, and fridge
0.56 0.54 0.40 0.91
Water supply characteristics
Have piped Kaveri water 0.85 0.87 0.40 0.47
Have overhead tank and/or sump
0.72 0.72 0.79 0.67
Water supplied everyday 0.03 0.02 0.95 0.30
Water supplied every 2-4 days 0.64 0.61 0.47 0.80
No regularity to water supply 0.67 0.64 0.42 0.76
Hours spent waiting for water 0.91 1.3 0.12 0.73
Political Characteristics
Have resident welfare associations
0.10 0.11 0.42 0.38
Number of local leaders 1.21 0.76 0.62 0.71
* Calculates Fisher exact tests. Based on 10,000 randomizations and assumes clustered nature of data.
38
Table 2. Intent-to-Treat Estimates
Outcome28
Overall population Low income blocks Target group29 Baseline mean
ATE p-value
Baseline mean
ATE p-value
Baseline mean
ATE p-value
Household welfare effects
Time spent waiting for water30
1.08 -0.36 0.19
1.45 -0.79 0.12
1.65 -0.44 0.32
Missing community events
0.20 -0.04 0.37
0.25 -0.06 0.38
0.27 0.05 0.39
Hours of work missed
2.30 -1.16 0.33
4.00 -1.48 0.63
2.61 0.67 0.70
Need for substitutes31
0.26 0.01 0.33
0.39 -0.01 0.44
0.18 -0.16 0.02
Psychological effects32
Worrying about water
2.43 0.08 0.22
2.40 0.07 0.31
2.37 -0.07 0.36
Thinking about water during the day
2.47 0.08 0.20
2.48 0.17 0.10
2.30 0.01 0.47
Political effects33
Perception that providers are competent
1.36 -0.04 0.49
1.49 -0.13 0.26
1.28 -0.08 0.42
Perceptions that providers are innovative and modern
1.37 -0.01 0.82
1.40 -0.06 0.62
1.29 -0.04 0.81
Perception that providers care about “people like us”
1.47 0.02 0.82
1.49 -0.01 0.94
1.39 0.08 0.67
Contacting Contacting providers directly about problems with service
0.07 -0.02 0.50
0.05 -0.04 0.22
0.04 0.07 0.01
28 Unless noted otherwise, outcomes are binary responses to yes/no questions and hypothesis testing has been conducted using two tailed tests. 29 The target group include respondents earning up to Rs. 10,000 (roughly 150-200 USD) without sumps or overhead tanks.. 30 Units are hours 31 Hypothesis testing based on one-tailed tests 32 All effects calculated on a 1-4 scale, with 1 indicating that the respondent worries about water arrival often, and 4 indicating that the respondent never worries about water arrival. Hypothesis testing based on one-tailed tests. 33 All effects calculated on a 1-3 scale, where 1=I agree, 2=Don’t know, 3=Disagree

39
N 2364 811 390
N treated 1193 403 192
40
Table 3. Complier Average Causal Effects (without covariate adjustment)
Outcome34
Overall population Low income blocks Target group35 Baseline mean β36̂ S.E.37
Baseline mean β̂ S.E.
Baseline mean β̂ S.E.
Household welfare effects
Time spent waiting for water38
1.08 -1.02 0.78
1.45 -2.68 2.26
1.65 -1.75 2.69
Missing community events
0.20 -0.12 .12
0.25 -0.21 0.18
0.27 0.29 0.34
Missing work39 2.30 -2.88 3.27
4.00 -4.65 10.13
2.61 7.45 10.05
Need for substitutes
0.26 0.023 0.11
0.39 0.04 0.18
0.18 -0.72 0.41*
Psychological effects40
Worrying about water
2.43 0.33 0.30
2.40 0.35 0.50
2.37 0.12 0.95
Thinking about water during the day
2.47 0.27 0.31
2.48 0.41 0.52
2.30 0.36 0.97
Political effects41 Perception that providers are competent
1.36 -0.16 0.17
1.49 -0.08 0.30
1.28 -0.49 0.54
Perceptions that providers are innovative and modern
1.37 -0.07 0.17
1.40 -0.26 0.45
1.29 -0.26 0.68
Perception that providers care about “people like us”
1.47 0.06 0.19
1.49 -0.09 0.53
1.39 0.21 0.87
Contacting Contacting providers directly about problems with service
0.07 -0.04 0.06
0.05 0.10 0.08
0.04 0.39 0.15**
N 2364 811 390
N treated 1193 403 192
N compliers 461 123 44
*** p<0.01, ** p<0.05, * p<0.1.
34 Unless noted otherwise, outcomes are binary responses to yes/no questions 35 The target group include respondents earning up to Rs. 10,000 (roughly 150-200 USD) without sumps or overhead tanks 36 Coefficients represent a complier average causal effect calculated using two stage least squares. 37 Standard errors clustered at the cluster level 38 Units are hours 39 Hours missed 40 All effects calculated on a 1-4 scale, with 1 indicating that the respondent worries about water arrival often, and 4 indicating that the respondent never worries about water arrival 41 All effects calculated on a 1-3 scale, where 1=I agree, 2=Don’t know, 3=Disagree
41
Table 4. Complier Average Causal Effects (with covariate adjustment)
Outcome42
Overall population43 Low income blocks44 Target group45 Baseline mean β46̂ S.E.47
Baseline mean β̂ S.E.
Baseline mean β̂ S.E.
Household welfare effects
Time spent waiting for water48
1.08 -0.85 0.70
1.45 -2.38 1.95
1.65 -1.46 2.40
Missing community events
0.20 -0.05 0.10
0.25 -0.05 0.20
0.27 0.40 0.29
Hours of work missed
2.30 -2.23 2.96
4.00 -1.64 8.68
2.61 8.83 9.43
Need for substitutes49
0.26 0.08 0.09
0.25 0.04 0.20
0.18 -0.59 0.36*
Psychological effects50
Worrying about water
2.43 0.30 0.29
2.40 0.29 0.49
2.37 0.18 0.91
Thinking about water during the day
2.47 0.22 0.29
2.48 0.49 0.50
2.30 0.42 0.96
Political effects51 Perception that providers are competent
1.36 -0.15 0.16
1.49 -0.43 0.38
1.28 -0.46 0.52
Perceptions that providers are innovative and modern
1.37 -0.05 0.16
1.40 -0.22 0.40
1.29 -0.20 0.65
Perception that providers care about “people like us”
1.47 0.03 0.18
1.49 -0.01 0.48
1.39 0.19 0.85
Contacting
42 Unless noted otherwise, outcomes are binary responses to yes/no questions and hypothesis testing has been conducted using two tailed tests. 43The covariates included are an indicator for whether or not a household falls into the two lowest income categories up to Rs. 10,000 (roughly 150-200 USD), an indicator for whether or not the household receives Kaveri water supply, whether a household receives water supply every 2-4, whether a household receives supply without regularity (everyday supply is the omitted category, whether or not the household has an overhead tank/sump, and the time reported waiting for water in wave 1. Covariates included are those upon which we do not have balance (see table ****) or ones that are likely to be predictive of the response to treatment. Time reported waiting for water is not included in row 1. 44Covariates included are the same as those included for the overall population. 45 The target group include respondents earning up to Rs. 10,000 (roughly 150-200 USD) without sumps or overhead tanks. Covariates included are the same as those included for the overall population, with the exception of income category and whether or not households have sumps/tanks. 46 Coefficients represent a complier average causal effect calculated using two stage least squares. 47 Standard errors clustered at the cluster level 48 Units are hours 49 Hypothesis testing based on one-tailed tests 50 All effects calculated on a 1-4 scale, with 1 indicating that the respondent worries about water arrival often, and 4 indicating that the respondent never worries about water arrival. Hypothesis testing based on one-tailed tests. 51 All effects calculated on a 1-3 scale, where 1=I agree, 2=Don’t know, 3=Disagree
42
Contacting providers directly about problems with service
0.07 -0.02 0.06
0.05 -0.15 0.13
0.04 0.39 0.15**
N 2364 811 390
N treated 1193 403 192
N compliers 461 123 44
*** p<0.01, ** p<0.05, * p<0.1
43
Table A.I: Two-Stage Least Squares Estimates of CACE for Reduction in Water Wait Time Overall population52 Low income blocks53 Target group54
Intercept -0.38*** (0.13)
-0.54* (0.31)
-0.30 (0.25)
-1.06 (0.79)
-0.55* (0.27)
-1.62** (0.73)
Compliance indicator -1.02 (0.78)
-0.85 (0.70)
-2.68 (2.26)
-2.38 (1.95)
-1.75 (2.69)
-1.46 (2.40)
Low income category -0.26 (0.16)
-0.43* (0.23)
Receives Kaveri water -0.32 (0.26)
-0.29 (0.41)
0.05 (0.41)
Water arrives every 2-4 days
-0.44* (0.25)
-0.17 (0.44)
-0.44 (0.50)
No regularity to water supply
1.08*** (0.37)
1.89** (0.95)
1.72 (0.95)
Has overhead tank or sump
0.09 (0.17)
-0.22 (0.95)
Adjusted R2 -0.002
0.013
-0.069
-0.021
-0.005
N 2364 811 390 N treated 1193 403 192
N compliers 461 123 44 Table A.II. Two-Stage Least Squares Estimates for CACE for Reduction in Worrying about Water While Shopping or Doing Other Household Work
Overall population Low income blocks Target group
Intercept 0.29*** (0.07)
0.23 (0.17)
0.21* (0.12)
0.23 (0.28)
0.23 (0.14)
0.30 (0.23)
Compliance indicator 0.27 (0.31)
0.21 (0.29)
0.41 (0.52)
0.49 (0.50)
0.36 (0.97)
0.42 (0.96)
Low income category -0.03 (0.07)
0.00 (0.11)
Receives Kaveri water -0.10 (0.12)
0.06 (0.25)
-0.04 (0.25)
Water arrives every 2-4 days
0.33 (0.19)
0.26 (0.30)
0.50 (0.33)
No regularity to water supply -0.33
-0.41 (0.33)
-0.50 (0.36)
Has overhead tank or sump
0.05 (0.07)
0.5 (0.13)
Time spent waiting for water
0.05*** (0.01)
0.03 (0.02)
0.00 (0.03)
Adjusted R2 0.007 0.013
-0.006
0.607 -0.026
N 2364 811 390
N treated 1193 403 192
52The covariates included are an indicator for whether or not a household falls into the two lowest income categories up to Rs. 10,000 (roughly 150-200 USD), an indicator for whether or not the household receives Kaveri water supply, whether a household receives water supply every 2-4, whether a household receives supply without regularity (everyday supply is the omitted category, whether or not the household has an overhead tank/sump, and the time reported waiting for water in wave 1. 54 The target group include respondents earning up to Rs. 10,000 (roughly 150-200 USD) without sumps or overhead tanks. Covariates included are the same as those included for the overall population, with the exception of income category and whether or not households have sumps/tanks.
44
N compliers 461 123 44 Table A.III. Two-Stage Least Squares Estimates for CACE for Contacting Utility (over others) When Water Does not Arrive on the Right Day
Overall population Low income blocks Target group
Intercept 0.03** (0.01)
0.05 (.03)
0.01 (0.01)
0.07 (0.06)
-0.05 (0.15)
-0.02 (0.04)
Compliance indicator -0.04 (0.06)
-0.02 (.06)
-0.16 (0.14)
-0.15 (0.13)
0.39 (0.15)
0.38** (0.15)
Low income category -0.07*** (.02)
-0.03 (0.02)
Receives Kaveri water -0.01 (.03)
0.00 (0.04)
0.01 (0.05)
Water arrives every 2-4 days
0;02 (0.03)
-0.02 (0.03)
0.08 (0.06)
No regularity to water supply
0.00 (0.03)
-0.02 (0.03)
-0.10 (0.07)
Has overhead tank or sump
0.00 (0.02)
-0.03 (0.03)
Time spent waiting for water
0.01* (0.00)
0.00 (0.00)
Adjusted R2 -0.003 0.011
-0.048 -0.044
0.005 -0.129
N 2364 811 390
N treated 1193 403 192 N compliers 461 123 44
45
References Alesina, A., Baqir, R., & Easterly, W. 1999. Public goods and ethnic divisions. The Quarterly Journal of Economics, 114(4), 1243-1284. Angrist, Joshua D. 2006. “Instrumental Variables Methods in Experimental Criminology Research: What, Why, and How.” Journal of Experimental Criminology. 2:23-44. Auerbach, Adam. 2016. “Clients and Communities: The Political Economy of Party Network Organization and Development in India’s Urban Slums.” World Politics. 68(1). Baisa, B, L.W. Davis, S. W. Salant, and W. Wilcox. 2010. The welfare costs of unreliable water service. Journal of Development Economics, 92: 1 – 12. Baldwin, K., & Huber, J. D. 2010. Economic versus cultural differences: Forms of ethnic diversity and public goods provision. American Political Science Review. 104(4): 644-662. Banerjee, A & R. Somanathan. 2006. The political economy of public goods: Some evidence from India. Journal of Development Economics, 82: 287 – 314. Berenshot, Ward. 2010. “Everyday Mediation: The Politics of Public Service Delivery in Gujurat, India.” Development and Change. 41(5): 883-905. Blattman, Christopher. 2014. “How to Promote Order and Property Rights under Weak Rule of Law? An Experiment in Changing Dispute Resolution Behavior through Community Education.” American Political Science Review. 108(4): 1-21. Connors, G. 2005. “When utilities muddle through: pro-poor governance in Bangalore’s public water sector.” Environment and Urbanization, 17: 201–217. Corbridge, Stuart, Glyn Williams, Manoj Srivastava, Réne Véron. 2005. Seeing the State: Governance and Governmentality in India. New York: Cambridge University Press. Ercumen, A., B F. Arnold, E Kumpel, Z Burt, Isha Ray, KL Nelson, and J M Colford Jr. 2015. Upgrading a Piped Water Supply from Intermittent to Continuous Delivery: Impact on Waterborne Illness in Urban India. PLoS Med 12(10): e1001892. Estache, Antonio, Gómez-Lobo, Andrés, and Daniel Leipziger. 2001. “Utilities Privatization and the Poor: Lessons and Evidence from Latin America.” World Development. 29(7): 1179-1198. Evans, Peter. 2008. In search of the 21st century developmental state. Working Paper 4. Center for Global Political Economy. University of Sussex.

46
Fearon, James, Macartan Humphreys, and Jeremy Weinstein. 2009. “Can Development Aid Contribute to Social Cohesion After Civil War? Evidence from a Field Experiment in Post-Conflict Liberia.” American Economic Review: Papers and Proceedings 2009. 99(2): 287-291. Ferguson, J., and A. Gupta. 2002. Spatializing states: towards an ethnography of neoliberal governmentality. American Ethnologist, 29: 981 – 1002. Ghertner, D. Asher. 2011. “Gentrifying the State, Gentrifying Participation: Elite Governance Programs in Delhi.” International Journal of Urban and Regional Research. 35(3): 504-532. Harriss J., 2006. Middle class activism and the politics of the informal working class. Critical Asian Studies, 38: 445 – 465. Imbens, Guido. 2011. “”Experimental Design for Unit and Cluster Randomized Trials.” Manuscript prepared for the International Initiative for Impact Evaluation, 3i. Kjellén, M, and G. McGranahan. 2006. Informal water vendors and the urban poor. Human Settlements Discussion Paper Series. IIED. http://www.iied.org/HS/publications.html Krishna, Anirudh. 2011. “Gaining Access to Public Services and the Democratic State in India: Institutions in the Middle.” Studies in Comparative International Development. 46(1): 98-117. Kumpel, E. and Nelson, K.L. 2013. Comparing microbial water quality in an intermittent and continuous piped water supply. Water Research 47(14): 5176-5188. Kuriyan, Renee and Isha Ray. 2009. “Outsourcing the State? Public-Private Partnerships and Information Technologies in India.” World Development. 37(10): 1663-1673. Lipsky M. 1980. Street-Level Bureaucracy: Dilemmas of the Individual in Public Service. New York: Russell Sage Foundation Madon, S and S. Sahay. 2002. An information based model of NGO mediation for the empowerment of slum-dwellers in Bangalore. The Information Society, 18: 13 – 19. McKenzie, David and Isha Ray. 2009. “Urban Water Supply in India: Status, Reform Options, and Possible Lessons.” Water Policy. 11: 442-460. Min, Brian. 2015. Power and the Vote: Elections and Electricity in the Developing World. New York: Cambridge University Press.
47
Mullainathan, S and E. Shafir. 2013. Scarcity: Why Having Too Little Means So Much. New York: Henry Holt & Company. Murillo, María Victoria. 2009. Political Competition, Partisanship, and Policy Making in Latin American Public Utilities. New York: Cambridge University Press. Portillo, S. and D.S. Rudes. 2014. “Construction of Justice at the Street Level.” Annual Review of Law and Social Sciences. 10:321–34 Post, Alison E., Anustubh Agnihotri, and Christopher Hyun. 2016. “Crowd-Sourced Data for Comparative Politics: Lessons from Urban India.” Manuscript. Ranganathan, Malini. 2014. ‘Mafias’ in the waterscape: Urban informality and everyday public authority in Bangalore. Water Alternatives, 7:89 – 105. Savedoff, William and Pablo Spiller. 1999. Spilled Water: Institutional Commitment in the Provision of Water Services. Washington, D.C.: Inter-American Development Bank. Smith, Sandra. 2007. Lone Pursuit: Distrust and Defensive Individualism among the Black Poor. New York: Russell Sage Foundation. Solo T. 1999. “Small-scale entrepreneurs in the urban water and sanitation market.” Environment and Urbanization.11(1):117–31. Stevenson, E.G., Greene, L.E., Maes, K.C., Ambelu, A., Tesfaye, Y.A., Rheingans, R.,et al., 2012. “Water insecurity in 3 dimensions: an anthropological perspective on water and women's psychosocial distress in Ethiopia.” Social Science Medicine 75, 392e400. Stokes, Susan C., Thad Dunning, Marcelo Nazareno, and Valeria Brusco. 2013. Brokers, Voters, and Clientelism: The Puzzle of Distributive Politics. New York: Cambridge University Press. Tolbert, C and K Mossberger. 2006. “The Effects of E-Government on Trust and Confidence in Government.” Public Administration Review, 66: 354-369 United Nations Development Programme. 2010. Human Development Report. New York: UNDP. United Nations Human Development Report. 2006. Beyond Scarcity: Power, Poverty and the Global Water Crisis. United Nations: New York. van den Berg, C and A Danilenko. 2011. The IBNET Water Supply and Sanitation Performance Blue Book. The World Bank: Washington DC.

48
Wutich, A and K. Ragsdale. 2008. Water insecurity and emotional distress: Coping with supply, access, and seasonal variability of water in a Bolivian squatter settlement. Social Science and Medicine. 67: 2116 – 2125. Zérah, Marie-Helène. 2000. Household strategies for coping with unreliable water supplies: the case of Delhi. Habitat International, 24: 295 – 307.