Embed Size (px)
Citation preview
Does School Choice Help Students in Overcrowded
Schools? Evidence from a Centralized School
Assignment
Siyan Liu *
January, 2021
[Click here for the most recent version of the paper]
Abstract: School overcrowding is a pressing issue faced by many large urban school dis-
tricts. This study evaluates the role of an existing school choice program in alleviating over-
crowding in Wake County, North Carolina. The Wake County magnet school program uses a
centralized assignment to re-assign students to magnet schools in areas with large proportions of
economically disadvantaged students. In addition to improving diversity and providing innova-
tive education, Wake County leverages this system to address school overcrowding at traditional
schools through prioritizing applicants from overcrowded schools. This paper fully exploits the
random variation in offers of magnet seats at all magnet schools by conditioning on assignment
propensity scores and causally identifies the effect of magnet attendance by overcrowding status
of origin schools following Abdulkadiroglu et al. (2017). Results suggest no evidence of differ-
ential gains in math and literacy skills from magnet attendance by students from overcrowded
base schools. However, students with an overcrowded base school experience stronger magnet
gains on reduced absenteeism than students with a non-overcrowded base school.
Keywords: school choice, achievement gap
JEL classification: I21, I24, I28
∗Campus Box 8110, Department of Economics, North Carolina State University (email: [email protected]). I wouldlike to express my very great appreciation to my advisors Melinda Morrill and Thayer Morrill for their continuedsupport and guidance. I also thank Robert Clark, Umut Dur and Robert Hammond for their valuable comments andsuggestions. Access to confidential data was given by the department of Data, Research, and Accountability (DRA)at the Wake County Public School System (WCPSS). All mistakes are my own.
1 Introduction
Rapid population growth and budget shortfalls have led to overcrowding in many urban school
districts (?NCES, 2000, 2007). As existing facilities fail to keep up with student enrollment growth,
school districts may choose to leverage existing school choice programs to solve overcrowding. The
objective of maximizing existing facility utilization can be embedded in the assignment design,
attracting students to less-crowded schools. This paper studies how students from overcrowded
schools benefit in cognitive and non-cognitive outcomes from the magnet school programs in Wake
County, North Carolina, and proposes a novel approach to estimating overcrowding effects.
Wake County is one of the fastest-growing urban areas in the nation and faces the challenge
of keeping pace with student population growth while delivering quality learning environments.
NCPS (2016) identifies Wake County as having the greatest need in North Carolina for new school
construction between 2015 and 2020.1 In Wake County, grade-entry students are assigned to a “base
school” according to their home addresses. The Wake County magnet program allows students to
apply to receive magnet seats in an annual centralized magnet reassignment. Apart from promoting
diversity and boosting student performance, another essential purpose of the magnet program is to
alleviate school overcrowding with school choice by “maximizing use of school facilities” (WCPSS,
2019b). Given this policy objective, this paper focuses on school overcrowding in traditional schools
and not in magnet schools. The design of the magnet schools’ priority structure over students
reflects this intention with priorities given to students applying from an overcrowded base school,
thus increasing their chances of a successful reassignment to magnet schools.
The empirical challenge in estimating the effect of school overcrowding on student achievement
is that students sort into overcrowded schools. High- or low-performing students may enroll at
overcrowded schools, depending on the reason for overcrowding. Parents may choose to move to
areas where neighborhood schools have desirable characteristics, raising the demand for school seats
and resulting in overcrowding. It is also possible that schools in areas with a higher proportion of
low socioeconomic status students have more difficulty obtaining resources to build and maintain
school facilities to accommodate student growth.2
1In 2015, 59 of the 107 elementary schools in Wake County had more enrolled students than the capacity of theirpermanent buildings and temporary classrooms combined.
2Prior to 2010, Wake County implemented large-scale reassignment policies with the purpose of reducing schoolovercrowding in areas experiencing high population growth and maintaining socioeconomic diversity. Students from
1
In the context of Wake County’s magnet program, this paper evaluates whether students ex-
perience achievement gains from “escaping” overcrowded traditional schools and attending magnet
schools. I separate magnet applicants from traditional schools into two groups by their base school
overcrowding status. The group of applicants with an overcrowded traditional base school likely
“fall back” to their overcrowded base school if they do not receive a magnet offer, while others “fall
back” to a non-overcrowded traditional base school.
This paper adds to the few studies on school overcrowding effects (?Rivera-Batiz and Marti,
1995; Shirley, 2017). Two common solutions to school overcrowding have been examined by the
literature—mobile classrooms and multi-track year-round school calendars. I present an alternative
solution that utilizes an existing school-choice program to attract students away from overcrowded
schools. I also propose a new approach to estimate the effect of school overcrowding. Although
school overcrowding status is likely non-random for students, centralized assignment allows for
random variation in magnet school offers. Taking advantage of the random variation in centralized
school assignments, I provide causally identified estimates of the effect of magnet attendance by
base school overcrowding status following the econometric method proposed by Abdulkadiroglu
et al. (2017). I then examine the differential gain from attending a magnet school by base school
overcrowding status as a proxy of overcrowding effects among applicants to the magnet program.
While I do not find evidence of overcrowding effects on math and literacy skills, the results show a
large and statistically significant overcrowding effect on absenteeism. Compared to students with
a high-performance, non-overcrowded base school, students with a high-performance, overcrowded
base school experience a more than 40% reduction in the number of absences from attending magnet
schools.
This paper contributes to a recent line of research that identifies magnet school effects using
the methodology by Abdulkadiroglu et al. (2017), which fully exploits the conditional random
variation in assignment outcomes (Abebe et al., 2019; Abdulkadiroglu et al., 2020; Dur et al., 2020;
Winters, 2020). Abdulkadiroglu et al.’s (2017) approach extracts an assignment probability or
“propensity score” of each applicant based on their submitted preferences and priorities and the
assignment mechanism applied for the centralized assignment. They show that conditioning on
both high- and low-income neighborhoods were reported to be reassigned and bused to attend less overcrowdedschools, suggesting both types of overcrowded schools may exist in Wake County (Hoxby and Weingarth, 2005;Parcel and Taylor, 2015).
2
the propensity score alone is sufficient to ensure the independence of school offers with respect
to student characteristics, making them valid instruments for school enrollment (Rosenbaum and
Rubin, 1983). This approach fully utilizes the random variation in the assignment and allows for
identifying school choice effects from a larger quasi-experimental sample. Dur et al. (2020) adopts
Abdulkadiroglu et al.’s (2017) propensity score conditioning method to evaluate the impact of
magnet schools in the Wake County Public School System. This paper adopts the approach in Dur
et al. (2020) to identify magnet effects for two subgroups of magnet applicants by their base school
overcrowding status.
The remainder of this paper is organized as follows. Section 2 provides background information
regarding the literature on school overcrowding and Wake County schools. Section 3 provides details
on the Wake County centralized magnet school assignment, the assignment algorithm used in Wake
County, and the assignment propensity scores. Section 4 explains the empirical methodology used
in this paper, with data descriptions discussed in Section 5. Section 6 describes school overcrowding
effects on student outcomes, and Section 7 concludes.
2 Background on Overcrowding and Wake County Assignment
2.1 Literature Review
2.1.1 School Overcrowding
There is little quantitative evidence on the direct effects of school overcrowding on student
outcomes. Rivera-Batiz and Marti (1995) use school-level regression analysis and finds that over-
crowding in New York City public schools has a negative effect on student achievement in schools
with students from low socioeconomic status. For students with high socioeconomic status, school
overcrowding is positively correlated with student achievement, which they explain is a result of
better schools attracting more students. The positive correlation can be evidence of unobserved
student characteristics, which likely correlate with both enrollment in an overcrowded school and
academic outcomes. Shirley (2017) uses the fixed effects model to analyze school-level data of
eleventh graders in Kentucky high schools and does not find evidence of negative correlations be-
tween ACT scores and three- to five-year school overcrowding indicators. ? is the closest work to
3
mine and analyzes student-level panel data from Wake County. They find that school overcrowding
negatively affects students’ reading achievement growth, but not students’ mathematics achieve-
ment growth. They include student, school, and grade-by-year fixed effects in the regression model
to control for time-invariant unobserved characteristics. However, their approach may overlook
the effects of time-variant policies, such as annual reassignment plans that switch students to new
schools to reduce the overcrowding of existing schools. While these students may experience less
severe overcrowding at new schools, their achievement may suffer due to unfamiliar environments
and longer commute times, resulting in overcrowding effects in the opposite direction (WRAL,
2018a).
Another implication of overcrowding is larger class sizes or slow implementation of class size
reduction mandates. Research on multiple school districts reports that facility constraints due to
overcrowding can be a significant obstacle to rolling out class size reduction initiatives (Bohrnstedt
and Stecher, 1999; Green and Doran, 2000).3 There has been extensive literature on the effect of
class size on various outcomes, especially for the Tennessee STAR experiment. In general, studies
have found strong and positive effects of smaller kindergarten class sizes on student test scores, high
school completion, college attendance, wages, fewer arrests, and an array of other adult outcomes
such as participation in retirement saving plans (Chetty et al., 2011; Finn and Achilles, 1990;
Krueger, 1999; Krueger and Whitmore, 2001). Other studies have found mixed evidence of the
effect of smaller class sizes on student outcomes, attributing the reduction in teacher quality to the
dampening of small class effect (Hoxby, 2000; Jepsen and Rivkin, 2009).
It is common practice for schools to use temporary or mobile classrooms to address overcrowding
(NCES, 2007). Descriptive research has shown this practice to be linked with questionable health
and safety conditions and negative student attitudes, despite no significant reported effects in
student achievements (Callahan et al., 1999; ?; NCES, 2007).
The literature has examined two remedies for school overcrowding—mobile classrooms and
multi-track year-round calendars. The body of evidence on mobile classrooms mainly comes from
qualitative analyses or descriptive statistics. They suggest these classrooms have no effect on
student test scores but are associated with negative student attitudes and concerns from teachers
3Table 1 on Wake County elementary school characteristics shows that overcrowded schools have slightly higheraverage class sizes.
4
and principals on health and safety conditions (?).
The effects of multi-track year-round calendars have been studied with more sophisticated
quantitative methods. A multi-track year-round calendar allows more students to use facilities by
operating on separate schedules with periodic breaks. On the one hand, the alternating schedules
help maximize school facilities’ utilization and serve more students. On the other hand, they disrupt
traditional school schedules and add stress to teachers. Graves (2010) uses panel data methods to
analyze school-level longitudinal data from California. She finds a negative impact of multi-track
year-round calendars on student academic performance with a 1-2% drop in national percentile
rank. While McMullen and Rouse (2012) find no discernible overall impact of year-round calendars
on student test scores using fixed-effects models, McMullen et al. (2015) use quantile regressions
and show small positive effects for the lowest-performing students.
2.1.2 Estimating School Choice Effects Using Centralized Assignments
A growing literature evaluates education programs by exploiting variation created through ran-
domized lotteries at selective schools or in centralized assignments of a set of schools. Using assign-
ment outcomes based on exogenous variation allows for causal identification of student achievement
gains free of bias created by student sorting into schools. Several papers take advantage of random
variation based on lotteries administered at the school level by selective schools and open-enrollment
programs, using lottery outcomes at each school or program as instruments for student enrollment
(?Cullen et al., 2006; Engberg et al., 2014).
On the other hand, many studies focus on district-wide centralized assignments comprised of
multiple schools where students submit a ranked order of schools to the assignment system. A
student’s first-choice school is the school that she prefers to any other school. Studies of district-
wide school choice plans have frequently used lottery outcomes at students’ first-choice schools
as instruments for first-choice school attendance. In general, attending the first-choice school in
centralized assignments is found to result in positive test score impacts and, in some cases, better
outcomes related to crime and college attendance (Hastings et al., 2012a; Deming, 2011; Deming
et al., 2014). Other studies instrument exposure to charter schools with charter offers, with controls
for every combination of charter school lotteries each student was subject to (Abdulkadiroglu et al.,
2011; Angrist et al., 2013, 2016). However, prior research only uses random variation generated at
5
the first-choice schools or oversubscribed schools, limiting the representativeness of the estimates.
In centralized assignments, students losing lotteries at oversubscribed schools can create random
variations at lower-ranked schools, which are not fully exploited in the studies mentioned above.
Abdulkadiroglu et al. (2017) provides a new method that fully exploits the random variation
created by lotteries through propensity scores, which represents the probability of receiving an
offer from any school on a student’s submitted preference list. They suggest that conditioning on
propensity scores sufficiently ensures that offers are independent of student characteristics. Using
administrative data on Wake County’s centralized assignment for magnet school seats, Dur et al.
(2020) follow this new approach and causally identify the effect of magnet school attendance for
Wake County applicants. They find robust evidence of positive magnet effects on math skills and
attendance among magnet applicants. Abdulkadiroglu et al. (2020) use this method to generate
bias-free estimates of school effects on applicants to a minority of New York City high schools
that are subject to random assignment. They use these estimates as benchmark results to test the
accuracy of two other models developed based on the district-wide sample including non-applicants.
The majority of research on school choice evaluates the programs as a whole and estimates the
school choice effects on all students regardless of their fallback options when they lose the lottery.
Little research has been done to study policy-relevant aspects of school choice, such as differential
effects related to overcrowding. This paper follows the econometric method in Dur et al. (2020)
and adapts it to account for differential treatment effects for two student subgroups that vary by
their base school overcrowding status.
2.2 School Overcrowding in Wake County
The Wake County Public School System is the 15th large school district in the United States,
with 159,549 students enrolled in 187 schools as of the 2018-19 school year. Wake County has
experienced rapid population growth in recent years. From 2004-2005 to 2015-2016, the student
population in the district grew by 38% (NCPS, 2015a). NCPS (2016) concludes that Wake County
is in the greatest need of new schools among all school districts in North Carolina. Elementary
schools have been identified as the grade levels with the highest need for new construction or
existing renovation. In this study, I focus on overcrowding in elementary schools, as it is more
prevalent among a larger set of schools.
6
In 2015, 59 of the 107 (27%) Wake County elementary schools were above 100% of the school’s
capacity and 29 were above 106%, the threshold by which the National Center for Education
Statistics deems a school overcrowded (WCPSS, 2015a; NCES, 2007). An increase in class sizes
due to school overcrowding is less of a concern in Wake County, North Carolina. The current North
Carolina class size mandate caps are set at 23 students per classroom for grades K-3. With the
new state class-size mandate, which limits class size to 19 to 21, going into effect in the fall of 2019,
the school district is under even more pressure to increase the number of classrooms. The school
district has addressed overcrowding in several ways.
Despite the high costs, Wake County has been building new schools to address the rapid growth
in student population. The Community Improvement Program (CIP) in Wake County was passed
to allow for $565 million in bonds to be invested in the construction of new schools between 2013
and 2019. (WCPSS, 2019a). Utilizing facilities at new schools to alleviate overcrowding at existing
schools often leads to students being reassigned to new schools. Many students and parents subject
to reassignment have voiced their concerns, including longer commute times, unexpected changes
in the school calendar, or adapting to a new environment(WRAL, 2018a,c,b).
In addition to building new schools, Wake County Public Schools have taken advantage of
adapting existing spaces by using mobile/modular classroom units and multi-track year-round
schools. As of 2009, there are more than 1,000 mobile units throughout the district. In the
2014-2015 school year, 17.3% of all capacity in elementary school is in temporary classrooms. In
2006, year-round schools were introduced as another remedy for school overcrowding. As of 2016,
37 elementary schools are year-round schools, and seven are multi-track. Multi-track year-round
schools split students into four groups with three in class at all times as a way to increase the
campus capacity.
Compared to the solutions discussed above, the existing magnet school program helps alleviate
overcrowding on a smaller scale, but it has two advantages. First, participation in the magnet
program is entirely voluntary—students are free to apply for reassignment at any magnet school
or not apply at all. This feature minimizes controversy compared with one-size-fits-all plans to
convert school calendars or reassign current students to newly built schools. Second, the assignment
operates within the given capacities of each magnet school. Since no additional seats at magnet
schools are required, the district can save on new school construction or new mobile classrooms.
7
3 Assignment, Deferred Acceptance, and Assignment Propensity
Scores
3.1 Centralized Assignment in Wake County
In Wake County, all students are initially assigned to a neighborhood base school based on
their home address. The base school is the default enrollment option if students do not apply
to be reassigned to a magnet school, an alternative calendar school, or a charter school. Wake
County conducts an annual centralized assignment that allows students of any grade to apply to
be reassigned to a magnet school. The magnet school program is the most established diversity
program in the school district, and is intended to “reduce high concentrations of poverty” and
“promote diverse populations” (WCPSS, 2019b). The school district also intends to alleviate
school overcrowding with school choice by “maximizing use of school facilities.”
Since the 2015-2016 school year, Wake County has used the Deferred Acceptance (DA) algorithm
to assign applicants to most district schools. In the assignment process, magnet seats are assigned
up to schools’ pre-determined capacities based on student preferences and school priorities. Students
submit a list of up to five schools ranked by their preference over the schools. Schools also have
“preferences” over students, called “priorities”, which are functions of student characteristics. In
addition to priorities, schools also use a single lottery number assigned to each student to break
ties. The lottery numbers are unknown to applicants.
The school district designs the priority structure. At elementary schools, current magnet seat
holders in grades K-4 have guaranteed seats in the next academic year. The highest priority at a
school is assigned to those with siblings currently attending this school. Students residing in an
area with high socioeconomic status receive the second-highest priority. Next, there are a set of
facility utilization (or overcrowding) priorities granted to students with overcrowded base schools.
The district’s intention of addressing overcrowding with school choice is reflected in the utilization
priorities. A student with an overcrowded base school has higher priorities at all magnet schools
than a student with a non-overcrowded base school, holding sibling status and residence area the
same. A student with a severely overcrowded base school is also granted higher priorities than a
student whose base school is moderately overcrowded. Overcrowding is defined as having projected
8
enrollment over 105% of projected capacity.4
3.2 Assignment algorithm: Deferred Acceptance (DA)
Deferred Acceptance (DA) is the most widely-used centralized assignment mechanism. DA is an
algorithm with inputs of preferences, priorities, and school capacities coupled with lottery numbers
for each applicant, and an output of a vector of assignment outcomes that specifies each student’s
assigned school (or lack thereof) among the set of schools subject to DA. The DA process is simple
and shown as follows:
Step 1. Each applicant applies to the highest-ranked school on her preference list, i.e. the most
preferred school.
Step 2. Each school receives the applications and ranks applicants by priorities. Students with
the same priorities, if any, are then ranked by lottery numbers. According to the ranked list of all
applicants, schools give temporary seats to the highest-ranked up to its capacity and reject others.
Step 3. Each rejected applicant applies to the next highest-ranked school on her list.
Step 4. Each school pools the new applicants together with all students currently offered a
temporary seat and ranks them first by priority and then by lottery number. Schools give temporary
seats to the highest-ranked applicants up to its capacity and reject others.
Repeat Step 1 through Step 4 until:
Step n. All students are either temporarily seated at a school or have been rejected by all schools
on their preference lists. As a result, no one initiates new applications. Now, DA is terminated,
and schools offer seats for those who were previously temporarily seated. Each student is seated
at only one school since students cannot apply for other schools unless they are rejected at the one
they have just applied to.
In Wake County, the school-student-specific priorities are coarse, meaning that many students
can share the same priorities at a given school. Therefore, students can be subject to tie-breaking
4There are four categories of overcrowding priorities. The highest priority category is granted to students withbase schools projected to be over 120% overcrowded. In 2015-2016, 30 elementary schools were projected to havean overcrowding percentage over 120%. Students with base school overcrowding measure between 115%, and 120%have the second-highest category of utilization priority. The third category is for those from base schools withovercrowding measures between 110% and 115%, and the fourth category for overcrowding measures between 105%and 110%. Many magnet applicants have overcrowding priorities in Wake County. In the 2015-2016 school year’smagnet assignment, 44% of applicants have overcrowding priorities, while 62% of those receiving magnet offers haveovercrowding priorities.
9
using lottery numbers in order to obtain a magnet seat. When a school is oversubscribed, students
with the highest priorities will always be assigned regardless of their lottery numbers. Lottery tie-
breaking takes place when a school has more applicants with the same priorities than the number
of remaining seats. These applicants are conditionally seated, which means that their assignment is
purely determined by lottery numbers. Therefore, conditionally seated applicants at a given school
have the same probability of assignment to that school.
3.3 Assignment Propensity Scores
It is straightforward that DA allows for random variation for conditionally seated students
at oversubscribed schools. Under different draws of random lottery numbers, these students can
experience various assignment outcomes. More interestingly, DA also results in random variation
at undersubscribed schools.
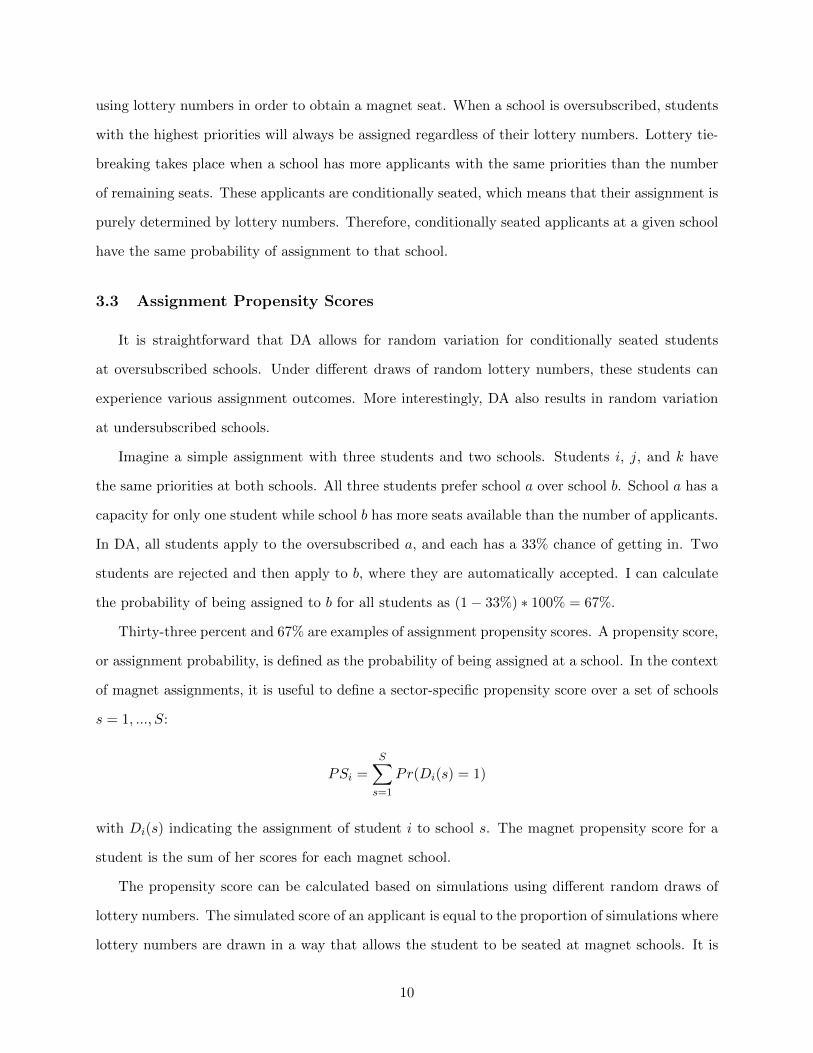
Imagine a simple assignment with three students and two schools. Students i, j, and k have
the same priorities at both schools. All three students prefer school a over school b. School a has a
capacity for only one student while school b has more seats available than the number of applicants.
In DA, all students apply to the oversubscribed a, and each has a 33% chance of getting in. Two
students are rejected and then apply to b, where they are automatically accepted. I can calculate
the probability of being assigned to b for all students as (1− 33%) ∗ 100% = 67%.
Thirty-three percent and 67% are examples of assignment propensity scores. A propensity score,
or assignment probability, is defined as the probability of being assigned at a school. In the context
of magnet assignments, it is useful to define a sector-specific propensity score over a set of schools
s = 1, ..., S:
PSi =S∑
s=1
Pr(Di(s) = 1)
with Di(s) indicating the assignment of student i to school s. The magnet propensity score for a
student is the sum of her scores for each magnet school.
The propensity score can be calculated based on simulations using different random draws of
lottery numbers. The simulated score of an applicant is equal to the proportion of simulations where
lottery numbers are drawn in a way that allows the student to be seated at magnet schools. It is
10
worth noting that simulations input preferences, priorities, and capacities in the original assignment
algorithm that produces offers to students to consider. To generate propensity scores in this paper,
I ran the assignment one million times, each time with a new set of random lottery numbers. I
then count the number of times students were assigned to each magnet school and divide them by
one million to calculate the school-specific propensity scores.
4 Empirical Strategy
I follow the econometric method proposed by Abdulkadiroglu et al. (2017) and first implemented
in the Wake County setting by Dur et al. (2020). This method fully exploits the conditional random
variation in assignment outcomes by conditioning on assignment propensity scores, which group
students together based on their preferences and priorities. As long as students have the same
propensity score, their offer is independent of other characteristics. Compared to lottery indica-
tors used in traditional approaches, such as the first-choice instruments approach, conditioning on
propensity scores generates a richer sample, as lottery indicators only group students based on
whether they are subject to the same lottery.
Imbens and Angrist (1994) have shown that the local average treatment effect (LATE) for
those who comply with their assignment can be causally identified under the assumptions of inde-
pendence, exclusion, and monotonicity. These assumptions are listed below for a variation of the
potential outcomes model. Independence asserts that the assignment outcome must be independent
of potential enrollment and outcomes. In the case of centralized school assignments described in
Section 3, the assignment outcome is only conditionally random for students who are in the same
lottery. Traditional methods only account for random variation at oversubscribed schools that are
listed as students’ first choice. However, it is embedded in the DA algorithm that undersubscribed
schools are also subject to conditional random variation in student offers, since lottery losers apply
to a lower-ranked school conditional on losing the tie-breaking with a set probability.
Rosenbaum and Rubin (1983) showed that offers are independent of potential individual char-
acteristics conditional on propensity scores, thus eliminating omitted variable bias. The method in
Abdulkadiroglu et al. (2017) builds on this. It runs a classic IV model conditional on assignment
propensity scores at magnet schools instead of lottery indicators. Propensity-score conditioning
11
allows researchers to identify causal effects based on random variation even at undersubscribed
magnet schools. Therefore, this method provides the largest sample size available in the dataset
and identifies LATE for a larger and more representative complier sample. Under standard as-
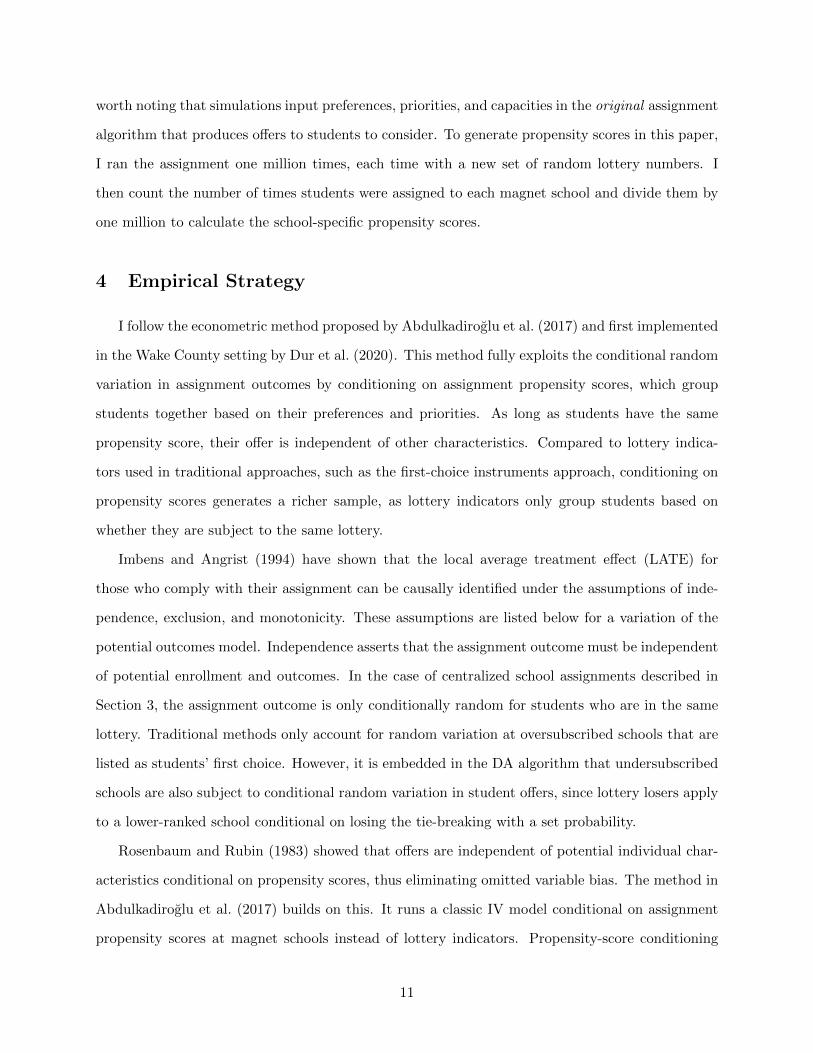
sumptions of LATE, an IV model that follows Abdulkadiroglu et al. (2017) is:
Y = µ+ βD +G(PS) +X ′δ + ε (1)
with D, magnet attendance, instrumented by Z, an indicator for receiving an offer from any magnet
school. G(PS) indicates a function of assignment propensity scores. β is the average effect of
magnet attendance on student outcomes for compliers.
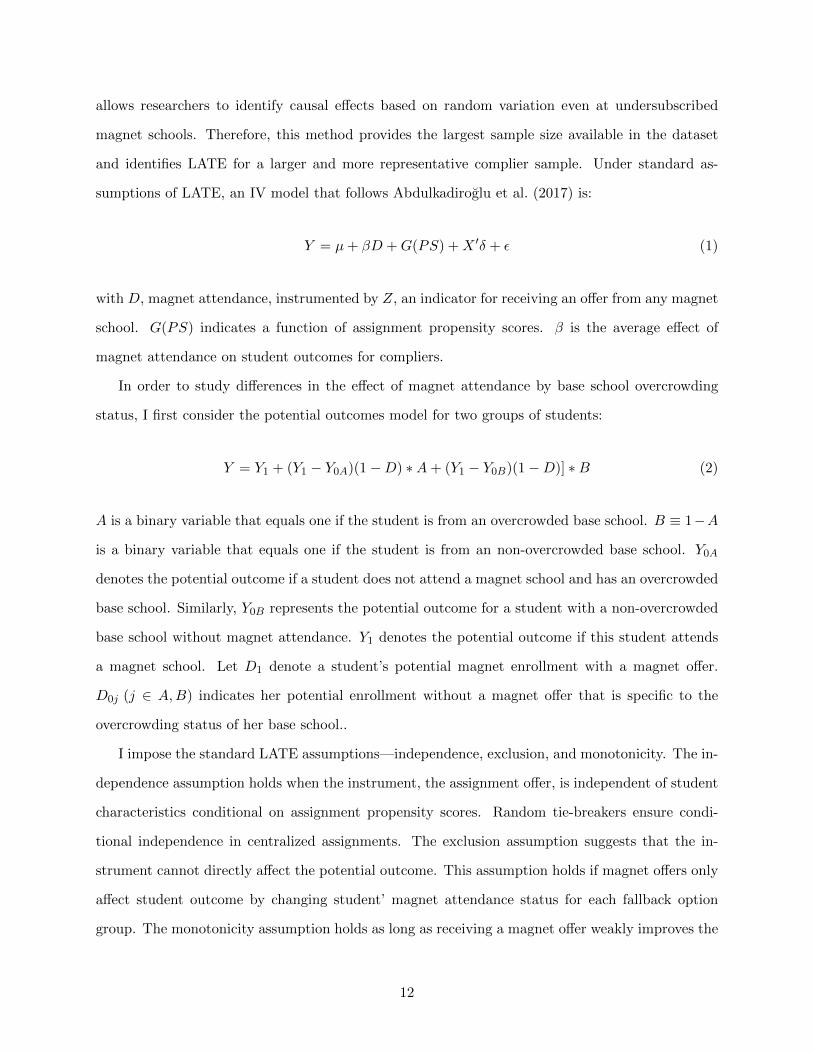
In order to study differences in the effect of magnet attendance by base school overcrowding
status, I first consider the potential outcomes model for two groups of students:
Y = Y1 + (Y1 − Y0A)(1−D) ∗A+ (Y1 − Y0B)(1−D)] ∗B (2)
A is a binary variable that equals one if the student is from an overcrowded base school. B ≡ 1−A
is a binary variable that equals one if the student is from an non-overcrowded base school. Y0A
denotes the potential outcome if a student does not attend a magnet school and has an overcrowded
base school. Similarly, Y0B represents the potential outcome for a student with a non-overcrowded
base school without magnet attendance. Y1 denotes the potential outcome if this student attends
a magnet school. Let D1 denote a student’s potential magnet enrollment with a magnet offer.
D0j (j ∈ A,B) indicates her potential enrollment without a magnet offer that is specific to the
overcrowding status of her base school..
I impose the standard LATE assumptions—independence, exclusion, and monotonicity. The in-
dependence assumption holds when the instrument, the assignment offer, is independent of student
characteristics conditional on assignment propensity scores. Random tie-breakers ensure condi-
tional independence in centralized assignments. The exclusion assumption suggests that the in-
strument cannot directly affect the potential outcome. This assumption holds if magnet offers only
affect student outcome by changing student’ magnet attendance status for each fallback option
group. The monotonicity assumption holds as long as receiving a magnet offer weakly improves the
12
chance of attending a magnet school. It is reasonable to assume that magnet offers do not deter
students from attending.
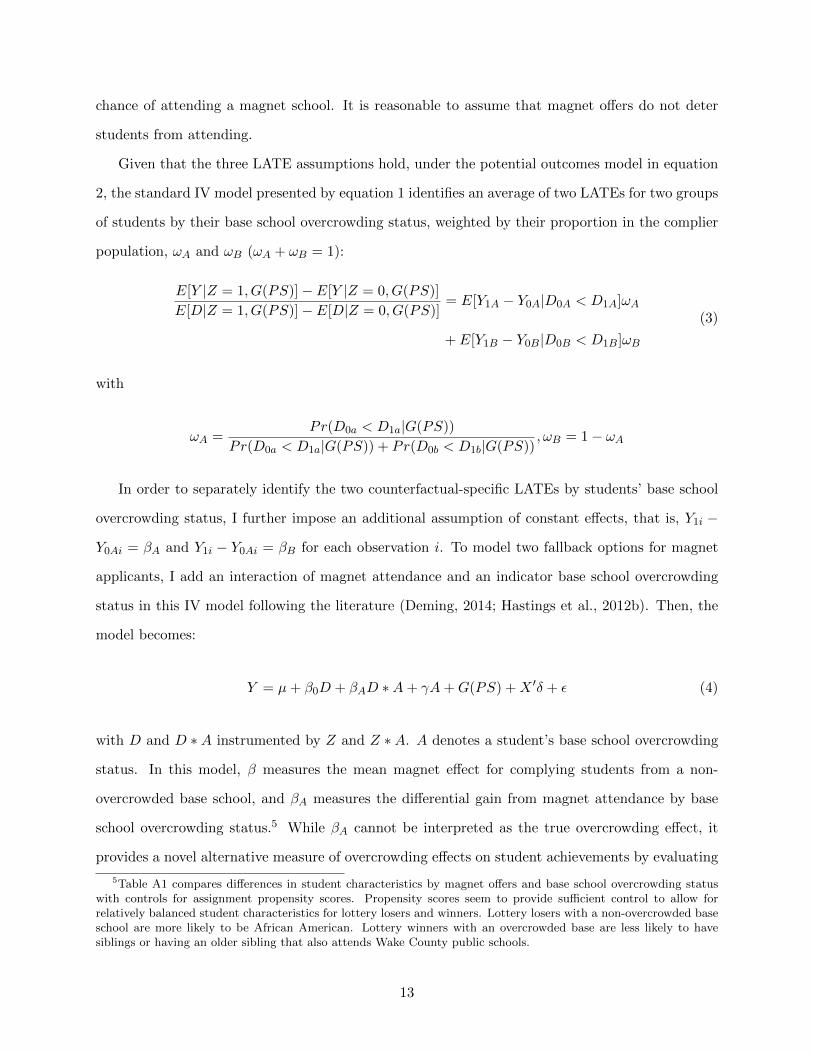
Given that the three LATE assumptions hold, under the potential outcomes model in equation
2, the standard IV model presented by equation 1 identifies an average of two LATEs for two groups
of students by their base school overcrowding status, weighted by their proportion in the complier
population, ωA and ωB (ωA + ωB = 1):
E[Y |Z = 1, G(PS)]− E[Y |Z = 0, G(PS)]
E[D|Z = 1, G(PS)]− E[D|Z = 0, G(PS)]= E[Y1A − Y0A|D0A < D1A]ωA
+ E[Y1B − Y0B|D0B < D1B]ωB
(3)
with
ωA =Pr(D0a < D1a|G(PS))
Pr(D0a < D1a|G(PS)) + Pr(D0b < D1b|G(PS)), ωB = 1− ωA
In order to separately identify the two counterfactual-specific LATEs by students’ base school
overcrowding status, I further impose an additional assumption of constant effects, that is, Y1i −
Y0Ai = βA and Y1i − Y0Ai = βB for each observation i. To model two fallback options for magnet
applicants, I add an interaction of magnet attendance and an indicator base school overcrowding
status in this IV model following the literature (Deming, 2014; Hastings et al., 2012b). Then, the
model becomes:
Y = µ+ β0D + βAD ∗A+ γA+G(PS) +X ′δ + ε (4)
with D and D ∗ A instrumented by Z and Z ∗ A. A denotes a student’s base school overcrowding
status. In this model, β measures the mean magnet effect for complying students from a non-
overcrowded base school, and βA measures the differential gain from magnet attendance by base
school overcrowding status.5 While βA cannot be interpreted as the true overcrowding effect, it
provides a novel alternative measure of overcrowding effects on student achievements by evaluating
5Table A1 compares differences in student characteristics by magnet offers and base school overcrowding statuswith controls for assignment propensity scores. Propensity scores seem to provide sufficient control to allow forrelatively balanced student characteristics for lottery losers and winners. Lottery losers with a non-overcrowded baseschool are more likely to be African American. Lottery winners with an overcrowded base are less likely to havesiblings or having an older sibling that also attends Wake County public schools.
13
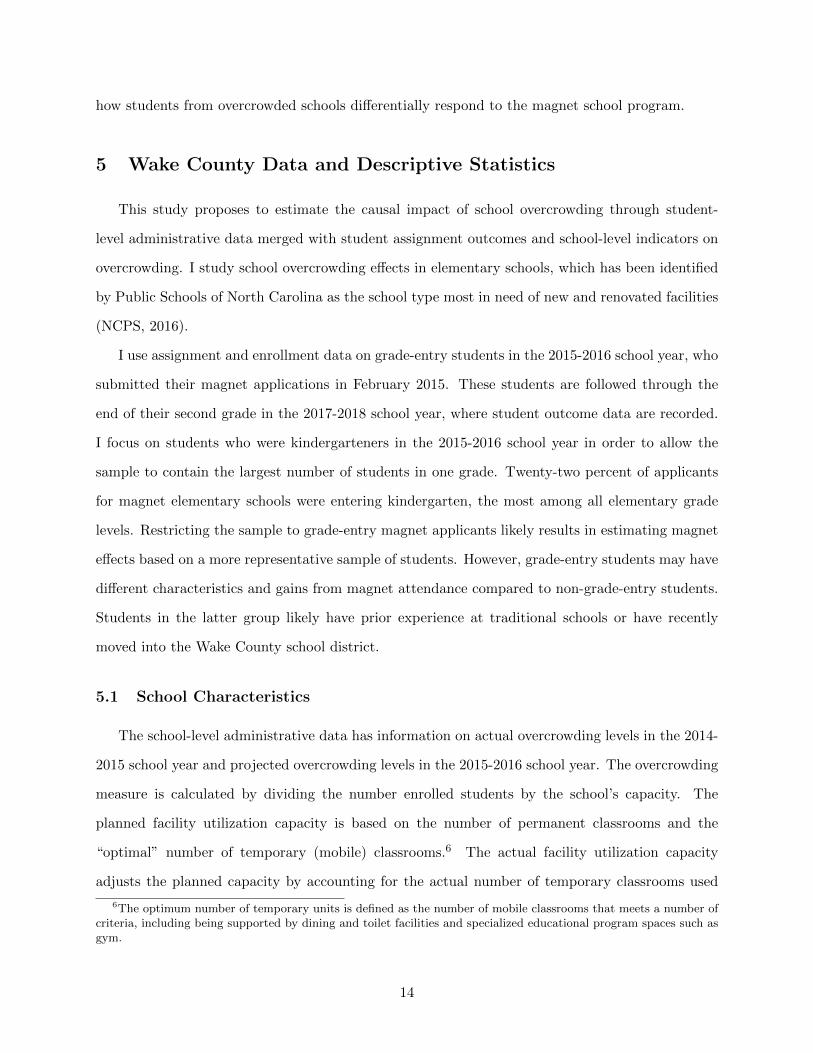
how students from overcrowded schools differentially respond to the magnet school program.
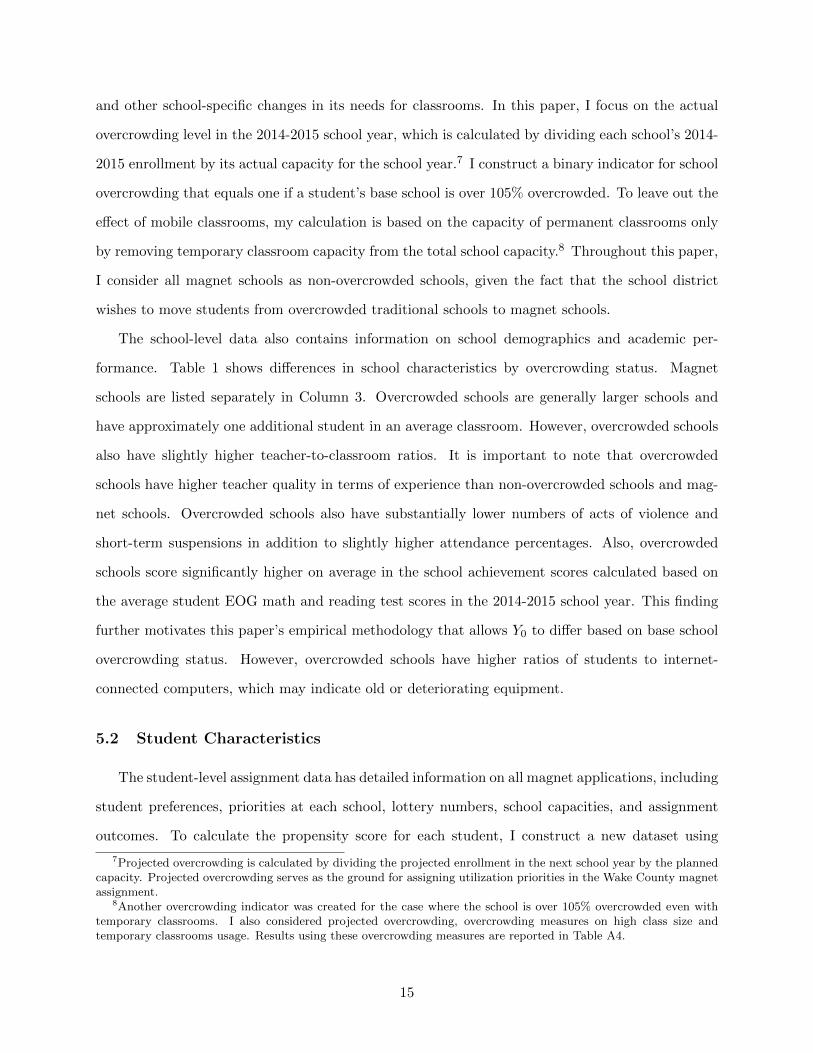
5 Wake County Data and Descriptive Statistics
This study proposes to estimate the causal impact of school overcrowding through student-
level administrative data merged with student assignment outcomes and school-level indicators on
overcrowding. I study school overcrowding effects in elementary schools, which has been identified
by Public Schools of North Carolina as the school type most in need of new and renovated facilities
(NCPS, 2016).
I use assignment and enrollment data on grade-entry students in the 2015-2016 school year, who
submitted their magnet applications in February 2015. These students are followed through the
end of their second grade in the 2017-2018 school year, where student outcome data are recorded.
I focus on students who were kindergarteners in the 2015-2016 school year in order to allow the
sample to contain the largest number of students in one grade. Twenty-two percent of applicants
for magnet elementary schools were entering kindergarten, the most among all elementary grade
levels. Restricting the sample to grade-entry magnet applicants likely results in estimating magnet
effects based on a more representative sample of students. However, grade-entry students may have
different characteristics and gains from magnet attendance compared to non-grade-entry students.
Students in the latter group likely have prior experience at traditional schools or have recently
moved into the Wake County school district.
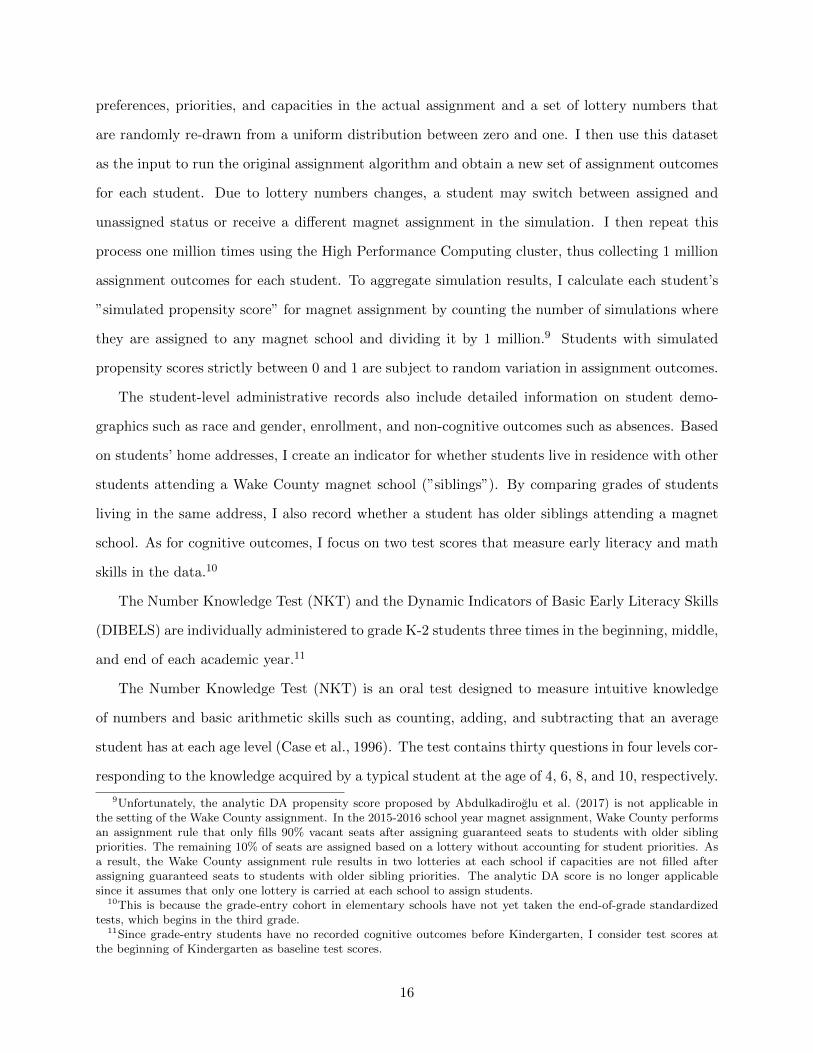
5.1 School Characteristics
The school-level administrative data has information on actual overcrowding levels in the 2014-
2015 school year and projected overcrowding levels in the 2015-2016 school year. The overcrowding
measure is calculated by dividing the number enrolled students by the school’s capacity. The
planned facility utilization capacity is based on the number of permanent classrooms and the
“optimal” number of temporary (mobile) classrooms.6 The actual facility utilization capacity
adjusts the planned capacity by accounting for the actual number of temporary classrooms used
6The optimum number of temporary units is defined as the number of mobile classrooms that meets a number ofcriteria, including being supported by dining and toilet facilities and specialized educational program spaces such asgym.
14
and other school-specific changes in its needs for classrooms. In this paper, I focus on the actual
overcrowding level in the 2014-2015 school year, which is calculated by dividing each school’s 2014-
2015 enrollment by its actual capacity for the school year.7 I construct a binary indicator for school
overcrowding that equals one if a student’s base school is over 105% overcrowded. To leave out the
effect of mobile classrooms, my calculation is based on the capacity of permanent classrooms only
by removing temporary classroom capacity from the total school capacity.8 Throughout this paper,
I consider all magnet schools as non-overcrowded schools, given the fact that the school district
wishes to move students from overcrowded traditional schools to magnet schools.
The school-level data also contains information on school demographics and academic per-
formance. Table 1 shows differences in school characteristics by overcrowding status. Magnet
schools are listed separately in Column 3. Overcrowded schools are generally larger schools and
have approximately one additional student in an average classroom. However, overcrowded schools
also have slightly higher teacher-to-classroom ratios. It is important to note that overcrowded
schools have higher teacher quality in terms of experience than non-overcrowded schools and mag-
net schools. Overcrowded schools also have substantially lower numbers of acts of violence and
short-term suspensions in addition to slightly higher attendance percentages. Also, overcrowded
schools score significantly higher on average in the school achievement scores calculated based on
the average student EOG math and reading test scores in the 2014-2015 school year. This finding
further motivates this paper’s empirical methodology that allows Y0 to differ based on base school
overcrowding status. However, overcrowded schools have higher ratios of students to internet-
connected computers, which may indicate old or deteriorating equipment.
5.2 Student Characteristics
The student-level assignment data has detailed information on all magnet applications, including
student preferences, priorities at each school, lottery numbers, school capacities, and assignment
outcomes. To calculate the propensity score for each student, I construct a new dataset using
7Projected overcrowding is calculated by dividing the projected enrollment in the next school year by the plannedcapacity. Projected overcrowding serves as the ground for assigning utilization priorities in the Wake County magnetassignment.
8Another overcrowding indicator was created for the case where the school is over 105% overcrowded even withtemporary classrooms. I also considered projected overcrowding, overcrowding measures on high class size andtemporary classrooms usage. Results using these overcrowding measures are reported in Table A4.
15
preferences, priorities, and capacities in the actual assignment and a set of lottery numbers that
are randomly re-drawn from a uniform distribution between zero and one. I then use this dataset
as the input to run the original assignment algorithm and obtain a new set of assignment outcomes
for each student. Due to lottery numbers changes, a student may switch between assigned and
unassigned status or receive a different magnet assignment in the simulation. I then repeat this
process one million times using the High Performance Computing cluster, thus collecting 1 million
assignment outcomes for each student. To aggregate simulation results, I calculate each student’s
”simulated propensity score” for magnet assignment by counting the number of simulations where
they are assigned to any magnet school and dividing it by 1 million.9 Students with simulated
propensity scores strictly between 0 and 1 are subject to random variation in assignment outcomes.
The student-level administrative records also include detailed information on student demo-
graphics such as race and gender, enrollment, and non-cognitive outcomes such as absences. Based
on students’ home addresses, I create an indicator for whether students live in residence with other
students attending a Wake County magnet school (”siblings”). By comparing grades of students
living in the same address, I also record whether a student has older siblings attending a magnet
school. As for cognitive outcomes, I focus on two test scores that measure early literacy and math
skills in the data.10
The Number Knowledge Test (NKT) and the Dynamic Indicators of Basic Early Literacy Skills
(DIBELS) are individually administered to grade K-2 students three times in the beginning, middle,
and end of each academic year.11
The Number Knowledge Test (NKT) is an oral test designed to measure intuitive knowledge
of numbers and basic arithmetic skills such as counting, adding, and subtracting that an average
student has at each age level (Case et al., 1996). The test contains thirty questions in four levels cor-
responding to the knowledge acquired by a typical student at the age of 4, 6, 8, and 10, respectively.
9Unfortunately, the analytic DA propensity score proposed by Abdulkadiroglu et al. (2017) is not applicable inthe setting of the Wake County assignment. In the 2015-2016 school year magnet assignment, Wake County performsan assignment rule that only fills 90% vacant seats after assigning guaranteed seats to students with older siblingpriorities. The remaining 10% of seats are assigned based on a lottery without accounting for student priorities. Asa result, the Wake County assignment rule results in two lotteries at each school if capacities are not filled afterassigning guaranteed seats to students with older sibling priorities. The analytic DA score is no longer applicablesince it assumes that only one lottery is carried at each school to assign students.
10This is because the grade-entry cohort in elementary schools have not yet taken the end-of-grade standardizedtests, which begins in the third grade.
11Since grade-entry students have no recorded cognitive outcomes before Kindergarten, I consider test scores atthe beginning of Kindergarten as baseline test scores.
16
The student cannot proceed to the next level of questions if she has committed three consecutive
errors in the current level. The NKT score is widely used to measure early math achievement in
literature from various disciplines (Jerrim and Vignoles, 2016; Ribner et al., 2019; Zhang et al.,
2019). Several studies have shown a strong positive correlation between the NKT score and later
math and reading attainment and a negative correlation with behavioral problems such as physical
aggression in elementary school (Cowan et al., 2011; ?; Jordan et al., 2007; Romano et al., 2010).
Gersten et al. (2005) finds that the NKT works well as a screening measure for students with math
difficulties. Research using growth models shows students in low-increasing trajectories of early
number knowledge consistently fall behind in math learning through elementary school, suggesting
the importance of early identification and intervention for students with deficits in number sense
following NKT test results (?Jordan et al., 2007). The raw test score is between 1 and 30. I create
an indicator for students who score above 14, the cutoff for having math skills, not below the grade
level of K-1.12 This indicator of not scoring below grade level is interpreted as the student not
being at-risk in terms of early math skills, as low NKT scores are predictive of low achievements
in math learning as students progress to higher grades (?Jordan et al., 2007).
The Dynamic Indicators of Basic Early Literacy Skills (DIBELS) is designed to measure early
literacy skills and identify students experiencing difficulty acquiring these skills to provide support
early on (Good and Kaminski, 1996). Like the NKT, the DIBELS is also an individually adminis-
tered oral test where students read out passages to teachers. For second graders, DIBELS consists
of measures on students’ speed and accuracy in reading connected text (Oral Reading Fluency,
ORF) and comprehension of the text (Retell). DIBELS has gained widespread use in the United
States, with numerous studies showing its predictive power for later reading attainment in elemen-
tary school and its effectiveness with identifying students at risk of reading difficulties (Good et al.,
2001; Smolkowski and Cummings, 2016; Pears et al., 2016; Roehrig et al., 2008). More specifically,
Barger (2003) find a strong correlation between the DIBELS ORF score and North Carolina end-
of-grade reading scores when these two tests were taken one week apart. I create a binary indicator
for not scoring well below the DIBELS test benchmark and focus on this outcome for literacy skills
in this paper. This definition is consistent with the test’s objective to identify students with literacy
12The developmental conversion chart that exhibits how raw scores are converted to grade levelsis available at https://s3.amazonaws.com/ecommerce-prod.mheducation.com/unitas/school/explore/sites/number-worlds/number-worlds-number-knowledge-test.pdf.
17
skills ”at-risk” of falling behind.
A large body of literature has examined non-cognitive skills that are not captured by standard-
ized tests and shown that these skills have significant effects on long-term outcomes in students’
adult lives (Heckman and Rubinstein, 2001; Borghans et al., 2008; Lindqvist and Vestman, 2011).
Following the literature, I use one behavioral measure available in the dataset as a proxy for non-
cognitive skills - the log of the number of absences between grade 0.13
Table 2 shows student characteristics for all students who applied for a Kindergarten seat
in the magnet school program for the 2015-2016 school year. Column (2) and (3) show mean
characteristics for subgroups by base school overcrowding status. Overcrowded schools have a
slightly higher proportion of male students. Students from overcrowded schools are less likely to
be African American and and more likely to be Hispanic students compared to those from non-
overcrowded schools. Average NKT scores at the beginning of Kindergarten is slightly higher
at overcrowded schools, while the proportion of students not at-risk in literacy skills is lower. I
consider test scores recorded at the beginning of Kindergarten as baseline test scores that indicate
student ability before any school influence. Hence, these results suggest that both positive and
negative sorting into overcrowded schools depending on the subject. As for assignment outcomes,
students from overcrowded base schools are more likely to receive an offer and have higher median
priority at first choice school compared to students from non-overcrowded base schools. This result
is consistent with the priority structure design that prioritizes the magnet assignment of these
students.14
13In order to measure non-cognitive skills, Jackson (2018) constructs a behavior index with five behavioral variables,including log absences.
14Table A2 shows that lottery winners with an overcrowded base school are slightly more likely to attend an offeredmagnet school than lottery winners with a non-overcrowded base school. Lottery losers with an overcrowded basehave a higher rate of compliance by attending their base school than lottery losers with a non-overcrowded baseschool. In general, students with an overcrowded base are also less likely to leave the school district. Figure 1shows the relationship between three student outcomes and magnet attendance by base school’s actual overcrowdingintensity in the 2014-2015 school year. The outcome difference by magnet attendance for log absences increases asovercrowding measure reaches above 100%.
18
6 Results and Discussion
6.1 Overall effects
The estimation sample for Table 3 is all students with an assignment propensity score strictly
between 0 and 1 who do not have a magnet as base school and are continuously enrolled be-
tween 2015-2016 and 2017-2018. School-level controls for base schools include binary indicators for
below-median one-year teacher turnover rate, as well as average acts of violence and short-term
suspensions. These measures are recorded in the 2014-2015 school year, prior to the enrollment of
Kindergarten magnet applicants for the 2015-2016 school year.15
I measure math skills for second graders using scores from a shortened version of the Number
Knowledge Test (NKT). The mean score is 25.2 for second graders at the end of the 2017-2018
school year in the sample. This score’s chronological age equivalent is about seven to eight years
old, and the grade level equivalent is about grade 2-3 (Case et al., 1996). Of the 973 children in the
estimation sample, only 9 had missing NKT scores. I also create an indicator that equals one if a
student has an NKT score above 14, suggesting a grade level equivalence of grade 1-2 and above.
I present in Part A, Table 3, the second-stage estimates of magnet effects on math skills by school
overcrowding status based on the model shown in equation 4. Column (1) shows the differential
magnet effect, which I consider as an alternative measure of overcrowding effects. If falling back
to an overcrowded base school instead of a non-overcrowded base school results in worse outcomes,
i.e. negative overcrowding effects, the magnet gain for students from overcrowded schools should
be stronger. Column (2) and (3) show that magnet effects are positive and statistically significant
regardless of applicants’ base school overcrowding status. Results suggest that attending a magnet
school increases NKT score by more than four points on average for applicants regardless of their
base schools’ overcrowding status. These points gain are equivalent to an improvement in math
skills equivalent to approximately one grade level. Magnet effects are also positive and statistically
15Table A2 shows the enrollment status of magnet school applicants who are subject to lotteries. I have left outapplicants with a magnet base school. Results are presented for four subgroups by whether they have won the lotteryand their base school overcrowding status. A substantial proportion of lottery losers with non-overcrowded schoolsend up attending a magnet school, compared to the other groups. In addition, applicants with a non-overcrowdedbase school are more likely to leave the school district regardless of whether they received a magnet seat. Column(1), Table A3, shows the first-stage estimate of the effect of receiving a magnet offer on magnet school attendancein Kindergarten. Column (2) suggests some level of differential compliance by base school overcrowding status, asevidenced in Table A2.
19
significant on not receiving the at-risk status of math skills. Magnet attendance contributes to a
31 to 33 percent reduction in at-risk status in math skills, depending on base school’s overcrowding
status. The differential magnet gain for both math outcomes are small and not significantly different
from zero, which indicates minimal overcrowding effects on students’ math skills.16
Part B, Table 3, displays magnet effects on normalized Dynamic Indicators of Basic Early
Literacy Skills (DIBELS) test scores and being identified as at-risk in the DIBELS test, which
measures early literacy skills. Compared to the NKT test, there are around 30 more students
with missing scores.17 For students from both overcrowded and non-overcrowded base schools,
attending a magnet school has no discernible effect on improving DIBELS scores or the chance of
not being an at-risk student. These null results of magnet effects on literacy skills are consistent
with the literature (?Dur et al., 2020). The gap in magnet effects by overcrowding status suggests
overcrowding effects is not statistically significantly different from zero. These results, however, are
also estimated with large noise.18
Part C, Table 3, shows results on the non-cognitive outcome of absences. The dependent
variable, log absences, is calculated by taking the logarithm of one plus all absences of each student
in the three school years between 2015-2016 and 2017-2018. Estimates in Column (2) show that
students with an overcrowded base schools have a statistically significant reduction in the number
of absences by more than 90% from attending a magnet school. Column (3) shows magnet effects
of a 40% reduction in absences for students from non-overcrowded base schools. The differential
gain is large and statistically significant, indicating strong negative overcrowding effects on student
attendance. The effect size is an almost 50% increase in absences throughout the three school years
observed in my sample, which is equivalent to attending around 10 days fewer than students in non-
overcrowded base schools. Possible explanations for negative overcrowding effects on non-cognitive
outcomes include reduced engagement with the school.19
16Table A4 and A5 show regression results under six alternative specifications that are largely consistent withresults shown in Part A, 3. For specification checks, I switched to alternative measures of overcrowding status andchanged the function form of propensity scores as well as the estimation sample. In general, the differential gainsfrom magnet attendance by overcrowding status are reported as close to zero except for Column (3), Table A4.
17To obtain the most information from the WCPSS dataset, I use mid-of-year DIBELS test results in second grade.18Table A4 and A5 presents regression results under five alternative specifications. Overcrowding effects can be
positive or negative depending on the definition of overcrowding. Column (4), Table A4 suggests that the largeaverage K-2 class size of a school is associated with negative effects on literacy skills.
19Table A4 and A5 show five alternative specifications for non-cognitive outcomes. The negative overcrowdingeffects on attendance are robust to various functional forms of propensity scores, but not to different definitions ofovercrowding measures. Overcrowding effects are not observed for a few overcrowding measures including projected
20
6.2 Mechanisms
Table 4 further explores the path to overcrowding effects by examining two common arguments
for negative overcrowding effects, higher class size and the use of temporary (mobile) classrooms.
Model specifications are similar to those presented in Table 3. I interact measures of class size or
mobile classrooms with magnet attendance for students from overcrowded base schools as well as its
instrument, receiving a magnet offer for students from overcrowded base schools. Columns (1) and
(2) present two overcrowding effects with respect to the overcrowded school’s class size. I measure
class size using each school’s K-2 average class size in the 2014-2015 school year and create a binary
indicator for schools with average class size above the district average of 21 students per class.20 14
out of 26 overcrowded schools are defined to have higher-than-average class sizes. Similar to Table
3, I do not observe any statistically significant overcrowding effects on math and literacy skills.
The strong negative overcrowding effect on student attendance is only observed for overcrowded
schools with above-average class size. Similarly, I estimate the 2SLS model using interactions with
mobile classroom usage and present two overcrowding effects in Columns (3) and (4). I refer to
the facility utilization report for the number of temporary classrooms used in each school in the
2014-2015 school year. Mobile classroom percentage is calculated by dividing the number of mobile
classrooms by the sum of permanent and mobile classrooms. The median is 0.11, suggesting 11%
of all classrooms in a school is a temporary unit. 5 out of 26 overcrowded schools did not employ
mobile classrooms in this school year. Again, no overcrowding effects on math and literacy outcomes
are observed. Despite the lack of power, the overcrowding effects on absences is larger for schools
that uses mobile classrooms, especially those with an above-median mobile classroom percentage.
These results suggest both school characteristics contribute the negative overcrowding effects on
student attendance. However, I cannot disentangle the two effects due to lack of variation in mobile
classroom usage - all but five overcrowded schools use mobile classrooms to accommodate students.
It is also unknown whether the cohort observed were placed in any mobile classrooms between 2016
and 2018.
overcrowding, mobile classroom usage, or high class size.20The state’s class size mandate is 23 between 2014 and 2018.
21
6.3 School Performance and Overcrowding Effects
We may suspect that overcrowded schools have more enrolled students over their capacities
because they have specific characteristics that are correlated with student achievement. Table 1
suggests that overcrowded schools have higher student performance levels than other schools in
Wake County. To address this achievement gap by overcrowding status, I separate the sample into
two subsamples by a binary indicator for high academic performance at the student’s base school
in the school year prior to her enrollment. The indicator equals one if the base school has school
achievement scores of A or B for End-of-Grade (EOG) math and reading tests, as indicated by the
school report card in the 2014-2015 school year.21 To receive school achievement scores of A or B,
the school must have at least 70% of students being grade-level proficient in the subject (NCPS,
2014, 2015b). School achievement scores are reported on North Carolina School Report Cards as
core measures of each school’s academic performance. The subsample analysis allows me to identify
two sets of differential magnet effects for students based on base school overcrowding. This model
also provides additional information on heterogeneity in achievement gains within students with an
overcrowded base school.
I separately identify the model shown in Table 5 for two subgroups by base school achievement
scores in the 2014-2015 school year. Descriptive statistics in Table 1 suggest that overcrowded
schools, in general, have higher SPG scores, which motivates this subsample analysis to compare
magnet effects by overcrowding status based on base school quality. Here, a high-performance
school is defined as having received an ”A” or ”B” for both EOG math and EOG reading on
the school report card in the 2014-2015 school year. In 2014-2015, 32 out of the 107 schools in
Wake County have received an ”A” or ”B” for both subjects on the school report card, including 23
overcrowded traditional schools, three magnet schools, and six non-overcrowded traditional schools.
The sample size for students with a high-performance base school is 331.
Table 5 shows heterogeneous overcrowding effects by base school’s academic performance. Neg-
ative overcrowding effects on math skills are observed among students with a low-performance base
21The EOG math and reading tests are statewide assessments on student performances concerning the NorthCarolina Standard Course of Study (NCSCS). Elementary school students in grades 3-5 enrolled in public andcharter schools participate in EOG tests administered by the North Carolina Department of Public Instruction’sAccountability Services Division. An 80% weight is assigned to school achievement scores when calculating theoverall School Performance Grade (NCPS, 2014).
22
school. However, these effects are measured with large noise. Overcrowding effects on math are
positive among students with high-performance base schools, suggesting high quality of the set
of eight overcrowded school among 30 high-performance schools. Both subsamples generate null
overcrowding effects on literacy. Negative overcrowding effects on attendance are observed for both
subsamples. Consistent with Part A, the effect size for students with a high-performance base
school is smaller.
Tables 3 to 5 show the important aspect of overcrowding effects on non-cognitive outcomes,
which is overlooked in the literature. The results also suggest a high degree of heterogeneity in
overcrowding effects by base school performance. If policymakers are concerned about maximizing
the level of magnet effect, results in this paper imply that they may consider granting higher
priorities to students from an overcrowded school with low school achievement scores when designing
the priority structure of the magnet reassignment.
7 Conclusion
In this study, I take advantage of the centralized magnet school assignment in Wake County,
North Carolina, to examine the school choice effects on students who attempt to leave overcrowded
magnet schools. I exploit the randomness created by assignment tie-breakers to disentangle school
crowding effects for assignment lottery losers. The results suggest mixed effects of school over-
crowding on student cognitive and non-cognitive outcomes. Having an overcrowded base school is
not associated with stronger magnet effects on math skills measured by the Number Knowledge
Test (NKT) and literary skills measured by the Dynamic Indicators of Basic Early Literacy Skills
test (DIBELS). Since students from overcrowded base schools do not experience higher gains from
“escaping” overcrowded traditional schools than others, I find no evidence of negative overcrowding
effects on early cognitive outcomes for magnet applicants in Wake County.
Overcrowding effects on log absences are strong and negative. Students from overcrowded base
schools experience significantly higher magnet gains in reducing absences, suggesting a substantial
negative overcrowding effect on student attendance. I have examined two potential mechanism for
this overcrowding effect. Although the second graders in my sample were subject to a statewide
class size mandate of 23 students per classroom at the time, larger class sizes are still associated
23
with large overcrowding effects on attendance. The use of temporary classrooms in overcrowded
schools is also linked with strong overcrowding effects. The subgroup analysis of overcrowding effect
by base school’s academic performance indicates heterogeneity in both the quality of overcrowded
schools and overcrowding effects.
Many studies have suggested a negative correlation between early absenteeism and academic
achievement trajectory, including test scores and high school dropouts (Alexander et al., 1997;
Brocato, 1989; Krohn and O’Connor, 2005; Lin and Chen, 2006). Overcrowding in elementary
school can have long-term impacts on both cognitive and non-cognitive outcomes. Utilizing an
existing magnet program to address overcrowding may be part of the solution.
References
Abdulkadiroglu, A., J. D. Angrist, S. M. Dynarski, T. J. Kane, and P. A. Pathak (2011). Ac-
countability and Flexibility in Public Schools: Evidence from Boston’s Charters And Pilots. The
Quarterly Journal of Economics 126 (2), 699–748.
Abdulkadiroglu, A., J. D. Angrist, Y. Narita, and P. A. Pathak (2017). Research Design Meets
Market Design: Using Centralized Assignment for Impact Evaluation. Econometrica 85 (5),
1373–1432.
Abdulkadiroglu, A., P. A. Pathak, J. Schellenberg, and C. R. Walters (2020). Do parents value
school effectiveness? American Economic Review 110 (5), 1502–39.
Abebe, G., M. Fafchamps, M. Koelle, and S. Quinn (2019). Learning management through match-
ing: A field experiment using mechanism design. Technical report, National Bureau of Economic
Research.
Alexander, K. L., D. R. Entwisle, and C. S. Horsey (1997). From First Grade Forward: Early
Foundations of High School Dropout. Sociology of Education 70 (2), 87–107.
Angrist, J. D., S. R. Cohodes, S. M. Dynarski, P. A. Pathak, and C. R. Walters (2016). Stand
and deliver: Effects of Boston’s charter high schools on college preparation, entry, and choice.
Journal of Labor Economics 34 (2), 275–318.
24
Angrist, J. D., P. A. Pathak, and C. R. Walters (2013). Explaining Charter School Effectiveness.
American Economic Journal: Applied Economics 5 (4), 1–27.
Barger, J. (2003). Comparing the DIBELS Oral Reading Fluency indicator and the North Carolina
end of grade reading assessment. North Carolina Teacher Academy Technical Report.
Bohrnstedt, G. W. and B. M. Stecher (1999). Class Size Reduction in California 1996-1998: Early
Findings Signal Promise and Concerns. Report Summary. Technical report, CSR Research Con-
sortium.
Borghans, L., B. Ter Weel, and B. A. Weinberg (2008). Interpersonal styles and labor market
outcomes. Journal of Human Resources 43 (4), 815–858.
Brocato, J. (1989). How much does coming to class matter? Some evidence of class attendance
and grade performance. Educational Research Quarterly 13 (3), 2–6.
Callahan, M. P., D. S. Parker, J. R. Sherwin, and M. T. Anello (1999). Evaluation of Energy
Efficiency Improvements to Portable Classrooms in Florida. Florida Solar Energy Center, 1679
Clearlake Rd.
Case, R., Y. Okamoto, S. Griffin, A. McKeough, C. Bleiker, B. Henderson, K. M. Stephenson, R. S.
Siegler, and D. P. Keating (1996). The Role of Central Conceptual Structures in the Development
of Children’s Thought. Monographs of the Society for Research in Child Development 61 (1/2),
i–295.
Chetty, R., J. N. Friedman, N. Hilger, E. Saez, D. W. Schanzenbach, and D. Yagan (2011). How
does your kindergarten classroom affect your earnings? Evidence from Project STAR. The
Quarterly Journal of Economics 126 (4), 1593–1660.
Cowan, R., C. Donlan, D.-L. Shepherd, R. Cole-Fletcher, M. Saxton, and J. Hurry (2011). Basic
calculation proficiency and mathematics achievement in elementary school children. Journal of
Educational Psychology 103 (4), 786–803.
Cullen, J. B., B. A. Jacob, and S. Levitt (2006). The Effect of School Choice on Participants:
Evidence from Randomized Lotteries. Econometrica 74 (5), 1191–1230.
25
Deming, D. J. (2011). BETTER SCHOOLS, LESS CRIME? The Quarterly Journal of Eco-
nomics 126 (4), 2063–2115.
Deming, D. J. (2014). Using School Choice Lotteries to Test Measures of School Effectiveness. The
American Economic Review 104 (5), 406–411.
Deming, D. J., J. S. Hastings, T. J. Kane, and D. O. Staiger (2014). School Choice, School Quality,
and Postsecondary Attainment. The American Economic Review 104 (3), 991–1013.
Dur, U., R. G. Hammond, M. Lenard, M. Morrill, T. Morrill, and C. Paeplow (2020). The Attraction
of Magnet Schools: Evidence from Embedded Lotteries in School Assignment. Working Paper.
Engberg, J., D. Epple, J. Imbrogno, H. Sieg, and R. Zimmer (2014). Evaluating Education Programs
That Have Lotteried Admission and Selective Attrition. Journal of Labor Economics 32 (1), 27–
63.
Finn, J. D. and C. M. Achilles (1990). Answers and Questions about Class Size: A Statewide
Experiment. American Educational Research Journal 27 (3), 557–577.
Gersten, R., N. C. Jordan, and J. R. Flojo (2005). Early Identification and Interventions for
Students With Mathematics Difficulties. Journal of Learning Disabilities 38 (4), 293–304.
Good, R. H. and R. A. Kaminski (1996). Assessment for instructional decisions: Toward a
proactive/prevention model of decision-making for early literacy skills. School Psychology Quar-
terly 11 (4), 326–336.
Good, R. H., D. C. Simmons, and E. J. Kame’enui (2001). The Importance and Decision-Making
Utility of a Continuum of Fluency-Based Indicators of Foundational Reading Skills for Third-
Grade High-Stakes Outcomes. Scientific Studies of Reading 5 (3), 257–288.
Graves, J. (2010). The academic impact of multi-track year-round school calendars: A response to
school overcrowding. Journal of Urban Economics 67 (3), 378–391.
Green, M. and H. Doran (2000). Still No Room To Learn: Crowded NYC Schools Continue To
Jeopardize Smaller Class Size Plans. A Follow-Up Report to” No Room To Learn” and to the
Class Size Summit Working Papers. Technical report, Public Advocate for the City of New York.
26
Hastings, J. S., C. A. Neilson, and S. D. Zimmerman (2012a). The Effect of School Choice on In-
trinsic Motivation and Academic Outcomes. Working Paper 18324, National Bureau of Economic
Research.
Hastings, J. S., C. A. Neilson, and S. D. Zimmerman (2012b). The Effect of School Choice on In-
trinsic Motivation and Academic Outcomes. Working Paper 18324, National Bureau of Economic
Research.
Heckman, J. J. and Y. Rubinstein (2001). The importance of noncognitive skills: Lessons from the
GED testing program. American Economic Review 91 (2), 145–149.
Hoxby, C. M. (2000). The Effects of Class Size on Student Achievement: New Evidence from
Population Variation. The Quarterly Journal of Economics 115 (4), 1239–1285.
Hoxby, C. M. and G. Weingarth (2005). Taking race out of the equation: School reassignment and
the structure of peer effects. Working Paper.
Imbens, G. W. and J. D. Angrist (1994). Identification and Estimation of Local Average Treatment
Effects. Econometrica 62 (2), 467–475.
Jackson, C. K. (2018). What do test scores miss? The importance of teacher effects on non–test
score outcomes. Journal of Political Economy 126 (5), 2072–2107.
Jepsen, C. and S. Rivkin (2009). Class Size Reduction and Student Achievement The Potential
Tradeoff between Teacher Quality and Class Size. Journal of Human Resources 44 (1), 223–250.
Jerrim, J. and A. Vignoles (2016). The link between East Asian ‘mastery’ teaching methods and
English children’s mathematics skills. Economics of Education Review 50, 29–44.
Jordan, N. C., D. Kaplan, M. N. Locuniak, and C. Ramineni (2007). Predicting First-Grade Math
Achievement from Developmental Number Sense Trajectories. Learning Disabilities Research &
Practice 22 (1), 36–46.
Krohn, G. A. and C. M. O’Connor (2005). Student Effort and Performance over the Semester. The
Journal of Economic Education 36 (1), 3–28.
27
Krueger, A. B. (1999). Experimental Estimates of Education Production Functions. The Quarterly
Journal of Economics 114 (2), 497–532.
Krueger, A. B. and D. M. Whitmore (2001). The Effect of Attending a Small Class in the Early
Grades on College-test Taking and Middle School Test Results: Evidence from Project Star. The
Economic Journal 111 (468), 1–28.
Lin, T.-F. and J. Chen (2006). Cumulative class attendance and exam performance. Applied
Economics Letters 13 (14), 937–942.
Lindqvist, E. and R. Vestman (2011). The labor market returns to cognitive and noncognitive
ability: Evidence from the Swedish enlistment. American Economic Journal: Applied Eco-
nomics 3 (1), 101–28.
McMullen, S. C. and K. E. Rouse (2012). The Impact of Year-Round Schooling on Academic
Achievement: Evidence from Mandatory School Calendar Conversions. American Economic
Journal: Economic Policy 4 (4), 230–252.
McMullen, S. C., K. E. Rouse, and J. Haan (2015). The distributional effects of the multi-track
year-round calendar: a quantile regression approach. Applied Economics Letters 22 (15), 1188–
1192.
NCES (2000). Condition of America’s Public School Facilities: 1999. Technical report, National
Center for Education Statistics.
NCES (2007). Public School Principals Report on Their School Facilities: Fall 2005. Technical
report, National Center for Education Statistics.
NCPS (2014). Accountability Brief - School Performance Grades. Technical report, North Carolina
Public Schools.
NCPS (2015a). 4-Year Cohort Graduation Rate Report: 2012-13 Entering 9th Graders Graduating
in 2015-16 or Earlier. Technical report, North Carolina Public Schools.
NCPS (2015b). North Carolina School Performance Grades. Technical report, North Carolina
Public Schools.
28
NCPS (2016). Statewide Facility Needs Survey 2015-2016. Technical report, North Carolina Public
Schools.
Parcel, T. L. and A. J. Taylor (2015). The end of consensus: Diversity, neighborhoods, and the
politics of public school assignments. University of North Carolina Press.
Pears, K. C., H. K. Kim, P. A. Fisher, and K. Yoerger (2016). Increasing pre-kindergarten early
literacy skills in children with developmental disabilities and delays. Journal of School Psychol-
ogy 57, 15–27.
Ribner, A., E. Harvey, R. Gervais, and C. Fitzpatrick (2019). Explaining school entry math
and reading achievement in Canadian children using the Opportunity-Propensity framework.
Learning and Instruction 59, 65–75.
Rivera-Batiz, F. L. and L. Marti (1995). A School System at Risk: A Study of the Consequences
of Overcrowding in New York City Public Schools. IUME Research Report 95-1.
Roehrig, A. D., Y. Petscher, S. M. Nettles, R. F. Hudson, and J. K. Torgesen (2008). Accuracy of
the DIBELS Oral Reading Fluency Measure for Predicting Third Grade Reading Comprehension
Outcomes. Journal of School Psychology 46 (3), 343–366.
Romano, E., L. Babchishin, L. S. Pagani, and D. Kohen (2010). School readiness and later achieve-
ment: Replication and extension using a nationwide Canadian survey. Developmental Psychol-
ogy 46 (5), 995–1007.
Rosenbaum, P. R. and D. B. Rubin (1983). The Central Role of the Propensity Score in Observa-
tional Studies for Causal Effects. Biometrika 70 (1), 41–55.
Shirley, M. (2017). The Effects of Overcrowding on Student Academic Performance in Kentucky
High Schools. Working Paper.
Smolkowski, K. and K. D. Cummings (2016). Evaluation of the DIBELS (Sixth Edition) Diagnostic
System for the Selection of Native and Proficient English Speakers at Risk of Reading Difficulties.
Journal of Psychoeducational Assessment 34 (2), 103–118.
WCPSS (2015a). 2014-2015 Facilities Utilization. Technical report.
29
WCPSS (2015b). 2014-2015 Facilities Utilization. Technical report, Wake County Public School
System.
WCPSS (2019a). 2013 Building Program: Our Budget. Technical report, Wake County Public
School System.
WCPSS (2019b). Magnet Schools / Overview. https://www.wcpss.net/magnet.
Winters, M. A. (2020). Charter Schools in Newark: The Effect on Student Test Scores. Technical
report, Manhattan Institute for Policy Research.
WRAL (2018a). Cary parents speak out against school reassignment. WRAL.com.
https://www.wral.com/cary-parents-speak-out-against-school-reassignment/17890831/.
WRAL (2018b). Cary parents unhappy about WCPSS reassignment plan that could move stu-
dents across town. WRAL.com. https://www.wral.com/cary-parents-unhappy-about-wcpss-
reassignment-plan-that-could-move-students-across-town/17805548/.
WRAL (2018c). Reassignment: Morrisville parents frustrated at switch to year-round school.
WRAL.com. https://www.wral.com/reassignment-morrisville-parents-frustrated-at-switch-to-
year-round-school/17956104/.
Zhang, H., C.-Y. Wee, J. S. Poh, Q. Wang, L. P. Shek, Y.-S. Chong, M. V. Fortier, M. J. Meaney,
B. F. P. Broekman, and A. Qiu (2019). Fronto-parietal numerical networks in relation with early
numeracy in young children. Brain Structure and Function 224 (1), 263–275.
30
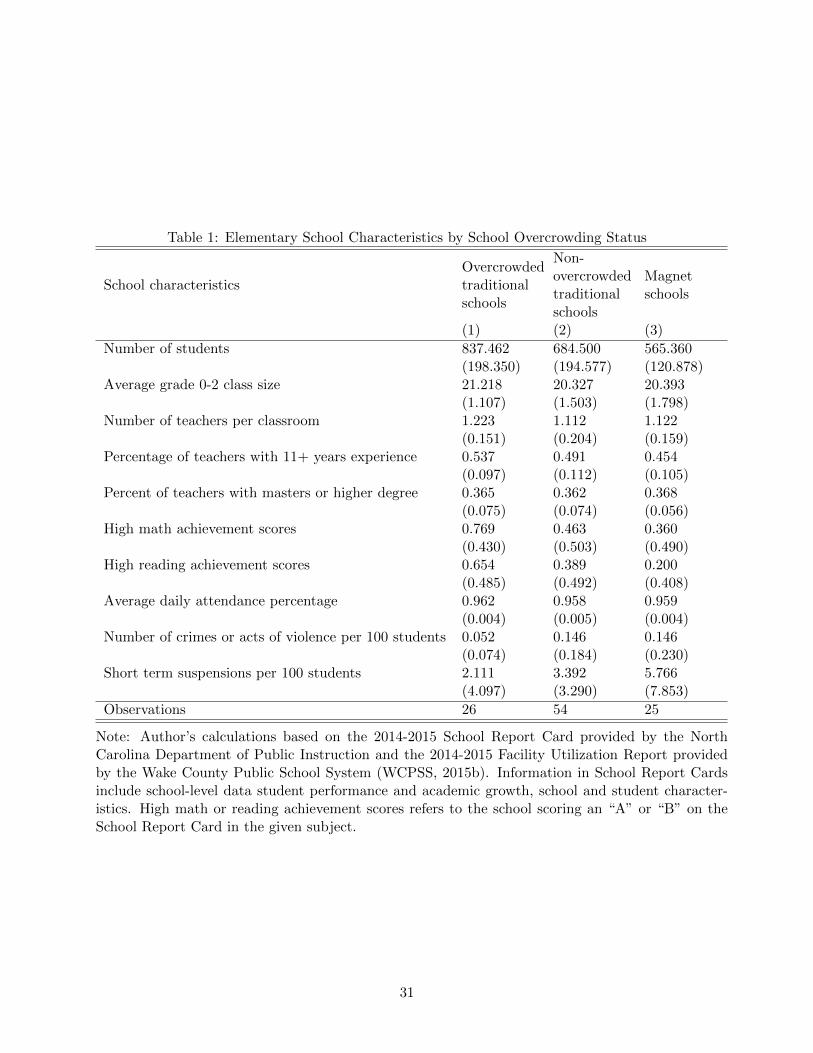
Table 1: Elementary School Characteristics by School Overcrowding Status
School characteristicsOvercrowdedtraditionalschools
Non-overcrowdedtraditionalschools
Magnetschools
(1) (2) (3)
Number of students 837.462 684.500 565.360(198.350) (194.577) (120.878)
Average grade 0-2 class size 21.218 20.327 20.393(1.107) (1.503) (1.798)
Number of teachers per classroom 1.223 1.112 1.122(0.151) (0.204) (0.159)
Percentage of teachers with 11+ years experience 0.537 0.491 0.454(0.097) (0.112) (0.105)
Percent of teachers with masters or higher degree 0.365 0.362 0.368(0.075) (0.074) (0.056)
High math achievement scores 0.769 0.463 0.360(0.430) (0.503) (0.490)
High reading achievement scores 0.654 0.389 0.200(0.485) (0.492) (0.408)
Average daily attendance percentage 0.962 0.958 0.959(0.004) (0.005) (0.004)
Number of crimes or acts of violence per 100 students 0.052 0.146 0.146(0.074) (0.184) (0.230)
Short term suspensions per 100 students 2.111 3.392 5.766(4.097) (3.290) (7.853)
Observations 26 54 25
Note: Author’s calculations based on the 2014-2015 School Report Card provided by the NorthCarolina Department of Public Instruction and the 2014-2015 Facility Utilization Report providedby the Wake County Public School System (WCPSS, 2015b). Information in School Report Cardsinclude school-level data student performance and academic growth, school and student character-istics. High math or reading achievement scores refers to the school scoring an “A” or “B” on theSchool Report Card in the given subject.
31
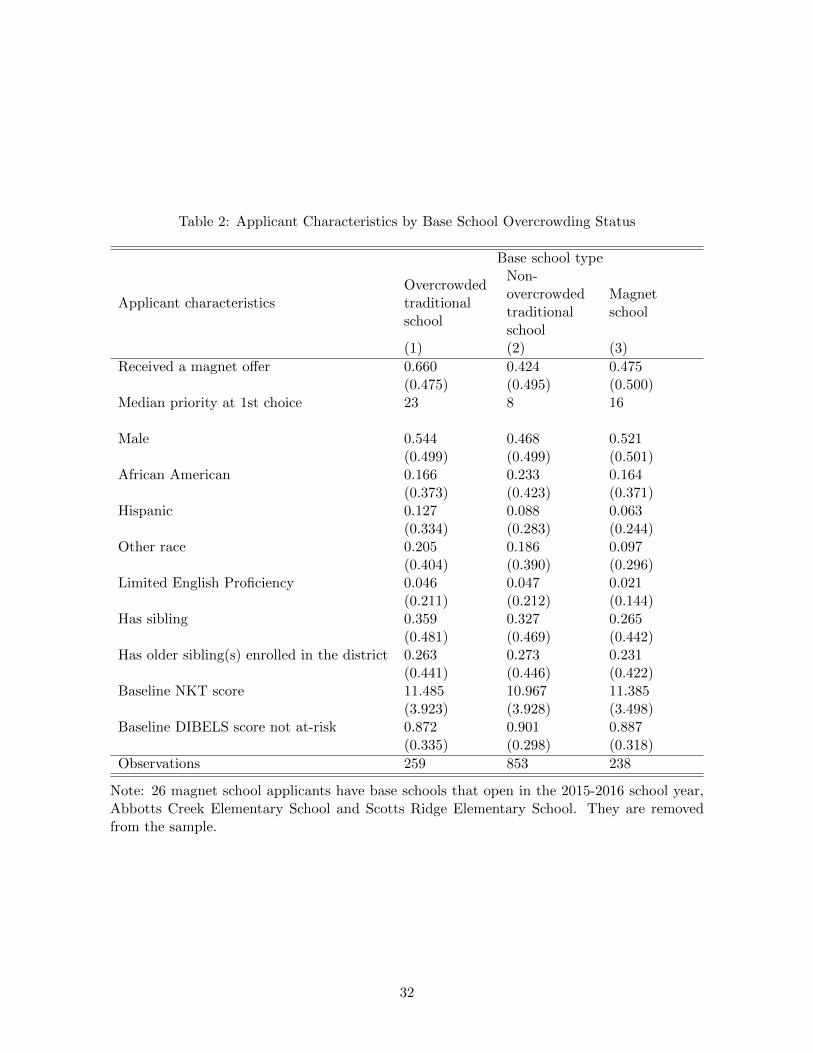
Table 2: Applicant Characteristics by Base School Overcrowding Status
Base school type
Applicant characteristicsOvercrowdedtraditionalschool
Non-overcrowdedtraditionalschool
Magnetschool
(1) (2) (3)
Received a magnet offer 0.660 0.424 0.475(0.475) (0.495) (0.500)
Median priority at 1st choice 23 8 16
Male 0.544 0.468 0.521(0.499) (0.499) (0.501)
African American 0.166 0.233 0.164(0.373) (0.423) (0.371)
Hispanic 0.127 0.088 0.063(0.334) (0.283) (0.244)
Other race 0.205 0.186 0.097(0.404) (0.390) (0.296)
Limited English Proficiency 0.046 0.047 0.021(0.211) (0.212) (0.144)
Has sibling 0.359 0.327 0.265(0.481) (0.469) (0.442)
Has older sibling(s) enrolled in the district 0.263 0.273 0.231(0.441) (0.446) (0.422)
Baseline NKT score 11.485 10.967 11.385(3.923) (3.928) (3.498)
Baseline DIBELS score not at-risk 0.872 0.901 0.887(0.335) (0.298) (0.318)
Observations 259 853 238
Note: 26 magnet school applicants have base schools that open in the 2015-2016 school year,Abbotts Creek Elementary School and Scotts Ridge Elementary School. They are removedfrom the sample.
32
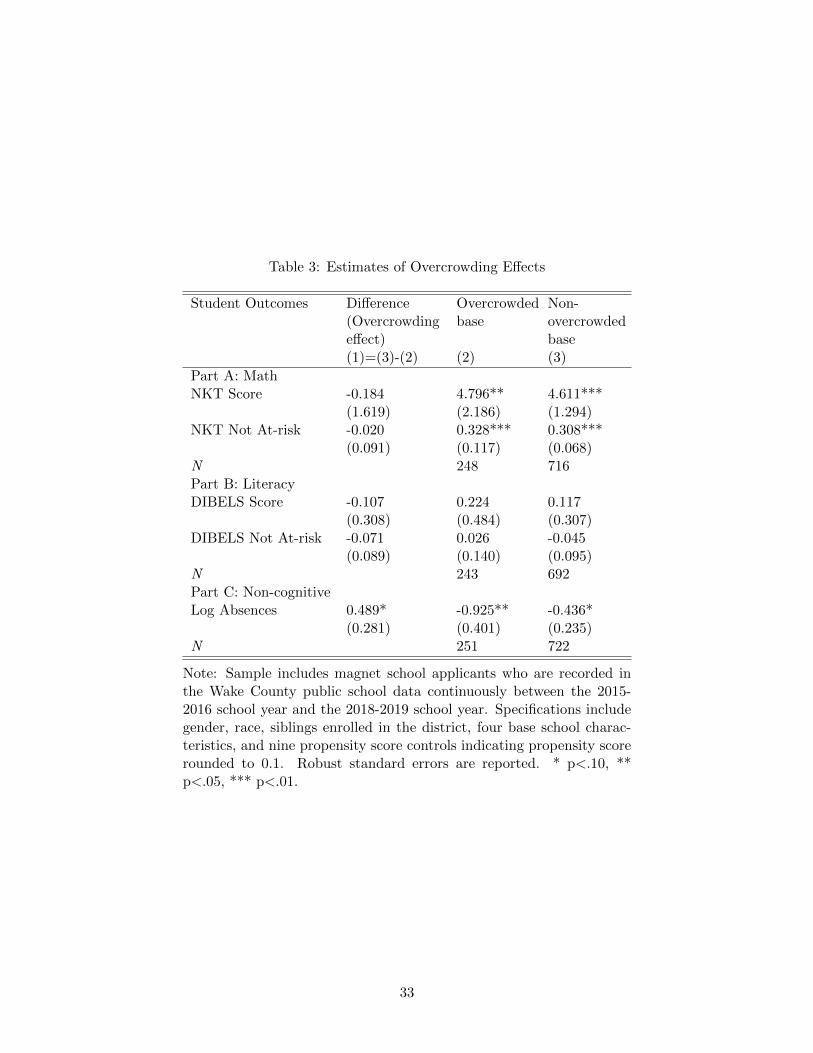
Table 3: Estimates of Overcrowding Effects
Student Outcomes Difference(Overcrowdingeffect)
Overcrowdedbase
Non-overcrowdedbase
(1)=(3)-(2) (2) (3)
Part A: MathNKT Score -0.184 4.796** 4.611***
(1.619) (2.186) (1.294)NKT Not At-risk -0.020 0.328*** 0.308***
(0.091) (0.117) (0.068)N 248 716Part B: LiteracyDIBELS Score -0.107 0.224 0.117
(0.308) (0.484) (0.307)DIBELS Not At-risk -0.071 0.026 -0.045
(0.089) (0.140) (0.095)N 243 692Part C: Non-cognitiveLog Absences 0.489* -0.925** -0.436*
(0.281) (0.401) (0.235)N 251 722
Note: Sample includes magnet school applicants who are recorded inthe Wake County public school data continuously between the 2015-2016 school year and the 2018-2019 school year. Specifications includegender, race, siblings enrolled in the district, four base school charac-teristics, and nine propensity score controls indicating propensity scorerounded to 0.1. Robust standard errors are reported. * p<.10, **p<.05, *** p<.01.
33
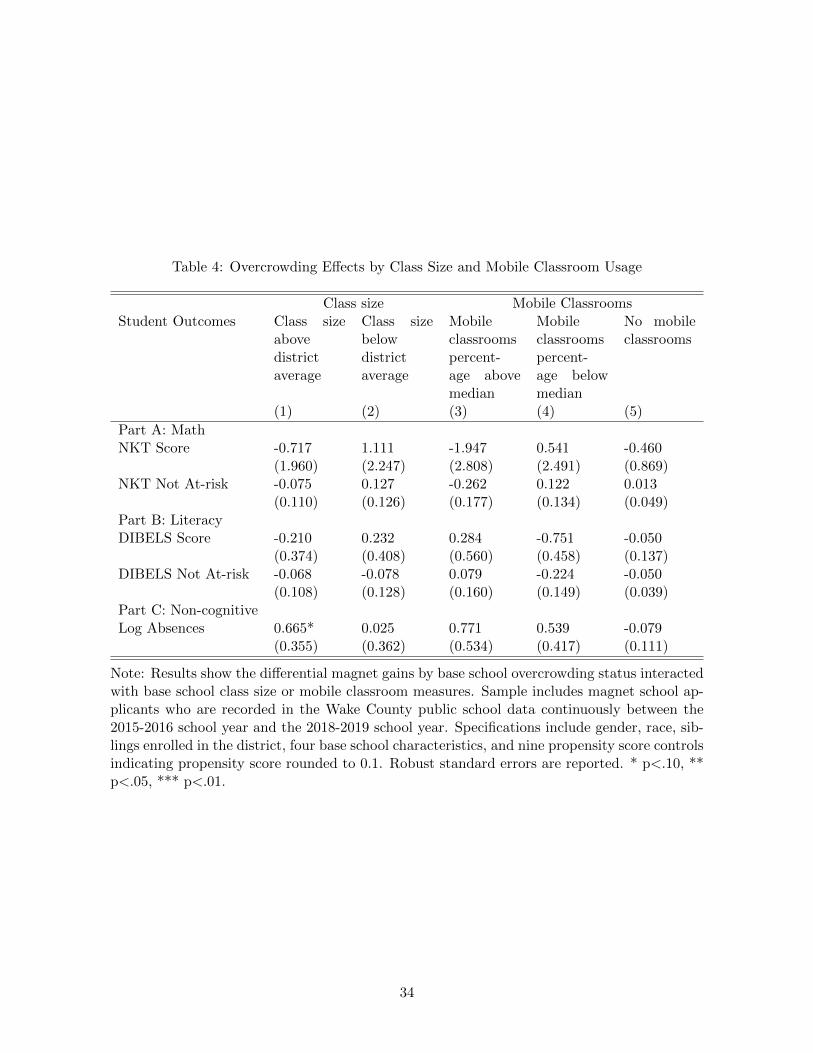
Table 4: Overcrowding Effects by Class Size and Mobile Classroom Usage
Class size Mobile ClassroomsStudent Outcomes Class size
abovedistrictaverage
Class sizebelowdistrictaverage
Mobileclassroomspercent-age abovemedian
Mobileclassroomspercent-age belowmedian
No mobileclassrooms
(1) (2) (3) (4) (5)
Part A: MathNKT Score -0.717 1.111 -1.947 0.541 -0.460
(1.960) (2.247) (2.808) (2.491) (0.869)NKT Not At-risk -0.075 0.127 -0.262 0.122 0.013
(0.110) (0.126) (0.177) (0.134) (0.049)Part B: LiteracyDIBELS Score -0.210 0.232 0.284 -0.751 -0.050
(0.374) (0.408) (0.560) (0.458) (0.137)DIBELS Not At-risk -0.068 -0.078 0.079 -0.224 -0.050
(0.108) (0.128) (0.160) (0.149) (0.039)Part C: Non-cognitiveLog Absences 0.665* 0.025 0.771 0.539 -0.079
(0.355) (0.362) (0.534) (0.417) (0.111)
Note: Results show the differential magnet gains by base school overcrowding status interactedwith base school class size or mobile classroom measures. Sample includes magnet school ap-plicants who are recorded in the Wake County public school data continuously between the2015-2016 school year and the 2018-2019 school year. Specifications include gender, race, sib-lings enrolled in the district, four base school characteristics, and nine propensity score controlsindicating propensity score rounded to 0.1. Robust standard errors are reported. * p<.10, **p<.05, *** p<.01.
34
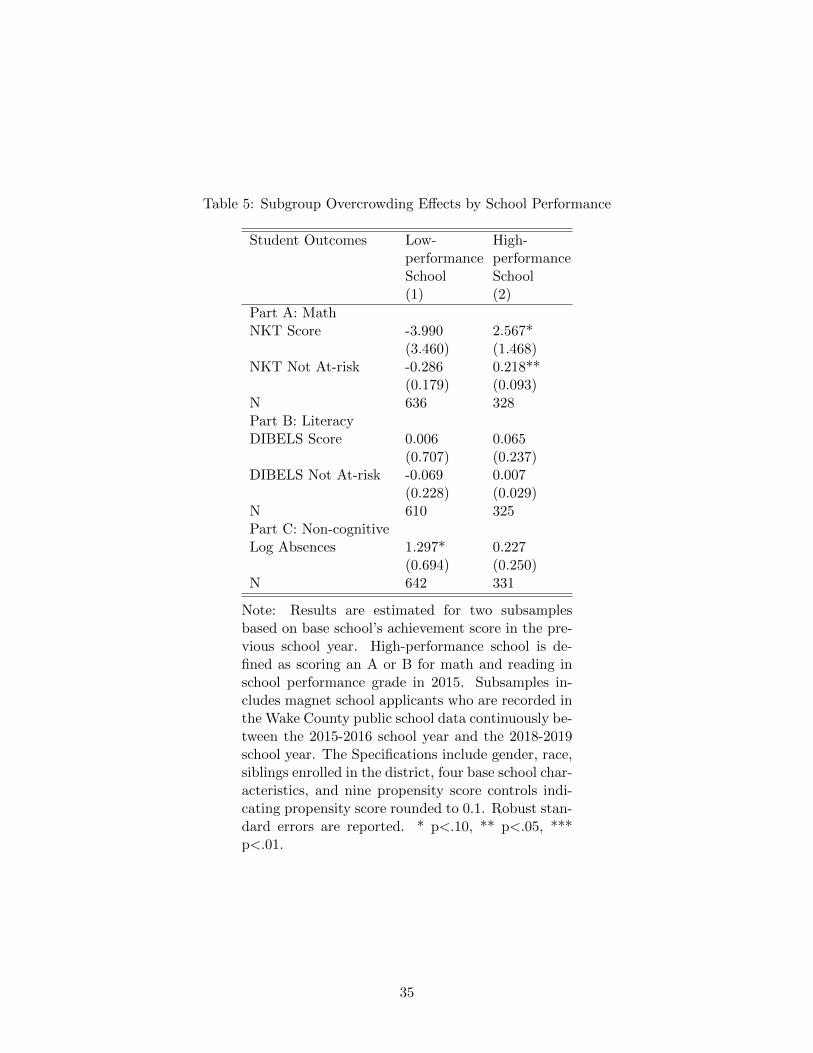
Table 5: Subgroup Overcrowding Effects by School Performance
Student Outcomes Low-performanceSchool
High-performanceSchool
(1) (2)
Part A: MathNKT Score -3.990 2.567*
(3.460) (1.468)NKT Not At-risk -0.286 0.218**
(0.179) (0.093)N 636 328Part B: LiteracyDIBELS Score 0.006 0.065
(0.707) (0.237)DIBELS Not At-risk -0.069 0.007
(0.228) (0.029)N 610 325Part C: Non-cognitiveLog Absences 1.297* 0.227
(0.694) (0.250)N 642 331
Note: Results are estimated for two subsamplesbased on base school’s achievement score in the pre-vious school year. High-performance school is de-fined as scoring an A or B for math and reading inschool performance grade in 2015. Subsamples in-cludes magnet school applicants who are recorded inthe Wake County public school data continuously be-tween the 2015-2016 school year and the 2018-2019school year. The Specifications include gender, race,siblings enrolled in the district, four base school char-acteristics, and nine propensity score controls indi-cating propensity score rounded to 0.1. Robust stan-dard errors are reported. * p<.10, ** p<.05, ***p<.01.
35
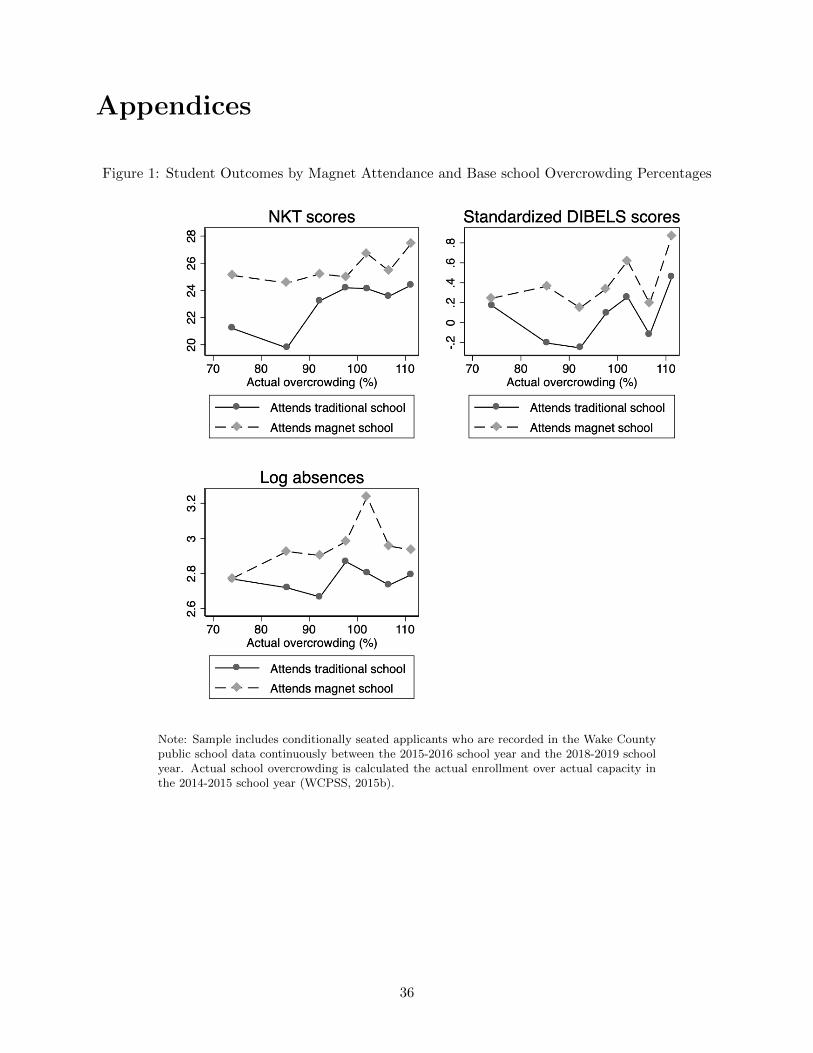
Appendices
Figure 1: Student Outcomes by Magnet Attendance and Base school Overcrowding Percentages
Note: Sample includes conditionally seated applicants who are recorded in the Wake Countypublic school data continuously between the 2015-2016 school year and the 2018-2019 schoolyear. Actual school overcrowding is calculated the actual enrollment over actual capacity inthe 2014-2015 school year (WCPSS, 2015b).
36
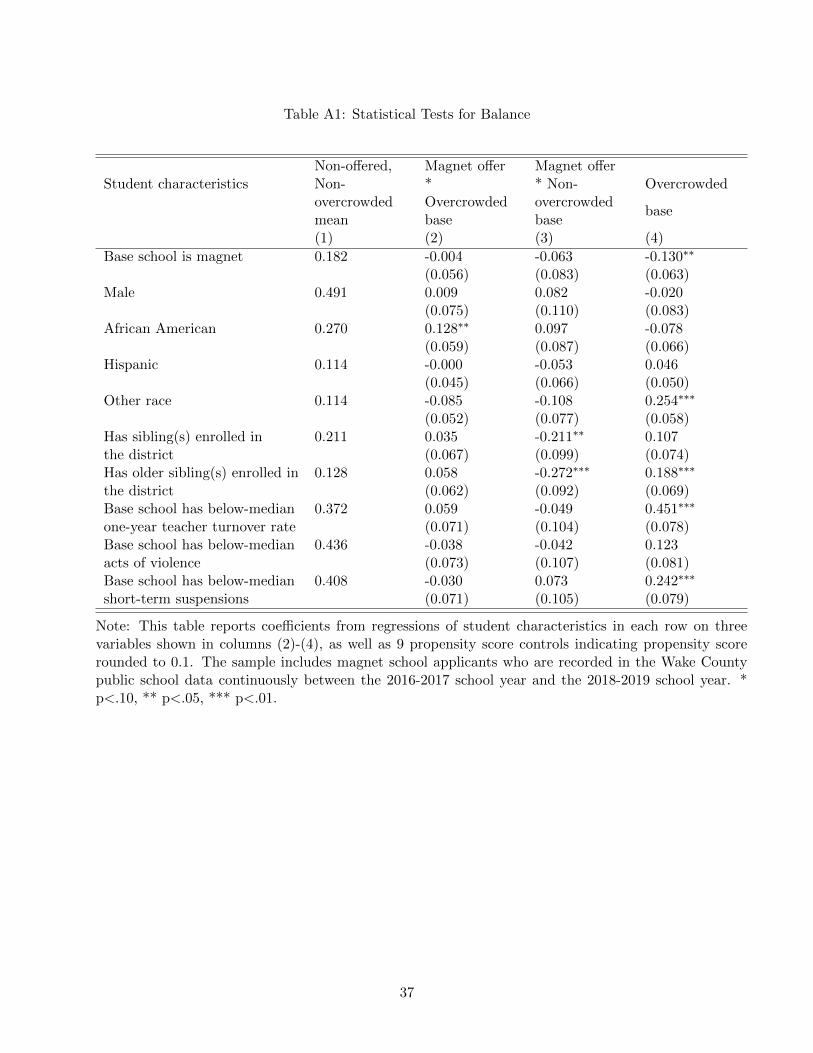
Table A1: Statistical Tests for Balance
Non-offered, Magnet offer Magnet offerStudent characteristics Non- * * Non- Overcrowded
overcrowdedmean
Overcrowdedbase
overcrowdedbase
base
(1) (2) (3) (4)
Base school is magnet 0.182 -0.004 -0.063 -0.130∗∗
(0.056) (0.083) (0.063)Male 0.491 0.009 0.082 -0.020
(0.075) (0.110) (0.083)African American 0.270 0.128∗∗ 0.097 -0.078
(0.059) (0.087) (0.066)Hispanic 0.114 -0.000 -0.053 0.046
(0.045) (0.066) (0.050)Other race 0.114 -0.085 -0.108 0.254∗∗∗
(0.052) (0.077) (0.058)Has sibling(s) enrolled in 0.211 0.035 -0.211∗∗ 0.107the district (0.067) (0.099) (0.074)Has older sibling(s) enrolled in 0.128 0.058 -0.272∗∗∗ 0.188∗∗∗
the district (0.062) (0.092) (0.069)Base school has below-median 0.372 0.059 -0.049 0.451∗∗∗
one-year teacher turnover rate (0.071) (0.104) (0.078)Base school has below-median 0.436 -0.038 -0.042 0.123acts of violence (0.073) (0.107) (0.081)Base school has below-median 0.408 -0.030 0.073 0.242∗∗∗
short-term suspensions (0.071) (0.105) (0.079)
Note: This table reports coefficients from regressions of student characteristics in each row on threevariables shown in columns (2)-(4), as well as 9 propensity score controls indicating propensity scorerounded to 0.1. The sample includes magnet school applicants who are recorded in the Wake Countypublic school data continuously between the 2016-2017 school year and the 2018-2019 school year. *p<.10, ** p<.05, *** p<.01.
37
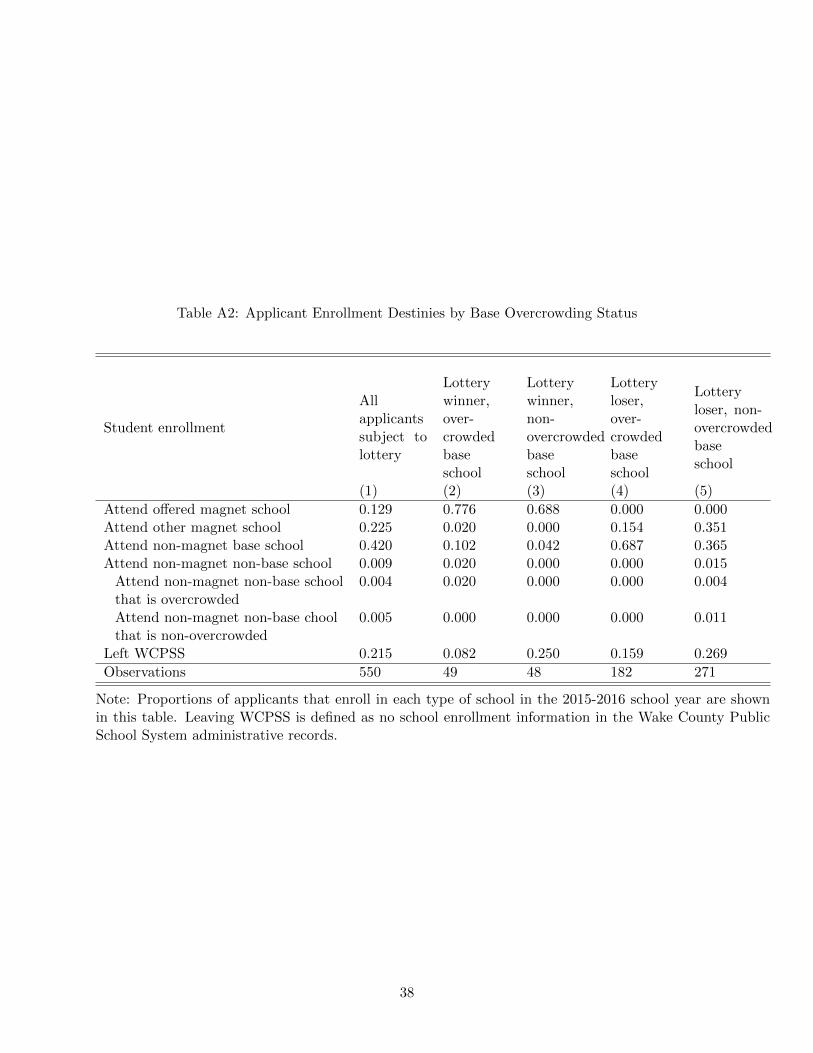
Table A2: Applicant Enrollment Destinies by Base Overcrowding Status
Student enrollment
All aaapplicantssubject tolottery
Lotterywinner,over-crowdedbaseschool
Lotterywinner,non-overcrowdedbaseschool
Lotteryloser,over-crowdedbaseschool
Lotteryloser, non-overcrowdedbaseschool
(1) (2) (3) (4) (5)
Attend offered magnet school 0.129 0.776 0.688 0.000 0.000Attend other magnet school 0.225 0.020 0.000 0.154 0.351Attend non-magnet base school 0.420 0.102 0.042 0.687 0.365Attend non-magnet non-base school 0.009 0.020 0.000 0.000 0.015
Attend non-magnet non-base school 0.004 0.020 0.000 0.000 0.004that is overcrowdedAttend non-magnet non-base chool 0.005 0.000 0.000 0.000 0.011that is non-overcrowded
Left WCPSS 0.215 0.082 0.250 0.159 0.269
Observations 550 49 48 182 271
Note: Proportions of applicants that enroll in each type of school in the 2015-2016 school year are shownin this table. Leaving WCPSS is defined as no school enrollment information in the Wake County PublicSchool System administrative records.
38
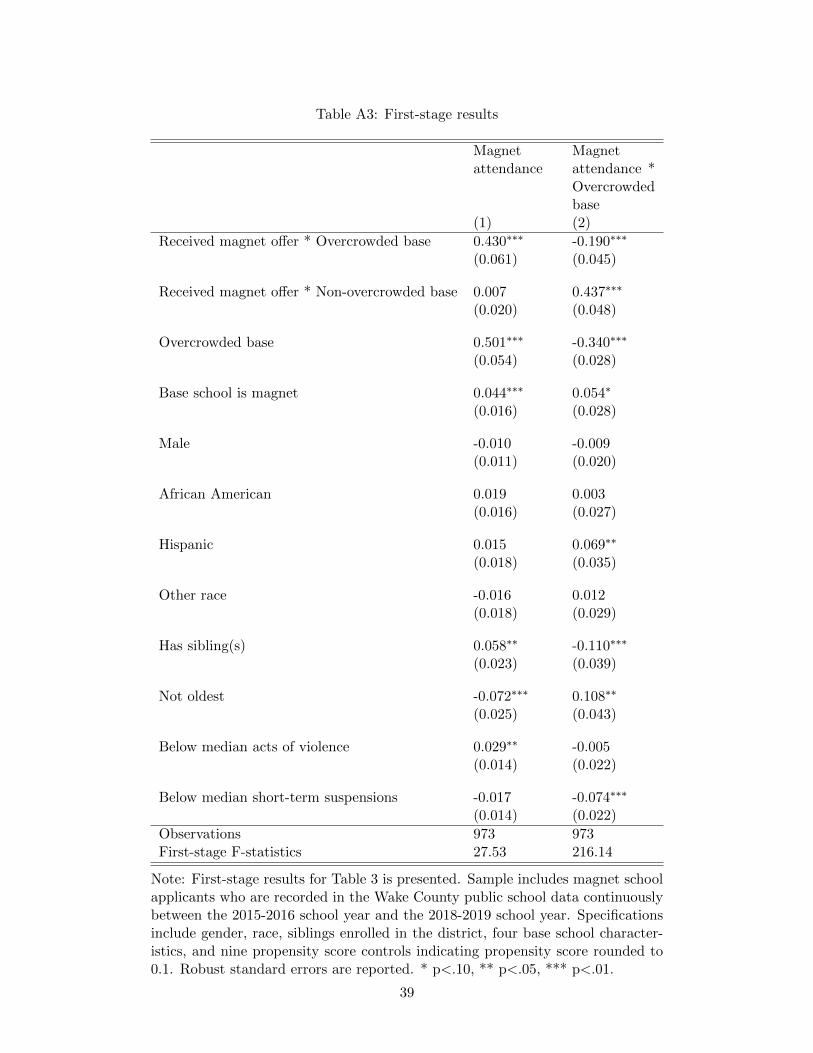
Table A3: First-stage results
Magnetattendance
Magnet xattendance *Overcrowdedbase
(1) (2)
Received magnet offer * Overcrowded base 0.430∗∗∗ -0.190∗∗∗
(0.061) (0.045)
Received magnet offer * Non-overcrowded base 0.007 0.437∗∗∗
(0.020) (0.048)
Overcrowded base 0.501∗∗∗ -0.340∗∗∗
(0.054) (0.028)
Base school is magnet 0.044∗∗∗ 0.054∗
(0.016) (0.028)
Male -0.010 -0.009(0.011) (0.020)
African American 0.019 0.003(0.016) (0.027)
Hispanic 0.015 0.069∗∗
(0.018) (0.035)
Other race -0.016 0.012(0.018) (0.029)
Has sibling(s) 0.058∗∗ -0.110∗∗∗
(0.023) (0.039)
Not oldest -0.072∗∗∗ 0.108∗∗
(0.025) (0.043)
Below median acts of violence 0.029∗∗ -0.005(0.014) (0.022)
Below median short-term suspensions -0.017 -0.074∗∗∗
(0.014) (0.022)
Observations 973 973First-stage F-statistics 27.53 216.14
Note: First-stage results for Table 3 is presented. Sample includes magnet schoolapplicants who are recorded in the Wake County public school data continuouslybetween the 2015-2016 school year and the 2018-2019 school year. Specificationsinclude gender, race, siblings enrolled in the district, four base school character-istics, and nine propensity score controls indicating propensity score rounded to0.1. Robust standard errors are reported. * p<.10, ** p<.05, *** p<.01.
39
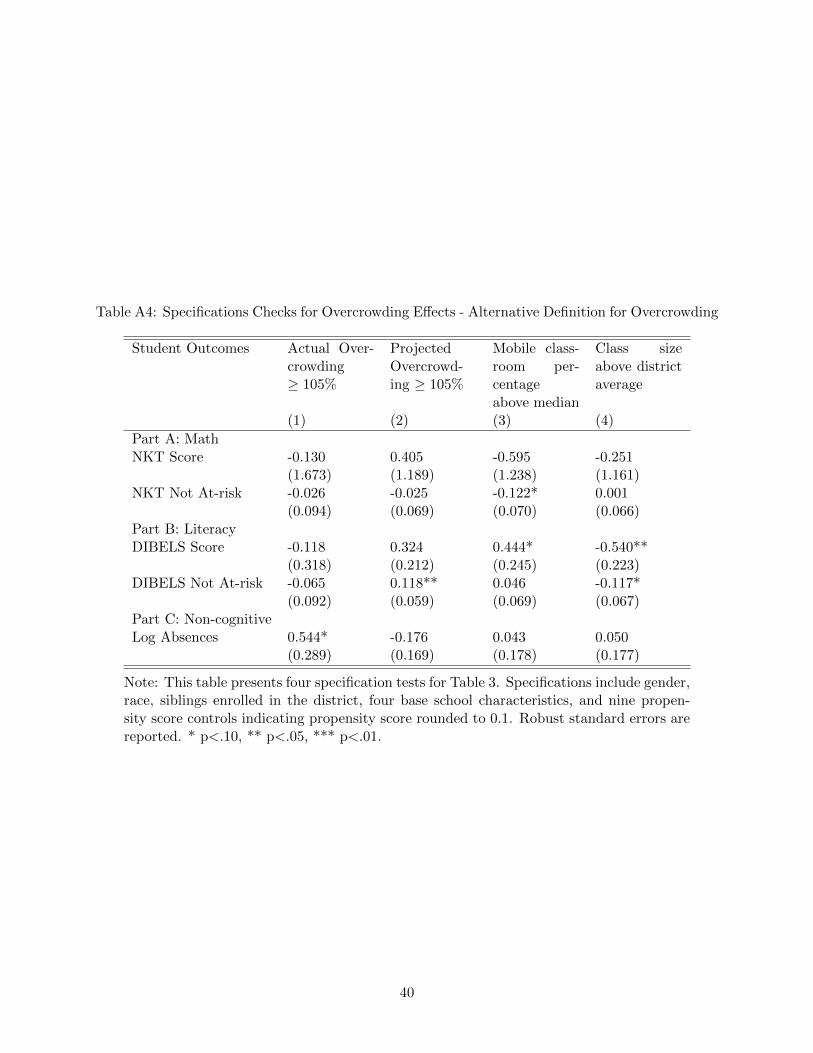
Table A4: Specifications Checks for Overcrowding Effects - Alternative Definition for Overcrowding
Student Outcomes Actual Over-crowding≥ 105%
ProjectedOvercrowd-ing ≥ 105%
Mobile class-room per-centageabove median
Class sizeabove districtaverage
(1) (2) (3) (4)
Part A: MathNKT Score -0.130 0.405 -0.595 -0.251
(1.673) (1.189) (1.238) (1.161)NKT Not At-risk -0.026 -0.025 -0.122* 0.001
(0.094) (0.069) (0.070) (0.066)Part B: LiteracyDIBELS Score -0.118 0.324 0.444* -0.540**
(0.318) (0.212) (0.245) (0.223)DIBELS Not At-risk -0.065 0.118** 0.046 -0.117*
(0.092) (0.059) (0.069) (0.067)Part C: Non-cognitiveLog Absences 0.544* -0.176 0.043 0.050
(0.289) (0.169) (0.178) (0.177)
Note: This table presents four specification tests for Table 3. Specifications include gender,race, siblings enrolled in the district, four base school characteristics, and nine propen-sity score controls indicating propensity score rounded to 0.1. Robust standard errors arereported. * p<.10, ** p<.05, *** p<.01.
40
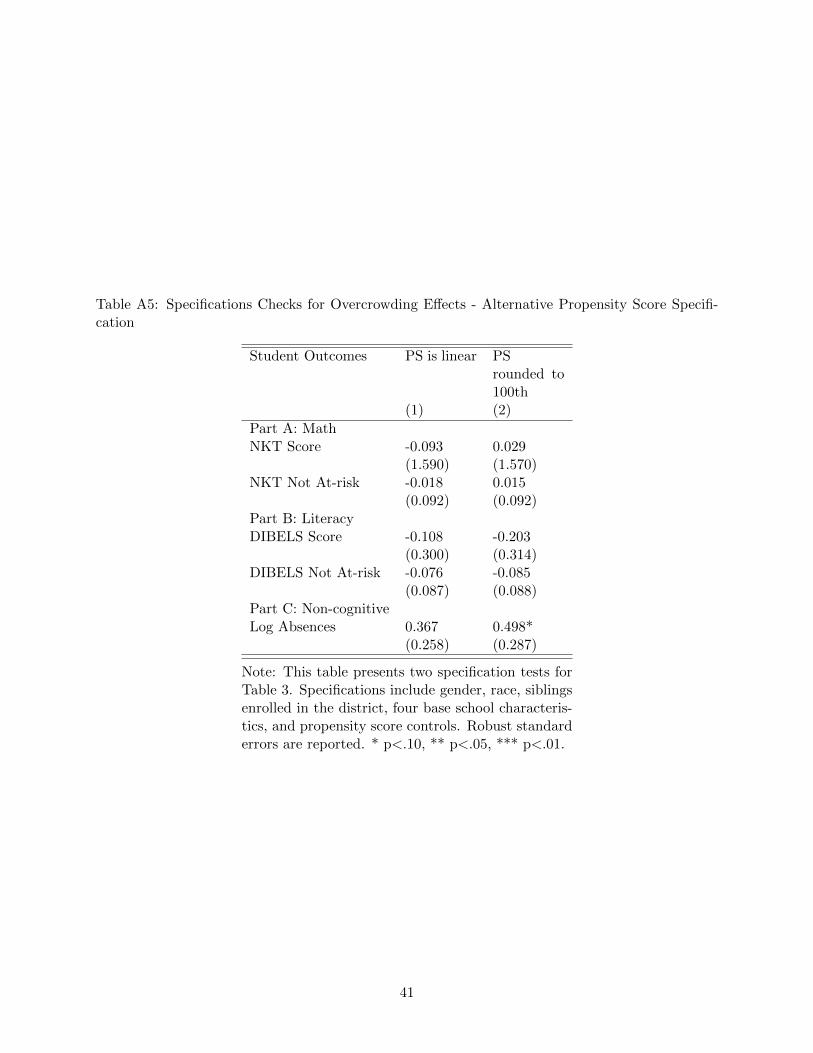
Table A5: Specifications Checks for Overcrowding Effects - Alternative Propensity Score Specifi-cation
Student Outcomes PS is linear PSrounded to100th
(1) (2)
Part A: MathNKT Score -0.093 0.029
(1.590) (1.570)NKT Not At-risk -0.018 0.015
(0.092) (0.092)Part B: LiteracyDIBELS Score -0.108 -0.203
(0.300) (0.314)DIBELS Not At-risk -0.076 -0.085
(0.087) (0.088)Part C: Non-cognitiveLog Absences 0.367 0.498*
(0.258) (0.287)
Note: This table presents two specification tests forTable 3. Specifications include gender, race, siblingsenrolled in the district, four base school characteris-tics, and propensity score controls. Robust standarderrors are reported. * p<.10, ** p<.05, *** p<.01.
41