Embed Size (px)
Citation preview
Does school BoarD leaDership Matter?
Does school BoarD leaDership Matter?by Arnold F. Shober and Michael T. HartneyForeword by Dara Zeehandelaar and Amber M. Northern
March 2014

The Thomas B. Fordham Institute is the nation’s leader in advancing educational excellence for every child through quality research, analysis, and commentary, as well as on-the-ground action and advocacy in Ohio. It is affiliated with the Thomas B. Fordham Foundation, and this publication is a joint project of the Foundation and the Institute. For further information, please visit our website at www.edexcellence.net or write to the Institute at 1016 16th St. NW, 8th Floor, Washington, D.C. 20036. The Institute is neither connected with nor sponsored by Fordham University.
contents
Foreword and Summary . . . . . . . . . . . . . . . . . . . . . . . . . . . . . . . . . . . . . . . . . . . . . . . . . . . . . . . . . . . . . . . 3
Acknowledgments . . . . . . . . . . . . . . . . . . . . . . . . . . . . . . . . . . . . . . . . . . . . . . . . . . . . . . . . . . . . . . . . . . . . . . . 8
Introduction . . . . . . . . . . . . . . . . . . . . . . . . . . . . . . . . . . . . . . . . . . . . . . . . . . . . . . . . . . . . . . . . . . . . . . . . . . 9
I. What Do We Know about School Board Leadership? . . . . . . . . . . . . . . . . . . . . . . . . . . . . . . . . . 11
II. Data and Methods . . . . . . . . . . . . . . . . . . . . . . . . . . . . . . . . . . . . . . . . . . . . . . . . . . . . . . . . . . . . . . . . . . 13
III. Analysis and Findings . . . . . . . . . . . . . . . . . . . . . . . . . . . . . . . . . . . . . . . . . . . . . . . . . . . . . . . . . . . . . 15
Question 1: Do school board members have the capacity to govern effectively? . . . . . . . . . . . . 15
Question 2: Do districts with higher-capacity board members “beat the odds” and excel academically, despite district characteristics? . . . . . . . . . . . . . . . . . . . . . . . . . . . . . . . . . . . . . . . . . 20
Question 3: What characteristics of board members are associated with greater capacity?. . . . . 21
Question 4: Is a district’s method of selecting board members associated with its ability to beat the odds? . . . . . . . . . . . . . . . . . . . . . . . . . . . . . . . . . . . . . . . . . . . . . . . . . . . . . . . . . . . . . . . . . . . . . 23
IV. Conclusion . . . . . . . . . . . . . . . . . . . . . . . . . . . . . . . . . . . . . . . . . . . . . . . . . . . . . . . . . . . . . . . . . . . . . . . . . 24
Appendix: Technical Matters . . . . . . . . . . . . . . . . . . . . . . . . . . . . . . . . . . . . . . . . . . . . . . . . . . . . . . . . . . 26
Data sources . . . . . . . . . . . . . . . . . . . . . . . . . . . . . . . . . . . . . . . . . . . . . . . . . . . . . . . . . . . . . . . . . . . . . 26
Academic return on investment and “beating the odds” . . . . . . . . . . . . . . . . . . . . . . . . . . . . . . . 26
Supporting tables . . . . . . . . . . . . . . . . . . . . . . . . . . . . . . . . . . . . . . . . . . . . . . . . . . . . . . . . . . . . . . . . . 28
Endnotes . . . . . . . . . . . . . . . . . . . . . . . . . . . . . . . . . . . . . . . . . . . . . . . . . . . . . . . . . . . . . . . . . . . . . . . . . . . . . . 38
3 Does school BoarD leaDership Matter? Foreword and Summary
Foreword and summaryby Dara Zeehandelaar and Amber M. Northern
Anyone faced with improving the achievement, efficiency, operations, or other crucial functions of school districts inevitably asks the same question: What about the school board? Shouldn’t it be responsible for these areas? How much do school boards matter, anyway?
Some education reformers see school boards as partners while others view them as protectors of the status quo and enemies of changes that would benefit children. Yet most put considerable stock in the ability of boards to lead—or to get in the way.
Some critics nowadays regard boards as non-players—structural relics of early-twentieth-century organizational arrangements with little bearing on what actually happens inside classrooms. They may be responsible for buildings and budgets but do little that has much impact on student learning.
Consider these two perspectives:
"The evidence is beginning to mount…that school boards are an institution in trouble. Critics find evidence that local boards are increasingly irrelevant in light of major education reforms affecting governance."1
—Jacqueline Danzberger
"Reformers sally forth as if school boards did not exist and as if top-down solutions could be implemented by fiat. School boards, though, despite having lost considerable authority in recent decades to state and federal officials, still have the ability to determine the extent to which reforms will even be attempted. Anyone seeking to improve schools ignores the power of school boards at some peril."2
—Gene I. Maeroff
So which is it? (Or is it all—or none—of the above?) When it comes to the elected leaders of the nation’s 14,000 school districts, are board members critical players in enhancing student learning, harmless bystanders, or part of the problem? If they are critical players, are they well suited to deliver the best results for students? And if they are indeed capable and willing to focus on student learning, do those qualities have any relationship to academic results?
These aren’t new questions for the Thomas B. Fordham Institute. Our 2010 report School boards Circa 2010: Governance in the Accountability Era (a joint effort among us, the National School Boards Association, and the Iowa School Boards Association, authored by the American Enterprise Institute’s Rick Hess and Olivia Meeks)3 found that board members tend to give top priority to school goals with generally intangible outcomes, such as helping students fulfill their potential or preparing them for a satisfying and productive life (as opposed to readying them for the workforce or for college). Board members also tend to blame inadequate resources and federal and state encroachment as barriers to improving achievement.
Yet only a handful of scholars have probed the politics of democratically elected boards. Rick Hess, David Leal, and Terry Moe have long examined the degree to which interest groups participate in school
4 Does school BoarD leaDership Matter? Foreword and Summary
board elections; William Howell, Lars Bjork, Thomas Alsbury, George Petersen, and Darleen Opfer have studied interactions among boards, superintendents, and voters. The primary takeaway from their work seems to be that board members are susceptible to personal and political considerations—e.g., their own past occupations, ties to unions, and links with other interest groups—but we cannot tell whether their decision making is actually compromised. In other words, board members are fallible; yet they are also, for the most part, doing their best with the system that they’ve been given.
That said, dysfunction and weak results are not strangers to American public education (or, for that matter, private education), and much effort is directed toward altering those conditions. Changing the governance arrangements—including ways of circumventing elected school boards—is very much on the table. Across the land, eighteen districts (or their states) have sought mayoral control in place of elected boards. But that is no longer the only alternative arrangement. “Recovery” districts, state takeovers,
and education management organizations, for example, do not presuppose an elected board—at least not the “independent” kind. We don’t yet have much data on how well these alternative structures work, but that won’t be the case for long. (Research on state takeovers and mayoral control, where we already have some evidence, shows that gains are modest at best, but the effect depends on the type of schools, the individuals in control, and other contextual variables. Particularly unclear is whether state takeovers have positive outcomes with respect to student learning.)
Still, these alternative structures are rare exceptions to what Michael Berkman and Eric Plutzer have termed the “ten thousand democracies” of elected local school boards. The theory underlying that ubiquitous governance
arrangement, dating back to the start of the previous century, is that board members should be upstanding laymen who hire capable professionals who are, in turn, held accountable for meeting the needs and satisfying the concerns of the community. Elections were structured to insulate candidates from interest groups, partisan connections, and other local elected officials, all of which were deemed corrupt and patronage-obsessed by reformers of that era. School board elections were held separately from other local, state, and national races, and members were elected from the entire district rather than by subdistrict or ward.
These practices persist today in most U.S. communities. While this structure in many places has grown manifestly political and often educationally dysfunctional, the idea of local control and local accountability still has wide appeal; and it still seems preferable to a one-size-fits-all behemoth of centralization.
But what are today’s board members like? To what extent are U.S. school boards composed of leading citizens committed to the public good? And to what extent are these individuals too set in their ways, too bound by political ties, and too corporate to address student learning effectively?
While this structure in many places has grown manifestly political and often educationally dysfunctional, the idea of local control and local accountability still has wide appeal; and it still seems preferable to a one-size-fits-all behemoth of centralization.”
“
5 Does school BoarD leaDership Matter? Foreword and Summary
Recognizing that our own opinions in this realm were based more on experience, impression, and anecdote than on solid data, we set out to learn more about the present occupants of America’s far-flung school boards and the systems in which they work. We are keenly aware that the present era of American education—and certainly Fordham’s work—focuses heavily on student achievement. Do today’s board members share that commitment? Do they have the knowledge to make data-based decisions? Do they assign top priority to improving student learning and boosting school performance?
To conduct this study, we teamed with Arnold F. Shober, associate professor of government at Lawrence University, and Michael T. Hartney, researcher in political science at the University of Notre Dame. Both have conducted significant previous research into the politics and policy surrounding the sometimes confounding world of education governance.
The present study is, to our knowledge, the first large-scale effort to gauge the capacity of board members to lead America’s school districts effectively. The authors start with data from a national survey of 900 school board members (administered in 2009) situated across 417 unique U.S. school districts. (The survey results were gathered as part of Governance in the Accountability Era.) They then combine the survey data with detailed demographic and pupil achievement data for the same districts. They look primarily at school board “capacity”— i.e., whether boards demonstrate accurate knowledge of actual district conditions, believe that improving student learning is important (what we call “academic focus”), and engage in a particular set of work practices while overseeing their districts.
This report asks four questions:
1. Do school board members have the capacity (accurate knowledge, academic focus, and work practices) to govern effectively?
2. Do districts with higher-capacity board members “beat the odds” and excel academically, despite district characteristics?
3. What characteristics of board members are associated with greater capacity?
4. Is a district’s method of selecting board members associated with its ability to beat the odds?
What did we learn?
1. Board members, by and large, possess accurate information about their districts and adopt work practices that are generally similar across districts. But there is little consensus about which goals should be central.
U.S. school board members generally show themselves to possess reasonable knowledge of district conditions—except when it comes to academics. They demonstrate accurate knowledge in four of the five areas that we examine (school finance, teacher pay, collective bargaining, and class size). They appear less knowledgeable about the rigor (or lack thereof) of academic standards in their respective states: Members’
The present study is, to our knowledge, the first large-scale effort to gauge the capacity of board members to lead America’s school districts effectively.”
“
6 Does school BoarD leaDership Matter? Foreword and Summary
beliefs about the stringency of those standards are divorced from the actual difficulty of those expectations (as they stood in 2009). Board members are also quite divided in their focus, or the priorities that they hold for their districts. There is little consensus that improving student learning is as important as or more important than other concerns, such as the “development of the whole child” and not placing “unreasonable expectations for student achievement” on schools. Most board members utilize a variety of work practices, such as participating in training in budgeting and student achievement issues, but most devote fewer than four full days per month to board matters, and most are not paid for their work. (This finding is perhaps not surprising, considering that members were originally viewed as upstanding lay citizens who serve part-time without compensation but hire capable school managers to do the heavy lifting.)
2. Districts that are more successful academically have board members who assign high priority to improving student learning.
School boards that comprise a higher proportion of members who have an academic focus are, all else being equal, more likely to govern districts that “beat the odds”—that is, districts whose students perform better academically than one would expect, given their demographic and financial characteristics. We also find that members who devote more hours to board service are likelier to oversee districts that beat the odds (although the survey data do not reveal exactly what that time-on-task entails).
3. Political moderates tend to be more informed than liberals and conservatives when it comes to money matters; educators and former educators are less informed.
Political ideology—whether a board member self-identifies as a conservative, moderate, or liberal—is linked to whether board members have accurate knowledge of their districts. Members who describe themselves as conservatives are less likely than liberals to say that funding is a barrier to academic
achievement, regardless of actual spending in the district. Conversely, liberals are more likely than conservatives to say that collective bargaining is not a barrier to achievement, regardless of actual collective bargaining conditions. Political moderates are the most likely to have accurate knowledge regarding school funding and class sizes in the district.
Professional experience shapes board member capacity as well. Rather surprisingly, board members whose professional background is in public education (former teachers or other school-system employees) are less knowledgeable about district conditions than their counterparts who are not former educators. They are much more likely to say that school finances are a major barrier to academic achievement and that raising teacher pay is central
to improving achievement in their district—regardless of the actual level of funding or relative generosity of teacher pay in their districts. In contrast, board members without an occupational background in K–12 education display more accurate knowledge of actual district conditions when it comes to finance, teacher pay, and other areas.
Political ideology—whether a board member self-identifies as a conservative, moderate, or liberal—is linked to whether board members have accurate knowledge of their districts.”
“
7 Does school BoarD leaDership Matter? Foreword and Summary
4. At-large, on-cycle elections are associated with districts that beat the odds.
Districts that elect a larger percentage of board members at large (from the entire district rather than from subdistricts, wards, or precincts) and in on-cycle elections (held the same day as major state or national elections) are substantially more likely to beat the odds. Merely holding elections at the same time as state- or national-level elections is associated with a student proficiency rate about 2.4 points higher than a comparable district that has off-cycle elections.
Our Own ThOughTS
Though these are exploratory analyses that cannot support ironclad policy recommendations—this truly is a realm where more research is needed—we offer four reflections of our own.
First, board members as a group are not ignorant of much of what is going on in their districts. They have a reasonably clear understanding when it comes to school finance, teacher pay, collective bargaining, and class size. Regardless of whether they are knowledgeable from the outset, or whether they surround themselves with savvy staff and administrators, many are making decisions from an informed point of view.
More disquieting is that members who were never educators themselves are more accurately informed than their peers who once were (or still are) educators. Likewise, political moderates appear to have more accurate knowledge than their liberal or conservative counterparts. This is troubling not because ideology or experience shapes board member opinions—that is unavoidable—but because voters in today’s polarized climate might favor strong conservatives or liberals over moderates (“at least they have an opinion!”) and former educators over system outsiders (“they know what it’s really like”). Voters
need to be more aware of these tendencies and respond accordingly. (So far—in what we take to be a good sign—school board members as a group are more “moderate” than the U.S. population as a whole.)
Second, the data suggest that a district’s success in “beating the odds” academically is related to board members’ focus on the improvement of academics. Unfortunately, not all board members have this focus; some prefer a gentler approach: developing the “whole child,” not placing unreasonable academic expectations on schools, and celebrating the work of educators
in the face of external accountability pressures. Nothing is wrong with those other priorities—but they ought not displace the primary goal of presidents, governors, employers, myriad education reformers, and a great many parents in twenty-first-century America: boosting children’s learning.
Third, how we elect many board members may deter the best and brightest from taking on these key roles. Board members elected during on-cycle, at-large elections are more likely to serve in districts that “beat the odds” than those who are chosen by voters off-cycle or by ward. Off-cycle elections have a noble intent (to isolate board elections from partisan politics), as do ward elections (to elect board members who reflect the demographics of the electorate). But given the import of recruiting board members
More disquieting is that members who were never educators themselves are more accurately informed than their peers who once were (or still are) educators.”
“
8 Does school BoarD leaDership Matter? Foreword and Summary
who give top billing to student learning, a system that holds off-cycle, ward-based elections is, at best, counterproductive—and, at worst, harmful to kids.
Finally, we find that training, compensation, and time spent on board business are related to beating the odds. Our data are unable to show the quality of board member training, the degree to which board members respond to constituent demands, how board members spend their time, and other important questions. So we’re not able to offer concrete guidance about how best to maximize board time and service. But we can offer commonsense board-level advice: 1) hire well; 2) hold senior managers accountable for running the system effectively and efficiently, in accord with board-set priorities; and 3) provide responsible oversight without micromanaging.
More than anything, what we take from this study is that school board members and their attitudes do matter—and therefore it’s important to take seriously who gets elected and how that is done. Most board members are neither ill-informed nor incapable of leadership. Regrettably, however, that’s not true of all. As the public education enterprise debates structural reforms and governance innovations, we should also be working to get the best results that we can from the structures that most communities have today, which means getting the very best people elected to school boards. Absent knowledgeable, committed, achievement-centered (and “moderate”) board members, many of our children will leave school having learned less than they should for their own—or the country’s—good.
* * *
AcknOwledgmenTS
This research was made possible through the generous support of the Carnegie Corporation of New York, the Doris & Donald Fisher Fund, and our sister organization, the Thomas B. Fordham Foundation.
Many thanks to Arnold Shober and Michael Hartney, who conducted the analysis and coauthored the report. We appreciate their hard work, innovative approach to answering difficult research questions, and patience with our myriad queries. We are grateful as well for the cooperation of the National School Boards Association, especially former executive director Anne L. Bryant, who granted us access to the raw survey data. (We do not, however, intend to imply that Anne, the NSBA, or any of its current leaders necessarily agree with the findings and opinions set forth herein.) Our gratitude also goes to Rick Hess, director of education policy at the American Enterprise Institute, and Paul Manna, associate professor in government and public policy at the College of William and Mary, for their expert feedback and guidance on the research design and report drafts. Finally, thanks to the Center for American Progress: this work is part of an ongoing partnership with CAP to collaborate on a multiyear investigation of issues regarding education governance. We especially appreciate Ulrich Boser’s thoughtful review of this report.
At Fordham, we recognize the insightful feedback and valuable advice of Chester E. Finn, Jr. and Michael J. Petrilli during the report’s design, drafting, and editing. Matt Richmond oversaw production, Michelle Gininger and Joe Portnoy managed dissemination, and Alyssa Schwenk handled funding and grant reporting. We also thank copy editor Janice Meyerson and our layout designer, Alton Creative, Inc.

9 Does school BoarD leaDership Matter? Introduction
introductionIn recent years, education policy-makers, reformers, and advocates alike have questioned whether America’s traditional system of school governance is broken.4 Much of their disapproval is directed at the nation’s 14,000-plus local school boards, with some critics arguing that board-based governance is outdated and poorly suited to solving today’s most pressing education challenges, particularly in districts where those challenges are greatest.5 The very nature of democratically elected school boards means that school districts have lay leaders. While supporters of local school boards argue that they are crucial for keeping schools responsive to community concerns, detractors contend that popularly elected board members lack the knowledge, commitment to academic achievement, or appropriate work practices to oversee the nation’s schools.6 Others maintain that the notion of a board member as a leading citizen committed to protecting the public good is outdated, replaced by aspiring politicians, single-issue oligarchs, representatives of employee groups, and aggrieved former employees or community members with grudges to settle. This dissatisfaction is illustrated by the emergence of a number of other forms of governance—mayoral control, recovery districts, portfolio districts, state takeover, educational management organizations—that do not call for an elected board.
With this in mind, we set out to find out more about the custodians of the old model and to gauge how well suited they are to govern in an achievement-centered era. Strong and consistent public support for local control in education is unsurprising; but given the easy connection that most Americans make between elected school boards and the local community, widespread use of oddly timed, nonpartisan, and staggered school board elections give elections a more political tinge.7 And given that only about one in ten voters casts a ballot in school board elections,8 are voters choosing candidates with an overriding commitment to student learning? Or are they choosing those who govern on the basis of hunches shaped by self-interest, ideology, career, and other personal attributes?
Unfortunately, despite today’s spirited debates over how best to design school governance, very little evidence exists about how board members actually govern. As William G. Howell, a political scientist, remarked: “It is hardly an exaggeration to note that more is known about the operation of medieval merchant guilds than about the institutions that govern contemporary school districts.”9 Moreover, most investigations of school boards are case studies of a handful of boards or single-state analyses that make it difficult for policy-makers to draw useful representative conclusions about the effectiveness of board-based governance.10 Researchers have fielded various high-quality national surveys of board members; but to our knowledge, no one has yet linked a national sample of school board members to demographic and achievement data in their own districts.11
We recognize that districts vary tremendously in the advantages and challenges that they face and that school boards are only one piece in a complex causal chain. We do not suggest here that school board members, by themselves, can transform academic performance. Teachers, principals, parents, and other
‘It is hardly an exaggeration to note that more is known about the operation of medieval merchant guilds than about the institutions that govern contemporary school districts.’ ”
“
10 Does school BoarD leaDership Matter? Introduction
mentors are important to the day-to-day learning process.12 And even the most capable board members may not be able to lead effectively because of circumstances outside their control, including restrictive and ill-advised state mandates, a lack of resources, ineffectual administrators, or oppositional employee unions and other interest groups. Nevertheless, school boards do occupy the central seat when it comes to controlling local education policies. But do they have the knowledge, focus on academics, and work practices necessary to lead in their own districts?
To examine this question, we match an array of demographic and student achievement data to a national survey of 900 board members situated in a sample of 417 U.S. school districts. We use this unique data set to answer four specific questions about local school board members:
1. Do school board members have the capacity (accurate knowledge, academic focus, and work practices) to govern effectively?
2. Do districts with higher-capacity board members “beat the odds” and excel academically, despite district characteristics?
3. What characteristics of board members are associated with greater capacity?
4. Is a district’s method of selecting board members associated with its ability to beat the odds?
Throughout this report, we use the term “capacity” to mean that school board members demonstrate accurate knowledge of actual district conditions, possess a focus on improving student learning, and adopt general work practices such as participating in training, receiving pay for their work, and devoting time to board business. While “capacity” may have many more components—and an effective board member need not have every single one—capacity, especially as it applies to school principals, is widely defined in the terms that we use here.13 (For this reason, we also keep intact separate components of capacity during parts of the analysis to probe which aspects of it appear more important than others.) Further, “beating the odds” refers to whether a district is academically “efficient”—which we measure by calculating whether students in a district perform better on state exams than students from other comparable districts, controlling for demographic and fiscal characteristics.
This report is organized into four parts. First, we briefly place our questions into the context of the existing research on school boards and education governance (part I). Then we define our measures, introduce our main data sources, and provide a short synopsis of the research design (part II). (Those interested in the details of our methodology are encouraged to consult the Appendix.) Next come our findings (part III), followed by a short conclusion (part IV).

11 Does school BoarD leaDership Matter? I. what do we know about School Board leadership?
i. What Do We Know about school Board leadership?In this section, we review what is known about capacity relative to school boards. As indicated, the term “capacity” comprises three elements: knowledge about the district, a focus on improving student learning, and application of “work practices” (a term that we use to collectively signify training, board member compensation, and time spent on the job). These components parallel research in nonprofit leadership and are consistent with the definition of “capacity” used in previous research on school boards.14
First, previous studies argue that members should be knowledgeable.15 We might expect them to be fairly informed about their districts, given that they tend to be more educated, politically active, and more affluent than their constituents.16 Those analyses also suggest that greater education, political activism, and income are especially pronounced for board members elected from at-large districts (where all members are chosen by the district’s entire electorate) versus those selected by voters who reside in a particular subdistrict or ward. Other studies show that board members are responsive to their constituents when it comes to their preferred level of school spending within the district.17
Second, school board members should possess a particular vision or focus for the schools that they oversee.18 Here, we include their support for improving student learning—what we call an academic focus—as a component of capacity. After all, it is critical that board members prioritize educating students over the needs of adults and other political considerations if they are to fulfill their responsibility to provide students with a high-quality education.19
Third, we include a measure of the work practices adopted by board members in each school district. These practices include receiving training in board roles and responsibilities, budgeting, legal policy issues, and other aspects of running a
public bureaucracy. We also include the number of hours they spend per week on district business and how much they are paid for their work.20 Adopting similar work practices in state legislatures has improved public oversight of state policy and produced higher-quality legislation.21 The same connection between these work practices and capacity might be inferred for school boards.22
Now that we have defined capacity, we turn to whether there should be a link between board member capacity and district results. Although there is virtually no research that explicitly links school board capacity to district academic outcomes, research on nonprofit organizations suggests that a link between board capacity and organizational performance is likely.23 Nonprofits are similar to districts in that they have goals that are difficult to measure and are held accountable to a variety of stakeholders, including the organization’s members and donors. Scholars find that nonprofit board members with greater capacity are better able to meet the organization’s goals.24 Board members who have appropriate
Although there is virtually no research that explicitly links school board capacity to district academic outcomes, research on nonprofit organizations suggests that a link between board capacity and organizational performance is likely.”
“
12 Does school BoarD leaDership Matter? I. what do we know about School Board leadership?
technical skill sets appear to contribute to better nonprofit organizational performance as well.25 Of course, there are limitations to this analogy; nonprofit organizations are not intimately tied in to the political system, and they may choose (and change) both their clients and their goals.
Given that a link between capacity and results exists, at least in the nonprofit sector, what elements should increase (or have the potential to decrease) the capacity of a board and its members to govern well? Previous research suggests that low-profile politicians are more likely to be influenced by personal political characteristics and biases.26 And board members are indeed low-profile—turnout in school board elections tends to be below 15 percent, and many school districts hold elections at times other than November’s state and federal elections.27 While off-cycle elections were once thought to insulate boards from conventional politics and patronage, in practice, the timing has made them vulnerable to active and well-funded groups.28 As such, we test whether election timing and form, as well as personal characteristics, might influence board members’ capacity to lead.
13 Does school BoarD leaDership Matter? II. data and methods
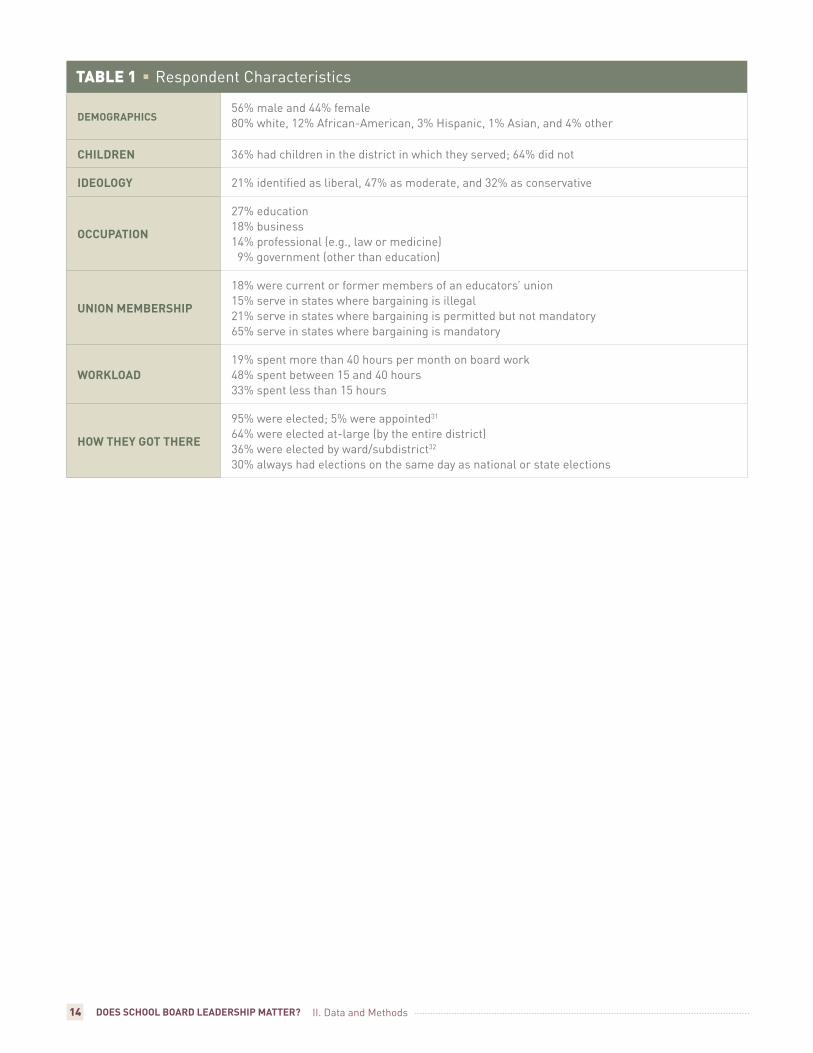
ii. Data and MethodsAs our primary data source, we use the nationally representative data from the 2009 National School Boards Association survey (hereafter, “the NSBA survey”), which queried school board members about their work and priorities. It also included questions about board member demographics, political leanings, professional backgrounds, and elections. In total, 900 board members from 417 school districts responded, representing at least one district from every state except Alaska. The sample was stratified to guarantee sufficient responses from urban districts and from those with student enrollment above 1,000; members from all major urban school districts were among the respondents.29 The sample varied significantly in its demographics, electoral policies, and organizational procedures (see Table 1).
The survey asked board members about the relative severity of various challenges facing their districts (e.g., funding, teaching quality, school leadership), the promise of various education reform proposals (e.g., school choice, teacher pay-for-performance), the process by which members gained office, and how they ranked goals such as preparing students for college versus civic life.
To compare board members’ responses with the actual conditions in their districts, we matched members’ survey responses to district- and state-level data, including demographic, revenue, and achievement data, to craft a picture of American school boards contemporary with the 2009 NSBA survey.30 Then we linked board member responses to the individual survey items to construct measures of our three components of board capacity: knowledge, academic focus, and work practices. All our analyses control for district student population, racial diversity, English language learners, poverty (using eligibility for free or reduced-price lunch), and the percentage of students with Individualized Education Plans, as appropriate. We describe the general methodology used to answer each of the four research questions in the sections that follow; more detailed data analyses techniques are found in the Appendix.
METHODS NOTE
most of the analyses in this report explain individual board members’ responses rather than how a school board, as a whole, might respond. That said, the analyses conducted to answer our second and fourth research questions are, in fact, carried out at the aggregated level of the school board and district as a whole—since here we are concerned with the impact on district-level achievement. here we combine survey responses from multiple members who sit on the same school board. (we ran “robustness tests” of the aggregated analyses to confirm our approach; the tests limited analyses to districts with a minimum of two responding board members. results were not measurably different.)
14 Does school BoarD leaDership Matter?
TablE 1 respondent characteristics
DeMogrAphics56% male and 44% female80% white, 12% African-American, 3% hispanic, 1% Asian, and 4% other
chilDreN 36% had children in the district in which they served; 64% did not
iDeology 21% identified as liberal, 47% as moderate, and 32% as conservative
occupAtioN
27% education18% business14% professional (e.g., law or medicine) 9% government (other than education)
uNioN MeMbership
18% were current or former members of an educators’ union15% serve in states where bargaining is illegal21% serve in states where bargaining is permitted but not mandatory65% serve in states where bargaining is mandatory
WorkloAD19% spent more than 40 hours per month on board work48% spent between 15 and 40 hours33% spent less than 15 hours
hoW they got there
95% were elected; 5% were appointed31
64% were elected at-large (by the entire district) 36% were elected by ward/subdistrict32
30% always had elections on the same day as national or state elections
II. data and methods
15 Does school BoarD leaDership Matter? III. Analysis and Findings
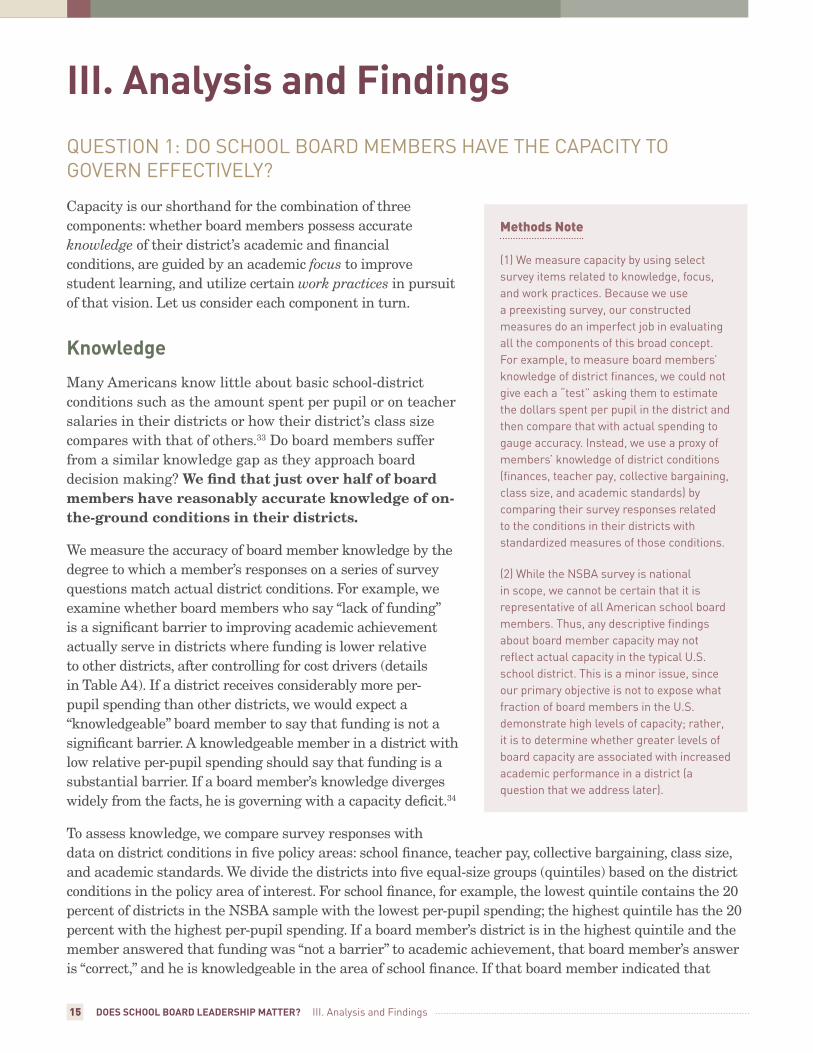
iii. analysis and Findings QueSTIOn 1: dO SchOOl BOArd memBerS hAve The cApAcITy TO gOvern eFFecTIvely?
Capacity is our shorthand for the combination of three components: whether board members possess accurate knowledge of their district’s academic and financial conditions, are guided by an academic focus to improve student learning, and utilize certain work practices in pursuit of that vision. Let us consider each component in turn.
knowledge
Many Americans know little about basic school-district conditions such as the amount spent per pupil or on teacher salaries in their districts or how their district’s class size compares with that of others.33 Do board members suffer from a similar knowledge gap as they approach board decision making? We find that just over half of board members have reasonably accurate knowledge of on-the-ground conditions in their districts.
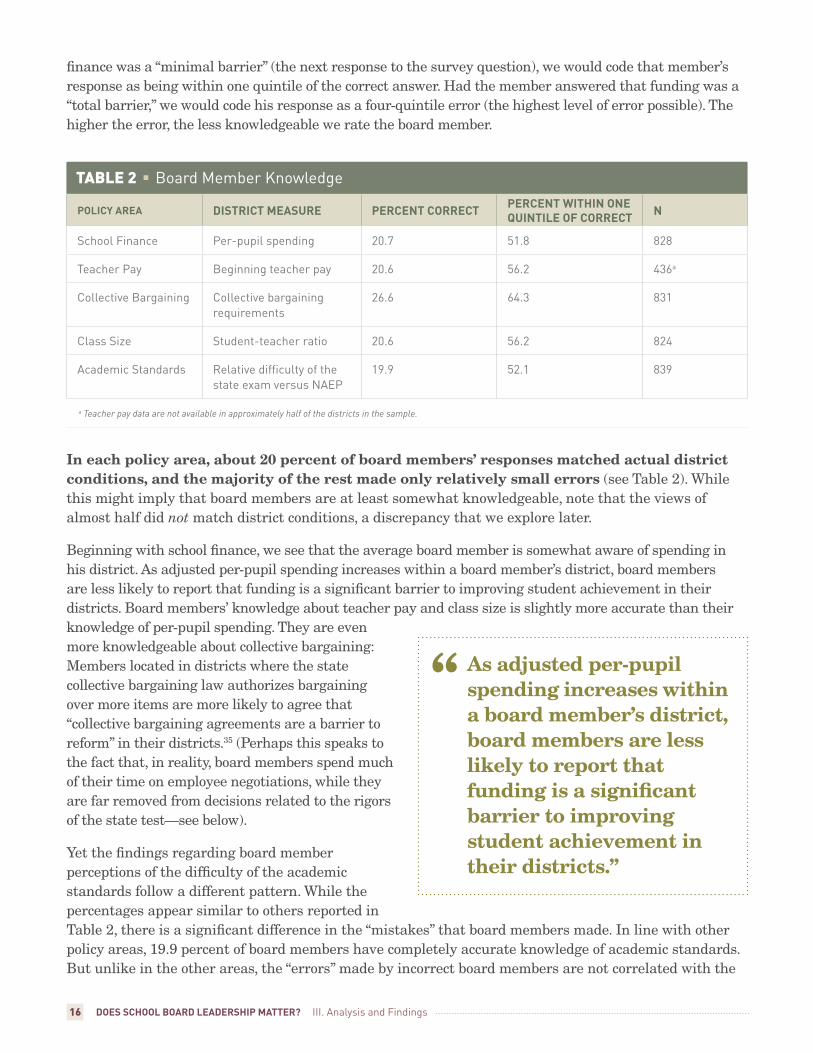
We measure the accuracy of board member knowledge by the degree to which a member’s responses on a series of survey questions match actual district conditions. For example, we examine whether board members who say “lack of funding” is a significant barrier to improving academic achievement actually serve in districts where funding is lower relative to other districts, after controlling for cost drivers (details in Table A4). If a district receives considerably more per-pupil spending than other districts, we would expect a “knowledgeable” board member to say that funding is not a significant barrier. A knowledgeable member in a district with low relative per-pupil spending should say that funding is a substantial barrier. If a board member’s knowledge diverges widely from the facts, he is governing with a capacity deficit.34
To assess knowledge, we compare survey responses with data on district conditions in five policy areas: school finance, teacher pay, collective bargaining, class size, and academic standards. We divide the districts into five equal-size groups (quintiles) based on the district conditions in the policy area of interest. For school finance, for example, the lowest quintile contains the 20 percent of districts in the NSBA sample with the lowest per-pupil spending; the highest quintile has the 20 percent with the highest per-pupil spending. If a board member’s district is in the highest quintile and the member answered that funding was “not a barrier” to academic achievement, that board member’s answer is “correct,” and he is knowledgeable in the area of school finance. If that board member indicated that
Methods Note
(1) we measure capacity by using select survey items related to knowledge, focus, and work practices. Because we use a preexisting survey, our constructed measures do an imperfect job in evaluating all the components of this broad concept. For example, to measure board members’ knowledge of district finances, we could not give each a “test” asking them to estimate the dollars spent per pupil in the district and then compare that with actual spending to gauge accuracy. Instead, we use a proxy of members’ knowledge of district conditions (finances, teacher pay, collective bargaining, class size, and academic standards) by comparing their survey responses related to the conditions in their districts with standardized measures of those conditions.
(2) while the nSBA survey is national in scope, we cannot be certain that it is representative of all American school board members. Thus, any descriptive findings about board member capacity may not reflect actual capacity in the typical u.S. school district. This is a minor issue, since our primary objective is not to expose what fraction of board members in the u.S. demonstrate high levels of capacity; rather, it is to determine whether greater levels of board capacity are associated with increased academic performance in a district (a question that we address later).
16 Does school BoarD leaDership Matter? III. Analysis and Findings
finance was a “minimal barrier” (the next response to the survey question), we would code that member’s response as being within one quintile of the correct answer. Had the member answered that funding was a “total barrier,” we would code his response as a four-quintile error (the highest level of error possible). The higher the error, the less knowledgeable we rate the board member.
TablE 2 Board member knowledge
policy AreA District MeAsure perceNt correct perceNt WithiN oNe QuiNtile of correct N
School Finance per-pupil spending 20.7 51.8 828
Teacher pay Beginning teacher pay 20.6 56.2 436a
collective Bargaining collective bargaining requirements
26.6 64.3 831
class Size Student-teacher ratio 20.6 56.2 824
Academic Standards relative difficulty of the state exam versus nAep
19.9 52.1 839
a Teacher pay data are not available in approximately half of the districts in the sample.
In each policy area, about 20 percent of board members’ responses matched actual district conditions, and the majority of the rest made only relatively small errors (see Table 2). While this might imply that board members are at least somewhat knowledgeable, note that the views of almost half did not match district conditions, a discrepancy that we explore later.
Beginning with school finance, we see that the average board member is somewhat aware of spending in his district. As adjusted per-pupil spending increases within a board member’s district, board members are less likely to report that funding is a significant barrier to improving student achievement in their districts. Board members’ knowledge about teacher pay and class size is slightly more accurate than their knowledge of per-pupil spending. They are even more knowledgeable about collective bargaining: Members located in districts where the state collective bargaining law authorizes bargaining over more items are more likely to agree that “collective bargaining agreements are a barrier to reform” in their districts.35 (Perhaps this speaks to the fact that, in reality, board members spend much of their time on employee negotiations, while they are far removed from decisions related to the rigors of the state test—see below).
Yet the findings regarding board member perceptions of the difficulty of the academic standards follow a different pattern. While the percentages appear similar to others reported in Table 2, there is a significant difference in the “mistakes” that board members made. In line with other policy areas, 19.9 percent of board members have completely accurate knowledge of academic standards. But unlike in the other areas, the “errors” made by incorrect board members are not correlated with the
As adjusted per-pupil spending increases within a board member’s district, board members are less likely to report that funding is a significant barrier to improving student achievement in their districts.”
“
17 Does school BoarD leaDership Matter? III. Analysis and Findings
actual difficulty of academic standards. For example, a board member who said that reducing class size was “extremely important” is more likely to be in a district with larger class sizes than not, even if the district is not in the top 20 percent of districts by class size. For academic standards, however, a board member who expressed the view that there is too much pressure to raise academic achievement is just as likely to be located in a state with challenging assessments as in one with less challenging tests.
focus
Contemporary federal and state education policy has embraced student learning as the centerpiece of schooling—whether through annual testing, the Common Core State Standards initiative, or teacher evaluations—and school boards with an academic focus may find navigating this sea easier than those working across the current.36 We find that board members focus on different priorities in their districts, not all of them academic.
TablE 3 Survey Questions used to measure a Board member’s Focus
AcADeMic focus
* The current state of student achievement is unacceptable; we must make dramatic and rapid improvements in student learning.a
* In your view, improving student learning across the board is....b
plurAl focus
* Students in our community face many challenges; we need to ensure that we don’t place unrea-sonable expectations for student achievement in our schools.a
* There is so much pressure for accountability from the state and the federal levels; our board needs to celebrate our teachers and administrators and provide them with the moral support to do their work.a
* defining success only in terms of student achievement is narrow and shortsighted; we need to emphasize the development of the whole child.a
a The response scale is: 1=Strongly disagree; 2=Inclined to disagree; 3=Neither; 4=Inclined to agree; 5=Strongly agree
b The response scale is: 0=Not at all urgent; 1=Somewhat urgent; 2=Moderately urgent; 3=Very urgent; 4=Extremely urgent
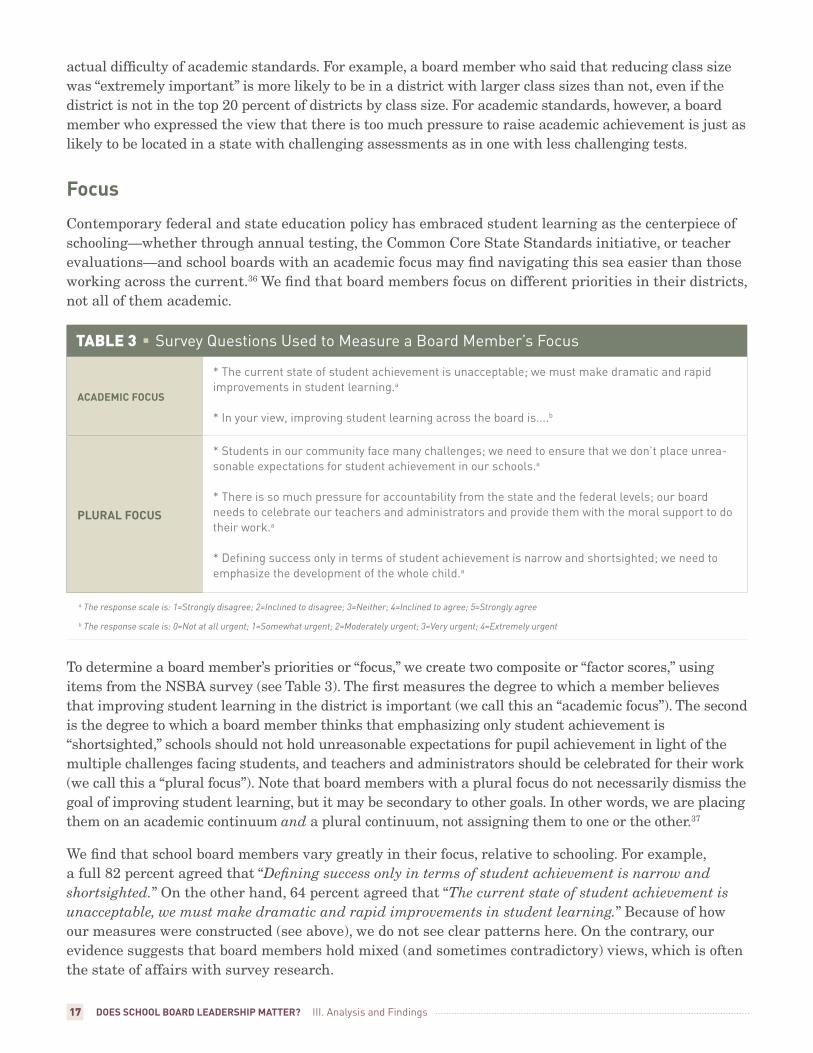
To determine a board member’s priorities or “focus,” we create two composite or “factor scores,” using items from the NSBA survey (see Table 3). The first measures the degree to which a member believes that improving student learning in the district is important (we call this an “academic focus”). The second is the degree to which a board member thinks that emphasizing only student achievement is “shortsighted,” schools should not hold unreasonable expectations for pupil achievement in light of the multiple challenges facing students, and teachers and administrators should be celebrated for their work (we call this a “plural focus”). Note that board members with a plural focus do not necessarily dismiss the goal of improving student learning, but it may be secondary to other goals. In other words, we are placing them on an academic continuum and a plural continuum, not assigning them to one or the other.37
We find that school board members vary greatly in their focus, relative to schooling. For example, a full 82 percent agreed that “Defining success only in terms of student achievement is narrow and shortsighted.” On the other hand, 64 percent agreed that “The current state of student achievement is unacceptable, we must make dramatic and rapid improvements in student learning.” Because of how our measures were constructed (see above), we do not see clear patterns here. On the contrary, our evidence suggests that board members hold mixed (and sometimes contradictory) views, which is often the state of affairs with survey research.
18 Does school BoarD leaDership Matter? III. Analysis and Findings
Work practices
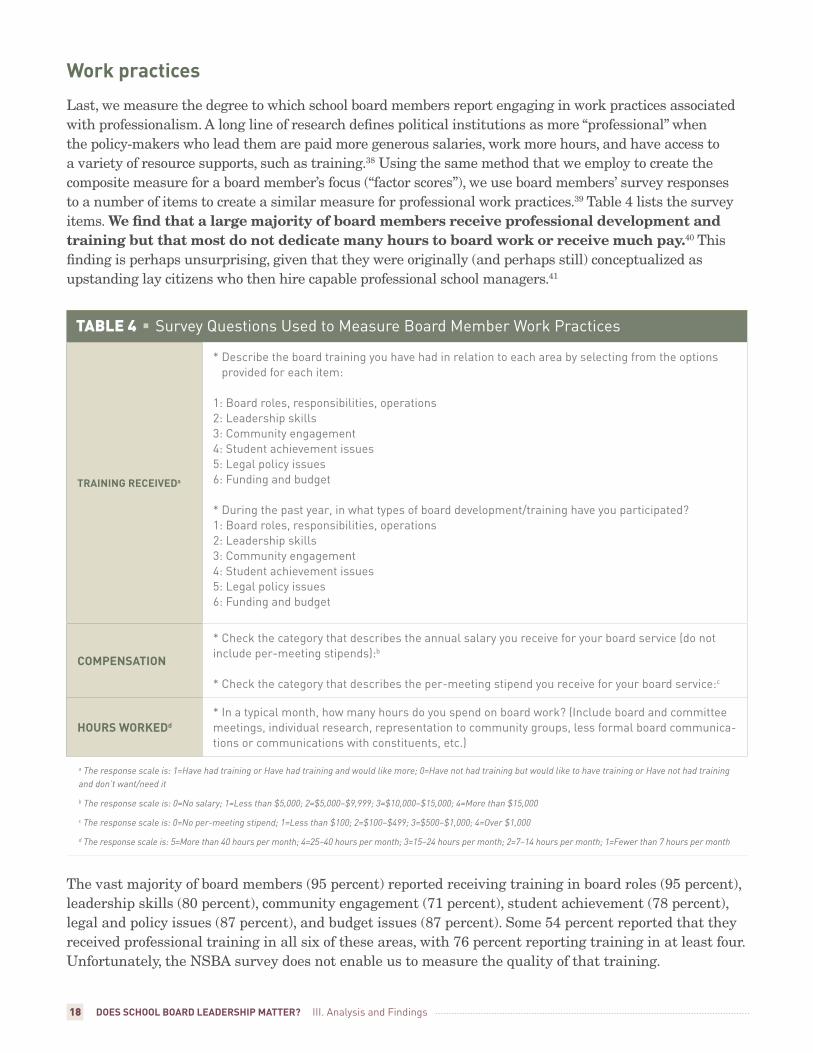
Last, we measure the degree to which school board members report engaging in work practices associated with professionalism. A long line of research defines political institutions as more “professional” when the policy-makers who lead them are paid more generous salaries, work more hours, and have access to a variety of resource supports, such as training.38 Using the same method that we employ to create the composite measure for a board member’s focus (“factor scores”), we use board members’ survey responses to a number of items to create a similar measure for professional work practices.39 Table 4 lists the survey items. We find that a large majority of board members receive professional development and training but that most do not dedicate many hours to board work or receive much pay.40 This finding is perhaps unsurprising, given that they were originally (and perhaps still) conceptualized as upstanding lay citizens who then hire capable professional school managers.41
TablE 4 Survey Questions used to measure Board member work practices
trAiNiNg receiveDa
* describe the board training you have had in relation to each area by selecting from the options provided for each item:
1: Board roles, responsibilities, operations2: leadership skills3: community engagement4: Student achievement issues5: legal policy issues6: Funding and budget
* during the past year, in what types of board development/training have you participated?1: Board roles, responsibilities, operations2: leadership skills3: community engagement4: Student achievement issues5: legal policy issues6: Funding and budget
coMpeNsAtioN
* check the category that describes the annual salary you receive for your board service (do not include per-meeting stipends):b
* check the category that describes the per-meeting stipend you receive for your board service:c
hours WorkeDd
* In a typical month, how many hours do you spend on board work? (Include board and committee meetings, individual research, representation to community groups, less formal board communica-tions or communications with constituents, etc.)
a The response scale is: 1=Have had training or Have had training and would like more; 0=Have not had training but would like to have training or Have not had training and don’t want/need it
b The response scale is: 0=No salary; 1=Less than $5,000; 2=$5,000–$9,999; 3=$10,000–$15,000; 4=More than $15,000
c The response scale is: 0=No per-meeting stipend; 1=Less than $100; 2=$100–$499; 3=$500–$1,000; 4=Over $1,000
d The response scale is: 5=More than 40 hours per month; 4=25–40 hours per month; 3=15–24 hours per month; 2=7–14 hours per month; 1=Fewer than 7 hours per month
The vast majority of board members (95 percent) reported receiving training in board roles (95 percent), leadership skills (80 percent), community engagement (71 percent), student achievement (78 percent), legal and policy issues (87 percent), and budget issues (87 percent). Some 54 percent reported that they received professional training in all six of these areas, with 76 percent reporting training in at least four. Unfortunately, the NSBA survey does not enable us to measure the quality of that training.
19 Does school BoarD leaDership Matter? III. Analysis and Findings
While board members have access to training opportunities, they lag other “professionalized” government officials who serve on state legislatures, county boards, and city councils.42 For example, 62 percent of board members reported that their district pays them no salary,43 and 57 percent devote fewer than four days a month to board matters.44
Overall, we find that board members appear to have a limited capacity to govern. Board members have incomplete knowledge of district conditions. Too many members lack a strong academic focus, which may be a disadvantage to their students as well as to the teachers and principals who work in test-based accountability systems. Yet board members do participate in training and earn little pay, working the limited hours that we might expect of lay positions.
20 Does school BoarD leaDership Matter? III. Analysis and Findings
QueSTIOn 2: dO dISTrIcTS wITh hIgher-cApAcITy BOArd memBerS “BeAT The OddS” And excel AcAdemIcAlly, deSpITe dISTrIcT chArAcTerISTIcS?
Next, we examine whether districts led by higher-capacity boards (those whose members display greater knowledge, hold an academic focus, and utilize certain work practices) are also those that post favorable academic achievement outcomes.45 Do these districts beat the odds by generating higher academic outcomes than we would predict, based on the student populations they serve and the money they spend? We find evidence that districts with high-capacity boards are far more likely to be those that beat the odds. Academic focus and work practices are specifically related to success.
Not all components of capacity are associated with academic success. A board’s overall level of accurate knowledge is not related to beating the odds. This is true for any of the five components of knowledge introduced earlier.46
Boards composed of more members holding an academic focus, however, are much more likely to govern districts where students beat the odds—that is, these districts showed better academic achievement per dollar than similar districts. Our results show that students in districts where a larger fraction of responding board members believe that improving student learning is important post scores 0.024 points higher per dollar spent per student than similar districts. This suggests that these districts have proficiency rates about 1.9 percent higher than similar districts without academically focused boards.47 The boost associated with academic focus is the highest of any school board characteristic that we tested.
Similarly, school boards with members reporting that they participate in professional development, earn a salary, and work more hours reveal a 0.01 point increase in achievement per dollar spent per student. In other words, a district’s proficiency rate is about 1 percent higher than a similar district that operates without these work practices (all other factors, such as spending and demographics, being equal).
In sum, boards with members who have an academic focus and exhibit certain work practices are associated with better student achievement than expected, given their district conditions. They beat the odds. Though we cannot claim cause and effect, these results suggest that board members who emphasize improving learning as the paramount goal for their district can make a difference when it comes to academic outcomes. Districts that are academically more successful have board members who give academics a high priority.
Methods Note
we construct a measure of a district’s academic return on investment (rOI) by calculating district spending per point of student academic achievement, lagged one year before the survey. we adjust spending for local cost conditions and rescale achievement to a national norm, so that the measure is comparable across districts in different states. next we create a measure of academic efficiency by comparing how well a similarly situated district would be expected to perform with the district’s actual performance. districts that performed better on this measure are efficient, or “beat the odds” (see Table A6). note that this measure is for a single year (2008–09, the year prior to the survey) and does not examine performance over time.
The data do not allow us to make the causal claim that board capacity leads to higher or lower academic efficiency. The connection between board governance and organizational results is inevitably uncertain because so many factors influence students’ performance on tests. Analysts cannot randomly assign school board members with greater academic focus to a set of “treatment” districts and those with greater plural focus to a set of “control” districts. It is also possible that districts that beat the odds disproportionately attract board members who hold an academic focus (i.e., part of the capacity relationship may be cyclical), although there is no a priori reason to assume that these potential board members are more knowledgeable or observe certain work practices. we therefore cannot say that higher-capacity boards cause these districts to beat the odds.
21 Does school BoarD leaDership Matter? III. Analysis and Findings
QueSTIOn 3: whAT chArAcTerISTIcS OF BOArd memBerS Are ASSOcIATed wITh greATer cApAcITy?
Question 1 shows that many board members in our sample have some knowledge of district conditions; some also govern with an academic focus. However, board members varied significantly on each of these components. In this section, we identify the individual characteristics that best predict the focus that board members hold (one that either targets academics or considers multiple goals) and their knowledge of district conditions.48 The characteristics that we examine include political ideology, occupation, level of education, gender, and whether the member has any children in the district. We find strong evidence that both knowledge and focus are shaped by board members’ occupational background and political ideology.
Let us first examine the link between political ideology and members’ accurate knowledge. Political ideology—whether a board member self-identified as a political conservative, moderate, or liberal—plays a key role in predicting whether board members display knowledge of their districts in answering a variety of questions about policy.49 For example, members who called themselves conservatives are 11.3 percent less likely than members who identified as liberals to say that funding is a barrier to academic achievement, regardless of actual spending in the district. Similarly, liberals are 10 percent more likely than conservatives to say that collective bargaining is not a barrier to achievement, regardless of actual collective bargaining conditions. One surprise comes with political moderates: They are the most likely to have accurate knowledge regarding school funding and class sizes in the district. In other words, those who self-identified as political moderates are significantly more likely to say that reducing class size is important if class sizes in their districts are large and to say that funding is a barrier when indeed it is lower in their districts than in peer districts. In our sample, 21 percent self-identified as liberal, 47 percent moderate, and 32 percent conservative.
Political liberals are more likely than moderates or conservatives to place less focus on improving student learning, believing instead that schools serve many goals. Conservatives, in fact, do not subscribe to either an academic or a plural focus, suggesting that their priorities may lie in financial stewardship (or other matters) rather than in student learning or other outcomes. Of these groups, self-identified moderates are significantly more likely to have an academic focus.
Methods Note
we link board members’ self-reported political leanings and occupational backgrounds with capacity measures to see whether certain types of members are more or less likely to demonstrate capacity. By controlling for the actual conditions in each district, we can isolate the extent to which other factors outside factual knowledge—such as members’ personal attributes—influence individual attitudes and beliefs. (For full results and details, including additional control variables, see Tables A3, A4, and A5.)
For example, for the question, “To what degree is finance/funding a barrier to what you would like to see the district do to improve student achievement?,” we compare the responses of current or former teachers with those of non-teachers, while controlling for the district’s actual financial position relative to other school districts. If we find that board members who are or who were teachers are likely to claim that a lack of funding is a barrier even after controlling for the actual funding in the district and other district demographic characteristics, we take this as evidence that educator status affects how “knowledgeable” board members are about funding. note that we control for district characteristics that typically drive school costs, including urbanicity, demographics, and poverty; any finding here shows a disparity after accounting for potentially higher district costs or needs. we use the same method to assess how much board members’ political ideology affects their knowledge about district conditions.
22 Does school BoarD leaDership Matter? III. Analysis and Findings
We turn next to occupation and knowledge. The survey allows us to test knowledge against business experience and whether board members are current or former educators.50 As with ideology, there is a strong effect of occupation on the accuracy of members’ knowledge. Board members who came to the board as current or former professional educators are 6.4 percent more likely than other members to claim that funding is a major barrier to improving district academic achievement, regardless of the actual level of funding in the
district and controlling for political ideology. Another compelling piece of evidence: Current and former educators are 19 percent more likely than non-educators to say that raising teacher pay is “very” or “extremely” important to improving district academic achievement, regardless of the actual teacher salaries in the member’s district.51
We see similar effects of occupation on focus. Specifically, board members who are current or former educators are 14 percent more likely to hold a plural rather than an academic focus for their districts, meaning that they are far more likely to agree that teachers and administrators should be “celebrated” and given “moral support” in the face of high-pressure accountability, and 6 percent more likely to agree or strongly agree that academic expectations on students are “unreasonable,” even after controlling for the type of student population that the district serves and the actual rigor of academic standards that students in their district face. In other words, being a current or former educator increases the likelihood that a board member claims that academic expectations could be “unreasonable” because of the “challenges” that students face—even in districts with comparatively low standards. At the same time, we find that a background in business does not correlate to academic focus, despite the notion that business leaders focus on the bottom line of measurable student performance. Who does focus most on academics? The 55 percent of our sample that reported neither an educator nor a business background.52
All told, we find that board capacity is related to political ideology and a personal history in the classroom. As might be expected, educator status leads members to be more sympathetic to collective bargaining and higher teacher pay; but it also correlates with a plural focus that includes celebrating the work of teachers and administrators.
[S]elf-identified moderates are significantly more likely to have an academic focus.”
“
Board members who came to the board as current or former professional educators are 6.4 percent more likely than other members to claim that funding is a major barrier to improving district academic achievement, regardless of the actual level of funding in the district and controlling for political ideology.”
“
23 Does school BoarD leaDership Matter? III. Analysis and Findings
QueSTIOn 4: IS A dISTrIcT’S meThOd OF SelecTIng BOArd memBerS ASSOcIATed wITh ITS ABIlITy TO BeAT The OddS?
Much previous research and theory links the arrangements of education governance, such as when and how board members are selected, to district outcomes. So we examine the connection between two structural factors—whether members are chosen in on-cycle elections (those held on the same day as other major elections) and whether they are voted into “at-large” or “ward-based” board seats—and our “beating the odds” measure.53 Off-cycle and ward-based elections are easier for interest groups or teachers’ unions to canvass and have been shown to decrease voter turnout, since the average voter is less likely to monitor politics absent a major state or federal election on the ballot. Thus, we expect that electoral features will potentially make it easier for teachers’ unions to elect their favored candidates—often fellow educators and/or liberals. (While ward elections have substantially increased the racial and ethnic diversity of board members nationally, some evidence suggests that they have decreased school boards’ focus on district-wide policy concerns.)54 Given the strong relationship between board members’ capacity and their occupation and ideology, we anticipate that electoral rules may be related to academic success, as determined by our “beating the odds” measure.
In fact, we do find such evidence. Specifically, boards that elect a larger percentage of members at-large and in on-cycle elections are substantially more likely to oversee districts that beat the odds.56 Indeed, merely holding elections at the same time as state- or national-level elections is associated with a 0.03 per-dollar-spent-per-student boost, or a proficiency rate about 2.4 points higher than a comparable district that has off-cycle elections. At-large elections also correlate with greater academic efficiency, with a 0.024-point increase per dollar spent per student, or a proficiency rate about 1.9 points higher
than comparable districts with ward-based elections, although these results were just shy of reaching conventional levels of statistical significance.
It is clear from our findings that the capacity of U.S. school board members does correlate with academic performance. What’s more, given the crowded policy environment in which board members work, these are substantive gains.
Methods Note
here we use ordinary least squares regression to relate electoral rules with beating the odds. Although not directly related to board member capacity, previous research suggests that electoral rules do influence board decision making. e.g., turnout in school board elections tends to top out around 15 percent, and many school districts hold off-cycle elections—that is, apart from november’s state and federal elections—so it is not surprising that numerous studies have shown that teachers’ unions are influential in district politics.55 For more details and full results, see Table A6.
Specifically, boards that elect a larger percentage of members at-large and in on-cycle elections are substantially more likely to oversee districts that beat the odds.”
“
24 Does school BoarD leaDership Matter? Iv. conclusion
iV. conclusionDespite some observers’ concerns that U.S. school boards are ineffective tools of school governance, some of our findings are cautiously positive. Board members are moderately knowledgeable about their districts, although such knowledge has little relationship to beating the odds. Board members are generally unpaid and spend little time on district business, but this might not be an altogether bad thing; limited time on district business could mean less opportunity to micromanage or engage in petty politics. Board members also engage in extensive professional training, though we do not whether the training is of high quality, and this is only weakly correlated with district academics. What is troubling is that many members do not give top priority to improving student learning, considering that we find that students do better academically in districts where school board members do subscribe to that focus. Beating the odds is not related to a plural focus on multiple goals, including providing moral support to teachers
(though that is, of course, a good idea) and lowering expectations to compensate for challenges in the community; nor is it related to accurate knowledge of district conditions. This suggests that board members may make a difference if they focus steadfastly on improving student learning above all else.
Further, we find clear evidence that accurate knowledge and an academic focus are associated with board members’ political ideology. Political moderates tend to be better informed than liberals and conservatives when it comes to money matters; educators and former educators are less informed. Moderates are also the most likely to possess accurate knowledge regarding school funding and class size. From one vantage
point, this is exactly what one would desire from democratically elected board members: Voters identify a candidate’s political bent and previous connection to education, and then assume that the candidate will represent a particular agenda. For those concerned with technical competence, however, this may be a grave defect, as liberal and conservative candidates (53 percent of our sample) are less knowledgeable than moderates about their districts’ challenges, even when factual conditions within their district suggest otherwise.
Professional experience shapes board member capacity as well. Board members whose professional background is in public education (e.g., former teachers or other school-system employees) are less knowledgeable about true district conditions than their counterparts who are not former educators. Those whose background is in public education are much more likely to say that school finances are a major barrier to academic achievement and that raising teacher pay is central to improving achievement in their district—regardless of the actual level of funding or relative generosity of teacher pay in their districts. In contrast, board members without an occupational background in K–12 education display more accurate knowledge of actual district conditions when it comes to finance, teacher pay, and other areas.
In addition, too many board elections are held at odd times of the year when few voters are paying attention; in such instances, teachers’ unions interested in electing board members with a background
The fact that board members can influence achievement, even loosely, merits much more attention—surely by scholars but also by voters, parents, taxpayers, and other policy-makers.”
“
25 Does school BoarD leaDership Matter? Iv. conclusion
in education are likely advantaged.57 Given that we find that at-large, on-cycle elections are linked with districts that beat the odds, districts (and voters, school board associations, and local governments) would be well served by paying attention to election rules and determining whether the existing rules are truly serving students best.
Granted, much of the implementation of American educational policy takes place in schools and classrooms, away from school boards and direct democratic accountability.58 School boards do not, and cannot, monitor and cajole teachers and principals (and even the superintendent) on a daily basis. Even so, boards can do a lot—and our children, teachers, and communities deserve school boards with the capacity to do just that.
More pointed research is needed to answer questions related to the quality of board member training, the degree to which they respond to constituent demands, how they spend their time, and more. Countless intervening factors beyond those examined here no doubt affect a school board member’s ability to influence district achievement. The fact that board members can influence achievement, even loosely, merits much more attention—surely by scholars but also by voters, parents, taxpayers, and other policy-makers.
26 Does school BoarD leaDership Matter? Appendix: Technical matters
appendix: technical MattersdATA SOurceS
We supplement the NSBA/Fordham survey with data from the following sources. Unless otherwise noted, all data are district level for the 2009–10 school year, to be contemporary with the NSBA/Fordham survey.
§§ National Center for Education Statistics: Common Core of Data for district size, student demographics, district administrators, and free- and reduced-lunch availability; F-33 survey for district financial information; National Assessment of Educational Progress for the Comparable Wage Index (2006); and state proficiency rates, as compared with state NAEP scores.
§§ U.S. Census Bureau: American Community Survey (2009) for children in poverty, single parenthood, unemployment, college degree rates, district population, and income inequality; and Census of Governments (1992) for election cycles and election method. These are the most recent data on this topic; but exceedingly few districts change their election systems over time, so we are confident that any errors are small.
§§ Various state departments of education: Proficiency rates on state exams by district (2008), supplemented by the New America Foundation’s Federal Education Budget Project.
§§ National Council on Teacher Quality: State requirements for collective bargaining. We use state-level data on the scope of collective bargaining from the National Council on Teacher Quality’s “State Bargaining Rules,” which counts the number of items that state law allows teachers to bargain over during negotiations with their local district. Although this is not an ideal measure—bargaining environments vary across districts within the same state—it is a reasonably good approximation of the legal climate with regard to bargaining.
§§ Sarah F. Anzia: “Election Timing and the Electoral Influence of Interest Groups,” Journal of Politics 73, no. 2 (2011): 412–27, for starting teachers’ wages drawn from the Schools and Staffing
Survey (SASS).
AcAdemIc reTurn On InveSTmenT And “BeATIng The OddS”
For “academic return,” we use student academic performance as measured by standardized tests, adjusted for each state test’s relative difficulty. We begin with the reported percentage of students in the district who met or exceeded the state’s “proficient” level on NCLB-required math and reading exams in 2008–09, the year before the NSBA survey. (We use that year because it is likely that board members would have seen the previous year’s results when answering the 2009 survey.) Because it is well documented that state exams vary widely in difficulty, we adjust these numbers to a national norm to generate a real district performance measure (following a similar procedure to Jay Greene’s “Global Report Card”). Essentially, we adjust each district’s proficiency percentage based on the number of students who meet the standard in that state versus their peers, using the U.S. Department of Education’s scaling of state proficiency standards relative to the National Assessment of Educational Progress. As a result, districts in states with harder exams have a higher adjusted pass rate in our data than the state reports; states with easier exams have a lower pass rate in our data than the state reports.
27 Does school BoarD leaDership Matter? Appendix: Technical matters
For “investment,” we use total current spending by school districts (we do not include capital spending because its costs and benefits may be realized over many years). Current spending is also useful because 85 percent of school board members in the NSBA sample come from districts that provide members with meaningful control of district budgets (i.e., they are fiscally independent).
We then created a district efficiency measure by dividing real district performance by total per-pupil instructional expenditures (which includes teachers’ wages and classroom materials), adjusted using the Comparable Wage Index. We adjust expenditures to reflect differences in labor-market prices for teachers across the United States.59 Thus, our measure is the number of z-score points that a district can expect for each dollar spent on a student.
Nevertheless, differences in student population across districts make direct comparisons among districts problematic. To account for these differences, we create a predicted district efficiency measure by running a cross-sectional fixed-effects regression, controlling for child poverty, single-parent families, unemployment rate, nonworking rates, income inequality, college degrees, English language learners, Individualized Education Programs, and population magnitude, all at the district level. These explanatory variables are meant to measure socioeconomic barriers or benefits to academic success. (They are all statistically significant in predicting the real measure.) This measure captures the relative challenge faced by board members when seeking to achieve a high level of academic performance relative to demographics. We predict performance with cross-sectional ordinary least squares using clustered standard errors.
Finally, we create our variable of interest, a “beating the odds” measure. This measure is simply the difference between the real and predicted efficiency measures. For districts that beat the odds, students perform better than predicted and the measure has a positive value; the measure has a negative value for those districts whose students do worse than predicted. As such, “efficient” districts here are not those with the best academic performance per dollar; they are those that are doing better per dollar than they should, given district conditions.
28 Does school BoarD leaDership Matter? Appendix: Technical matters
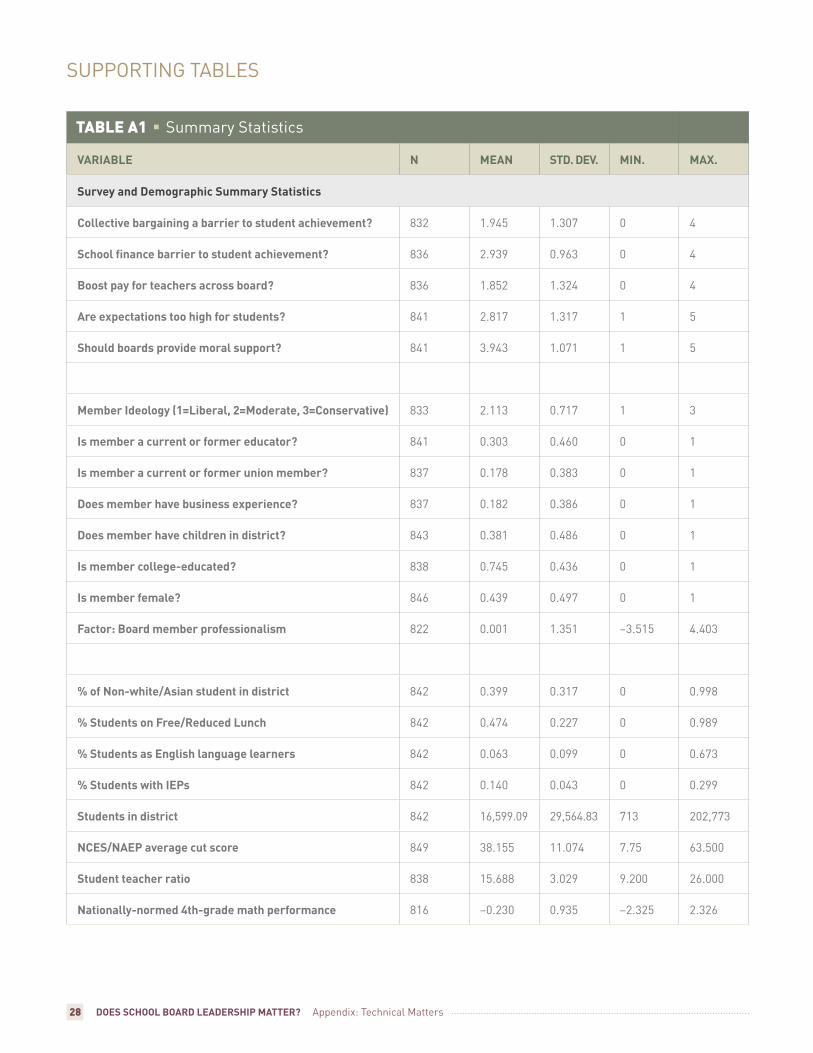
SuppOrTIng TABleS
TablE a1 Summary Statistics
vAriAble N MeAN stD. Dev. MiN. MAx.
survey and Demographic summary statistics
collective bargaining a barrier to student achievement? 832 1.945 1.307 0 4
school finance barrier to student achievement? 836 2.939 0.963 0 4
boost pay for teachers across board? 836 1.852 1.324 0 4
Are expectations too high for students? 841 2.817 1.317 1 5
should boards provide moral support? 841 3.943 1.071 1 5
Member ideology (1=liberal, 2=Moderate, 3=conservative) 833 2.113 0.717 1 3
is member a current or former educator? 841 0.303 0.460 0 1
is member a current or former union member? 837 0.178 0.383 0 1
Does member have business experience? 837 0.182 0.386 0 1
Does member have children in district? 843 0.381 0.486 0 1
is member college-educated? 838 0.745 0.436 0 1
is member female? 846 0.439 0.497 0 1
factor: board member professionalism 822 0.001 1.351 −3.515 4.403
% of Non-white/Asian student in district 842 0.399 0.317 0 0.998
% students on free/reduced lunch 842 0.474 0.227 0 0.989
% students as english language learners 842 0.063 0.099 0 0.673
% students with ieps 842 0.140 0.043 0 0.299
students in district 842 16,599.09 29,564.83 713 202,773
Nces/NAep average cut score 849 38.155 11.074 7.75 63.500
student teacher ratio 838 15.688 3.029 9.200 26.000
Nationally-normed 4th-grade math performance 816 –0.230 0.935 –2.325 2.326
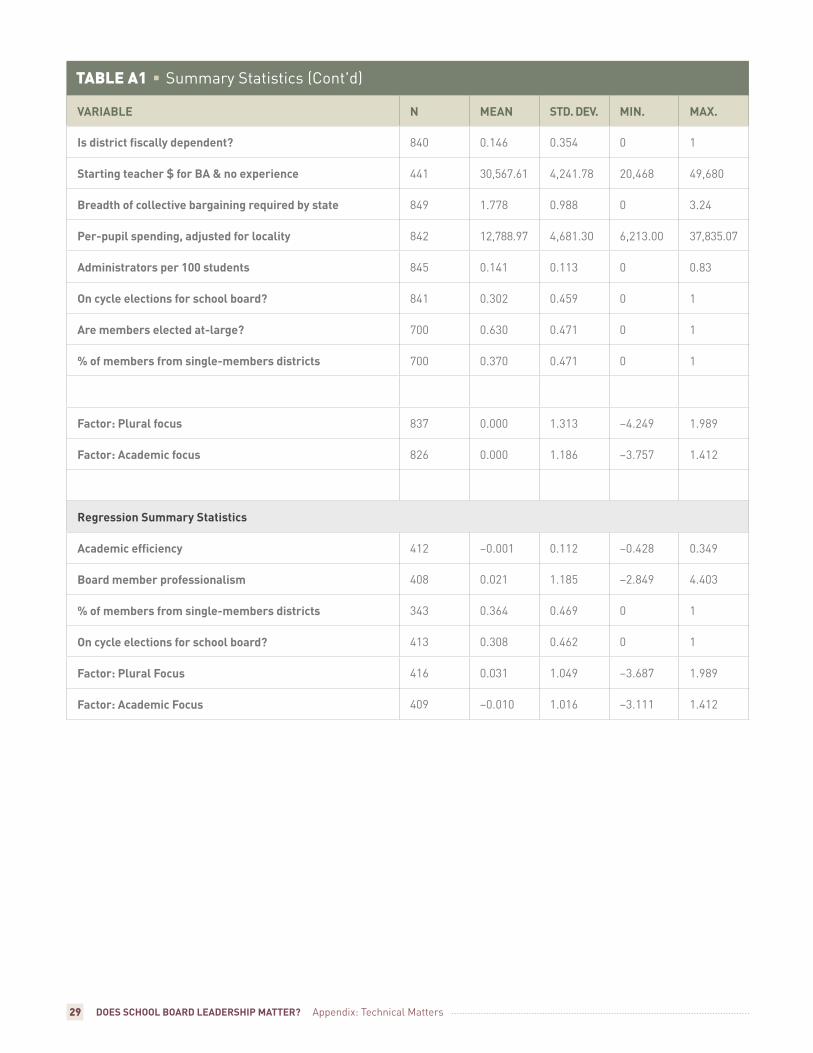
29 Does school BoarD leaDership Matter? Appendix: Technical matters
TablE a1 Summary Statistics (cont'd)
vAriAble N MeAN stD. Dev. MiN. MAx.
is district fiscally dependent? 840 0.146 0.354 0 1
starting teacher $ for bA & no experience 441 30,567.61 4,241.78 20,468 49,680
breadth of collective bargaining required by state 849 1.778 0.988 0 3.24
per-pupil spending, adjusted for locality 842 12,788.97 4,681.30 6,213.00 37,835.07
Administrators per 100 students 845 0.141 0.113 0 0.83
on cycle elections for school board? 841 0.302 0.459 0 1
Are members elected at-large? 700 0.630 0.471 0 1
% of members from single-members districts 700 0.370 0.471 0 1
factor: plural focus 837 0.000 1.313 –4.249 1.989
factor: Academic focus 826 0.000 1.186 –3.757 1.412
regression summary statistics
Academic efficiency 412 −0.001 0.112 −0.428 0.349
board member professionalism 408 0.021 1.185 −2.849 4.403
% of members from single-members districts 343 0.364 0.469 0 1
on cycle elections for school board? 413 0.308 0.462 0 1
factor: plural focus 416 0.031 1.049 −3.687 1.989
factor: Academic focus 409 −0.010 1.016 −3.111 1.412
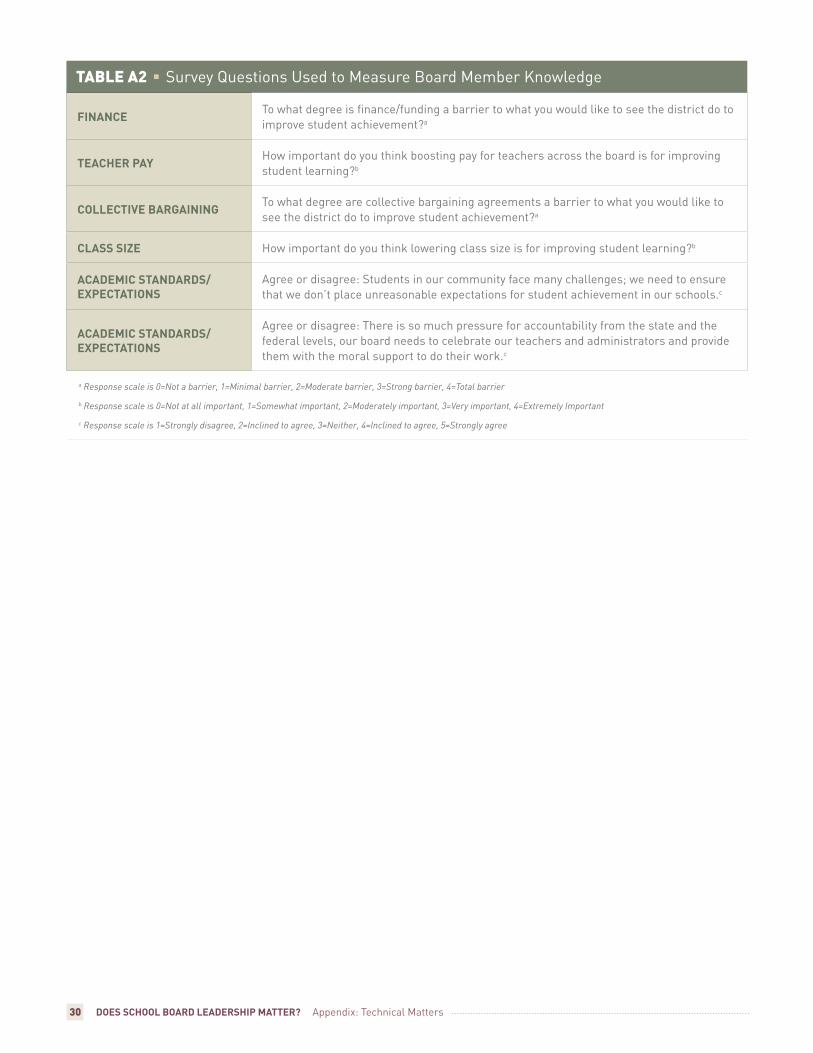
30 Does school BoarD leaDership Matter? Appendix: Technical matters
TablE a2 Survey Questions used to measure Board member knowledge
fiNANce To what degree is finance/funding a barrier to what you would like to see the district do to improve student achievement?a
teAcher pAy how important do you think boosting pay for teachers across the board is for improving student learning?b
collective bArgAiNiNg To what degree are collective bargaining agreements a barrier to what you would like to see the district do to improve student achievement?a
clAss siZe how important do you think lowering class size is for improving student learning?b
AcADeMic stANDArDs/expectAtioNs
Agree or disagree: Students in our community face many challenges; we need to ensure that we don’t place unreasonable expectations for student achievement in our schools.c
AcADeMic stANDArDs/expectAtioNs
Agree or disagree: There is so much pressure for accountability from the state and the federal levels, our board needs to celebrate our teachers and administrators and provide them with the moral support to do their work.c
a Response scale is 0=Not a barrier, 1=Minimal barrier, 2=Moderate barrier, 3=Strong barrier, 4=Total barrier
b Response scale is 0=Not at all important, 1=Somewhat important, 2=Moderately important, 3=Very important, 4=Extremely Important
c Response scale is 1=Strongly disagree, 2=Inclined to agree, 3=Neither, 4=Inclined to agree, 5=Strongly agree
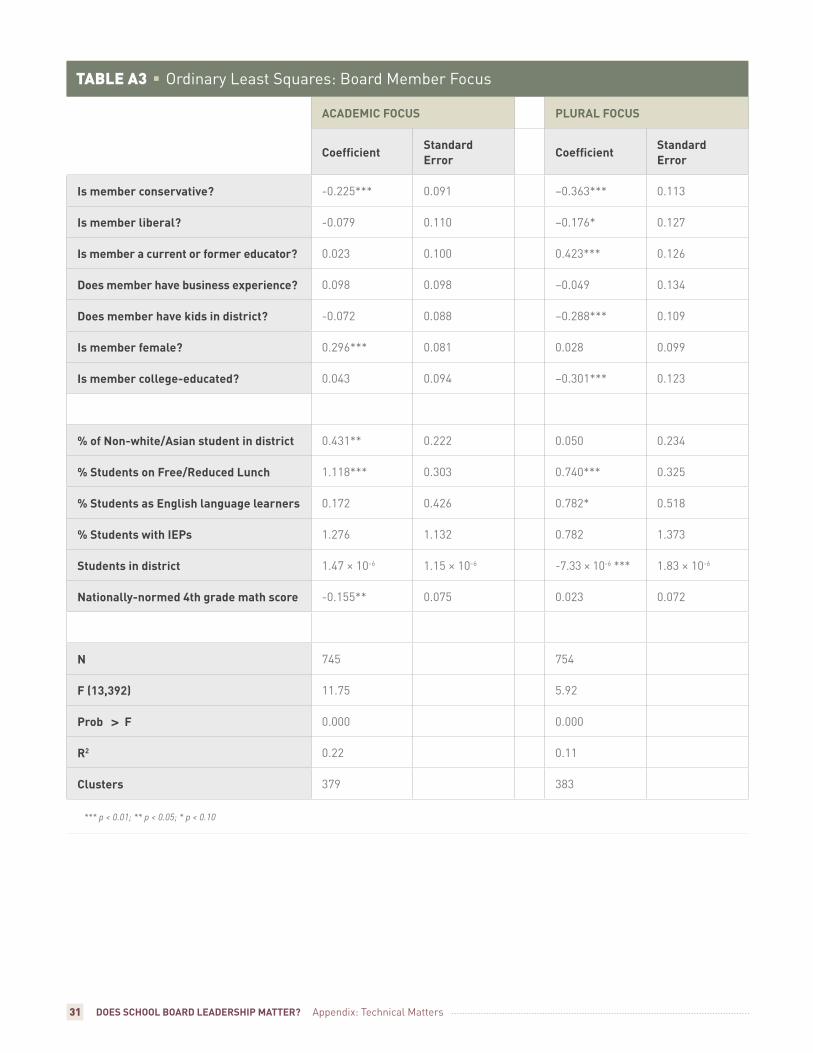
31 Does school BoarD leaDership Matter? Appendix: Technical matters
TablE a3 Ordinary least Squares: Board member Focus
AcADeMic focus plurAl focus
coefficientstandard error
coefficientstandard error
is member conservative? -0.225*** 0.091 −0.363*** 0.113
is member liberal? -0.079 0.110 −0.176* 0.127
is member a current or former educator? 0.023 0.100 0.423*** 0.126
Does member have business experience? 0.098 0.098 −0.049 0.134
Does member have kids in district? -0.072 0.088 −0.288*** 0.109
is member female? 0.296*** 0.081 0.028 0.099
is member college-educated? 0.043 0.094 −0.301*** 0.123
% of Non-white/Asian student in district 0.431** 0.222 0.050 0.234
% students on free/reduced lunch 1.118*** 0.303 0.740*** 0.325
% students as english language learners 0.172 0.426 0.782* 0.518
% students with ieps 1.276 1.132 0.782 1.373
students in district 1.47 × 10⁻⁶ 1.15 × 10⁻⁶ -7.33 × 10⁻⁶ *** 1.83 × 10⁻⁶
Nationally-normed 4th grade math score -0.155** 0.075 0.023 0.072
N 745 754
f (13,392) 11.75 5.92
prob > f 0.000 0.000
r2 0.22 0.11
clusters 379 383
*** p < 0.01; ** p < 0.05; * p < 0.10
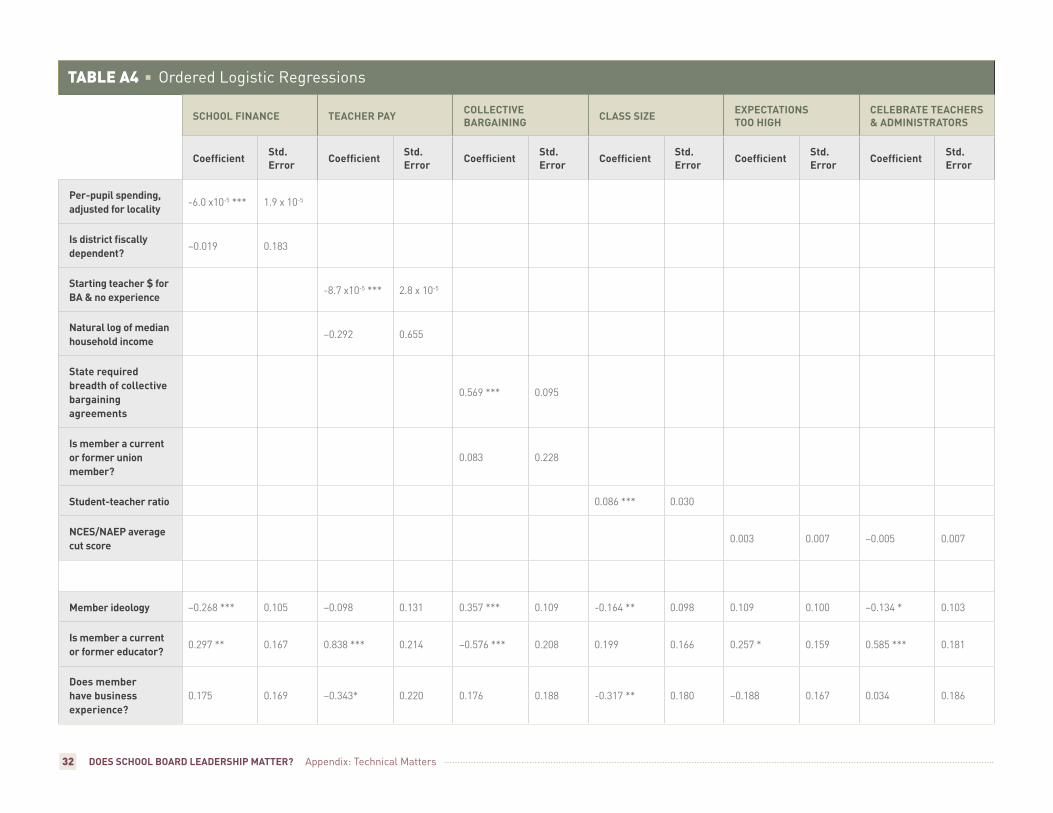
32 Does school BoarD leaDership Matter? Appendix: Technical matters
TablE a4 Ordered logistic regressions
school fiNANce teAcher pAy collective bArgAiNiNg clAss siZe expectAtioNs
too highcelebrAte teAchers & ADMiNistrAtors
coefficientstd. error
coefficientstd. error
coefficientstd. error
coefficientstd. error
coefficientstd. error
coefficientstd. error
per-pupil spending, adjusted for locality
-6.0 x10⁻⁵ *** 1.9 x 10⁻⁵
is district fiscally dependent?
−0.019 0.183
starting teacher $ for bA & no experience
-8.7 x10⁻⁵ *** 2.8 x 10⁻⁵
Natural log of median household income
−0.292 0.655
state required breadth of collective bargaining agreements
0.569 *** 0.095
is member a current or former union member?
0.083 0.228
student-teacher ratio 0.086 *** 0.030
Nces/NAep average cut score
0.003 0.007 −0.005 0.007
Member ideology −0.268 *** 0.105 −0.098 0.131 0.357 *** 0.109 -0.164 ** 0.098 0.109 0.100 −0.134 * 0.103
is member a current or former educator?
0.297 ** 0.167 0.838 *** 0.214 −0.576 *** 0.208 0.199 0.166 0.257 * 0.159 0.585 *** 0.181
Does member have business experience?
0.175 0.169 −0.343* 0.220 0.176 0.188 -0.317 ** 0.180 −0.188 0.167 0.034 0.186
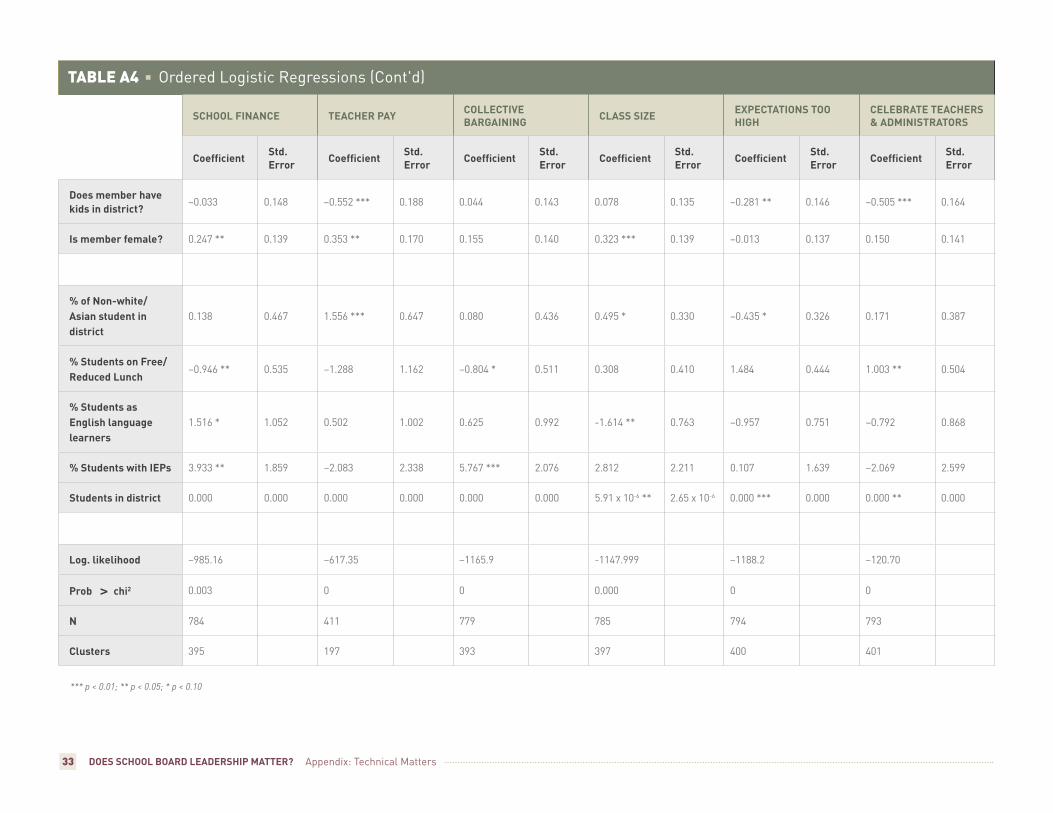
33 Does school BoarD leaDership Matter?
TablE a4 Ordered logistic regressions (cont'd)
school fiNANce teAcher pAy collective bArgAiNiNg clAss siZe expectAtioNs too
highcelebrAte teAchers & ADMiNistrAtors
coefficientstd. error
coefficientstd. error
coefficientstd. error
coefficientstd. error
coefficientstd. error
coefficientstd. error
Does member have kids in district?
−0.033 0.148 −0.552 *** 0.188 0.044 0.143 0.078 0.135 −0.281 ** 0.146 −0.505 *** 0.164
is member female? 0.247 ** 0.139 0.353 ** 0.170 0.155 0.140 0.323 *** 0.139 −0.013 0.137 0.150 0.141
% of Non-white/Asian student in district
0.138 0.467 1.556 *** 0.647 0.080 0.436 0.495 * 0.330 −0.435 * 0.326 0.171 0.387
% students on free/reduced lunch
−0.946 ** 0.535 −1.288 1.162 −0.804 * 0.511 0.308 0.410 1.484 0.444 1.003 ** 0.504
% students as english language learners
1.516 * 1.052 0.502 1.002 0.625 0.992 -1.614 ** 0.763 −0.957 0.751 −0.792 0.868
% students with ieps 3.933 ** 1.859 −2.083 2.338 5.767 *** 2.076 2.812 2.211 0.107 1.639 −2.069 2.599
students in district 0.000 0.000 0.000 0.000 0.000 0.000 5.91 x 10⁻⁶ ** 2.65 x 10⁻⁶ 0.000 *** 0.000 0.000 ** 0.000
log. likelihood −985.16 −617.35 −1165.9 -1147.999 −1188.2 −120.70
prob > chi2 0.003 0 0 0.000 0 0
N 784 411 779 785 794 793
clusters 395 197 393 397 400 401
*** p < 0.01; ** p < 0.05; * p < 0.10
Appendix: Technical matters
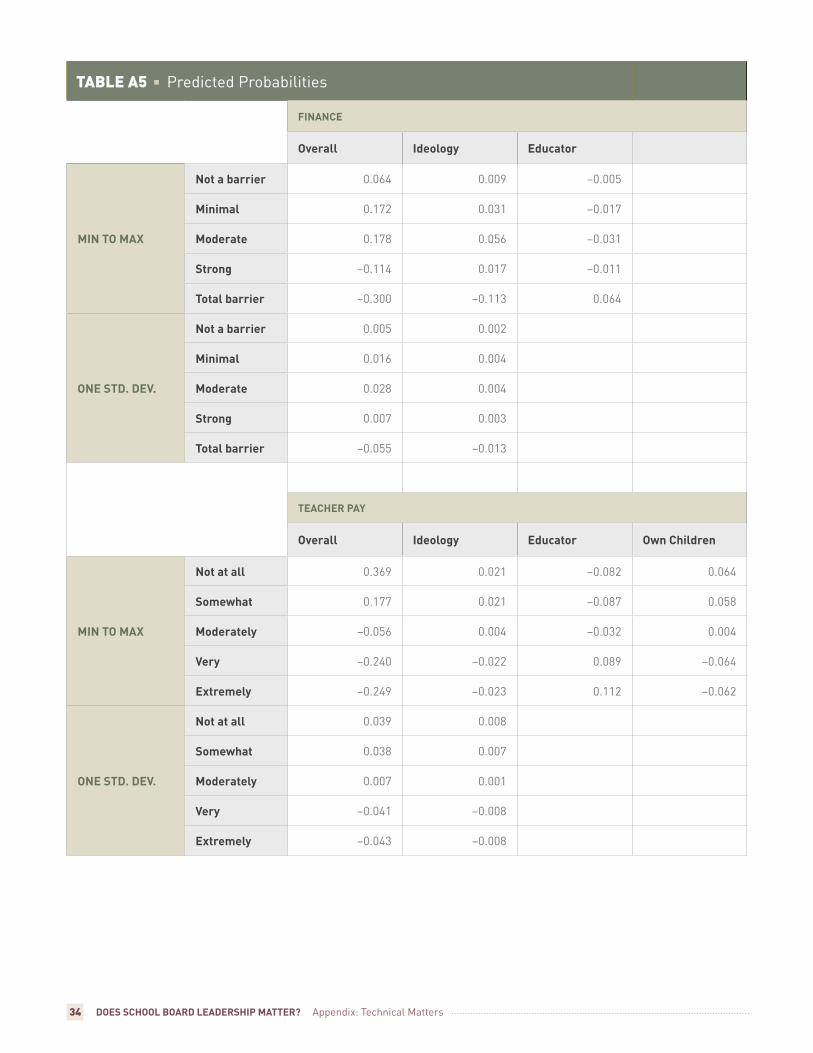
34 Does school BoarD leaDership Matter?
TablE a5 predicted probabilities
fiNANce
overall ideology educator
MiN to MAx
Not a barrier 0.064 0.009 −0.005
Minimal 0.172 0.031 −0.017
Moderate 0.178 0.056 −0.031
strong −0.114 0.017 −0.011
total barrier −0.300 −0.113 0.064
oNe stD. Dev.
Not a barrier 0.005 0.002
Minimal 0.016 0.004
Moderate 0.028 0.004
strong 0.007 0.003
total barrier −0.055 −0.013
teAcher pAy
overall ideology educator own children
MiN to MAx
Not at all 0.369 0.021 −0.082 0.064
somewhat 0.177 0.021 −0.087 0.058
Moderately −0.056 0.004 −0.032 0.004
very −0.240 −0.022 0.089 −0.064
extremely −0.249 −0.023 0.112 −0.062
oNe stD. Dev.
Not at all 0.039 0.008
somewhat 0.038 0.007
Moderately 0.007 0.001
very −0.041 −0.008
extremely −0.043 −0.008
Appendix: Technical matters
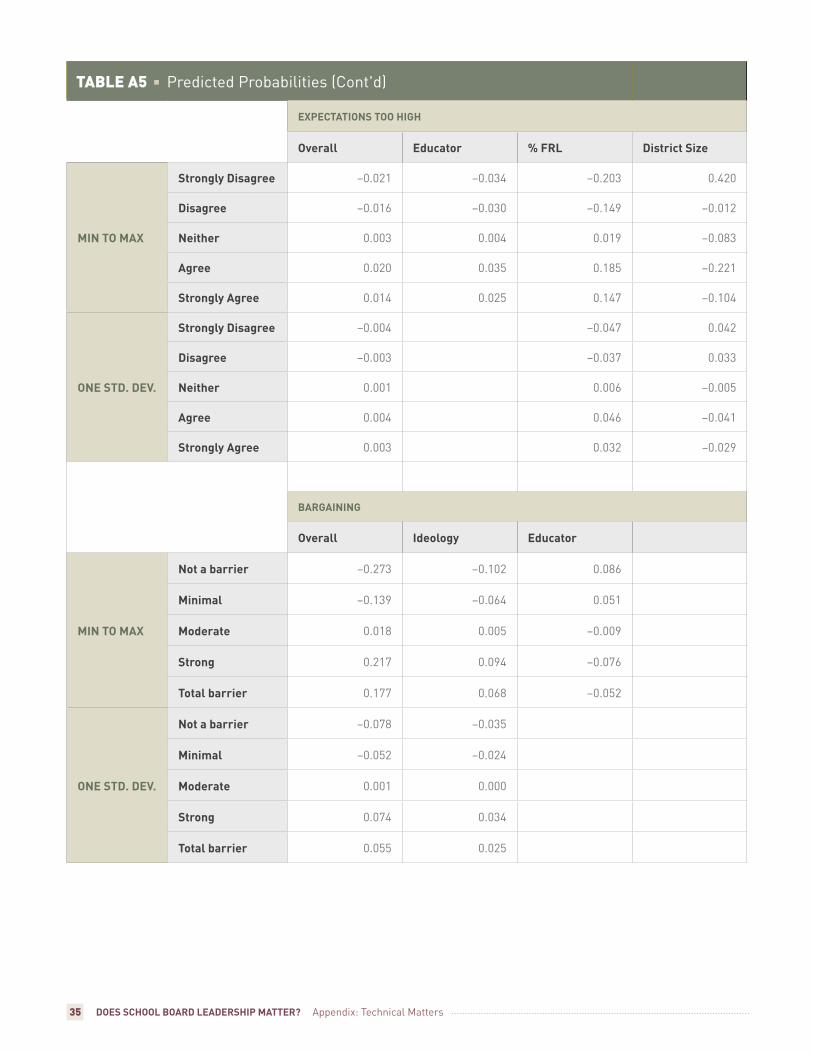
35 Does school BoarD leaDership Matter?
TablE a5 predicted probabilities (cont'd)
expectAtioNs too high
overall educator % frl District size
MiN to MAx
strongly Disagree −0.021 −0.034 −0.203 0.420
Disagree −0.016 −0.030 −0.149 −0.012
Neither 0.003 0.004 0.019 −0.083
Agree 0.020 0.035 0.185 −0.221
strongly Agree 0.014 0.025 0.147 −0.104
oNe stD. Dev.
strongly Disagree −0.004 −0.047 0.042
Disagree −0.003 −0.037 0.033
Neither 0.001 0.006 −0.005
Agree 0.004 0.046 −0.041
strongly Agree 0.003 0.032 −0.029
bArgAiNiNg
overall ideology educator
MiN to MAx
Not a barrier −0.273 −0.102 0.086
Minimal −0.139 −0.064 0.051
Moderate 0.018 0.005 −0.009
strong 0.217 0.094 −0.076
total barrier 0.177 0.068 −0.052
oNe stD. Dev.
Not a barrier −0.078 −0.035
Minimal −0.052 −0.024
Moderate 0.001 0.000
strong 0.074 0.034
total barrier 0.055 0.025
Appendix: Technical matters
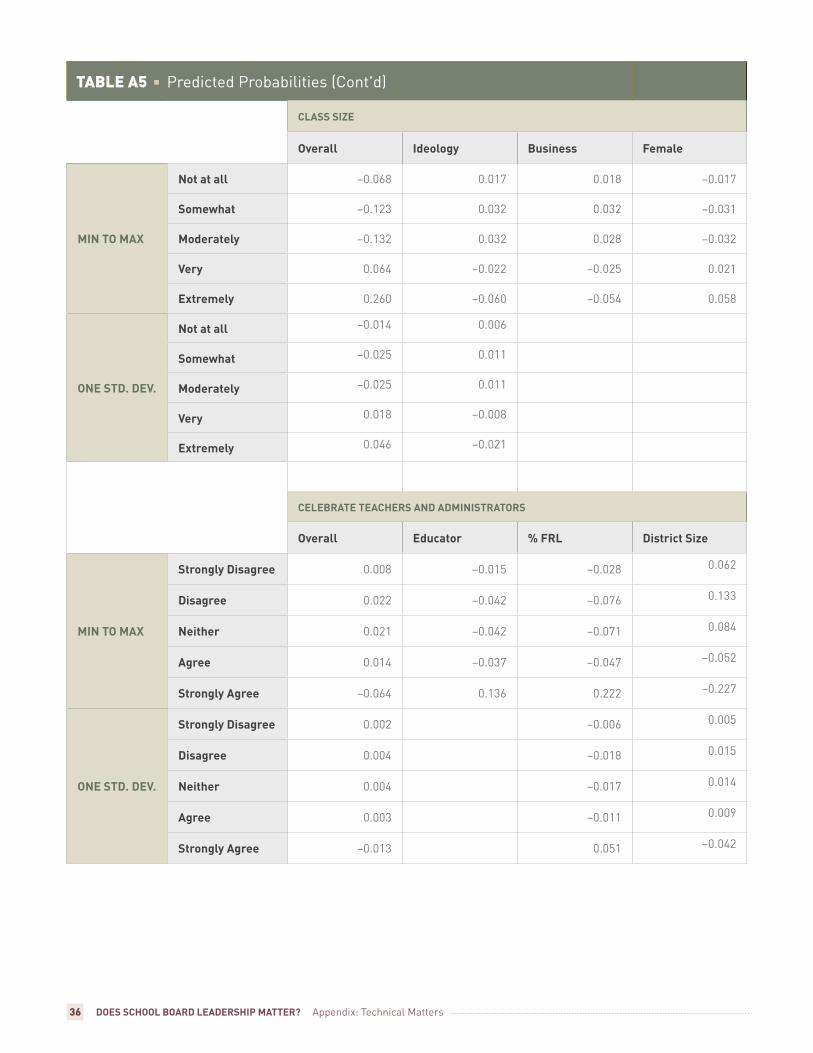
36 Does school BoarD leaDership Matter?
TablE a5 predicted probabilities (cont'd)
clAss siZe
overall ideology business female
MiN to MAx
Not at all −0.068 0.017 0.018 −0.017
somewhat −0.123 0.032 0.032 −0.031
Moderately −0.132 0.032 0.028 −0.032
very 0.064 −0.022 −0.025 0.021
extremely 0.260 −0.060 −0.054 0.058
oNe stD. Dev.
Not at all −0.014 0.006
somewhat −0.025 0.011
Moderately −0.025 0.011
very 0.018 −0.008
extremely 0.046 −0.021
celebrAte teAchers AND ADMiNistrAtors
overall educator % frl District size
MiN to MAx
strongly Disagree 0.008 −0.015 −0.028 0.062
Disagree 0.022 −0.042 −0.076 0.133
Neither 0.021 −0.042 −0.071 0.084
Agree 0.014 −0.037 −0.047 −0.052
strongly Agree −0.064 0.136 0.222 −0.227
oNe stD. Dev.
strongly Disagree 0.002 −0.006 0.005
Disagree 0.004 −0.018 0.015
Neither 0.004 −0.017 0.014
Agree 0.003 −0.011 0.009
strongly Agree −0.013 0.051 −0.042
Appendix: Technical matters
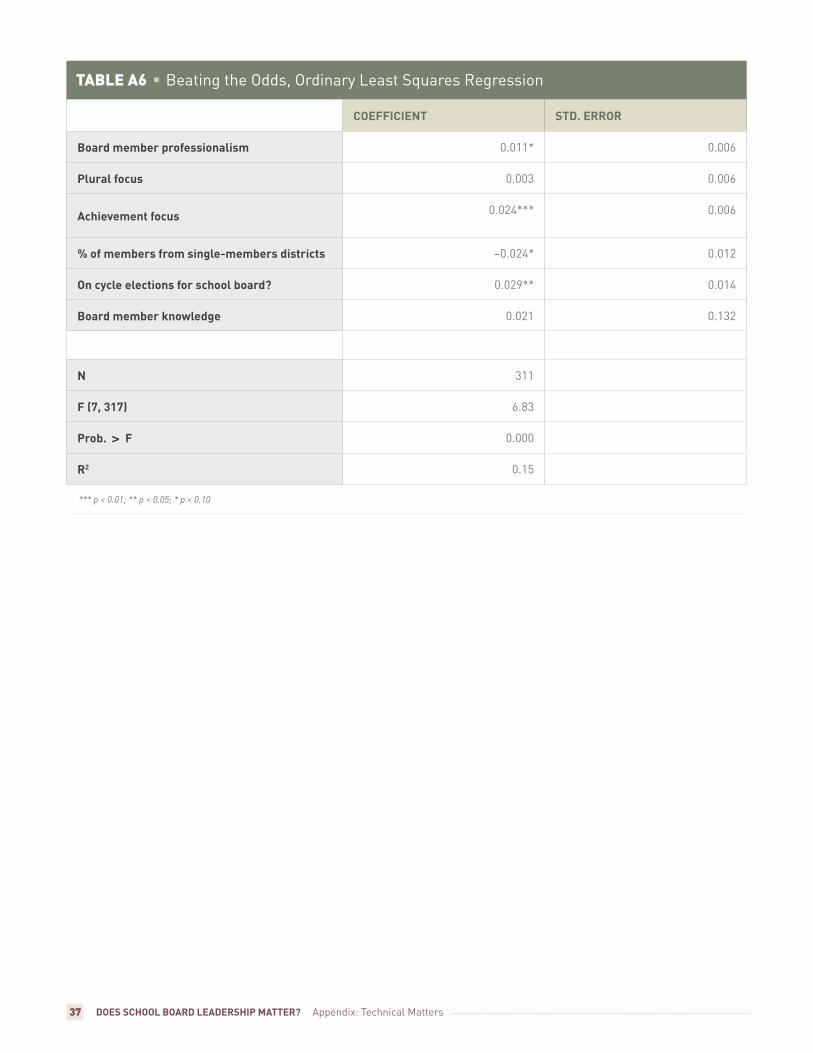
37 Does school BoarD leaDership Matter?
TablE a6 Beating the Odds, Ordinary least Squares regression
coefficieNt stD. error
board member professionalism 0.011* 0.006
plural focus 0.003 0.006
Achievement focus 0.024*** 0.006
% of members from single-members districts −0.024* 0.012
on cycle elections for school board? 0.029** 0.014
board member knowledge 0.021 0.132
N 311
f (7, 317) 6.83
prob. > f 0.000
r2 0.15
*** p < 0.01; ** p < 0.05; * p < 0.10
Appendix: Technical matters
38 Does school BoarD leaDership Matter? endnotes
endnotes1. Jacqueline Danzberger, “School Boards: A Troubled American Institution,” in Facing the Challenge: The
Report of The Twentieth Century Fund Task Force on School Governance (New York: Twentieth Century
Fund, 1992), 68.
2. Gene I. Maeroff, School Boards in America: A Flawed Exercise in Democracy (New York: Palgrave Macmillan,
2010).
3. Frederick M. Hess and Olivia Meeks, School Boards circa 2010: Governance in the Accountability Era,
National School Boards Association, 2010, http://www.nsba.org/Board-Leadership/Surveys/School-Boards-
Circa-2010/School-Boards-Circa-2010-Governance-in-the-Accountability-Era.pdf.
4. Chester E. Finn, Jr., “Reinventing Local Control,” Education Week (January 23, 1991): 32–40; Paul T. Hill,
School Boards: Focus on School Performance, Not Money and Patronage (Washington, D.C.: Progressive
Policy Institute, 2003); Maeroff, School Boards in America; Paul Manna and Patrick J. McGuinn, Education
Governance for the Twenty-First Century: Overcoming the Structural Barriers to School Reform (Washington,
D.C.: Brookings Institution, 2013); and Lisa Graham Keegan and Chester E. Finn, Jr., “Lost at Sea,”
Education Next 4, no. 3 (summer 2004): 15–17.
5. Hill, School Boards; Keegan and Finn, “Lost at Sea”; and Maeroff, School Boards in America.
6. William G. Howell, Besieged: School Boards and the Future of Education Politics (Washington, D.C.: Brookings
Institution, 2005); and Rebecca Jacobsen and Andrew Saultz, “The Polls—Trends: Who Should Control
Education?,” Public Opinion Quarterly 76, no. 2 (summer 2012): 379–90.
7. Abe Feuerstein, “Elections, Voting, and Democracy in Local School District Governance,” Educational Policy
16, no. 1 (2002): 15–36; and Jacobsen and Saultz, “The Polls.”
8. Noel Epstein (ed.), Who’s in Charge Here?: The Tangled Web of School Governance and Policy (Brookings
Institution Press and the Education Commission of the States, 2004).
9. Howell, Besieged, 15.
10. Deborah Land, Local School Boards under Review: Their Role and Effectiveness in Relation to Students’
Academic Achievement (Baltimore: Center for Research on the Education of Students Placed at Risk,
2002), 248–51.
11. Jason A. Grissom, “The Determinants of Conflict on Governing Boards in Public Organizations: The Case of
California School Boards,” Journal of Public Administration Research and Theory 20, no. 3 (2010): 601–27;
Frederick Hess and David L. Leal, “School House Politics: Expenditures, Interests, and Competition in
School Board Elections,” in William Howell (ed.), Besieged: School Boards and the Future of Education
Politics (Washington, D.C.: Brookings Institution, 2005); and Terry Moe, “The Union Label on the Ballot Box,”
Education Next 6, no. 3 (summer 2006): 40–45. This is partly because the surveys were conducted prior to
the explosion in publicly available student achievement data. Kenneth J. Meier and Laurence J. O’Toole,
Bureaucracy in a Democratic State: A Governance Perspective (Baltimore: Johns Hopkins University Press,
2006), look carefully at statistical links between board members’ ethnicity and same-ethnicity student
performance but still only infer what such board members actually do; our work probes the link between
board member attitudes and actions (rather than member demographics alone) and student achievement.
39 Does school BoarD leaDership Matter? endnotes
12. Arnold F. Shober, Teacher Quality 2.0: From Teacher Education to Student Progress (Washington, D.C.:
American Enterprise Institute, 2012). Meier and O’Toole, Bureaucracy in a Democratic State, also have
valuable insights on the limitations of boards to effect classroom- or student-level change.
13. Spillane and Thompson, “Reconstructing Conceptions of Local Capacity”; Robert D. Herman and David O.
Renz, “Advancing Nonprofit Organizational Effectiveness: Research and Theory,” Nonprofit Management and
Leadership 18, no. 4 (summer 2008): 399–415; and William A. Brown, “Board Development Practices and
Competent Board Members: Implications for Performance,” Nonprofit Management and Leadership 17, no. 3
(spring 2007): 301–17.
14. Ibid
15. Land, Local School Boards under Review; and Michael S. Knapp, Michael A. Copland, and Juli A. Swinnerton,
“Understanding the Promise and Dynamics of Data-Informed Leadership,” in P. A. Moss (ed.), Evidence and
Decision Making (Malden, MA: Blackwell, 2007), 74–104.
16. Lila N. Carol et al., School Boards: Strengthening Grass Roots Leadership (Washington, D.C.: Institute for
Educational Leadership, 1986); and Laurence Iannaccone and Frank W. Lutz, “The Crucible of Democracy:
The Local Arena,” Politics of Education Association Yearbook 9 (1994): 39–52.
17. Michael B. Berkman and Eric Plutzer, Ten Thousand Democracies: Politics and Public Opinion in America’s
School Districts (Washington, D.C.: Georgetown University Press, 2005); and R. Holcombe and L. Kenny,
“Evidence on Voter Preferences from Unrestricted Choice Referendums,” Public Choice 127, no. 1 (2007):
197–215.
18. William A. Firestone, “Culture and Process in Effective School Districts,” in Wayne K. Hoy and Michael
DiPaola (eds.), Studies in School Improvement (Charlotte, N.C.: Information Age Press, 2009), 177–204;
Abe Feuerstein and Jonathan A. Dietrich, “State Standards in the Local Context: A Survey of School Board
Members and Superintendents,” Educational Policy 17, no. 2 (May 2003): 237–56; and Thomas E. Glass,
Lars Bjork, and Cryss Brunner, The Study of the American School Superintendency 2000: A Look at the
Superintendent in the New Millennium (Arlington, VA: American Association of School Administrators, 2000).
19. Shober, Teacher Quality 2.0.
20. We recognize that more time spent per week on board business may not be associated with effectiveness. More
hours could mean more time micromanaging district leaders and engaging in petty politics, or more time
reviewing unwieldy materials and participating in protracted board meetings. Likewise, training contributes
to capacity only if the training is of high quality. Time spent on board business and in training may not lead to
board member effectiveness; but for the purposes of this analysis, we take training, time, and pay as markers
of capacity because the literature on leadership defines them as such. Then we test whether these concepts
actually relate to district performance.
21. Peverill Squire, “Measuring Legislative Professionalism: The Squire Index Revisited,” State Politics and Policy
Quarterly 7 (2007): 211–27; and John M. Carey, Richard G. Niemi, and Lynda W. Powell, “Incumbency and the
Probability of Reelection in State Legislative Elections,” Journal of Politics 62, no. 3 (2000): 671–700.
22. Jason A. Grissom and James R. Harrington, “Local Legislative Professionalism,” American Politics Research
41, no. 1 (2013): 76–98. Hess and Leal (“School House Politics”) define “professionalism,” similar to our use of
“work practices” here, by whether members receive a salary, the length of their term, and the number of hours
they spend on the job.
40 Does school BoarD leaDership Matter? endnotes
23. Richard H. Goodman, Luann Fulbright, and William G. Zimmerman, Getting There from Here: School Board–
Superintendent Collaboration: Creating a School Governance Team Capable of Raising Student Achievement
(Arlington, VA: Educational Research Service, and New England School Development Council, 1997), and
Iowa Association of School Boards, “The Lighthouse Inquiry: School Board/Superintendent Team Behaviors
in School Districts with Extreme Differences in Student Achievement” (paper presented at the American
Educational Research Association, April 10–14, 2001), examined capacity and academics, but both analyses
surveyed a mere sixteen school districts. J. Timothy Waters and Robert J. Marzano, School District Leadership
That Works: The Effect of Superintendent Leadership on Student Achievement (Denver: Mid-Continent
Research for Education and Learning, 2006), list no published research reports on the link between school
boards and academic performance and just three linking superintendent characteristics to performance in the
past forty years. William J. Ritchie and Robert W. Kolodinsky, “Nonprofit Organization Financial Performance
Measurement: An Evaluation of New and Existing Financial Performance Measures,” Nonprofit Management
and Leadership 13, no. 4 (summer 2003): 367–81.
24. Robert D. Herman and David O. Renz, “Doing Things Right: Effectiveness in Local Nonprofit Organizations, A
Panel Study.” Public Administration Review 64, no. 6 (November/December 2004): 694–705.
25. Brown, “Board Development Practices and Competent Board Members”; and idem, “Exploring the Association
between Board and Organizational Performance in Nonprofit Organizations,” Nonprofit Management and
Leadership 15, no. 3 (spring 2005): 301–17.
26. Richard R. Lau and David P. Redlawsk, How Voters Decide: Information Processing during Election
Campaigns (New York: Cambridge University Press, 2006). Barry C. Burden, Personal Roots of Representation
(Princeton, N.J.: Princeton University Press, 2007), notes: “The very same values, experiences, and interests
that shape congressional members as individuals and guide their own life choices similarly shape their
policymaking decisions.” We suspect that this is even more salient for school board members than for highly
visible and professional politicians who serve in the U.S. Congress. Meredith Mountford, “Motives and
Power of School Board Members: Implications for School Board–Superintendent Relationships,” Educational
Administration Quarterly 40. no. 5 (2004): 704–41.
27. Epstein, Who’s in Charge Here?.
28. For example, Carol et al., School Boards; Jacqueline P. Danzberger, “Governing the Nation’s Schools,” Phi
Delta Kappan 75, no. 5 (1994): 367–73; Michael W. Kirst, “A Changing Context Means School Board Reform,”
Phi Delta Kappan 75, no. 5 (1994): 378–81; and Frederick M. Wirt and Michael W. Kirst, The Political
Dynamics of American Education (Berkeley, CA: McCutchan, 1997).
29. The data used in this report were gleaned from raw survey data files. We omitted districts that the National
Center for Education Statistics reported were closed, education units that did not oversee schools directly,
and Hawaii because of its unique status as a single-district state. Hess and Meeks, School Boards circa 2010,
provide a detailed overview and descriptive analysis of the survey. Note that the sample size used in this
report varies by question, as not all respondents answered all questions.
30. Most, but not all, data are from 2008 and 2009. The exact dates for data sources appear in the Appendix. We use
the most current data available at the time of writing. The efficiency index is drawn from academic data that
were current a year before the survey; while that prevents us from testing causality, academic performance in a
district tends to correlate highly from year to year, and most board members serve for several years.
41 Does school BoarD leaDership Matter? endnotes
31. Unfortunately, we are unable to draw conclusions about the effect of election versus appointment due to the
lack of variance on this item. Nevertheless, the statistic is representative of the universe of school districts.
Note that we do no know the percentage of school board members who ran unopposed.
32. These data come from the U.S. Census Bureau’s Survey of Local Governments, which, unfortunately,
discontinued its Survey of Popularly Elected Officials in 1992. District governance tends to change slowly; it is
unlikely that, even over the past fifteen years, any significant number of districts in the sample that were at
large in 1992 have since adopted single-member districts. Note also that these data capture the percentage of
a respondents’ entire board (both the respondent and her colleagues) elected in at large versus ward elections.
For practical purposes, however, these percentages most likely match each respondent’s method of election
since 93 percent of sampled board members come from districts that elect all of their members using at large
or ward. Only 7 percent of districts use a mix. Unfortunately, the NSBA survey did not ask each individual
board member whether they have an at-large or ward position.
33. William G. Howell and Martin West, “Is the Price Right? Probing Americans’ Understanding of Education
Spending,” Education Next 8, no. 3 (2008): 36–41.
34. We realize that a handful of school boards have little control over their budget because it is set by a separate
city or county board. Board members in those districts might be responding to structural rather than fiscal
conditions. We test for this possibility and find no significant difference in members’ knowledge of fiscal
conditions.
35. Recall that these estimates, like all the estimates reported in the study, control for each board member’s
self-reported political ideology. This is an especially important control variable in judging a board member’s
accurate knowledge of collective bargaining, given that a member’s ideology is likely related to his or her
feelings about organized labor and unions more generally.
36. The Obama administration’s 2009 stimulus bill and its 2012 NCLB waivers have only redoubled the federal
government’s efforts to boost standards, assessment, and accountability. For example, see U.S. Department of
Education, “Race to the Top Scoring Rubric, Corrected.” (January 2012), www2.ed.gov/programs/racetothetop/
scoringrubric.pdf.
37. The composite scales measuring a member’s academic focus hang together with a Cronbach’s alpha score of
0.58; for plural focus, 0.62.
38. Jason Grissom and James R. Harrington, “Local Legislative Professionalism,” American Politics Research 41,
no. 1 (2013): 76–98. As noted earlier, we recognize that effective board members may not always spend more
time per week on board business than others. More hours could mean more time spent on leadership, or on
micro- or mismanaging the district. See endnote 20.
39. The composite scales measuring board members’ work practices hang together with a Cronbach’s alpha score
of 0.55. Robert Jay Dilger, George A. Krause, and Randolph R. Moffett, “State Legislative Professionalism and
Gubernatorial Effectiveness, 1978–1991,” Legislative Studies Quarterly 20, no. 4 (November 1995): 553–71.
40. Full summary statistics are available in the original survey report.
41. Later in this report, we combine these various measures into a single professionalism “score” for each school
district in our sample to see whether districts with more professionalized boards post higher academic
achievement. See Table A3 for details.
42. Squire, “Measuring Legislative Professionalism.”
42 Does school BoarD leaDership Matter? endnotes
43. In contrast, even among state legislatures that are “part-time,” a 2008 National Council of State Legislatures
(NCSL) survey pegged the average salary of a part-time state lawmaker at $15,984.
44. Comparatively, the National League of Cities reports that the number of hours that city council members
report working each month ranges from ten to twenty eight-hour days (depending on city size).
45. In this section, variables for board members are the means for all school board member responses in each
district.
46. We use an average of member knowledge of district conditions for each of the policy areas from the previous
section for simplicity’s sake. However, an analysis of each area separately (school finance, teacher pay,
collective bargaining, class size, and academic standards) yields no statistical or substantive differences—
board member knowledge, of any kind, is not related to beating the odds.
47. Per our measure, these are normalized rates, so districts in states with lower proficiency standards would
correlate with larger differences, and districts in states with higher proficiency standards would correlate
with smaller differences. The percentage is a conversion from the z-score value.
48. We do not examine the relationship between work practices and board member attributes, since this component
of capacity is an institutional measure. It would make little sense to try to explain district-level factors such as
salary and training by examining differences in the personal characteristics of each board member.
49. Political ideology is not the same as partisanship. The survey did not ask if board members were members of
a particular political party.
50. Unfortunately, the survey does not provide more information about “business experience” across the sample in
a uniform way.
51. Note that our sample is smaller for this analysis because teacher pay data were not available for all districts.
52. Unfortunately, the survey does not allow us to be more specific with respect to board member occupation.
53. At-large seats are elected or appointed to represent the entire school district, and ward-based seats are
elected or appointed to represent some geographic subset of the school district.
54. Carol et al., School Boards; Danzberger, “Governing the Nation’s Schools”; Kirst, “A Changing Context Means
School Board Reform”; and Christopher Berry and William Howell, “Accountability and Local Elections:
Rethinking Retrospective Voting.” Journal of Politics 69, no. 3 (2007): 844–58.
55. Epstein, Who’s in Charge Here?; and Sarah F. Anzia, “Election Timing and the Electoral Influence of Interest
Groups,” Journal of Politics 73, no. 2 (2011): 412–27, and “The Election Timing Effect: Evidence from a Policy
Intervention in Texas,” Quarterly Journal of Political Science 7, no. 3 (2012): 209–48.
56. Some boards are “mixed,” in that voters may elect at-large as well as ward-based members.
57. Anzia, “Election Timing and the Electoral Influence of Interest Groups”; and Terry Moe, “Political Control and
the Power of the Agent,” Journal of Law, Economics, and Organization 22, no. 1 (2006): 1–29.
58. Meier and O’Toole, Bureaucracy in a Democratic State.
59. Lori L. Taylor and William J. Fowler, Jr., A Comparable Wage Approach to Geographic Cost Adjustment, NCES
Report 2006-321 (Washington, D.C.: National Center for Education Statistics, 2006).