Embed Size (px)
Citation preview
DI
SC
US
SI
ON
P
AP
ER
S
ER
IE
S
Forschungsinstitut zur Zukunft der ArbeitInstitute for the Study of Labor
Does Relative Grading Help Male Students?Evidence from a Field Experiment in the Classroom
IZA DP No. 8429
August 2014
Eszter CziborSander OnderstalRandolph SloofMirjam van Praag

Does Relative Grading Help Male Students? Evidence from a Field Experiment
in the Classroom
Eszter Czibor University of Amsterdam
Sander Onderstal
University of Amsterdam
Randolph Sloof University of Amsterdam
Mirjam van Praag
University of Amsterdam, Copenhagen Business School and IZA
Discussion Paper No. 8429 August 2014
IZA
P.O. Box 7240 53072 Bonn
Germany
Phone: +49-228-3894-0 Fax: +49-228-3894-180
E-mail: [email protected]
Any opinions expressed here are those of the author(s) and not those of IZA. Research published in this series may include views on policy, but the institute itself takes no institutional policy positions. The IZA research network is committed to the IZA Guiding Principles of Research Integrity. The Institute for the Study of Labor (IZA) in Bonn is a local and virtual international research center and a place of communication between science, politics and business. IZA is an independent nonprofit organization supported by Deutsche Post Foundation. The center is associated with the University of Bonn and offers a stimulating research environment through its international network, workshops and conferences, data service, project support, research visits and doctoral program. IZA engages in (i) original and internationally competitive research in all fields of labor economics, (ii) development of policy concepts, and (iii) dissemination of research results and concepts to the interested public. IZA Discussion Papers often represent preliminary work and are circulated to encourage discussion. Citation of such a paper should account for its provisional character. A revised version may be available directly from the author.
IZA Discussion Paper No. 8429 August 2014
ABSTRACT
Does Relative Grading Help Male Students? Evidence from a Field Experiment in the Classroom*
The provision of non-pecuniary incentives in education is a topic that has received much scholarly attention lately. Our paper contributes to this discussion by investigating the effectiveness of grade incentives in increasing student performance. We perform a direct comparison of the two most commonly used grading practices: the absolute (i.e., criterion-referenced) and the relative (i.e., norm-referenced) grading schemes in a large-scale field experiment at a university. We hypothesize that relative grading, by creating a rank-order tournament in the classroom, provides stronger incentives for male students than absolute grading. In the full sample, we find weak support for our hypothesis. Among the more motivated students we find evidence that men indeed score significantly higher on the test when graded on a curve. Female students, irrespective of their motivation, do not increase their scores under relative grading. Since women slightly outperform men under absolute grading, grading on a curve actually narrows the gender gap in performance. JEL Classification: I21, I23, A22, D03, C93 Keywords: education, test performance, grade incentives, competition, gender,
field experiment Corresponding author: Mirjam van Praag Department of Innovation and Organizational Economics (INO) Copenhagen Business School (CBS) Office 3.70; Kilevej 14a 2000 Frederiksberg Denmark E-mail: [email protected]
* We are grateful to Examination Board of the Faculty of Economics and Business at the University of Amsterdam for authorizing the field experiment, and the Research Priority Area Behavioral Economics of the University of Amsterdam for the generous financial support they provided. We would like to thank Alexander Cappelen, Uri Gneezy, John List, Hessel Oosterbeek, Erik Plug, Andrew Schotter, Bertil Tungodden and Lise Vesterlund for their invaluable advice and inspiration, Sanne Blauw, Thomas Buser, Adam Eric Greenberg, Laura Rosendahl Huber and Dana Sisak for their helpful comments and insights, and Inge Beks for excellent research assistance.

1 Introduction
Over the last decades, boys have started to lag behind girls at all levels of education in the
developed world. A recent OECD report states: “Compared to girls, boys have become more
likely to underperform in secondary education and less likely to complete higher education
degrees” (Salvi del Pero & Bytchkova, 2013, p. 7).1 Some governments, worrying about the
poor outcomes of boys, have considered specific policies aimed at improving male educational
performance (The Economist, 1999). The increasing gender gap has also triggered the attention
of popular academic book authors sometimes referred to as belonging to the “boys’ movement,”
producing best-selling titles like ‘Boys Adrift’ (Sax, 2007) and ‘The End of Men’ (Rosin, 2012).
A variety of reasons have been put forward to explain the educational underachievement of
young men, ranging from biological differences in learning styles between the sexes to allegedly
“feminine” educational practices favoring girls. From an economist’s point of view it is natural
to consider another potential explanation: it is possible that grade incentives offered by the
educational system do not provide sufficient motivation for boys to do well.
The majority of grading practices that are in use worldwide can be classified into two
schemes: absolute and relative grading. Under absolute grading, grades depend solely on stu-
dents’ own individual test outcomes, independent of the performance of their classmates on the
same test. This scheme is also known as “criterion-referenced grading,” because the student’s
score is compared to an objective criterion. Under relative grading, students’ grades depend on
their positions in the score distribution of the class. The scheme is also known as “grading on
a curve,” referring to the bell-shaped curve of the normal distribution. In the United States,
colleges typically implement relative grading,2 while in continental Europe the absolute scheme
prevails (Karran, 2004).
A key difference between the two grading schemes is that relative grading induces direct com-
petition between peers. In the lingo of organizational economics, absolute grading is analogous
to a piece rate compensation scheme, while relative grading creates a rank-order tournament
in the classroom. Such rank-order tournaments are advocated by theorists as optimal labor
contracts inducing efficient effort provision (Lazear & Rosen, 1981). Evidence from laboratory
experiments, however, shows a heterogeneous response to competition: typically, tournament
incentives increase the output of male subjects, but does not affect female performance in a
mixed-sex environment (Gneezy et al. , 2003).
Based on the empirical stylized fact of gender differences in response to tournaments we hy-
pothesize that grading on a curve, by offering competitive incentives, provides more motivation
and leads to higher performance for male students than absolute grading. We expect no such
difference for female students. This paper provides a test for the above hypothesis by means of
1Observing time trends, the 2013 Education at a Glance report notes a particularly strong growth in tertiarygraduation rates for women in several OECD countries between 2005 and 2011, while the increase is much smallerfor men (OECD, 2013). Moreover, Guiso et al. (2008) find that in more gender-equal cultures, there is no gendergap in math performance among 15-year-olds, while girls largely outperform boys in reading.
2As an example, consider the 2005 overview of law school grading curves by Andy Mroch for the Associationof American Law Schools: http://www.aals.org/deansmemos/Attachment05-14.pdf
1

a field experiment. We empirically compare absolute versus relative grading in the naturalistic
setting of a Bachelor course with a large number of participants at the University of Amster-
dam. Students in our experiment are randomly divided into two treatment groups. All students
have to take the same midterm exam, but the grading of this exam differs by treatment: in one
group the midterm test is graded on a curve, in the other group on an absolute scale. (The
grading schemes are reversed for the end-of-term exam.) Based on various measures capturing
effort provision in preparation for and performance in the midterm exam, we provide a direct
empirical comparison of the two grading schemes.
For the full sample of participating students we obtain weak support for the hypothesis
that relative grading induces higher male performance while not affecting the achievement of
female students. As expected, women slightly outperform men under the absolute scheme while
the gender gap shrinks under the relative scheme. However, these differences are small in size
and are only statistically significant when correcting for demographic, ability, and preference
variables. We further observe that the two grading schemes do not differ considerably in terms
of the study effort and exam preparation time they induce.
Obviously, in order for students to be responsive to the (differences in) grade incentives,
they should be interested in the level of their grades in the first place. If students are mainly
interested in passing the course with minimal effort provision and do not attach importance to
their grade per se, the incentive effect of grading on a curve is likely to be limited. In policy
reports and the popular press, Dutch pupils and students are often accused of having a ‘just pass’
attitude (“zesjescultuur”).3 Indeed, international comparisons of primary school pupils reveal
that although almost all Dutch pupils fulfill the minimum requirements, only few excel and meet
truly advanced benchmarks (Jaspers, 2012). The phenomenon is not constrained to primary
schools: Dutch university students are found to provide insufficient study effort (Leuven et al.
, 2010), leading to high fail rates and long study durations.4 Thus, the response of students in
our sample to the grade incentives may thus very well be limited to the group of students that
attaches importance to grades. To take this potential heterogeneity into account, we also test
our hypothesis among the more responsive subsample of students following the English-language
(“international”) program. We provide evidence of this subgroup being more motivated and
high-achieving. We find that international male students score significantly higher when graded
on a curve. Female students, whether in the Dutch or the international program, do not respond
to relative grading.
To our knowledge, this paper is the first to provide an experimental comparison of absolute
grading and grading on a curve in a naturalistic, high-stakes environment.5 Our field experiment
3A recent newspaper article (in Dutch) covering the 2012/13 edition of ‘The state of education’ (‘De staatvan het onderwijs’ ) report claims already in its title that Dutch pupils are undermotivated. The lead re-searcher of the report is quoted to say that pupils are satisfied with getting a 6, i.e. the lowest passing grade:http://www.nrc.nl/nieuws/2014/04/16/rapport-nederlandse-leerlingen-zijn-niet-gemotiveerd/.
4From the cohort of students who entered higher education in 2007, less than a third received their Bachelordegree after four years, the nominal duration of the program. Five years after the start, the share of those whosuccessfully graduated was still less than half (Inspectie van het Onderwijs, 2014).
5A few papers, discussed in detailed in the Literature section, analyze field experiments with competitivegrading in the form of comparison to a randomly chosen opponent or rewarding only the top performers. Webelieve using an actual grading curve makes our setting more realistic and reproduces better the incentives ofrank-order tournaments observed in classrooms in practice.
2

includes a large sample of university students for whom we collect a rich set of control variables
(including preferences as well as course-specific and general ability). We also observe different
measures for the preparation behavior of students, so we can test whether grade incentives affect
how much students study for the exam.
The remainder of this paper is organized as follows. In section 2, we shortly review the
related literature. Section 3 contains the details of our experimental design. In section 4, we
provide an overview of our data and some summary statistics. Section 5 presents our results.
Section 6 contains a further discussion of the results. We conclude in section 7.
2 Literature
The advantageous and disadvantageous incentive effects of competitive reward schemes have
been studied extensively. Early theoretical contributions by Lazear & Rosen (1981) and Green
& Stokey (1983) develop the argument that tournament-style incentives may outperform piece
rates because under relative performance evaluation “common shocks” are filtered out (see also
Holmstrom (1982)). Effort incentives can thus be provided with lower risk exposure (i.e. more
cheaply). Empirical studies on the incentive effect of competition typically find evidence in line
with tournament theory, although the variance in effort levels is much higher than under piece
rate incentives (cf. Bull et al. (1987); van Dijk et al. (2001); Harbring & Irlenbusch (2003)).
Muller & Schotter (2010) provide an experimental test of the predictions of Moldovanu & Sela
(2001) who derive optimal allocations of prizes with risk-neutral agents of heterogeneous ability.
Their empirical results show that low-ability workers “drop out” of the tournament by exerting
little or no effort whereas high-ability workers put in more effort than predicted by the model.
Response to tournament incentives is found to be heterogeneous not only with respect to
ability but also to gender. The gender gap in competitiveness was first documented by Gneezy
et al. (2003) who found that male participants solve significantly more mazes under a com-
petitive reward scheme than under piece rate, while no such increase is observed for female
subjects in a mixed-sex environment. Their result has been replicated using both laboratory
(e.g. Gunther et al. (2010)) and field experiments (e.g., Gneezy & Rustichini (2004)) as well
as naturally occurring data (e.g., Price (2008)). Niederle & Vesterlund (2011) and Croson &
Gneezy (2009) provide detailed reviews of studies on gender and competition.
A number of theoretical studies compare relative and absolute grading. Becker & Rosen
(1992) and Landeras (2009) bring the tournament model to the classroom and show that with
an appropriate reward scheme, grading on a curve can induce a higher performance than ab-
solute grading in the presence of “systemic” noise or correlated individual error terms. Dubey
& Geanakoplos (2010) also compare the two grading schemes and find that absolute grading
provides better incentives for students to work, provided student outcomes are independent.
Paredes (2012) predicts that the response to grading systems differs by ability: in her model,
where students only care about passing the exam, low-ability students exert less and high-ability
students exert more effort under absolute than under relative grading. She finds empirical sup-
port for these predictions by analyzing quasi-experimental data from a Chilean university where
3

they switched from absolute to relative grading in some first-year courses. Comparing student
outcomes before and after the change, her identification strategy relies on an (untestable) com-
mon trends assumption.
A number of recent empirical studies also focus on the effect of competition in education and
obtain gender differences in line with our results. Jurajda & Munich (2011) find that male and
female students of the same ability were equally likely to be admitted to universities in the case
of little competition, but men were significantly more likely to be accepted when competition
was high. Ors et al. (2013) observe that females outperformed men in a “noncompetitive”
national exam while in the same cohort men outperformed women at the very competitive
HEC admission exam later on. Morin (forthcoming) studies the effect of intensified competition
resulting from a legislative change that created a “double cohort” in Ontario and observes that
men’s relative performance increases in response. Bigoni et al. (2011) find that competition
induces higher effort among male but not among female students in the case of relatively low-
stakes homework assignments. Jalava et al. (2014) examine various non-financial incentive
schemes for primary school children in low-stakes tests and conclude that boys only increase
performance when faced with relative grading. In contrast, De Paola et al. (2013) do not
find gender differences in terms of entry into a tournament or performance under competition
in a setting where university students self-selected into a competitive scheme in a midterm
exam to obtain bonus points. Azmat & Iriberri (2010) analyze the effect of providing relative
performance information to students in a setting where grades are still solely dependent on
absolute performance, and find that the feedback has a strong and positive impact on the
performance of both girls and boys.
Our paper contributes to the empirical literature on competitive grade incentives by ex-
perimentally comparing absolute and relative grading using a design with several advantages.
Uniquely, relative grading in our setting involves an actual grading curve where a student’s
exam grade is determined by his or her place in the class score distribution, mimicking real-life
grading practices. The experiment is conducted in a naturalistic setting among students attend-
ing a university course (“in the classroom”). The number of participants is high, and students
are randomly assigned to treatments (no self-selection). Exams are high-stakes and there is no
subjectivity in their evaluation. Administrative data on student characteristics are available,
as well as measures of preferences from an incentivized survey. The study effort of students is
also observed, allowing us to test whether any change in exam performance is attributable to
differences in preparation under the two schemes.
4

3 Context and design
3.1 Context
We conducted a framed field experiment (Harrison & List, 2004) among students of the Univer-
sity of Amsterdam (UvA), authorized by the Examination Board of the Faculty of Economics
and Business at the University of Amsterdam. The experiment took place in the 2nd year BSc
course Economics of Markets and Organizations (EMO) during the first block of the 2013/2014
academic year.6 The course covered topics from Organizational Economics and Industrial Or-
ganizations in a simple game-theoretic framework, based on lectures notes now published as
“Economics of Organizations and Markets” (Onderstal, 2014). Over 500 students enrolled in
the course and thus participated in our experiment. The large sample size is desirable not only
because it allows us to detect potentially small effect sizes but also because it made it nearly
impossible for students in the relative grading group to collude against the experimenters by
collectively providing low effort.7 The attrition rate was relatively low since the class was
compulsory for the majority of the enrolled students. The course grade was the unweighted
average of grades from a midterm and an end-of-term exam. The two exams covered roughly
the same amount of study material and were designed to be of comparable difficulty. In the ex-
ams, students had 90 minutes to answer 30 multiple-choice questions (calculations, theory, and
literature-related). Both exams were corrected by machines, thus grading was by construction
unbiased. In addition, students could earn a bonus point on top of their exam grade by hand-
ing in homework assignments in teams of three or four people. During study weeks, students
could participate in a lecture (focusing mostly on theory) and a tutorial (discussing exercises,
homework solutions and mock exam questions). Class attendance was voluntary.
The course was offered with identical content in both Dutch and English, the latter for
students following the English-language Bachelor program (in the following referred to as the
“international program”). The majority of students in the international program are foreigners
(typically from Central-Eastern Europe, China, and Germany), but the program is also open
to aspiring Dutch students. While there are no entry requirements for attending the Dutch
program (all applicants who complete the pre-university track in secondary education and pass
the standardized national school-leaving exam are admitted to the study), students have to
qualify for the international program by taking an English proficiency test and a mathematics
entrance test. About one in four applicants is admitted to the English-language Bachelor
program. Participants in the two programs thus differ in their ability and arguably also in their
level of motivation. For foreign students in the international program, tuition fees and living
expenses in Amsterdam often represent a comparatively much larger investment in education
than for their Dutch peers, likely increasing the importance they attach to performing well
in their studies. Dutch students choosing to comply with the selective entry criteria for the
6At the UvA, the academic year is divided into six blocks. The first block runs over eight weeks in Septemberand October.
7Budryk (2013) reports a case where students successfully boycotted curved grading, using various socialmedia tools to arrange the collusion.
5

international program and to follow courses in English instead of their mother tongue also
signal dedication and higher levels of aspiration. Students in the Dutch program, on the other
hand, are not sufficiently motivated (Leuven et al. , 2010). Their attitude can be described
by the “zesjescultuur,” discussed in the Introduction: instead of striving for excellence, the
majority of them merely aim to pass their courses with minimal effort provision. We provide
further evidence of this phenomenon in section 5.2.2.
3.2 Design of the experiment
This section contains the details of the experimental design. Participants were randomly as-
signed to one of the two treatment conditions (communicated to students as the “yellow group”
and the “blue group” in order to maintain a neutral framing). All students, regardless of this
assignment, sat the same midterm and end-of-term exams at the same time and in the same
venue. As mentioned earlier, both exams counted with equal weight towards the final course
grade and thus represented high stakes for the students. The difference between the groups
lay in the grading schemes used in translating exam scores into exam grades: students in one
group were graded under a relative scheme in the midterm and an absolute scheme in the
end-of-term exam while the schemes were reversed in the other group, as shown in Table 1.
This design allows for a clean comparison of the effect of the two grading schemes on midterm
exam performance while maintaining an ex ante fair and equal treatment of students in the two
groups.8
We performed a stratified randomization along the dimensions we suspected would influence
the response to the grading schemes, i.e., gender, study program, and mathematics ability (this
information, together with other demographic variables, was available to us prior to the start of
the classes). The course has been taught for several years with only small changes in the content,
thus the grade distributions of previous years could be taken into account when constructing
the curve for relative grading.
The timeline of the experiment is shown in Table 2. Students were informed of their treat-
ment group assignment by e-mail and also by posts on the course intranet page containing
all study materials and course-related information. Detailed instructions regarding the grad-
ing schemes were included in the Course Manual (see Appendix A) and were also announced
during the lectures and tutorials. During the first week, preference and ablity information
was collected from students in an online survey (discussed in more detail in section 3.3). For
homework assignments, students were required to form teams within their treatment group (in
order to reduce potential spillovers), which also increased students awareness of the treatment
assignment. Homework results were not published until week 5, so students did not receive
any feedback on their relative performance until the midterm exam. Right before the midterm
exam, students were required to fill out a short questionnaire testing their understanding of the
8Our identification relies on the assumption that students only took into account the midterm grading schemewhen preparing for and taking the midterm exam, thus their midterm effort choice and performance was unaffectedby the grading scheme they were going to face later in the end-of-term test. We revisit this assumption in moredetail in section 6.
6

grading schemes and collecting information on time spent on the course.
Our main variable of interest is the score (i.e., the number of correct answers) on the midterm
exam. Using a between-subject design, we compare the midterm scores of students in the ab-
solute and relative grading groups. Besides the midterm exam scores, in our analysis we also
consider the effect of relative grading on a number of proxies for effort provision in preparation
for the exam. These proxies are: lecture and tutorial attendance during the study weeks (col-
lected by an assistant and by the tutors), handing in homework assignments, grades of homework
assignments, and self-reported study time (collected in the aforementioned questionnaire).
3.3 Incentivized survey
We conducted an online survey to collect from students preference, confidence, and ability
measures that might influence their response to the two grading schemes (see e.g., Niederle &
Vesterlund (2007) or Gneezy et al. (2003)). We included the survey in the compulsory course
requirements, which ensured a very high response rate (92%). The survey was incentivized: five
respondents were randomly chosen at the end of the course and were paid according to their
performance and their choices in the survey (average earning was e215.67, with a minimum
of e100 and a maximum of e457). Respondents spent 21 minutes on average completing the
survey which was designed and pre-tested to take about 15-20 minutes, suggesting the majority
of students took the task seriously and did not answer at random. The survey was programmed
using the software Qualtrics.
The survey was framed as assessing familiarity with the prerequisites for the course, and
contained a timed multiple-choice quiz with 10 questions related to first-year mathematics and
microeconomics courses (e.g., simple derivations, perfect competition, Nash-equilibria, etc.).9
Performance on the quiz serves as an ability measure in our analysis. Before solving the quiz,
students were required to choose the reward scheme applied to their quiz performance by re-
porting their switching point between a constant piece rate and a tournament scheme with an
increasing prize. We developed this measure to serve as a proxy for competitive preferences.
Moreover, we collected four different measures of overconfidence10 (ex ante and ex post ; ab-
solute and relative): students were asked to report their expected absolute score and relative
rank both before and after solving the quiz,. In addition, risk and ambiguity preferences of
participants were measured by eliciting switching points in Holt & Laury (2002)-style choice
menus (see Figure 6 in Appendix B) and also by asking students to rate their willingness to take
risk in general (Dohmen et al. , 2011). Finally, students reported their expectations regarding
their absolute and relative performance in the course and also their attitudes toward norm- and
criterion-referenced grading practices.
9For an example of a quiz question, please refer to Figure 5 in Appendix B.10We define an agent as overconfident when her conceived ability exceeds her true ability. For a discussion on
different definitions of overconfidence in the experimental psychology literature, please refer to Hvide (2002).
7

4 Data
This section contains an overview of our data. Panel A of Table 3 presents basic demographic
information based on administrative data provided by the University of Amsterdam. In total,
529 students registered for the course, with a quarter following the international program. The
share of female students in the sample is relatively low, just over a third, reflecting the general
gender composition of the Economics and Business Bachelor program. The average age is 20.8
with relatively low variance. The majority of the participants were born in the Netherlands and
are Dutch citizens. Our dataset contains several indicators of the past academic achievement
of the students in our sample, most notably the average mathematics grade and the number
of retake exams. The first, constructed as the unweighted average of any mathematics- or
statistics-related exam a student had ever taken at the UvA (including failed tests), is a fairly
good predictor of the final grade in the EMO course: the correlation between the two is 0.50 and
is highly significant. This math-grade based measure indicates very low average performance:
the mean of the variable, 5.88, is barely above the minimum requirement for passing.11 The
second indicator is calculated as the number of retake exams over all the courses the student
ever registered for. On average, students repeat approximately one out of five exams.12
Panel B of Table 3 provides an overview of the preparation behavior and performance of
students in the EMO course. Attendance rates were relatively low during the study weeks
preceding the midterm exam: out of the three lectures and tutorials, students participated
on average 1.21 and 1.45 times, respectively. The majority of students handed in homework
assignments and obtained fairly good homework grades (a mean of 6.95 out of 10), varying in
the range between 3.45 and 9.45. (A homework grade of 5.5 or above ensured the bonus point.)
Students reported spending on average 10 hours per week on studying and practicing for the
course. The show-up rate at both of the exams was very high, 91% at the midterm and 87% at
the end-of-term exam. The average number of correct answers on the midterm exam was 19.28
out of 30, which decreased to 17.41 in the end-of-term exam.13 Analyzing the final grades, note
that it was theoretically possible to get a grade 11 in this course (two students indeed received
a calculated grade of 10.5) because the homework bonus point was added to the unweighted
average of the two exam grades.
Results from the incentivized online survey are presented in Panel C of Table 3. The rela-
tively low average performance on the quiz measuring knowledge in prerequisites (4.67 correct
answers out of 10 questions) is likely explained by the intense time pressure students were sub-
jected to during the quiz (25 seconds per question). Performance on the quiz is significantly
correlated with the final grade students received in the course (corr = 0.23). Students are on
11In the Netherlands, grades range from 1 (lowest) to 10 (highest), and the minimum passing grade is either5.5 (when half grades are awarded) or 6.
12Note that neither of these ability measures based on past performance are available for the 32 exchangestudents who visited the UvA only for the semester when our study was conducted.
13We argue that this decrease does not reflect a difference in the difficulty of the exams but is rather a result ofthe way the final grade for the course was determined: a high midterm grade and a homework bonus point wouldensure that a student passed the course simply by showing up at end-of-term exam, providing weaker incentivesfor effort provision in the end-of-term. We further discuss this finding in the Results section.
8
average overconfident according to all confidence measures we have elicited. In the table we
present the ex ante relative overconfidence variable, based on a comparison between the stu-
dents’ guessed and actual relative performance. A correct guessed rank would correspond to a
score of zero on our overconfidence scale, and any positive number indicates overconfidence. As
mentioned in the previous section, students’ risk, ambiguity, and competitive preferences were
measured in Holt & Laury (2002)-style choice lists. We find respondents to be risk-averse (the
risk-neutral switching point is at decision 5) but seeking competition (a risk-neutral agent who
believes he/she will win half of the time is indifferent between piece rate and tournament at de-
cision 7). The overconfidence of students is also reflected in their grade expectations exceeding
their realized final grades (an average of 7.04 vs. 6.65) and their relative performance in terms
of grades (students guess on average that out of 100, only 37.37 of their peers will do better
than them). Students report a more positive attitude toward absolute than towards relative
grading, which is likely due to their inexperience with the latter scheme: students rarely face
explicit relative grading in the Dutch educational system. Still, students are not opposed to
relative grading: on average they rated their attitude toward grading on a curve as slightly
positive (5.33 where 5 corresponds to neutral).
Section I of Table 4 proves that the randomization is successful. The two treatment groups
are balanced not only along the dimensions we have stratified (study program, gender, and
mathematics grades), but also with respect to other demographic, ability, and preference vari-
ables.14 Section II compares the male and female students in our sample. We observe that
women are more likely than men to follow the international program and are thus less likely to
have been born in the Netherlands. There is also a gender difference in past academic perfor-
mance: on average, women obtained significantly higher math grades and had to retake fewer
exams than their male peers.15 We find no such difference in the number of correct quiz ques-
tions, possibly due to the intense time pressure in the survey (Shurchkov, 2012). In terms of
preferences, we find that men and women differ in their attitudes toward risk, with women being
significantly more risk averse. This finding is in line with results from other studies (Croson &
Gneezy, 2009).16 Contrary to our expectations, we find no significant gender differences in the
willingness to enter tournaments. This may be explained in part by the women in our sample
being as confident as male students. Moreover, the continuous measure we designed (eliciting
a switching point between a piece rate and a competitive payment scheme with varying prizes)
has not been verified by other studies to reliably capture competitive preferences and could
potentially have been confusing for our subjects.17 Section III of Table 4 shows the differences
14Table C1 in Appendix C provides the same comparison but split by gender. We find that male students inthe “Blue” group do not differ from men in the “Yellow” group, except in terms of their ambiguity aversion.Similarly, women in the two treatment groups are not significantly different in their demographic and abilitycharacteristics, although female students in the “Yellow” group report higher expected grades. Once we applythe Bonferroni correction for multiple comparisons, neither of these differences remains significant.
15The difference is not driven merely by the higher share of international students among women. Even aftercontrolling for the study program, women obtain significantly higher grades than the men in our sample.
16The review and meta-analysis by Filippin & Crosetto (2014) suggests, however, that the gender differencesin risk-taking observed in the literature are sensitive to the methods of elicitation and are often economicallyinsignificant.
17Gneezy & Pietrasz (2013) use a continuous measure to elicit competitive preferences and find large gender
9

between students following the Dutch and the international program. We find that students
in the English-language program outperform their Dutch peers: they have significantly higher
mathematics grades, have fewer retakes, and solve more quiz questions correctly. It is therefore
understandable that they also have higher grade expectations than students in the Dutch study
program.18
5 Results
5.1 Selection
Before comparing the outcomes of students in the two treatment groups, we need to alleviate
concerns related to non-random attrition. Students assigned to relative grading who are partic-
ularly averse to competition may decide to skip the midterm exam or to drop out of the course
entirely, biasing our estimation results. The findings of Niederle & Vesterlund (2007) and several
replications suggest that even high-ability women are likely to shy away from competition. We
would thus expect to see lower midterm show-up in the relative grading group, driven by fewer
female students participating in the exam. We find no support for this hypothesis in our data:
show-up is actually slightly higher under relative grading (a raw difference of 4.9 percentage
points, significant at the 5% level), and there is no gender difference in the propensity to par-
ticipate in the exam (a t-test yields a p-value of 0.23). Selection does not ruin the balancedness
of the two treatment groups, and the actual number of non-participants is very low: 16 vs. 30
in the relative and absolute group, respectively. We thus argue that exam participation is likely
unrelated to our treatment, so our results are not biased by non-random selection.
5.2 Exam performance
5.2.1 Full sample
We start our analysis with a simple comparison of midterm scores under the different grading
schemes. The mean number of correct answers was 19.20 under absolute and 19.37 under
relative grading (with standard deviations of 3.79 and 3.81, respectively) out of 30 questions.
According to a two-sample t-test with unequal variances, the difference is insignificant (p-value:
0.62). As Figure 1 shows, the distributions of outcomes in the two treatment groups also look
very similar. A Kolmogorov-Smirnov test does not reject the equality of the two distributions
(exact p-value: 0.99). We proceed to test whether the response to grade incentives differs
by gender. Figure 2 compares the mean number of correct answers on the midterm exam by
gender and treatment group. While there is an indication of women slightly outperforming men
under the absolute scheme and the gender gap shrinking under the relative scheme due to the
higher scores of male students, these differences are negligible in size. An OLS regression (with
standard errors clustered on the homework team level) confirms that there is no significant
differences, but their method is different from the one applied in this research.18Using the Bonferroni correction to account for multiple testing, the differences between men and women in
the number of retakes and between international and Dutch students in quiz performance are no longer significant.All other differences highlighted in the table remain significant at the 10% level.
10

difference in midterm scores between the treatment groups, and the gender interaction is also
insignificant (see columns 1 and 2 of Table 5).
A raw comparison of scores may, however, be misleading: as we have shown in Table 4, men
and women in our sample are different along many dimensions that could possibly influence their
response to the grading schemes. We therefore repeat the analysis controlling for demographic,
ability, and preference variables19 and discover that all else equal, men respond more favorably
to relative grading than women. Column 3 in Table 5 shows that the coefficient of the interaction
term between relative grading and the male dummy is positive and significant at the 5% level.20
The result is robust to the inclusion of further interaction terms (see Table C2 in Appendix
C). Analyzing the subsamples of men and women separately (columns 4 and 5 in Table 5) we
find that the point estimate for the effect of relative grading on exam scores is negative for
female and positive for male students, ceteris paribus, but these estimates are not statistically
significant (p-values: 0.17 and 0.16 for men and women, respectively).
Following Paredes (2012) and Muller & Schotter (2010), we discuss whether we find a differ-
ence with respect to ability in response to the grading schemes. As we have already seen in Ta-
ble C2, previous academic history, as proxied by the average mathematics-related exam grades,
does not influence student reaction to relative grading: the interaction term relative*Math is
insignificant.21 Results are similar when we use course-specific knowledge (performance on the
prerequisites quiz), grades in the first-year finance course or expected grade in the EMO course
to capture ability. For an illustration, see Figure 4.
5.2.2 Responsiveness to grade incentives
In our analysis so far we have compared whether one type of grade incentive works better than
the other. In so doing, we have implicitly assumed that all students are in the first place
motivated by grade incentives. Those students, however, who place little or no weight on the
actual level of their grades are unlikely to respond strongly to differences in grading schemes. As
we have discussed in the Introduction, students in the Netherlands are typically only interested
in passing their courses and do not strive to achieve high grades.
Besides the examples discussed in the Introduction, our data also contains evidence of the
“zesjescultuur.” Due to the specific design of the grading schemes,22 students who achieved a
grade 7 or higher in the midterm exam and received a homework bonus point (in the following
referred to as “safe” students) knew they could pass the course simply by showing up at the
end-of-term exam, without actually solving any questions correctly. By focusing on the group
19The control variables included in the regressions (throughout the paper, unless otherwise indicated) are thefollowing: Demographic controls: international program, age, Dutch-born; Ability controls: average math grade,quiz performance; Preference controls: overconfidence, risk aversion, ambiguity aversion, competition aversionand attitude toward relative grading.
20The inclusion of covariates leads to changes in the estimates of the main effect not because of an imperfectrandomization but due to a reduction in sample size caused by missing ability and preference variables for somestudents. The significance of the interaction term is not, however, merely driven by the smaller sample.
21We find no significant effect when testing for a non-linear relationship by including either Math squared orfour dummies for the four Math quartiles. Calculations available from the authors on request.
22The lowest grade awarded under both schemes was a 2, see Appendix A.
11

of “safe” students, we show that even higher ability students tend to be satisfied with the lowest
passing grade. Many of these students, instead of striving for a high final grade, provided low
effort in the final exam: while the mean score of “safe” students was 23.36 in the midterm
exam, it decreased in the end-of-term test to 19.18. Tellingly, 108 out of the 148 “safe” students
solved fewer questions correctly in the end-of-term than in the midterm exam. This drop in
performance cannot be explained by differences in exam difficulty, since “non-safe” students
(who were not certain of having passed the course prior to the end-of-term) only scored 1 point
lower on average on the end-of-term compared to the midterm, and more than half of them
actually performed better in the second test (see Figure C1 in Appendix C).23
The above evidence illustrates that many students are unwilling to work hard for a higher
grade. Since they are not worried about failing the course (less than 2% of them report an
expected grade below 6), it is unlikely that they will be responsive to grade incentives in general.
We will continue our analysis to test whether the response to absolute vs. relative grading is
heterogeneous with respect to sensitivity to grade incentives. The proxy we use to measure
such “responsiveness” is the study program students follow: we argue that those enrolled in the
international program place more weight on the grades in the course than those in the Dutch
program.
5.2.3 International program
In this subsection we test whether we find a differential effect of relative grading among the
126 students following the international program. Students in the international program are
significantly more likely to hand in homework assignments, they receive higher homework grades
and report spending more time preparing for the course than students in the Dutch-language
program (see Table C3 in Appendix C), supporting our claim that they care more about the
grade they receive. Moreover, even after controlling for past mathematics grades or performance
on the quiz questions, students in the international program have significantly higher grade
expectations than those in the Dutch program. We attribute this difference to international
students being more ambitious rather than more overconfident, especially because students in
the two programs did not differ in their overconfidence measured in the online incentivized
survey.
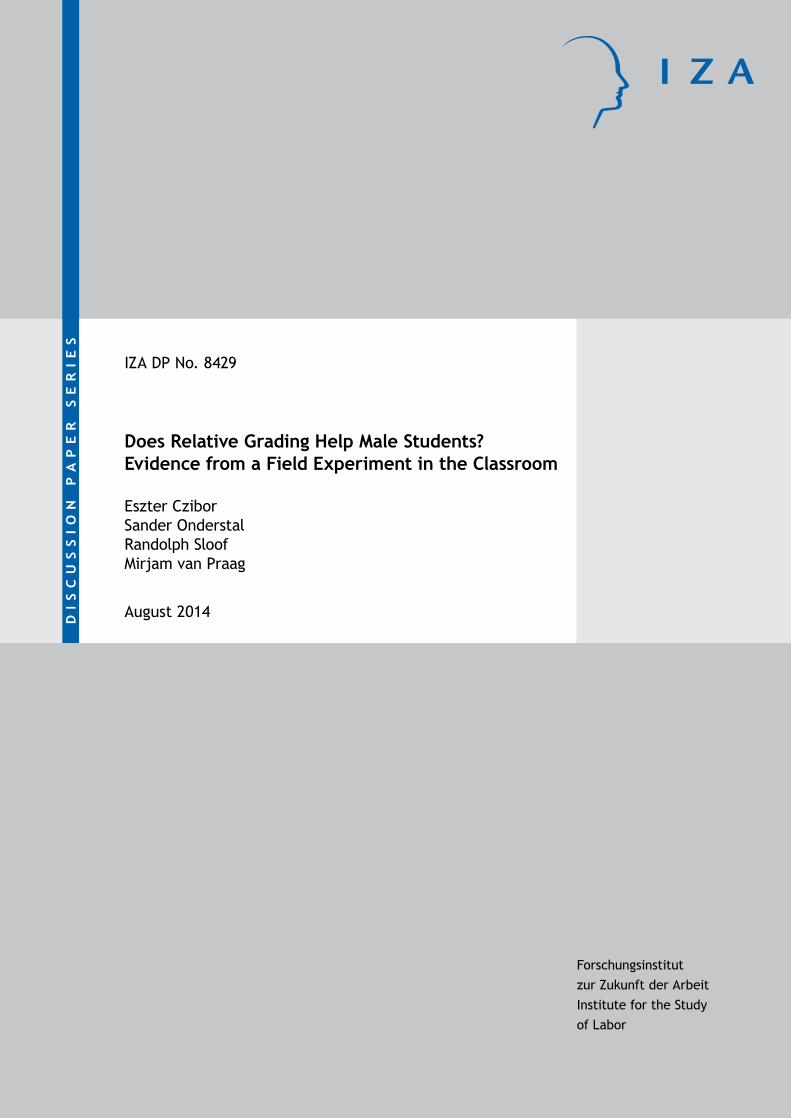
Figure 3 shows that the response to relative grading indeed differs by study program: while
the performance of students in the Dutch program is unaffected by the grading schemes, male
students in the international program achieve significantly higher scores when graded on the
curve. Table 6, presenting estimates from OLS regressions, confirms that our results are robust
to the inclusion of control variables: men in the international program respond significantly
23We find more indication of the ‘just pass’ attitude by analyzing results from first-year courses. If all studentsworked hard to get the highest grade possible and thus the only explanation for low grades would be a lack ofability, than we would expect lower and more variable grades in courses that are mathematics-intensive thanin those that are not (assuming that in the latter effort provision can compensate for skill differences). Wedo not, however, find lower average grades in math-heavy courses such as Micro- and Macroeconomics than inless mathematical classes such as Marketing or Organization and Management, and the difference between thestandard deviations is also small.
12
more positively to relative grading than female students, while no such difference is observed
in the Dutch program. The effect of relative grading on the exam performance of male interna-
tional students is estimated to be approximately 1.5 to 2.2 points (out of 30) depending on the
specification (Table C4 in the Appendix shows the effect of relative grading in the international
program, splitting the sample by gender). This corresponds to roughly one-third to 0.5 standard
deviation of the midterm score in the international program.
Since the mean score of women following the international program does not differ between
the two schemes, we find that male relative performance is higher under grading on a curve
than under absolute grading. While women in this subsample outperform men under the abso-
lute scheme (a difference of 1.8 points, p-value = 0.07 from a two-sample t-test with unequal
variances), there is no significant gender difference under relative grading.
5.3 Robustness checks
In this section we test the robustness of our findings. We start by repeating our analysis on
a subsample where we exclude students who do not have a clear understanding of the treat-
ments. As mentioned in section 3.2, directly before writing the midterm exam, students were
required to answer multiple-choice questions about the color of the group they were assigned
to, the grading scheme applied to their midterm test, and the interpretation of the schemes.
The propensity to report misunderstanding the grading schemes did not differ by treatment
assignment. Individuals in the absolute grading group were, however, less likely to complete the
questionnaire. As our first robustness check, we exclude the 65 students who either reported
being unsure of the grading schemes or who gave the wrong answers. The first two columns of
Table 7 show that our results do not change qualitatively when restricting the sample in this
way. The estimates are no longer significant in the international program subsample, probably
due to the reduction in sample size.
We also consider whether our findings are sensitive to the regression specifications we use, in
particular to the ability measures we include as controls. We reran our estimations replacing our
ability measures (average mathematics grades and performance in the quiz) with the average
number of retake exams. Using this specification, we no longer find a significant gender effect in
the full sample (column 3 of Table 7), while the result becomes even stronger in the international
program (column 4, Table 7).
5.4 Preparation
Since the assignment to the treatment groups was announced at the beginning of the block,
students could take into account their midterm grading scheme when choosing the time and
effort to invest in studying. In the following, we compare the preparation behavior between
the two grading groups. We start with a simple comparison of means without the inclusion of
controls. Figure C2 in Appendix C displays the students’ self-reported time devoted to studying
for the EMO course. It indicates no effect of relative grading on study times for women: the
time spent on reading lecture notes, solving exercises, homework assignments or practice exams
13

is the same in the two treatment groups. Men, however, report having spent more time on
homework when assigned to relative grading (a t-test shows the difference to be significant at
the 5% level). Conversely, the higher effort of men in the relative group did not translate into
higher average homework grades on the first two assignments (p-value = 0.656 from a t-test
with equal variances) while female students did perform slightly but significantly better (the
difference is 0.59 on a scale of 1 to 10).
We continue with a regression analysis of the different aspects of preparation behavior.
Table 8 shows that the propensity to hand in homework assignments was uninfluenced by the
treatment group assignment (results from a probit estimation). Even after the inclusion of a rich
set of control variables, we find that attendance behavior and (an aggregate measure of) study
time does not significantly differ between students in the absolute and the relative groups. We
find evidence of a small difference in homework grades: all else equal, students facing relative
grading received on average a 0.67 point higher homework grade (the effect is larger among
female students, but in the model including control variables the difference is also significant
among men). We can conclude that if anything, relative grading had a small positive impact on
the preparation behavior of students in our sample: men report having spent slightly more time
on homework and both genders, but especially women prepared higher-quality assignments in
anticipation of being graded on the curve. We find the same tendencies when we restrict the
analysis to the international program (see Table C5 in Appendix C).
6 Discussion
This section is devoted to the discussion of three issues. First, we explore what mechanism could
lead to higher exam scores among responsive men under relative than under absolute grading.
Second, we consider the effect of the two grading schemes on the gender gap in performance.
Third, we discuss the identifying assumption that students do not take into account the end-
of-term grading scheme when taking the mid-term exam.
In the previous subsection we found no consistent effect of relative grading on behavior
before the exam: according to most measures, students in the two treatment groups differed
little in how hard they prepared for the course. This result remains true if we limit the analysis
to the subsample of international students. This leads us to argue that the increase we observe
in the test scores of male international students graded on the curve is not necessarily explained
by a better knowledge of the course material. Instead, we speculate that relative grading boosts
the effort provision on these students during the exam itself. Even though the treatment was
announced weeks ahead, its salience was increased again for the exam: directly before the
test, students were asked to complete a questionnaire related to the treatments, focusing their
attention on the particular grading scheme that applied to them. We also included details of
the relevant grading schemes on the front page of the exam booklets. We can thus be sure that
students were aware of the grade incentives when working on the test questions.
This explanation is in line with the results of Jalava et al. (2014) and Levitt et al. (2013)
who find that incentives introduced unexpectedly before an exam (that could not possibly affect
14

preparation) can have a significant impact on test scores. Similarly, in laboratory experiments
we also observe that subjects respond to different incentive schemes by changing their effort
provision, influencing their task performance even though their level of skills or knowledge is
unaffected (see, for instance, van Dijk et al. (2001)). The fact that we observe a relatively
small effect size in our data (motivated men solve correctly 1.5-2.2 exam questions more out of
30 when graded on a curve) is compatible with the above explanation: on a test designed to
capture course-specific knowledge, there is limited room to increase scores by working harder
during the exam itself.
The second issue we discuss is how the gender gap in performance is affected by relative
grading. We have consistently found a gender difference in response to relative grading: men
react more positively to grading on a curve than women. Female students, irrespective of being
classified as motivated by our proxies, do not significantly differ in their preparation behavior or
exam performance under the two grading schemes. Since motivated men do score higher when
graded on the curve, relative grading increases male relative performance in these subsamples.
This change is most evident in the international program, where women significantly outperform
men under the absolute, but not under the relative scheme, as shown in Figure 3. Therefore,
higher male relative performance under grading on a curve actually diminishes the gender gap
in exam performance.
We also examine the effect of relative grading on the gender balance among the top and
bottom performers (see Table C6 in Appendix C). We find that the share of women in the
top quartile of midterm scores is higher under absolute than under relative grading (39.2%
vs. 33.3%), but this difference is not significant. Similarly, the share of women in the bottom
quartile is slightly and insignificantly lower under absolute than under relative grading (26.7%
vs. 34.4%). Since the share of female students is 34.3% in the full sample, grading on a curve
ensures a more balanced representation of the genders among the best and worst performers. A
similar picture emerges if we focus on the subsample of students in the international program.
Finally, we discuss a limitation of our design. As mentioned earlier, the identification of
the effect of the grading systems relies on the assumption that students, when preparing for
and taking the midterm exam, only focus on the midterm grading scheme they are assigned
to and do not consider the end-of-term scheme that awaits them. In particular, we need the
tendency of students to substitute effort between the two exams to be uncorrelated with their
treatment group assignment. We believe this assumption holds since students were in general
unlikely to shift effort from the midterm to the end-of-term exam. As previously discussed,
performance on the midterm exam had great importance for the students: with a high enough
test grade (and a homework bonus point), students were sure to have already passed the course
after the midterm. Students were thus incentivized to take the midterm exam seriously and
not substitute effort from the first exam to the second. Admittedly, our identifying assumption
is untestable, but the reversal of grading schemes is required to perform the experiment while
ensuring ex ante fair treatment of our subjects.
15

7 Conclusions
This paper reviews evidence from a field experiment comparing the two most commonly used
grading practices: the absolute and the relative scheme. Overall we conclude that the incen-
tive effect of relative grading is limited when measured using the full sample of participating
students. However, test scores among a subsample of students who are arguably and verifiably
motivated by grade incentives show a picture in line with expectations: male students increase
their performance when graded on the curve, whereas the performance of female students is un-
affected by the grading systems. These findings suggest that absolute grading does not provide
sufficiently strong motivation for male students. In particular, the more ambitious men could
be given stronger incentives by grading them competitively. This would not harm the absolute
performance of female students, as they do not respond to the induced competition. Unfor-
tunately, however, relative grading does not help to incentivize the less-motivated males, the
arguably most problematic group. Other incentive instruments may potentially prove helpful
here. Monetary incentives to improve student achievement have been studied by Leuven et al.
(2010), Fryer (2011) and Braun et al. (2011), while Levitt et al. (2013) and Jalava et al. (2014)
look at non-pecuniary incentives such as certificates and trophies. Grove & Wasserman (2006)
study whether making assignments count toward the final grade improves student learning and
exam performance.
We should also keep in mind that the increased performance of male students in the inter-
national program did not seem to result from better preparation but rather from more con-
centration or greater effort provision during the exam itself. It is therefore not clear whether
competitive incentives led to a better “deep knowledge” of the course material. Furthermore,
female students in our sample put slightly more effort into preparation under both grading
schemes. Exam scores under absolute grading reflect this gender difference in study effort more
accurately.
An important direction for future research is to test whether our findings replicate in different
environments. First, students in our sample were accustomed to an absolute grading scheme
and for the most part never experienced relative grading during their university studies. It
is possible that incentives work differently among students for whom the “default” scheme is
competitive grading. Second, women in our study, although underrepresented in the Bachelor
program, slightly outperformed men during their previous courses and under absolute grading.
Here, grading on a curve actually narrows the gender gap in exam performance. A decrease
in female relative performance would be much more alarming in environments where men on
average performed better, as discussed by Niederle & Vesterlund (2010).
16

Tables and figures
Tables
Table 1: Overview of treatment groups and grading schemes
“BLUE” group “YELLOW” group
Midterm exam absolute relative
End-term exam relative absolute
Table 2: Timeline of the experiment
Week 1 Study week Announce treatment group assignmentWeek 2 Study week Deadline for survey; forming homework teamsWeek 3 Study week Deadline homework 1Week 4 Exam week Deadline homework 2; Questionnaire & Midterm examWeek 5 Study week Results homework 1-2 publishedWeek 6 Study week Deadline homework 3Week 7 Study week Deadline homework 4Week 8 Exam week Results homework 3-4 published, Final exam
17

Table 3: Summary statistics for demographic variables, course and survey outcomes
MEAN STD. DEV. MIN. MAX. N
PANEL A: DEMOGRAPHICSinternational program 0.25 0.44 0 1 529female 0.34 0.48 0 1 527age 20.84 2.08 18 35 485Dutch-born 0.74 0.44 0 1 517Dutch nationality 0.79 0.41 0 1 517avg. math grade 5.88 1.49 1.13 10 463avg. number of retakes 0.22 0.23 0 1.43 475
PANEL B: COURSE OUTCOMESlecture attendance(scale 0-3) 1.21 0.94 0 3 517tutorial attendance (scale 0-3) 1.45 1.00 0 3 529handing in HW (0/1) 0.81 0.39 0 1 529average HW grade (scale 0 - 10) 6.95 1.13 3.45 9.45 427self-reported study time (scale 1-5) 2.42 0.77 1 5 385midterm show-up (0/1) 0.91 0.28 0 1 529end-of-term show-up (0/1) 0.87 0.34 0 1 529midterm score (scale 0-30) 19.28 3.8 8 29 483end-of-term score (scale 0-30) 17.41 4.27 4 27 461final grade (scale 1 - 11) 6.65 1.33 2.5 10.5 461
PANEL C: SURVEY OUTCOMESsurvey complete (0/1) 0.92 0.28 0 1 529quiz questions (scale 0-10) 4.67 1.67 0 10 486overconfidence (scale -100 to 100) 18.23 29.65 -78 100 487risk aversion (scale 0-10) 6.10 1.91 1 11 487ambiguity aversion (scale 0-10) 7.44 3.14 1 11 487competition aversion (scale 0-10) 6.42 2.83 1 11 486expected grade (scale 0-10) 7.04 0.89 3 10 485expected rank (scale 0-100) 37.37 17.81 0 100 485attitude absolute grading (scale 0-10) 8.88 1.82 1 11 485attitude relative grading (scale 0-10) 5.33 2.75 1 11 485
18

Table 4: Comparison of means by treatment group, gender, and study program
SECTION I. SECTION II. SECTION III.
BLUE YELLOW Diff. MEN WOMEN Diff. DUTCH INT. Diff.
DEMOGRAPHICSint. program 0.259 0.247 0.199 0.348 *** - -
(0.027) (0.027) (0.022) (0.036)female 0.341 0.346 - - 0.299 0.477 ***
(0.029) (0.030) (0.023) (0.044)age 20.890 20.782 20.874 20.766 20.880 20.677
(0.147) (0.117) (0.113) (0.170) (0.110) (0.176)Dutch born 0.738 0.748 0.795 0.652 *** 0.924 0.224 ***
(0.027) (0.027) (0.022) (0.036) (0.014) (0.036)
ABILITYMath grade 5.890 5.861 5.740 6.141 *** 5.717 6.504 ***
(0.096) (0.101) (0.084) 0.122 (0.077) (0.148)num. retakes 0.226 0.220 0.237 0.196 * 0.240 0.153 ***
(0.014) (0.015) (0.013) (0.017) (0.012) (0.022)quiz questions 4.730 4.612 4.738 4.517 4.579 4.936 **
(0.102) (0.112) (0.096) (0.120) (0.087) (0.151)
PREFERENCESoverconfidence 16.857 19.609 17.299 20.093 17.743 19.640
(1.847) (1.952) (1.700) (2.194) (1.554) (2.680)risk aversion 6.111 6.086 5.892 6.465 *** 6.019 6.328
(0.126) (0.119) (0.108) (0.141) (0.099) (0.175)ambig. aversion 7.660 7.222 7.519 7.308 7.409 7.536
(0.202) (0.201) (0.179) (0.238) (0.166) (0.278)comp. aversion 6.369 6.471 6.364 6.517 6.460 6.304
(0.184) (0.180) (0.153) (0.232) (0.148) (0.261)expected grade 6.988 7.087 7.074 6.959 6.850 7.576 ***
(0.057) (0.056) (0.051) (0.065) (0.043) (0.079)
N 270 259 346 181 395 134
Standard errors in parentheses. Significance of difference from two-sample t-test with equal variances∗ p < 0.10, ∗∗ p < 0.05, ∗∗∗ p < 0.01
19
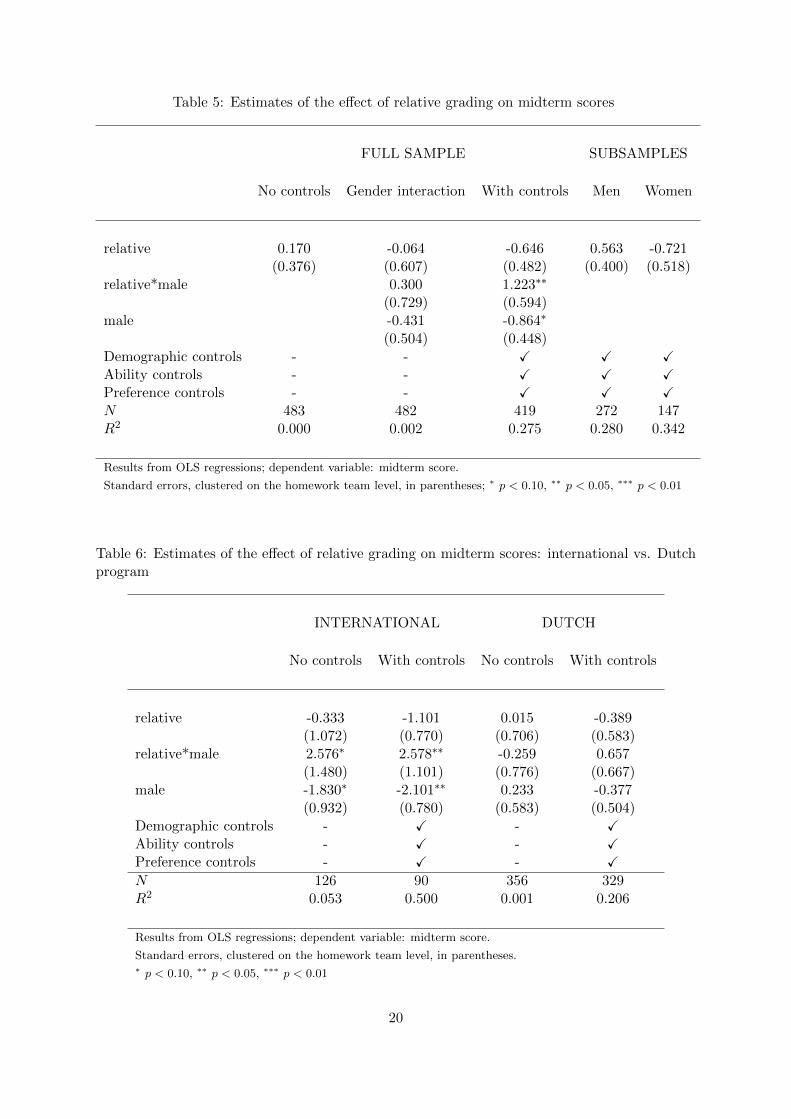
Table 5: Estimates of the effect of relative grading on midterm scores
FULL SAMPLE SUBSAMPLES
No controls Gender interaction With controls Men Women
relative 0.170 -0.064 -0.646 0.563 -0.721(0.376) (0.607) (0.482) (0.400) (0.518)
relative*male 0.300 1.223∗∗
(0.729) (0.594)male -0.431 -0.864∗
(0.504) (0.448)Demographic controls - - X X XAbility controls - - X X XPreference controls - - X X XN 483 482 419 272 147R2 0.000 0.002 0.275 0.280 0.342
Results from OLS regressions; dependent variable: midterm score.
Standard errors, clustered on the homework team level, in parentheses; ∗ p < 0.10, ∗∗ p < 0.05, ∗∗∗ p < 0.01
Table 6: Estimates of the effect of relative grading on midterm scores: international vs. Dutchprogram
INTERNATIONAL DUTCH
No controls With controls No controls With controls
relative -0.333 -1.101 0.015 -0.389(1.072) (0.770) (0.706) (0.583)
relative*male 2.576∗ 2.578∗∗ -0.259 0.657(1.480) (1.101) (0.776) (0.667)
male -1.830∗ -2.101∗∗ 0.233 -0.377(0.932) (0.780) (0.583) (0.504)
Demographic controls - X - XAbility controls - X - XPreference controls - X - XN 126 90 356 329R2 0.053 0.500 0.001 0.206
Results from OLS regressions; dependent variable: midterm score.
Standard errors, clustered on the homework team level, in parentheses.∗ p < 0.10, ∗∗ p < 0.05, ∗∗∗ p < 0.01
20

Table 7: Robustness checks
AWARE OF GRADING SCHEME DIFFERENT ABILITY CONTROL
Full sample International Full sample International
relative -0.606 -0.806 -0.511 -1.178(0.477) (0.830) (0.577) (1.088)
relative*male 1.230∗∗ 1.714 0.965 3.453∗∗
(0.619) (1.201) (0.720) (1.296)male -0.887∗∗ -1.209 -0.783∗ -2.127∗
(0.446) (0.938) (0.469) (1.063)Demographic controls X X X XAbility controls † X X - -Number of retakes - - X XPreference controls X X X XN 365 79 426 90R2 0.275 0.406 0.160 0.296
Results from OLS regressions; dependent variable: midterm score.
Standard errors, clustered on the homework team level, in parentheses; ∗ p < 0.10, ∗∗ p < 0.05, ∗∗∗ p < 0.01
†: average Mathematics grades and performance in the quiz
Table 8: Estimates of the effect of relative grading on preparation behavior
(1) (2) (3) (4)handing in HW avg. HW attendance study time
relative 0.345 0.665∗∗ 0.011 -0.054(0.257) (0.307) (0.248) (0.129)
relative*male -0.096 -0.252 0.033 0.072(0.300) (0.326) (0.275) (0.166)
male -0.301 0.124 -0.014 -0.239∗
(0.195) (0.275) (0.212) (0.126)Demographic controls limited X X XAbility controls - X X XPreference controls - X X XTutor controls - X - -N 527 363 429 334(pseudo-)R2 0.078 0.206 0.026 0.109
(1): probit, (2)-(4): OLS regressions; dependent variables indicated in column headers
Standard errors, clustered on the homework team level, in parentheses∗ p < 0.10, ∗∗ p < 0.05, ∗∗∗ p < 0.01
21

Figures
Figure 1: Distribution of midterm exam scores by treatment group
Figure 2: Comparison of midterm exam scores by treatment group and gender
22

Figure 3: Midterm exam scores by treatment group and gender, separately by study program
(a) Ability proxy: quiz performance (b) Ability proxy: Finance grade
(c) Ability proxy: expected grade
The size of the circles is proportionate to the number of observations in the given category.
Figure 4: Mean midterm score in the two grading groups, by different ability levels
23
References
Azmat, Ghazala, & Iriberri, Nagore. 2010. The importance of relative performance feedback
information: Evidence from a natural experiment using high school students. Journal of
Public Economics, 94(7-8), 435–452.
Becker, William E., & Rosen, Sherwin. 1992. The learning effect of assessment and evaluation
in high school. Economics of Education Review, 11(2), 107–118.
Bigoni, Maria, Fort, Margherita, Nardotto, Mattia, & Reggiani, Tommaso. 2011 (July). Teams
or Tournaments? A Field Experiment on Cooperation and Competition among University
Students. IZA Discussion Papers 5844. Institute for the Study of Labor (IZA).
Braun, Henry, Kirsh, Irwin, & Yamamato, Kentaro. 2011. An Experimental Study of the
Effects of Monetary Incentives on Performance on the 12th-Grade NAEP Reading Assessment.
Teachers College Record, 113(11), 2309–2344.
Budryk, Zack. 2013. Dangerous Curves. Inside Higher Ed, 12 February.
Bull, Clive, Schotter, Andrew, & Weigelt, Keith. 1987. Tournaments and Piece Rates: An
Experimental Study. Journal of Political Economy, 95(1), 1–33.
Croson, Rachel, & Gneezy, Uri. 2009. Gender Differences in Preferences. Journal of Economic
Literature, 47(2), 448–74.
De Paola, Maria, Gioia, Francesca, & Scoppa, Vincenzo. 2013 (Dec.). Are Females Scared
of Competing with Males? Results from a Field Experiment. IZA Discussion Papers 7799.
Institute for the Study of Labor (IZA).
Dohmen, Thomas, Falk, Armin, Huffman, David, Sunde, Uwe, Schupp, Jurgen, & Wagner,
Gert G. 2011. Individual risk attitudes: measurement, determinants and behavioral conse-
quences. Journal of the European Economic Association, 9(3), 522–550.
Dubey, Pradeep, & Geanakoplos, John. 2010. Grading exams: 100,99,98,... or A,B,C? Games
and Economic Behavior, 69(1), 72–94.
Filippin, Antonio, & Crosetto, Paolo. 2014 (May). A Reconsideration of Gender Differences in
Risk Attitudes. IZA Discussion Papers 8184. Institute for the Study of Labor (IZA).
Fryer, Roland G. 2011. Financial Incentives and Student Achievement: Evidence from Ran-
domized Trials. The Quarterly Journal of Economics, 126(4), 1755–1798.
Gneezy, Uri, & Pietrasz, Aniela. 2013. When Half of the Men are More Competitive than All
Women. Working paper.
Gneezy, Uri, & Rustichini, Aldo. 2004. Gender and Competition at a Young Age. American
Economic Review, 94(2), 377–381.
24

Gneezy, Uri, Niederle, Muriel, & Rustichini, Aldo. 2003. Performance In Competitive Environ-
ments: Gender Differences. The Quarterly Journal of Economics, 118(3), 1049–1074.
Green, Jerry R, & Stokey, Nancy L. 1983. A Comparison of Tournaments and Contracts.
Journal of Political Economy, 91(3), 349–64.
Grove, Wayne A., & Wasserman, Tim. 2006. Incentives and Student Learning: A Natural
Experiment with Economics Problem Sets. The American Economic Review, 96(2), pp. 447–
452.
Guiso, Luigi, Monte, Ferdinando, Sapienza, Paola, & Zingales, Luigi. 2008. Culture, Gender,
and Math. Science, 320(5880), 1164–1165.
Gunther, Christina, Ekinci, Neslihan Arslan, Schwieren, Christiane, & Strobel, Martin. 2010.
Women can’t jump?–An experiment on competitive attitudes and stereotype threat. Journal
of Economic Behavior & Organization, 75(3), 395–401.
Harbring, Christine, & Irlenbusch, Bernd. 2003. An experimental study on tournament design.
Labour Economics, 10(4), 443–464.
Harrison, Glenn W., & List, John A. 2004. Field Experiments. Journal of Economic Literature,
42(4), pp. 1009–1055.
Holmstrom, Bengt. 1982. Moral Hazard in Teams. Bell Journal of Economics, 13(2), 324–340.
Holt, Charles A., & Laury, Susan K. 2002. Risk Aversion and Incentive Effects. American
Economic Review, 92(5), 1644–1655.
Hvide, Hans K. 2002. Pragmatic beliefs and overconfidence. Journal of Economic Behavior &
Organization, 48(1), 15 – 28. Psychological Aspects of Economic Behavior.
Inspectie van het Onderwijs. 2014. De staat van het onderwijs. Onderwijsverslag 2012/2013.
Inspectie van het Onderwijs, April.
Jalava, Nina, Joensen, Juanna Schrøter, & Pellas, Elin Maria. 2014 (August). Grades and Rank:
Impacts of Non-Financial Incentives on Test Performance. Tech. rept. Available at SSRN.
Jaspers, Arnout. 2012. Een voldoende, zonder uitschieters. Wetenschap 24, 12 December.
Jurajda, Stepan, & Munich, Daniel. 2011. Gender Gap in Performance under Competitive
Pressure: Admissions to Czech Universities. American Economic Review, 101(3), 514–18.
Karran, Terrence. 2004. Achieving Bologna convergence: is ECTS failing to make the grade?
Higher Education in Europe, 29(3), 411–421.
Landeras, Pedro. 2009. Student effort: standards vs. tournaments. Applied Economics Letters,
16(9), 965–969.
25

Lazear, Edward P., & Rosen, Sherwin. 1981. Rank-Order Tournaments as Optimum Labor
Contracts. Journal of Political Economy, 89(5), pp. 841–864.
Leuven, Edwin, Oosterbeek, Hessel, & van der Klaauw, Bas. 2010. The Effect of Financial
Rewards on Students’ Achievement: Evidence from a Randomized Experiment. Journal of
the European Economic Association, 8(6), 1243–1265.
Levitt, Steven, List, John, Neckermann, Susanne, & Sadoff, Sally. 2013. The behavioralist goes
to school: Leveraging behavioral economics to improve educational performance. Framed Field
Experiments 00379. The Field Experiments Website.
Moldovanu, Benny, & Sela, Aner. 2001. The Optimal Allocation of Prizes in Contests. American
Economic Review, 91(3), 542–558.
Morin, Louis-Philippe. forthcoming. Do Men and Women Respond Differently to Competition?
Evidence from a Major Education Reform. Journal of Labor Economics.
Muller, Wieland, & Schotter, Andrew. 2010. Workaholics and Dropouts in Organizations.
Journal of the European Economic Association, 8(4), 717–743.
Niederle, Muriel, & Vesterlund, Lise. 2007. Do Women Shy Away from Competition? Do Men
Compete Too Much? The Quarterly Journal of Economics, 122(3), 1067–1101.
Niederle, Muriel, & Vesterlund, Lise. 2010. Explaining the Gender Gap in Math Test Scores:
The Role of Competition. Journal of Economic Perspectives, 24(2), 129–44.
Niederle, Muriel, & Vesterlund, Lise. 2011. Gender and competition. Annual Review of Eco-
nomics, 3(September), 601–630.
OECD. 2013. Education at a Glance 2013,. OECD Indicators. OECD Publishing.
Onderstal, Sander. 2014. Economics of Organizations and Markets. Pearson, Amsterdam.
Ors, Evren, Palomino, Frederic, & Peyrache, Eloıc. 2013. Performance Gender Gap: Does
Competition Matter? Journal of Labor Economics, 31(3), pp. 443–499.
Paredes, Valentina. 2012. Grading System and Student Effort. Mimeo.
Price, Joseph. 2008. Gender Differences in the Response to Competition. Industrial and Labor
Relations Review, 61(3), 320–333.
Rosin, Hanna. 2012. The End of Men: And the Rise of Women. Riverhead Books. Penguin
Group.
Salvi del Pero, Angelica, & Bytchkova, Alexandra. 2013. A Bird’s Eye View of Gender Differ-
ences in Education in OECD Countries. OECD Social, Employment and Migration Working
Papers, No. 149. OECD Publishing.
26

Sax, Leonard. 2007. Boys Adrift: The Five Factors Driving the Growing Epidemic of Unmoti-
vated Boys and Underachieving Young Men. Basic Books.
Shurchkov, Olga. 2012. Under Pressure: Gender Differences In Output Quality And Quantity
Under Competition And Time Constraints. Journal of the European Economic Association,
10(5), 1189–1213.
The Economist. 1999. The trouble with boys. The Economist, May 27.
van Dijk, Frans, Sonnemans, Joep, & van Winden, Frans. 2001. Incentive systems in a real
effort experiment. European Economic Review, 45(2), 187 – 214.
27

Appendix A: Sections from the Course Manual
Grading the exams
The lecturers of the University of Amsterdam are constantly striving to improve their teach-
ing and evaluation practices. As part of this initiative, during the EMO course we will test two
different grading schemes that are recognized by the university: all students will experience
both an absolute and a relative grading scheme. These grading schemes determine how exam
scores are translated into grades.
Absolute grading
Under an absolute scheme, students’ grades depend solely on their individual absolute perfor-
mance in the exams. Specifically, the exam grade is calculated as follows:
Grade exam = 10 – 0.4*(number of errors)
We round the grade to the nearest integer and we do not assign a grade below 2. This implies
that exam scores translate into exam grades according to the table below:
Exam score Grade(=points earned)
29 - 30 1027 - 28 924 - 26 822 - 23 719 - 21 617 - 18 514 - 16 412 - 13 30 - 11 2
Relative grading
Under a relative grading scheme, or grading on a curve, students’ grades depend on how well
they perform in the exams compared to other students taking this course. It is not the individual
score, but the students’ position in the class score distribution (i.e., the students’ rank among
all students taking the exam) that determines the exam grade. For this course the curve is fixed
so that the average score translates into an exam grade of 6, and the highest performing 1% of
students receive a grade 10 while the lowest performing 1% get a grade 2. We illustrate this
scheme by the figure and the table below:
28

Relative rank Grade(calculated from the top)
1% 102 - 5% 96 - 16% 817 - 37% 738 - 63% 664 - 84% 585 - 95% 495 - 99% 399 - 100% 2
Comparison of the schemes
In order to compare the two grading schemes, we will randomly divide all students into two
grading groups: the blue group and the yellow group. Students in the two groups will take
exams of the same difficulty level but will face different grading schemes:
BLUE group: midterm exam graded under absolute, final exam graded under relative scheme
YELLOW group: midterm exam graded under relative, final exam graded under absolute
scheme
This way fairness is ensured: all students will experience both grading schemes, only the timing
is different (remember: the midterm and final exams have equal weights and cover the same
amount of study material). The grades of students under the relative schemes are always de-
termined compared to other exam takers in their grading group, not the whole class.
Before the start of the course, we will notify you of your grading group via e-mail and a Black-
board message. Please make sure you know which grading group you belong to, as it is important
not only for your exam but also for the composition of homework groups.
29

Appendix B: Screenshots from the survey
Figure 5: Example of a multiple-choice quiz question
Figure 6: Eliciting risk preferences
30

Appendix C: Additional tables and figures
Table C1: Comparison of means between treatment groups, by gender
MEN WOMEN
Blue Yellow Diff. Blue Yellow Diff.
DEMOGRAPHICSint. program 0.219 0.179 0.337 0.360
(0.031) (0.030) (0.050) (0.051)age 20.951 20.795 20.774 20.759
(0.175) (0.142) (0.270) (0.208)Dutch born 0.779 0.812 0.659 0.644
(0.032) (0.031) (0.050) (0.052)
ABILITYMath grade 5.782 5.697 6.108 6.174
(0.115) (0.122) (0.172) (0.173)num. retakes 0.237 0.237 0.203 0.189
(0.018) (0.019) (0.024) (0.024)quiz questions 4.830 4.643 4.541 4.494
(0.132) (0.138) (0.157) (0.183)
PREFERENCESoverconfidence 16.201 18.426 18.082 22.057
(2.337) (2.477) (3.015) (3.187)risk aversion 5.881 5.903 6.541 6.391
(0.160) (0.145) (0.195) (0.204)ambig. aversion 7.830 7.200 * 7.341 7.276
(0.250) (0.253) (0.340) (0.335)comp. aversion 6.377 6.351 6.353 6.678
(0.224) (0.210) (0.321) (0.336)expected grade 7.090 7.058 6.800 7.115 **
(0.075) (0.069) (0.083) (0.096)
N 178 168 92 89
Standard errors in parentheses.
Significance of differences from two-sample t-test with equal variances.∗ p < 0.10, ∗∗ p < 0.05, ∗∗∗ p < 0.01
31

Table C2: Estimates of the effect of relative grading on midterm scores, including interactionterms
(1) (2) (3) (4) (5)
relative -0.010 0.614 -0.046 -1.701∗∗ -0.500(0.722) (1.441) (1.079) (0.816) (0.498)
relative*male 1.344∗∗ 1.158∗ 1.167∗ 1.269∗∗ 1.199∗∗
(0.590) (0.606) (0.601) (0.609) (0.593)male -0.908∗∗ -0.833∗ -0.826∗ -0.869∗ -0.858∗
(0.455) (0.450) (0.450) (0.454) (0.450)relative*Dutch -0.894
(0.674)relative*Math -0.203
(0.210)relative*risk -0.092
(0.150)relative*comp. 0.158
(0.100)relative*overconf. -0.007
(0.008)Demographic controls X X X X XAbility controls X X X X XPreference controls X X X X XN 419 419 419 419 419R2 0.277 0.276 0.275 0.278 0.275
Results from OLS regressions; dependent variable: midterm score.
Standard errors, clustered on the homework team level, in parentheses.∗ p < 0.10, ∗∗ p < 0.05, ∗∗∗ p < 0.01
32

Table C3: Comparison of means by gender and study program
MEN WOMEN
Dutch International Diff. Dutch International Diff.
lecture attendance 1.191 1.262 1.265 1.131(0.058) (0.127) (0.081) (0.120)
tutorial attendance 1.473 1.493 1.458 1.270(0.062) (0.114) (0.093) (0.116)
handing in HW 0.729 0.942 *** 0.831 0.968 ***(0.027) (0.028) (0.035) (0.022)
average HW grade 6.841 7.127 ** 7.063 6.952(0.084) (0.088) (0.137) (0.100)
study time 2.267 2.495 ** 2.430 2.948 ***(0.054) (0.095) (0.085) (0.098)
Standard errors in parentheses.
Significance of difference from two-sample t-test with unequal variances.∗ p < 0.10, ∗∗ p < 0.05, ∗∗∗ p < 0.01
Table C4: Estimates of the effect of relative grading on midterm scores: international program,by gender
MEN WOMEN
No controls With controls No controls With controls
relative 2.243∗∗ 1.497∗ -0.333 -0.823(1.005) (0.769) (1.075) (0.725)
Demographic controls - X - XAbility controls - X - XPreference controls - X - XN 65 45 61 45R2 0.089 0.524 0.002 0.573
Results from OLS regressions; dependent variable: midterm score.
Standard errors, clustered on the homework team level, in parentheses.∗ p < 0.10, ∗∗ p < 0.05, ∗∗∗ p < 0.01
33

Table C5: Estimates of the effect of relative grading on preparation behavior: internationalprogram
(1) (2) (3) (4)handing in HW avg. HW attendance study time
relative 4.039 0.756∗∗ 0.144 0.136(267.403) (0.278) (0.358) (0.205)
relative*male -3.631 -0.460 0.055 0.217(267.404) (0.336) (0.634) (0.292)
male -0.092 0.635∗∗ -0.038 -0.402∗∗
(0.458) (0.284) (0.378) (0.180)Demographic controls limited X X XAbility controls - X X XPreference controls - X X XN 132 90 90 74R2 0.442 0.119 0.283
(1): probit, (2)-(4): OLS regressions; dependent variables indicated in column headers.
Standard errors, clustered on the homework team level, in parentheses.∗ p < 0.10, ∗∗ p < 0.05, ∗∗∗ p < 0.01
Table C6: Share of women among best and worst performers, by grading scheme
ABSOLUTE RELATIVE Difference
Worst quartile 0.267 0.345 0.059(0.058) (0.063) (0.078)
Best quartile 0.392 0.333 -0.078(0.057) (0.053) (0.085)
Standard errors in parentheses; ∗ p < 0.10, ∗∗ p < 0.05, ∗∗∗ p < 0.01
Significance of difference from two-sample t-test with unequal variances.
34

Figure C1: End-term scores plotted against midterm scores, separately for “non-safe” and “safe”students
Figure C2: Self-reported study times on different activities by treatment group and gender
35