Embed Size (px)
Citation preview
THE ACCOUNTING REVIEW American Accounting AssociationVol. 88, No. 3 DOI: 10.2308/accr-503812013pp. 1095–1127
Does Recognition versus Disclosure AffectValue Relevance? Evidence from Pension
Accounting
Kun Yu
University of Massachusetts Boston
ABSTRACT: This study examines whether institutional ownership and analyst following
affect the value relevance of disclosed versus recognized pension liabilities. Using a
sample of firms with pension liabilities that were disclosed under SFAS No. 87 and
subsequently recognized under SFAS No. 158 from 1999 to 2007, I find that off-balance-
sheet pension liabilities are more value relevant for firms with a higher level of institutional
ownership or analyst following in the pre-158 period. More importantly, I find that SFAS
No. 158 increases the value relevance of previously disclosed off-balance-sheet pension
liabilities for firms with a low level of institutional ownership or analyst following, and that
the increase in the value relevance becomes less pronounced for firms with a higher level
of institutional ownership or analyst following. Overall, the results are consistent with the
view that institutional ownership and analyst following affect the value relevance of
disclosed information as well as the valuation difference between disclosed and
recognized information. This study also highlights the importance of considering
institutional ownership and analyst following in the value-relevance research.
Keywords: pension; value relevance; recognition; disclosure; SFAS No. 158.
Data Availability: All data are publicly available from the sources indicated in the text.
I. INTRODUCTION
An important area of research is whether information disclosure in the footnotes is a
substitute for recognition in the financial statements. Since Johnson (1992), a large body
of accounting literature has examined whether and how recognition is distinct from
disclosure. The semi-strong form efficient market hypothesis suggests that recognition versus
disclosure of accounting information should make no difference, as long as the information is
This paper is based on my dissertation at Boston University. I gratefully acknowledge the comments and help of mydissertation chair, Kumar Sivakumar, and my committee members, Krishnagopal Menon and Donald J. Smith. I alsoappreciate comments from Kathryn Easterday, John Harry Evans (senior editor), Steven Kachelmeier (former senioreditor), Sally Wright, two anonymous referees, and the workshop participants at the 2010 AAA Annual Meeting.
Editor’s note: Accepted by John Harry Evans III, with thanks to Steven Kachelmeier for serving as editor on a previousversion.
Submitted: October 2010Accepted: December 2012
Published Online: December 2012
1095
publicly available. A few earlier accounting studies (e.g., Dhaliwal 1986) provide empirical support
for the ‘‘no difference’’ view. However, more recent accounting research generally finds that
recognition is different from disclosure in terms of value relevance (e.g., Ahmed et al. 2006) and
contracting costs (e.g., Espahbodi et al. 2002). This paper examines whether recognition versus
disclosure of pension liabilities affects investors’ valuation in the setting of SFAS No. 158 versus 87.
Prior studies (e.g., Davis-Friday et al. 1999; Ahmed et al. 2006) on the value relevance of
recognition versus disclosure generally assume that the value relevance of disclosed information is
the same across firms and that recognition of previously disclosed accounting items affects all the
firms homogenously. However, the extent to which users of financial reports understand disclosed
information may differ across firms. The FASB stated that only the most sophisticated investors
could understand the implication of disclosed stock option information, while individual investors
and other users could not (SFAS No. 123, para. 105). Similarly, the FASB argued that disclosure of
pension information may be a substitute for recognition only for sophisticated users, but not for
other users (SFAS No. 87, para. 116), suggesting that the impact of recognition of previously
disclosed pension information depends on the extent to which disclosed information has been
assimilated by various users.
This study is motivated by anecdotal evidence that institutional investors and financial analysts
attend to pension information disclosed in the footnotes and incorporate off-balance-sheet pension
liabilities disclosed under SFAS No. 87 into their decision-making process. For example, some
portfolio managers at Washington Trust Bank argued that SFAS No. 158 should not affect stock
valuation of firms with a high level of institutional ownership or analyst following because
off-balance-sheet pension liabilities had already been considered in the valuation analysis by
institutional investors and analysts.1 This anecdotal evidence suggests that the difference in value
relevance between disclosed and recognized pension liabilities may be conditional on institutional
ownership and analyst following. I examine whether institutional ownership and analyst following
affect the value relevance of off-balance-sheet pension liabilities under SFAS No. 87, and whether
the impact of SFAS No. 158 on the value relevance of previously disclosed pension liabilities
depends on institutional ownership and analyst following.
I find that, without considering the effects of institutional ownership and analyst following,
off-balance-sheet pension liabilities are not value relevant under SFAS No. 87, and SFAS No. 158
does not change the valuation coefficient on previously disclosed off-balance-sheet pension
liabilities. However, after taking into account institutional ownership and analyst following, I find
that the value relevance of off-balance-sheet pension liabilities under SFAS No. 87 depends on
institutional ownership and analyst following. Specifically, off-balance-sheet pension liabilities are
more value relevant for firms with a higher level of institutional ownership or analyst following.
More importantly, I find that SFAS No. 158 increases the value relevance of previously disclosed
off-balance-sheet pension liabilities for firms with a low level of institutional ownership or analyst
following, and that the increase in the value relevance becomes less pronounced for firms with a
higher level of institutional ownership or analyst following.
My results are robust to various specifications, and are not driven by other concurrent
regulation changes, such as the measurement date provision of SFAS No. 158 and the Pension
Protection Act of 2006. Additional analysis shows that for firms with a higher level of institutional
1 Washington Trust Bank (2006). In addition, PricewaterhouseCoopers states that ‘‘[w]e note that generally thefinancial analyst community currently uses the PBO and APBO measures when developing equity values anddetermining credit ratings’’ (Comment letter #87 to the exposure draft of SFAS No. 158). Moody’s ratingmethodology adjusts a company’s balance sheet by recording as a debt the unfunded status, measured as thedifference between the PBO and the fair value of pension assets, and removes all the pension assets andliabilities recognized under GAAP (Moody’s Investor Services 2006).
1096 Yu
The Accounting ReviewMay 2013
ownership or analyst following, the mispricing of the off-balance-sheet pension liabilities in the
pre-158 period is smaller and the decrease in the mispricing following SFAS No. 158 is less
pronounced, consistent with the view that off-balance-sheet pension liabilities are more likely to be
already reflected in stock prices for firms with a higher level of institutional ownership or analyst
following in the pre-158 period.
My paper contributes to the literature in the following ways. First, this study contributes to the
literature on recognition versus disclosure (e.g., Davis-Friday et al. 1999; Ahmed et al. 2006) by
suggesting that the difference in value relevance between disclosure and recognition depends on
institutional ownership and analyst following. This study highlights the importance and necessity of
considering institutional ownership and analyst following in the value-relevance research.
Researchers might draw incorrect inferences that recognition versus disclosure does not matter,
if they fail to take into account valuation differences between disclosure and recognition associated
with different levels of institutional ownership and analyst following.
Closely related to this study, Mitra and Hossain (2009; hereafter, MH) document a negative
association between stock returns and pension transition adjustments in the initial adoption year of
SFAS No. 158 (i.e., year 2006), which is inconsistent with my result that SFAS No. 158 does not
change the value relevance of previously disclosed off-balance-sheet pension liabilities without
considering institutional ownership and analyst following. Furthermore, they find that the negative
association is driven by large S&P 500 firms, suggesting that the impact of SFAS No. 158 on the
value relevance of off-balance-sheet pension liabilities depends on firm size.
I attribute these different findings to differences between the two samples, as well as
differences in the variable sets and the research methods. These differences are explored in the
‘‘Additional Analyses’’ section. My study examines the change in the value relevance of
off-balance-sheet pension liabilities following SFAS No. 158 from a perspective different from that
of the MH paper. In particular, this study documents differences in the valuation of
off-balance-sheet pension liabilities associated with institutional ownership and analyst following,
and these valuation differences cannot be explained by the size effect documented in the MH paper.
Second, this study also complements the literature on the market valuation of disclosed pension
information. Several earlier studies (Barth 1991; Gopalakrishnan 1994) suggest that investors treat
disclosed pension information similarly to recognized pension information. In contrast, more recent
studies (Franzoni and Marin 2006; Picconi 2006) suggest that investors may have difficulty in
understanding pension information disclosed in the footnotes, but not that recognized in the
financial statements. My study suggests that these contradictory findings may result from prior
literature’s failure to consider valuation differences across different levels of institutional ownership
and analyst following.
This study is subject to several caveats. First, although this study documents valuation
differences across different levels of institutional ownership and analyst following, my research
design cannot provide evidence on how institutional ownership and analyst following function to
affect information processing. Second, it is not clear from my results whether investors of firms
with a low level of institutional ownership or analyst following ignore disclosed pension
information or they notice the information but do not use it.2 These are interesting questions left for
future research.
Next, Section II reviews previous literature and describes the institutional background. Section
III outlines the research methodology. The sample is described in Section IV. Section V reports
2 Investors may not use disclosed pension information, either because they cannot understand it or because theyperceive it to be unreliable.
Does Recognition versus Disclosure Affect Value Relevance? Evidence from Pension Accounting 1097
The Accounting ReviewMay 2013
main empirical results and provides the explanations of the results. Additional analyses are
presented in Section VI. Section VII summarizes the paper and provides concluding remarks.
II. PRIOR RESEARCH AND INSTITUTIONAL BACKGROUND
Literature Review
Prior literature suggests two reasons for why users may treat disclosed and recognized
information differently. One stream of the literature suggests that recognized information is more
reliable than disclosed information (e.g., Davis-Friday et al. 2004; Libby et al. 2006). Davis-Friday
et al. (2004) find that the market perceives disclosed post-retirement benefits (PRB) liabilities as
less reliable than recognized PRB liabilities. Libby et al. (2006) find that auditors tolerate less
misstatement of recognized items than disclosed items. Frederickson et al. (2006) find that
mandatory income statement recognition of stock option expenses leads to higher user assessments
of reliability than either voluntary income statement recognition or voluntary footnote disclosure.
Another stream of the literature suggests that the differential treatment of disclosed versus
recognized information is due to information-processing-related factors (e.g., Barth et al. 2003;
Hirshleifer and Teoh 2003). In particular, users may treat disclosed and recognized items differently
because they lack competence to understand disclosure (e.g., Dearman and Shields 2005), pay
limited attention to disclosure (Hirshleifer and Teoh 2003), or are subject to cognitive biases
unrelated to user competence when processing disclosed information (e.g., Koonce et al. 2005;
Hobson and Kachelmeier 2005). Consistent with this view, experimental studies provide evidence
that users discount or ignore disclosed information, but not recognized information.3 For example,
users are more likely to understand information recognized in the income statement than
information presented more like a disclosure (disclosed in the statement of changes in stockholders’
equity) or disclosed in the footnotes (e.g., Maines and McDaniel 2000; Hirst and Hopkins 1998;
Hirst et al. 2004).
Pension Accounting under SFAS No. 87 and 158
In December 1985, FASB issued SFAS No. 87, Employers’ Accounting for Pensions. Under
SFAS No. 87, certain changes in pension liabilities and pension assets were not recognized as they
occurred, but recognized systematically and gradually in the following periods. These changes
include four items: (1) prior service costs, (2) unexpected return on pension assets, (3) actuarial
gains or losses, and (4) net transition assets or liabilities. Off-balance-sheet pension liabilities
disclosed under SFAS No. 87 are the sum of unrecognized prior service costs, unrecognized gains
or losses, and unrecognized net transition assets or liabilities. Net pension assets or liabilities
recognized on the balance sheet under SFAS No. 87 are the funded status of a pension plan adjusted
for off-balance-sheet pension liabilities.4
SFAS No. 158 requires a company to recognize its funded status as net pension assets or
liabilities on the balance sheet, and the previously disclosed off-balance-sheet pension liabilities
(i.e., the sum of unrecognized prior service costs, unrecognized gains or losses, and unrecognized
net transition assets or liabilities, pursuant to SFAS No. 87) as a component of other comprehensive
income (OCI). Since the funded status is the sum of the previously recognized accrued or prepaid
3 Although yielding rich insights into the differences between recognition and disclosure, experimental studiesgenerally focus on one group of experimental subjects, and the results may not generalize to the associationbetween stock prices and disclosed versus recognized items.
4 Under SFAS No. 87, for firms with underfunded accumulated benefit obligation (ABO), the firm had to recognize anadditional minimum liability, equal to the excess of underfunded ABO over the accrued or prepaid pension cost on thebalance sheet if (1) an asset had been recognized as the prepaid pension cost, or (2) the accrued pension cost was lessthan the underfunded ABO, or (3) no accrued or prepaid pension cost had been recognized.
1098 Yu
The Accounting ReviewMay 2013
pension cost and the previously disclosed off-balance-sheet pension liabilities, SFAS No. 158
essentially requires a company to recognize the previously disclosed pension liabilities aggregately
with the previously recognized pension liabilities on the balance sheet by an adjustment to OCI.5
SFAS No. 158 does not change the measurement of pension expenses recognized in the income
statement.
III. RESEARCH METHODOLOGY
Barth et al. (2001) suggest that a levels model should be used if researchers intend to
investigate what is reflected in firm value, while a changes model is appropriate if the timeliness of
accounting amounts is part of the research question. My study involves determining how SFAS No.
158 changes the way off-balance-sheet pension liabilities are reflected in firm value, suggesting that
a levels approach may be more appropriate for my research question. In addition, Kothari and
Zimmerman (1995) argue that although a levels model is more likely to have econometric
problems, such as omitted variables, when compared to a changes model, the levels model is
economically better specified.6 Consistent with prior pension research (Landsman 1986; Barth
1991; Barth et al. 1992; Hann et al. 2007a; Hann et al. 2007b), I use levels models in my main
analyses, and report the results based on changes models in the sensitivity analysis section. Table 1
provides the detailed definition of the main variables used in my analysis.
Levels Model without Considering Institutional Ownership and Analyst Following
Consistent with Hann et al. (2007a) and Hann et al. (2007b), the following model is used to
examine whether SFAS No. 158 increases the value relevance of the previously disclosed off-
balance-sheet pension liabilities without considering institutional ownership and analyst following:7
MVit ¼ a0 þ a1POST þ a2NPTAit þ a3NPTLit þ a4ONBLit þ a5OFFBLit
þ a6POST�OFFBLit þ a7PX þ a8NI-PX þ a9RDþ a10GRW þ eit: ð1Þ
MVit is the market value of firm i three months after the fiscal year-end of year t (hereafter I drop the
subscripts), NPTA is non-pension total assets, and NPTL is non-pension total liabilities. ONBL is
accrued pension liabilities or prepaid pension assets defined by SFAS No. 87 in both pre-158 and
post-158 periods. OFFBL is the sum of unamortized prior service costs, unamortized gains or
losses, and unamortized net transition assets defined by SFAS No. 87 in both pre-158 and post-158
periods. OFFBL (ONBL) is coded as a positive number if it is a net liability, and as a negative
number if it is a net asset.8 Excluding the observations with net off-balance-sheet assets does not
5 I randomly select a sample of 100 firms with defined benefit pension plans, and find that only 22 (12) firms reportpension liabilities as a single item on the balance sheet in the pre-158 (post-158) period. This suggests that forthe majority of the firms, pension liabilities may be aggregated with other liability items and investors may notknow the exact amount of recognized pension liabilities without looking at the footnotes.
6 The variables of interest in this study are the interactions among POST, INS, and OFFBL. Nizalova andMurtazashvili (2011) suggest that although the main effect of OFFBL may be subject to the omitted variablebias, interactions terms are likely to be consistent if the endogenous factor (OFFBL) and the omitted variable arejointly independent of the treatment or policy variable (INS and POST).
7 I do not have any specific predictions regarding the theoretical values of the coefficients on assets and liabilitiesin the value relevance models. Barth (1994) argues that only if the accounting variables in the value relevancemodels equal the amounts implicit in stock prices and there are no omitted variables, the coefficients shouldequal 1. However, since the book value of assets and liabilities is unlikely to equal the market value of assets andliabilities, the coefficients on assets and liabilities in the models are unlikely to be 1.
8 For my levels sample, OFFBL is a net off-balance-sheet pension asset for 1,603 out of 7,887 observations, and ONBL isa net on-balance-sheet pension asset for 3,656 out of 7,887 observations. This coding method allows OFFBL (ONBL) tohave a negative valuation multiple in the value-relevance regression, regardless of whether it is a net asset or netliability. This treatment is also consistent with prior research (Hann et al. 2007a; Picconi 2006).
Does Recognition versus Disclosure Affect Value Relevance? Evidence from Pension Accounting 1099
The Accounting ReviewMay 2013

change my main results qualitatively.9 POST is a dummy variable equal to 1 if the firm adopts
SFAS No. 158, otherwise is equal to 0. If SFAS No. 158 increases the value relevance of previously
disclosed off-balance-sheet pension liabilities, then a6 should be negative.
I include net periodic pension cost (PX) and income before net periodic pension cost (NI-PX),
research and development expense (RD), growth opportunities (GRW), year dummies, and firm
dummies as the control variables in model (1). Ohlson (1995) suggests that the correct specification
of a levels model is one that includes both the book value of equity and income. I decompose net
income into net periodic pension cost (PX) and income before net periodic pension cost (NI-PX) to
TABLE 1
Variable Definitions
MV market value three months after fiscal year-end;
NPTA non-pension total assets, equal to (1) Compustat item AT � PCPPAO if PCPPAO . 0,
and AT otherwise for firm-years before application of SFAS No. 158; (2) Compustat
item AT � PBALT for firm-years after application of SFAS No. 158;
NPTL non-pension total liabilities, equal to (1) Compustat item LT þ PCPPAO if PCPPAO , 0,
and LT otherwise for firm-years before application of SFAS No. 158; (2) Compustat
item LT � PBLC � PBLLT for firm-years after application of SFAS No. 158;
PA fair value of pension assets (Compustat item PPLAO);
PBO Compustat item PBPRO;
UNFUND funded status (PBO � PA);
ONBL accrued/prepaid pension cost, equal to (1) PBO � PA � OFFBL before application of
SFAS No. 158; (2) PBO � PA � OFFBL if PCUPSO and POAJO are not missing, and
PPC � PBEC � last year’s PCPPAO � last year’s PADDML otherwise after
application of SFAS No. 158;
OFFBL off-balance-sheet pension liabilities, equal to (1) Compustat item PCUPSO þ POAJO if
PCUPSO and POAJO are not missing; and (2) PBO � PA � ONBL otherwise;
INS scaled rank of institutional ownership and analyst following, calculated by ranking the
variables into ten groups (0 to 9) by decile points and dividing the group number by 9
so that the scaled rank ranges between 0 and 1;
INST institutional ownership, defined as the percentage of common shares held by institutions at
the end of the calendar quarter closest to firms’ fiscal year-end obtained from CDA/
Spectrum. The percentage of common shares held by institutions at the end of a
calendar quarter is calculated as the sum of a firm’s shares held by each institution
divided by total outstanding common shares;
NUMEST analyst following, defined as the number of analysts following a firm at fiscal year-end
obtained from I/B/E/S;
POST equal to 1 for fiscal year-ending after December 15, 2006, and 0 otherwise;
PX net periodic pension cost (Compustat item PPC);
NI-PX income before extraordinary items and net periodic pension cost, equal to Compustat item
IB � PPC;
RD research and development expenses, equal to Compustat item XRD if XRD is not missing,
and 0 otherwise; and
GRW sales growth, equal to the change in the sales (Compustat item SALE) deflated by sales for
the previous year.
9 Throughout this paper, I use ‘‘does not change my main results qualitatively’’ to indicate that the signs andsignificance levels of the coefficients on the key interactions (INS � OFFBL, POST � OFFBL, and POST � INS �OFFBL) are consistent with those reported in Table 4.
1100 Yu
The Accounting ReviewMay 2013
allow different valuation coefficients on pension and non-pension income. Consistent with Hann et
al. (2007a) and Hann et al. (2007b), I include RD to reduce the service cost anomaly first
documented by Barth et al. (1992)10 and GRW, measured by sales growth, to control for growth
opportunities not reflected in the financial statements.11 Year dummies and firm dummies are
included to control for fixed year effects and fixed firm effects, respectively. Following Hann et al.
(2007b), all the variables except POST and GRW are deflated by sales in the levels model.
To make sure that the results from model (1) are not driven by the omission of the interactions
between POST and the variables other than OFFBL, I expand model (1) by adding these
interactions and allowing the valuation coefficients on the variables other than OFFBL to vary
between pre- and post-158 periods:
MVit ¼ b0 þ b1POST þ b2NPTAit þ b3NPTLit þ b4ONBLit þ b5POST�ONBLþ b6OFFBLit
þ b7POST�OFFBLit þ b8PX þ b9POST�PX þ b10NI-PX þ b11RDþ b12GRWþ b13POST�NPTAþ b14POST�NPTL þ b15POST�NI-PX þ b16POST�RDþ b17POST�GRW þ eit:
ð2Þ
Levels Model Considering Institutional Ownership and Analyst Following
I use the following model to examine whether institutional ownership and analyst following
affect the value relevance of previously disclosed off-balance-sheet pension liabilities and whether
the difference in value relevance between recognition and disclosure depends on institutional
ownership and analyst following:
MVit ¼ h0 þ h1POST þ h2INSit þ h3NPTAit þ h4NPTLit þ h5ONBLit þ h6INS�ONBLþ h7POST�ONBL þ h8POST�INS�ONBLþ h9OFFBLit þ h10INSit�OFFBLit
þ h11POST�OFFBLit þ h12POST�INSit�OFFBLit þ h13PXit þ h14INSit�PXit
þ h15POST�PXit þ h16POST�INSit�PXit þ h17NI-PX þ h18RDþ h19GRWþ h20INS�NPTAþ h21POST�NPTA þ h22POST�INS�NPTAþ h23INS�NPTLþ h24POST�NPTLþ h25POST�INS�NPTLþ h26INS�NI-PX þ h27POST�NI-PXþ h28POST�INS�NI-PX þ h29INS�RDþ h30POST�RDþ h31POST�INS�RDþ h32INS�GRW þ h33POST�GRW þ h34POST�INS�GRW þ eit: ð3Þ
Following the prior literature (e.g., Bhushan 1994; Walther 1997; Collins et al. 2003), I use the
rank of institutional ownership or analyst following to facilitate the interpretation of the results and
to allow for a nonlinear association between institutional ownership (analyst following) and value
relevance. In particular, I calculate the scaled rank of institutional ownership or analyst following
for each firm by ranking these variables into ten groups (0 to 9) by decile points and dividing the
group number by 9, so that the scaled rank ranges between 0 and 1.12 INS is the scaled rank of
either institutional ownership (INST) or analysts following (NUMEST). NUMEST is defined as the
10 Hann et al. (2007a) and Hann et al. (2007b) also include number of employees (EMP) to control for the servicecost anomaly. Because both EMP and RD are used to control the same effect, I exclude EMP in my main analysesto avoid deleting firms simply because of missing values for number of employees. Including EMP and theinteractions among POST, INS, and EMP as additional control variables does not change my main resultsqualitatively.
11 Using the market-to-book ratio to measure growth opportunities does not change my main results qualitatively.12 The main effect of INS measures the association between MV and INS when other independent variables except
POST in model (3) are zero. The interpretation of this main effect is potentially misleading, because the otheraccounting variables are generally not zero in the sample.
Does Recognition versus Disclosure Affect Value Relevance? Evidence from Pension Accounting 1101
The Accounting ReviewMay 2013
number of analysts following a firm at the fiscal year-end.13 The other variables are as defined in
model (1). The interactions among POST, INS, and the non-pension variables, and fixed year and
firm effects are included but not reported.
The coefficients of interest are h9, h10, h11, and h12. h9 measures the value relevance of off-
balance-sheet pension liabilities for firms with the lowest INS rank (INS¼ 0) in the pre-158 period.
h10 measures the incremental effect of INS on the value relevance of off-balance-sheet pension
liabilities in the pre-158 period. h11 measures the change in the value relevance of off-balance-sheet
pension liabilities due to SFAS No. 158 for firms with the lowest INS rank. h12 measures the
incremental effect of INS on the change in the value relevance of off-balance-sheet pension
liabilities due to SFAS No. 158.
Because INS ranges between 0 and 1, the sum of the coefficients on OFFBL and INS � OFFBL(h9þ h10) represents the value relevance of OFFBL for firms with the highest INS rank (INS¼ 1) in
the pre-158 period, and the sum of the coefficients on POST � OFFBL and POST � INS � OFFBL(h11þ h12) represents the change in the value relevance of OFFBL due to SFAS No. 158 for firms
with the highest INS rank. If off-balance-sheet pension liabilities have been fully understood in the
pre-158 period for firms with the highest INS rank, then SFAS No. 158 should have no impact on
the value relevance of OFFBL for these firms. Therefore, the sum of the coefficients on OFFBL and
INS � OFFBL (h9þh10) should be negative, and the sum of the coefficients on POST � OFFBL and
POST � INS � OFFBL (h11 þ h12) should be zero.
IV. SAMPLE SELECTION AND DESCRIPTIVE STATISTICS
My initial sample consists of all the firm-year observations from 1999 to 2007 in Compustat
Fundamentals Annual database. I select 1999 as the beginning fiscal year of the pre-SFAS No. 158
period to control for the possible effect of SFAS No. 132 on investors’ valuation of pension
liabilities.14 I then obtain pension information from the Compustat Pension database, institutional
ownership from CDA/Spectrum S34, analyst following from I/B/E/S, and stock prices three months
after fiscal year-end from CRSP. I delete all the observations with missing values needed for stock
prices. I eliminate foreign firms, firms not traded on NYSE, AMEX, and NASDAQ, and firms
without defined benefit pension plans. I also eliminate observations with missing values to calculate
independent variables. I only include firms with both pre- and post-158 data available so that the
same set of firms is compared between the pre- and post-158 periods. Finally, I delete all the
financial firms with two-digit SIC codes from 60 to 69.15 The final sample includes 7,887
observations with 991 unique firms.
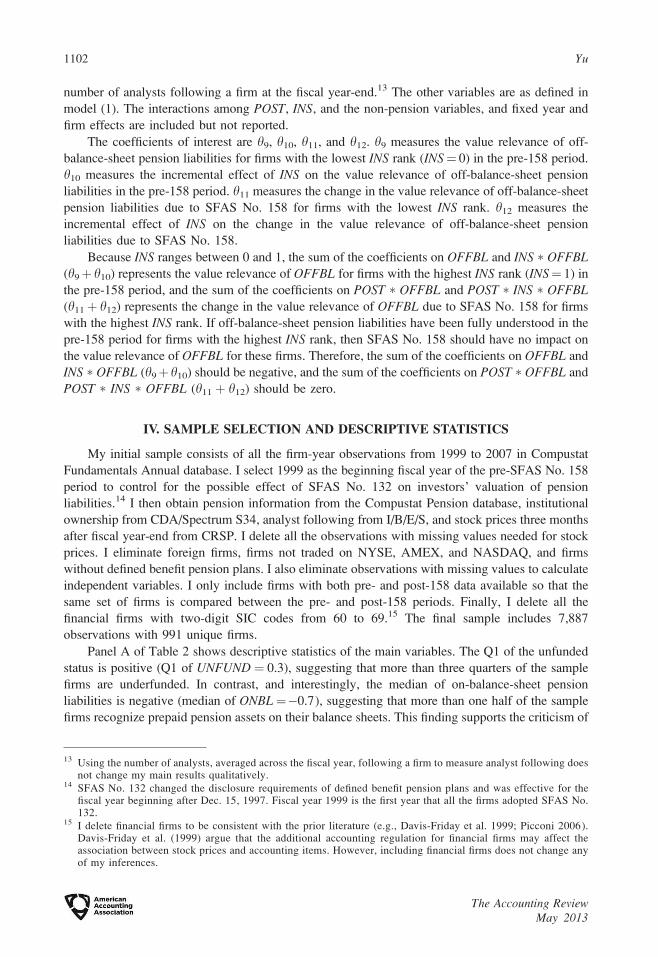
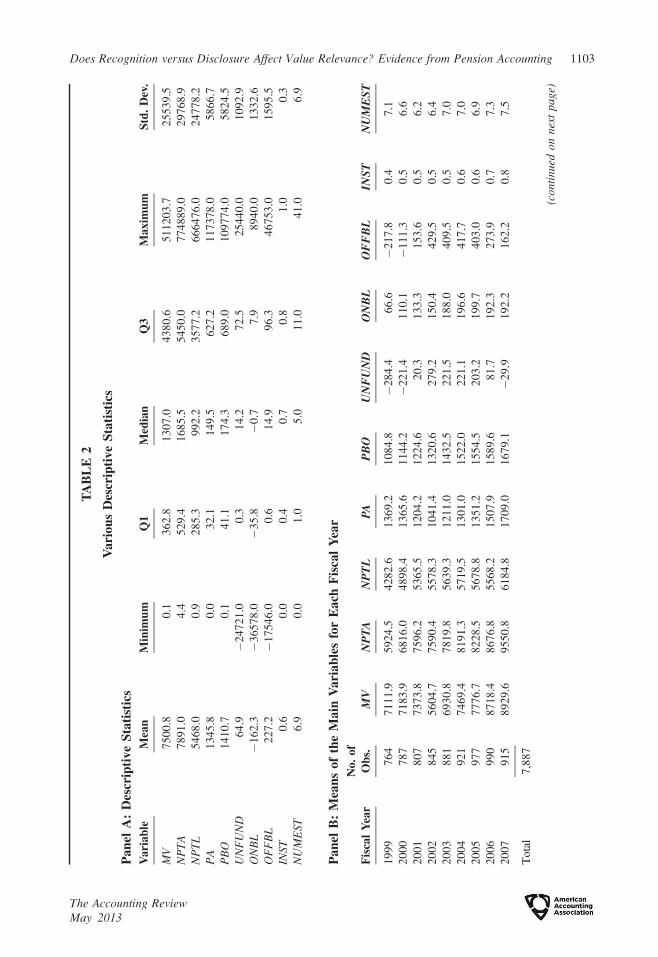
Panel A of Table 2 shows descriptive statistics of the main variables. The Q1 of the unfunded
status is positive (Q1 of UNFUND¼ 0.3), suggesting that more than three quarters of the sample
firms are underfunded. In contrast, and interestingly, the median of on-balance-sheet pension
liabilities is negative (median of ONBL¼�0.7), suggesting that more than one half of the sample
firms recognize prepaid pension assets on their balance sheets. This finding supports the criticism of
13 Using the number of analysts, averaged across the fiscal year, following a firm to measure analyst following doesnot change my main results qualitatively.
14 SFAS No. 132 changed the disclosure requirements of defined benefit pension plans and was effective for thefiscal year beginning after Dec. 15, 1997. Fiscal year 1999 is the first year that all the firms adopted SFAS No.132.
15 I delete financial firms to be consistent with the prior literature (e.g., Davis-Friday et al. 1999; Picconi 2006).Davis-Friday et al. (1999) argue that the additional accounting regulation for financial firms may affect theassociation between stock prices and accounting items. However, including financial firms does not change anyof my inferences.
1102 Yu
The Accounting ReviewMay 2013
TA
BL
E2
Va
rio
us
Des
crip
tiv
eS
tati
stic
s
Pa
nel
A:
Des
crip
tiv
eS
tati
stic
s
Va
ria
ble
Mea
nM
inim
um
Q1
Med
ian
Q3
Ma
xim
um
Std
.D
ev.
MV
75
00
.80
.13
62
.81
30
7.0
43
80
.65
11
20
3.7
25
53
9.5
NP
TA
78
91
.04
.45
29
.41
68
5.5
54
50
.07
74
88
9.0
29
76
8.9
NP
TL
54
68
.00
.92
85
.39
92
.23
57
7.2
66
64
76
.02
47
78
.2
PA
13
45
.80
.03
2.1
14
9.5
62
7.2
11
73
78
.05
86
6.7
PB
O1
41
0.7
0.1
41
.11
74
.36
89
.01
09
77
4.0
58
24
.5
UN
FU
ND
64
.9�
24
72
1.0
0.3
14
.27
2.5
25
44
0.0
10
92
.9
ON
BL
�1
62
.3�
36
57
8.0
�3
5.8
�0
.77
.98
94
0.0
13
32
.6
OF
FB
L2
27
.2�
17
54
6.0
0.6
14
.99
6.3
46
75
3.0
15
95
.5
INST
0.6
0.0
0.4
0.7
0.8
1.0
0.3
NU
ME
ST6
.90
.01
.05
.01
1.0
41
.06
.9
Pa
nel
B:
Mea
ns
of
the
Ma
inV
ari
ab
les
for
Ea
chF
isca
lY
ear
Fis
cal
Yea
rN
o.
of
Ob
s.M
VN
PT
AN
PT
LP
AP
BO
UN
FU
ND
ON
BL
OF
FB
LIN
ST
NU
ME
ST
19
99
76
47
11
1.9
59
24
.54
28
2.6
13
69
.21
08
4.8
�2
84
.46
6.6
�2
17
.80
.47
.1
20
00
78
77
18
3.9
68
16
.04
89
8.4
13
65
.61
14
4.2
�2
21
.41
10
.1�
11
1.3
0.5
6.6
20
01
80
77
37
3.8
75
96
.25
36
5.5
12
04
.21
22
4.6
20
.31
33
.31
53
.60
.56
.2
20
02
84
55
60
4.7
75
90
.45
57
8.3
10
41
.41
32
0.6
27
9.2
15
0.4
42
9.5
0.5
6.4
20
03
88
16
93
0.8
78
19
.85
63
9.3
12
11
.01
43
2.5
22
1.5
18
8.0
40
9.5
0.5
7.0
20
04
92
17
46
9.4
81
91
.35
71
9.5
13
01
.01
52
2.0
22
1.1
19
6.6
41
7.7
0.6
7.0
20
05
97
77
77
6.7
82
28
.55
67
8.8
13
51
.21
55
4.5
20
3.2
19
9.7
40
3.0
0.6
6.9
20
06
99
08
71
8.4
86
76
.85
56
8.2
15
07
.91
58
9.6
81
.71
92
.32
73
.90
.77
.3
20
07
91
58
92
9.6
95
50
.86
18
4.8
17
09
.01
67
9.1
�2
9.9
19
2.2
16
2.2
0.8
7.5
To
tal
7,8
87
(con
tinu
edo
nn
ext
pa
ge)
Does Recognition versus Disclosure Affect Value Relevance? Evidence from Pension Accounting 1103
The Accounting ReviewMay 2013
TA
BL
E2
(co
nti
nu
ed)
Pan
elC
:P
ears
on
an
dS
pea
rman
Corr
elati
on
MV
NP
TA
NP
TL
PA
PB
OU
NF
UN
DO
NB
LO
FF
BL
INS
TN
UM
ES
T
MV
0.8
8*
**
0.8
1*
**
0.7
0*
**
0.7
2*
**
0.3
2*
**
�0
.23
**
*0
.43
**
*0
.32
**
*0
.74
**
*
NP
TA
0.7
2*
**
0.9
8*
**
0.8
0*
**
0.8
3*
**
0.3
7*
**
�0
.21
**
*0
.47
**
*0
.20
**
*0
.63
**
*
NP
TL
0.6
0*
**
0.9
7*
**
0.8
1*
**
0.8
4*
**
0.3
7*
**
�0
.22
**
*0
.47
**
*0
.16
**
*0
.58
**
*
PA
0.5
1*
**
0.7
2*
**
0.7
5*
**
0.9
9*
**
0.3
1*
**
�0
.39
**
*0
.51
**
*0
.12
**
*0
.45
**
*
PB
O0
.49
**
*0
.71
**
*0
.74
**
*0
.98
**
*0
.42
**
*�
0.3
3*
**
0.5
7*
**
0.1
5*
**
0.4
7*
**
UN
FU
ND
�0
.12
**
*�
0.0
7*
**
�0
.08
**
*�
0.1
3*
**
0.0
6*
**
0.1
9*
**
0.7
0*
**
0.2
0*
**
0.2
0*
**
ON
BL
�0
.34
**
*�
0.6
2*
**
�0
.68
**
*�
0.8
6*
**
�0
.84
**
*0
.15
**
*�
0.3
2*
**
0.0
0�
0.1
8*
**
OF
FB
L0
.20
**
*0
.47
**
*0
.51
**
*0
.63
**
*0
.74
**
*0
.56
**
*�
0.7
4*
**
0.2
1*
**
0.3
1*
**
INST
0.0
1�
0.0
1�
0.0
10
.01
0.0
10
.03
**
*�
0.0
20
.03
**
*0
.49
**
*
NU
ME
ST0
.42
**
*0
.28
**
*0
.22
**
*0
.26
**
*0
.26
**
*0
.02
*�
0.1
7*
**
0.1
5*
**
0.4
0*
**
***
Den
ote
signifi
cance
of
coef
fici
ents
atth
e1
per
cent
level
,usi
ng
atw
o-t
aile
dte
st.
The
sam
ple
incl
udes
7,8
87
obse
rvat
ions
wit
h991
firm
s.A
llth
evar
iable
sar
edefi
ned
inT
able
1.
Pan
elA
report
sth
edes
crip
tive
stat
isti
csfo
rth
em
ain
var
iable
s.A
llof
the
des
crip
tive
stat
isti
csar
ein
mil
lion
doll
ars,
exce
pt
those
for
INST
and
NU
ME
ST
.P
anel
Bre
port
sth
em
eans
of
the
mai
nvar
iable
sfo
rea
chfi
scal
yea
rin
the
sam
ple
.P
anel
Cre
port
sco
rrel
atio
nco
effi
cien
tsof
the
mai
nvar
iable
s.T
he
upper
and
low
erdia
gonal
ssh
ow
the
Spea
rman
and
Pea
rson
corr
elat
ions,
resp
ecti
vel
y.
1104 Yu
The Accounting ReviewMay 2013
pension accounting under SFAS No. 87 that a net pension asset could be reported on the balance
sheet for an underfunded defined benefit pension plan.
Panel B of Table 2 shows the means of the main variables for each fiscal year. There was a
sharp decrease in the mean of the market value of equity in 2002, due to the stock market downturn
of 2002. While the mean fair value of pension assets reached the lowest point in 2002 during the
nine-year sample period, the mean value of the PBO has been increasing from year to year.
Consequently, the mean unfunded status is the largest in 2002. Interestingly, the unfunded status
improved significantly in 2006 and 2007, and the mean fair value of pension assets exceeded the
mean PBO in fiscal year 2007, likely due to the accelerated funding requirement of the Pension
Protection Act of 2006 and the recognition requirement of SFAS No. 158.
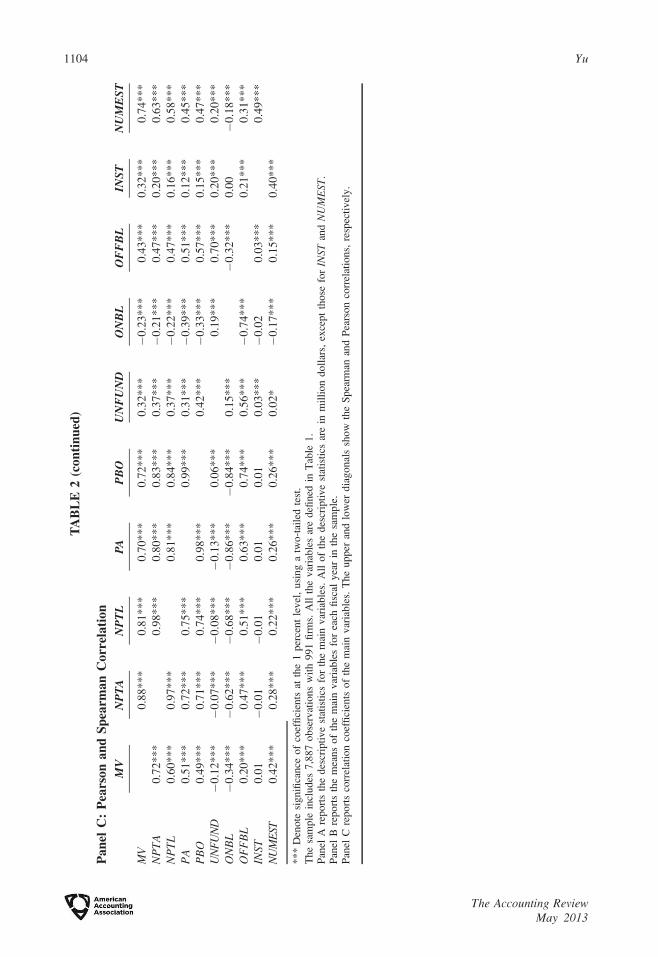
Panel C of Table 2 reports the correlation coefficients of the main variables. Spearman
(Pearson) correlations are shown above (below) the diagonal. The market value of equity (MV) is
positively correlated with NPTL and OFFBL, suggesting the existence of the scale effect and the
importance of controlling for other accounting items. Davis-Friday et al. (1999) document a similar
result that the market value is positively correlated with various liability variables, and attribute the
result to the failure to control for the other variables, especially the book value of assets, when
calculating the individual correlations with the market value. Furthermore, institutional ownership
and analyst following are positively correlated (Pearson correlation ¼ 0.40 and Spearman
correlation ¼ 0.49), consistent with O’Brien and Bhushan’s (1990) argument that analysts are
motivated to follow firms with higher institutional ownership because of the information demand by
institutions, and institutional investors are attracted to invest in firms with more analysts because of
the marketing of the brokerage service.
The Pearson correlations between INS (INST or NUMEST) and the other variables except
ONBL are generally smaller or insignificant compared to the corresponding Spearman correlations.
Pearson correlations assume that the relation between two variables is linear, while Spearman
correlations accommodate a nonlinear relation. The difference between the Pearson and Spearman
correlations between MV and INS suggests that the relation between MV and INS may not be linear
and thus using the rank of INS may be more appropriate for my analysis.16 Furthermore, the
positive correlation between institutional ownership (analyst following) and MV or PBO suggests
that it is important to rule out the alternative explanation of the value relevance of recognition
versus disclosure depending on firm size or pension plan size. This issue is examined in the
‘‘Additional Analyses’’ section.
V. EMPIRICAL RESULTS
Main Results
Table 3 presents the results of the value-relevance tests without considering institutional
ownership and analyst following. Panel A of Table 3 reports the estimation results based on models
(1) and (2). The coefficient on OFFBL is not significant (t-statistic¼�0.77 and�1.26 in models (1)
and (2), respectively), suggesting that investors appear to ignore off-balance-sheet pension
liabilities disclosed in the footnotes. The coefficient on POST � OFFBL is not significantly different
16 Prior research either uses a log transformation of the market value (e.g., Gompers and Metrick 2001) or convertsINS into ranks (e.g., Ayers and Freeman 2003) to address the nonlinear effect of INS on the market value or othervariables. Consistent with prior research, the natural logarithm of MV is positively correlated with bothinstitutional ownership (Pearson correlation ¼ 0.35 and Spearman correlation ¼ 0.32) and analyst following(Pearson correlation¼ 0.72 and Spearman correlation¼0.74) at the 0.01 significance level for my sample. Usingthe log transformation of MV results in the Pearson correlations similar to the Spearman correlations, and doesnot change the Spearman correlation between the market value and INS.
Does Recognition versus Disclosure Affect Value Relevance? Evidence from Pension Accounting 1105
The Accounting ReviewMay 2013
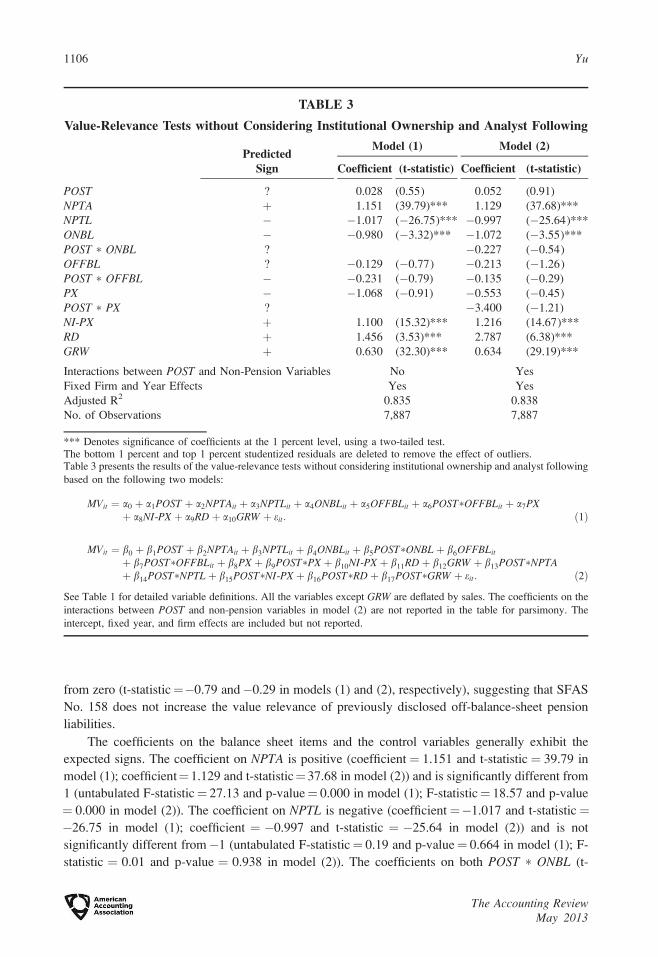
from zero (t-statistic¼�0.79 and�0.29 in models (1) and (2), respectively), suggesting that SFAS
No. 158 does not increase the value relevance of previously disclosed off-balance-sheet pension
liabilities.
The coefficients on the balance sheet items and the control variables generally exhibit the
expected signs. The coefficient on NPTA is positive (coefficient¼ 1.151 and t-statistic ¼ 39.79 in
model (1); coefficient¼1.129 and t-statistic¼37.68 in model (2)) and is significantly different from
1 (untabulated F-statistic¼ 27.13 and p-value¼ 0.000 in model (1); F-statistic¼ 18.57 and p-value
¼ 0.000 in model (2)). The coefficient on NPTL is negative (coefficient¼�1.017 and t-statistic¼�26.75 in model (1); coefficient ¼ �0.997 and t-statistic ¼ �25.64 in model (2)) and is not
significantly different from�1 (untabulated F-statistic¼ 0.19 and p-value¼ 0.664 in model (1); F-
statistic ¼ 0.01 and p-value ¼ 0.938 in model (2)). The coefficients on both POST � ONBL (t-
TABLE 3
Value-Relevance Tests without Considering Institutional Ownership and Analyst Following
PredictedSign
Model (1) Model (2)
Coefficient (t-statistic) Coefficient (t-statistic)
POST ? 0.028 (0.55) 0.052 (0.91)
NPTA þ 1.151 (39.79)*** 1.129 (37.68)***
NPTL � �1.017 (�26.75)*** �0.997 (�25.64)***
ONBL � �0.980 (�3.32)*** �1.072 (�3.55)***
POST � ONBL ? �0.227 (�0.54)
OFFBL ? �0.129 (�0.77) �0.213 (�1.26)
POST � OFFBL � �0.231 (�0.79) �0.135 (�0.29)
PX � �1.068 (�0.91) �0.553 (�0.45)
POST � PX ? �3.400 (�1.21)
NI-PX þ 1.100 (15.32)*** 1.216 (14.67)***
RD þ 1.456 (3.53)*** 2.787 (6.38)***
GRW þ 0.630 (32.30)*** 0.634 (29.19)***
Interactions between POST and Non-Pension Variables No Yes
Fixed Firm and Year Effects Yes Yes
Adjusted R2 0.835 0.838
No. of Observations 7,887 7,887
*** Denotes significance of coefficients at the 1 percent level, using a two-tailed test.The bottom 1 percent and top 1 percent studentized residuals are deleted to remove the effect of outliers.Table 3 presents the results of the value-relevance tests without considering institutional ownership and analyst following
based on the following two models:
MVit ¼ a0 þ a1POST þ a2NPTAit þ a3NPTLit þ a4ONBLit þ a5OFFBLit þ a6POST�OFFBLit þ a7PXþ a8NI-PX þ a9RDþ a10GRW þ eit: ð1Þ
MVit ¼ b0 þ b1POST þ b2NPTAit þ b3NPTLit þ b4ONBLit þ b5POST�ONBLþ b6OFFBLit
þ b7POST�OFFBLit þ b8PX þ b9POST�PX þ b10NI-PX þ b11RDþ b12GRW þ b13POST�NPTAþ b14POST�NPTLþ b15POST�NI-PX þ b16POST�RDþ b17POST�GRW þ eit: ð2Þ
See Table 1 for detailed variable definitions. All the variables except GRW are deflated by sales. The coefficients on the
interactions between POST and non-pension variables in model (2) are not reported in the table for parsimony. The
intercept, fixed year, and firm effects are included but not reported.
1106 Yu
The Accounting ReviewMay 2013
statistic¼�0.54) and POST � PX (t-statistic¼�1.21) are not significant, suggesting that SFAS No.
158 does not change the value relevance of previously recognized pension amounts on average. In
addition, the coefficients on NI-PX, RD, and GRW are significantly positive, suggesting the
importance of controlling for these variables.
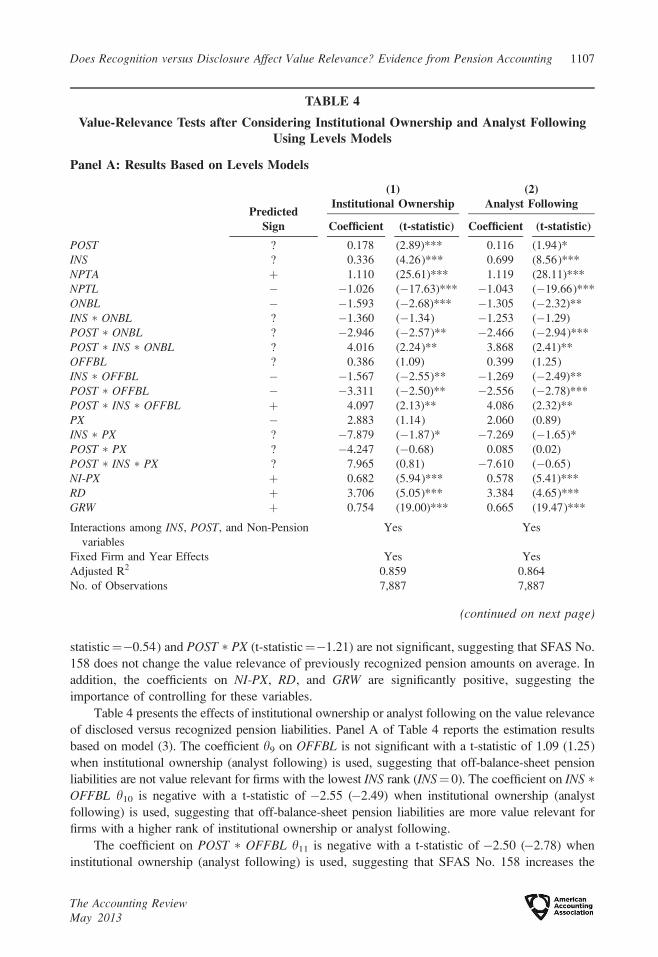
Table 4 presents the effects of institutional ownership or analyst following on the value relevance
of disclosed versus recognized pension liabilities. Panel A of Table 4 reports the estimation results
based on model (3). The coefficient h9 on OFFBL is not significant with a t-statistic of 1.09 (1.25)
when institutional ownership (analyst following) is used, suggesting that off-balance-sheet pension
liabilities are not value relevant for firms with the lowest INS rank (INS¼ 0). The coefficient on INS �OFFBL h10 is negative with a t-statistic of �2.55 (�2.49) when institutional ownership (analyst
following) is used, suggesting that off-balance-sheet pension liabilities are more value relevant for
firms with a higher rank of institutional ownership or analyst following.
The coefficient on POST � OFFBL h11 is negative with a t-statistic of �2.50 (�2.78) when
institutional ownership (analyst following) is used, suggesting that SFAS No. 158 increases the
TABLE 4
Value-Relevance Tests after Considering Institutional Ownership and Analyst FollowingUsing Levels Models
Panel A: Results Based on Levels Models
PredictedSign
(1)Institutional Ownership
(2)Analyst Following
Coefficient (t-statistic) Coefficient (t-statistic)
POST ? 0.178 (2.89)*** 0.116 (1.94)*
INS ? 0.336 (4.26)*** 0.699 (8.56)***
NPTA þ 1.110 (25.61)*** 1.119 (28.11)***
NPTL � �1.026 (�17.63)*** �1.043 (�19.66)***
ONBL � �1.593 (�2.68)*** �1.305 (�2.32)**
INS � ONBL ? �1.360 (�1.34) �1.253 (�1.29)
POST � ONBL ? �2.946 (�2.57)** �2.466 (�2.94)***
POST � INS � ONBL ? 4.016 (2.24)** 3.868 (2.41)**
OFFBL ? 0.386 (1.09) 0.399 (1.25)
INS � OFFBL � �1.567 (�2.55)** �1.269 (�2.49)**
POST � OFFBL � �3.311 (�2.50)** �2.556 (�2.78)***
POST � INS � OFFBL þ 4.097 (2.13)** 4.086 (2.32)**
PX � 2.883 (1.14) 2.060 (0.89)
INS � PX ? �7.879 (�1.87)* �7.269 (�1.65)*
POST � PX ? �4.247 (�0.68) 0.085 (0.02)
POST � INS � PX ? 7.965 (0.81) �7.610 (�0.65)
NI-PX þ 0.682 (5.94)*** 0.578 (5.41)***
RD þ 3.706 (5.05)*** 3.384 (4.65)***
GRW þ 0.754 (19.00)*** 0.665 (19.47)***
Interactions among INS, POST, and Non-Pension
variables
Yes Yes
Fixed Firm and Year Effects Yes Yes
Adjusted R2 0.859 0.864
No. of Observations 7,887 7,887
(continued on next page)
Does Recognition versus Disclosure Affect Value Relevance? Evidence from Pension Accounting 1107
The Accounting ReviewMay 2013
value relevance of previously disclosed off-balance-sheet pension liabilities for firms with the
lowest INS rank. The coefficient on POST � INS � OFFBL h12 is positive with a t-statistic of 2.13
(2.32) when institutional ownership (analyst following) is used, suggesting that the increase in the
value relevance of off-balance-sheet pension liabilities due to SFAS No. 158 is less pronounced for
firms with a higher level of institutional ownership or analyst following.
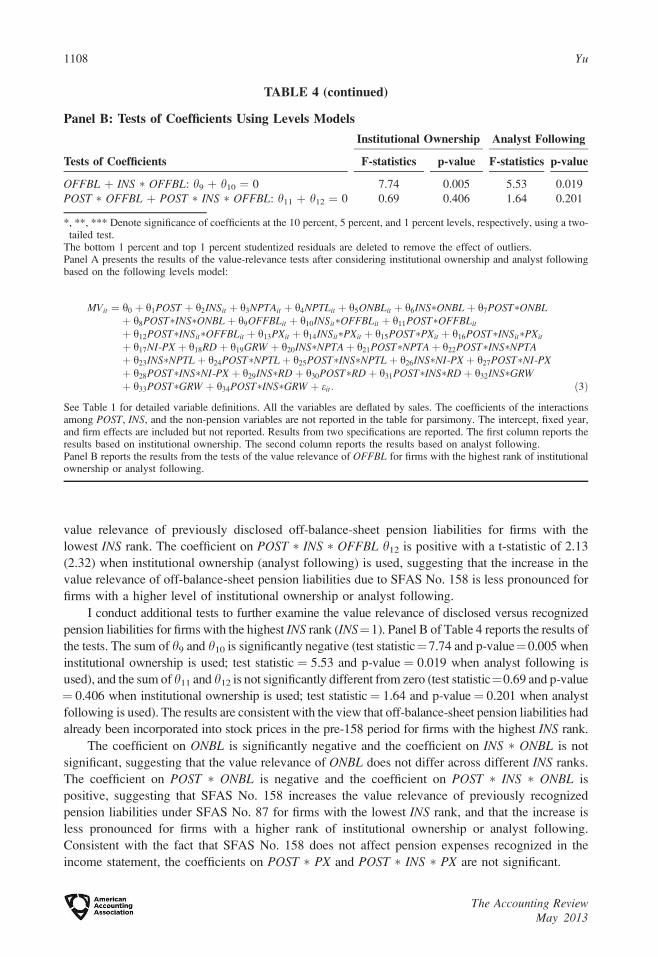
I conduct additional tests to further examine the value relevance of disclosed versus recognized
pension liabilities for firms with the highest INS rank (INS¼1). Panel B of Table 4 reports the results of
the tests. The sum of h9 and h10 is significantly negative (test statistic¼7.74 and p-value¼0.005 when
institutional ownership is used; test statistic ¼ 5.53 and p-value ¼ 0.019 when analyst following is
used), and the sum of h11 and h12 is not significantly different from zero (test statistic¼0.69 and p-value
¼ 0.406 when institutional ownership is used; test statistic¼ 1.64 and p-value¼ 0.201 when analyst
following is used). The results are consistent with the view that off-balance-sheet pension liabilities had
already been incorporated into stock prices in the pre-158 period for firms with the highest INS rank.
The coefficient on ONBL is significantly negative and the coefficient on INS � ONBL is not
significant, suggesting that the value relevance of ONBL does not differ across different INS ranks.
The coefficient on POST � ONBL is negative and the coefficient on POST � INS � ONBL is
positive, suggesting that SFAS No. 158 increases the value relevance of previously recognized
pension liabilities under SFAS No. 87 for firms with the lowest INS rank, and that the increase is
less pronounced for firms with a higher rank of institutional ownership or analyst following.
Consistent with the fact that SFAS No. 158 does not affect pension expenses recognized in the
income statement, the coefficients on POST � PX and POST � INS � PX are not significant.
TABLE 4 (continued)
Panel B: Tests of Coefficients Using Levels Models
Tests of Coefficients
Institutional Ownership Analyst Following
F-statistics p-value F-statistics p-value
OFFBL þ INS � OFFBL: h9 þ h10 ¼ 0 7.74 0.005 5.53 0.019
POST � OFFBL þ POST � INS � OFFBL: h11 þ h12 ¼ 0 0.69 0.406 1.64 0.201
*, **, *** Denote significance of coefficients at the 10 percent, 5 percent, and 1 percent levels, respectively, using a two-tailed test.
The bottom 1 percent and top 1 percent studentized residuals are deleted to remove the effect of outliers.Panel A presents the results of the value-relevance tests after considering institutional ownership and analyst followingbased on the following levels model:
MVit ¼ h0 þ h1POST þ h2INSit þ h3NPTAit þ h4NPTLit þ h5ONBLit þ h6INS�ONBLþ h7POST�ONBLþ h8POST�INS�ONBLþ h9OFFBLit þ h10INSit�OFFBLit þ h11POST�OFFBLit
þ h12POST�INSit�OFFBLit þ h13PXit þ h14INSit�PXit þ h15POST�PXit þ h16POST�INSit�PXit
þ h17NI-PX þ h18RDþ h19GRW þ h20INS�NPTAþ h21POST�NPTAþ h22POST�INS�NPTAþ h23INS�NPTLþ h24POST�NPTLþ h25POST�INS�NPTLþ h26INS�NI-PX þ h27POST�NI-PXþ h28POST�INS�NI-PX þ h29INS�RDþ h30POST�RDþ h31POST�INS�RDþ h32INS�GRWþ h33POST�GRW þ h34POST�INS�GRW þ eit: ð3Þ
See Table 1 for detailed variable definitions. All the variables are deflated by sales. The coefficients of the interactionsamong POST, INS, and the non-pension variables are not reported in the table for parsimony. The intercept, fixed year,and firm effects are included but not reported. Results from two specifications are reported. The first column reports theresults based on institutional ownership. The second column reports the results based on analyst following.Panel B reports the results from the tests of the value relevance of OFFBL for firms with the highest rank of institutionalownership or analyst following.
1108 Yu
The Accounting ReviewMay 2013
Interpretation of the Results
My results are subject to several alternative interpretations. If institutional ownership and
analyst following are indicative of investor sophistication17 (e.g., O’Brien 1988; Walther 1997;
Barth et al. 2003) or firms’ information environment18 (see Beyer et al. [2010] for a review), the
results in Table 4 suggest that stock prices of firms with higher investor sophistication or better
information environment are more likely to reflect disclosed pension liabilities, and are less likely to
be affected by the subsequent recognition of off-balance-sheet pension liabilities. This
interpretation is also consistent with the view that unsophisticated investors have difficulty in
understanding disclosed off-balance-sheet pension liabilities because they lack expertise or pay
limited attention to disclosed information (e.g., Barth et al. 2003; Hirshleifer and Teoh 2003).19
Specifically, the insignificant coefficient on OFFBL suggests that for firms with low investor
sophistication or poor information environment, stock prices do not reflect off-balance-sheet pension
liabilities. The negative coefficient on INS � OFFBL suggests that for firms with higher investor
sophistication or better information environment, stock prices are more likely to incorporate disclosed
pension liabilities. The positive coefficient on POST � INS � OFFBL suggests that recognition of
previously disclosed pension information has a less pronounced impact on the value relevance of
OFFBL for firms with higher investor sophistication or better information environment.
Furthermore, if institutional ownership and analyst following are proxies for investor
sophistication, the negative coefficients on POST � ONBL and POST � OFFBL and the positive
coefficients on POST � INS � ONBL and POST � INS � OFFBL are consistent with Barth et al.’s
(2003) analytical results. Barth et al. (2003) suggest that SFAS No. 158 may change the value
relevance of both the previously recognized item (ONBL) and the previously disclosed item
(OFFBL), and the magnitudes of the changes in the value relevance of ONBL and OFFBL are
negatively associated with investor sophistication.20
Another possible explanation of the results is that the increase in the reliability of off-balance-
sheet pension liabilities due to SFAS No. 158 is larger for firms with lower institutional ownership
or analyst following. While I cannot rule out this alternative explanation, it is not clear why SFAS
No. 158 should increase the reliability of off-balance-sheet pension liabilities significantly and why
this increase differs across different levels of institutional ownership and analyst following.
17 Prior literature suggests that institutional investors and analysts have an advantage in gathering and processinginformation (e.g., Bartov et al. 2000; Ayers and Freeman 2003) and have stronger motivation to build theirexpertise (e.g., Bonner et al. 2003; Callen et al. 2005).
18 The information environment includes the effects of corporate reporting, private information acquisition, andinformation dissemination (Lang et al. 2003). Prior literature suggests that institutional investors and analystsmay increase information efficiency and reduce information asymmetry by acquiring private information (e.g.,El-Gazzar 1998; Balsam et al. 2002; Frankel and Li 2004) and increasing information dissemination (e.g., Honget al. 2000; D’Souza et al. 2010).
19 Several studies suggest that even analysts may not understand information that is not presented directly on thebalance sheet (e.g., Hirst et al. 2004; Picconi 2006). Although contrary to the notion that analyst following isindicative of investor sophistication, this effect should operate against my finding valuation differences acrossdifferent levels of analyst following.
20 Barth et al. (2003) suggest that following SFAS No. 158, the valuation coefficients on ONBL and OFFBL changes
by k1(1� u) and k2(1� u), respectively. k1 ¼r2
y2
r2y1þr2
y2
A1 � A2ð Þ and k2 ¼r2
y1
r2y1þr2
y2
A1 � A2ð Þ þ A2: A1 and A2 are the
coefficients on ONBL and OFFBL, respectively, in the regression of the firm’s terminal value on ONBL andOFFBL. r2
y1and r2
y2are the variances of ONBL and OFFBL respectively. u ranges from 0 to 1, and is
monotonically increasing in investor sophistication. See Barth et al. (2003, Table 3) for details. The magnitudes
of the changes in the value relevance of ONBL and OFFBL are negatively associated with u and investor
sophistication.
Does Recognition versus Disclosure Affect Value Relevance? Evidence from Pension Accounting 1109
The Accounting ReviewMay 2013
Off-balance-sheet pension liabilities possess a unique feature different from other disclosed
items. That is, in the pre-158 period, net pension liabilities are divided into on-balance-sheet
pension liabilities and off-balance-sheet pension liabilities, and the same set of pension assumptions
determines both disclosed and recognized pension amounts.21 Therefore, the reliability of off-
balance-sheet pension liabilities should be similar to that of recognized pension information in both
the pre-158 and post-158 periods.22 In addition, the extensive pension disclosure requirements
under SFAS No. 132 and 132R, such as the reconciliation of the funded status with the amount
recognized, also help decrease the misstatements of off-balance-sheet pension liabilities in the pre-
158 period.23 More importantly, if SFAS No. 158 increases the reliability of OFFBL for all the
firms, then we should observe a significant negative coefficient on POST � OFFBL. The
insignificant coefficient on POST � OFFBL reported in Table 3 suggests that the increase in the
reliability of OFFBL due to SFAS No. 158, if any, is likely to be small.
However, SFAS No. 158 may increase the perceived reliability of off-balance-sheet pension
liabilities, even if the actual reliability remains the same between the pre-158 and post-158 periods.
Frederickson et al. (2006) find that users perceive stock option expenses to be more reliable when
these expenses are moved from footnotes to the income statement with no change in specific inputs,
suggesting that recognition of previously disclosed items may increase user assessments of
reliability, even if the underlying assumptions remain unchanged. Thus, the increase in perceived
reliability due to SFAS No. 158 might, in part, account for the increase in the value relevance of
off-balance-sheet pension liabilities following SFAS No. 158.
VI. ADDITIONAL ANALYSES
Sensitivity Analysis
I perform the following sensitivity tests. First, the results reported in Table 4 may be driven by
the extreme deciles. Thus, I repeat my analysis using the rank based on the tertiles and quintiles of
institutional ownership or analyst following. The untabulated results are qualitatively similar to
those reported in Table 4,24 suggesting that my main findings are unlikely to be driven by extreme
values of institutional ownership or analyst following.
Second, prior literature argues that the results of value-relevance research may be sensitive to
the choice of deflators. I consider the book value of equity and the number of shares outstanding as
alternative deflators in levels models. The book value of equity is affected by certain pension
liabilities through accumulated OCI and pension expenses through retained earnings. Similarly, the
number of shares outstanding affects institutional ownership by definition (i.e., the number of
shares held by institutions divided by the number of shares outstanding). Therefore, the book value
21 This feature does not apply to the setting of SFAS No. 123 or 123R, because stock-based compensation expensewas not divided into a recognized component and a disclosed component in the pre-123 (123R) period.
22 This argument appears to contradict the findings in Libby et al. (2006) that auditors tolerate less misstatements ofrecognized items than disclosed items. I argue that Libby et al.’s (2006) argument is less likely to apply to off-balance-sheet pension liabilities because of the unique feature of off-balance-sheet pension liabilities as well asthe extensive pension disclosure requirements under SFAS No. 132 and 132R.
23 The FASB also expressed a similar view regarding the reliability of disclosed pension liabilities, whenresponding to the concern that ABO or PBO cannot be measured with sufficient reliability. The board argued thatthe measurements of recognized pension items, such as net periodic pension cost or on-balance-sheet pensionliabilities, are no more or less precise than measurements of disclosed pension liabilities, such as ABO or PBO,because they are based on the same assumptions (SFAS No. 87, para. 146).
24 Specifically, when the quintiles (tertiles) of institutional ownership are used, h10 is negative with a p-value of0.046 (0.021), h11 is negative with a p-value of 0.007 (0.008), and h12 is positive with a p-value of 0.020 (0.021).When the quintiles (tertiles) of analyst following are used, h10 is negative with a p-value of 0.009 (0.016), h11 isnegative with a p-value of 0.005 (0.008), and h12 is positive with a p-value of 0.013 (0.012).
1110 Yu
The Accounting ReviewMay 2013
of equity and the number of shares may not be appropriate deflators in models featuring pension
items and institutional ownership as the variables of interest.25 Nevertheless, I repeat my analysis
using the book value of equity and the number of shares outstanding as the deflators. The
untabulated results are qualitatively similar to those reported in Table 4.26
Third, one of the two years in the post-158 period for my sample is the transition year. To
examine whether my results are sensitive to the issue of the transition year, I conduct the value-
relevance tests for two subsamples. The first subsample excludes from the full sample the
observations in year 2007 and the observations in year 2006 if 2006 is not the transition year. The
second subsample excludes the observations in the transition year. Results based on both
subsamples are similar to those reported in Table 4,27 suggesting that my results are due to both the
transition year and the other year in the post-158 period.
Fourth, in addition to requiring an employer to recognize the unfunded status on the balance
sheet, SFAS No. 158 also requires the employer to measure pension assets and benefit obligations
as of the date of the fiscal year-end. Previously, a company was allowed to measure its plan assets
and benefit obligations as of a date no more than three months before the fiscal year-end. To
investigate whether my results are driven by the change in measurement dates, I repeat my analyses
based on a sample of firms without changes in measurement dates. The signs and significance levels
of the coefficients on the key interactions (INS � OFFBL, POST � OFFBL, and POST � INS �OFFBL) are consistent with those reported in Table 4, except that when institutional ownership is
used, h10 is significantly negative at the 0.01 level instead of the 0.05 level as reported in Table 4.
Finally, I repeat my main analyses using the changes model. The changes sample is formed by
taking all the firms in the levels sample, and deleting the firm-years that lack data to calculate
changes in relevant variables in both the pre-158 and the post-158 periods. The changes sample has
4,570 observations with 713 unique firms.28 Table 5 presents the results based on the following
changes model:
25 Furthermore, the Spearman correlation between the market value deflated by sales (the number of sharesoutstanding) and institutional ownership is 0.14 (0.31) and the Spearman correlation between the market valuedeflated by sales (the number of shares outstanding) and OFFBL is 0.07 (0.17), suggesting that using sales as thedeflator may reduce the size effect more than using the number of shares outstanding.
26 Specifically, when institutional ownership (analyst following) is used, h10 is negative with a p-value of 0.002(0.000), h11 is negative with a p-value of 0.001 (0.023), and h12 is positive with a p-value of 0.000 (0.000). Wheninstitutional ownership (analyst following) is used, h10 is negative with a p-value of 0.090 (0.022), h11 is negativewith a p-value of 0.000 (0.011), and h12 is positive with a p-value of 0.000 (0.081).
27 In particular, for the first subsample, regardless of whether institutional ownership or analyst following is used,h10, h11 and h12 carry signs consistent with those reported in Table 4 and are all significant at the 0.05 level; forthe second subsample, when institutional ownership (analyst following) is used, h10 is negative with a p-value of0.054 (0.010), h11 is negative with a p-value of 0.026 (0.065), and h12 is positive with a p-value of 0.023 (0.050).
28 Untabulated results show that firms in the changes sample generally have larger market capitalization, largerNPTA and NPTL, and larger on-balance-sheet and off-balance-sheet pension liabilities, compared to firms thatare in the levels sample but not in the changes sample.
Does Recognition versus Disclosure Affect Value Relevance? Evidence from Pension Accounting 1111
The Accounting ReviewMay 2013
DMVit ¼ k0 þ k1POST þ k2INSit þ k3DNPTAit þ k4DNPTLit þ k5DONBLit þ k6INS�DONBLþ k7POST�DONBLþ k8POST�INS�DONBL þ k9DOFFBLit þ k10INSit�DOFFBLit
þ k11POST�DOFFBLit þ k12POST�INSit�DOFFBLit þ k13DPXit þ k14INSit�DPXit
þ k15POST�DPXit þ k16POST�INSit�DPXit þ k17DNI-PX þ k18DRDþ k19DGRWþ k20INS�DNPTA þ k21POST�DNPTAþ k22POST�INS�DNPTAþ k23INS�DNPTLþ k24POST�DNPTLþ k25POST�INS�DNPTLþ k26INS�DNI-PXþ k27POST�DNI-PX þ k28POST�INS�DNI-PX þ k29INS�DRDþ k30POST�DRDþ k31POST�INS�DRDþ k32INS�DGRW þ k33POST�DGRWþ k34POST�INS�DGRW þ eit:
ð4Þ
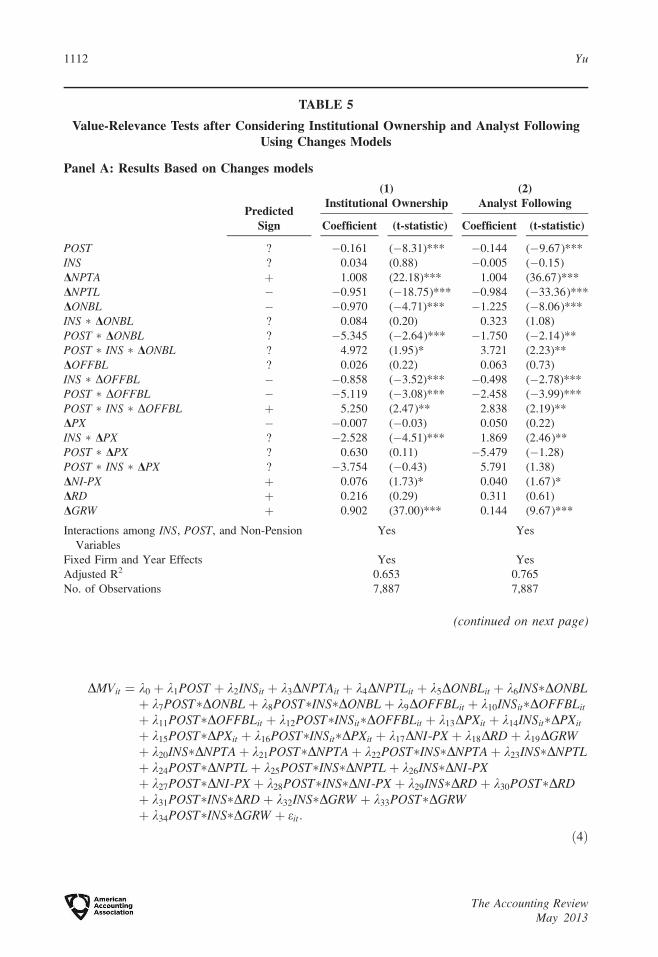
TABLE 5
Value-Relevance Tests after Considering Institutional Ownership and Analyst FollowingUsing Changes Models
Panel A: Results Based on Changes models
PredictedSign
(1)Institutional Ownership
(2)Analyst Following
Coefficient (t-statistic) Coefficient (t-statistic)
POST ? �0.161 (�8.31)*** �0.144 (�9.67)***
INS ? 0.034 (0.88) �0.005 (�0.15)
DNPTA þ 1.008 (22.18)*** 1.004 (36.67)***
DNPTL � �0.951 (�18.75)*** �0.984 (�33.36)***
DONBL � �0.970 (�4.71)*** �1.225 (�8.06)***
INS � DONBL ? 0.084 (0.20) 0.323 (1.08)
POST � DONBL ? �5.345 (�2.64)*** �1.750 (�2.14)**
POST � INS � DONBL ? 4.972 (1.95)* 3.721 (2.23)**
DOFFBL ? 0.026 (0.22) 0.063 (0.73)
INS � DOFFBL � �0.858 (�3.52)*** �0.498 (�2.78)***
POST � DOFFBL � �5.119 (�3.08)*** �2.458 (�3.99)***
POST � INS � DOFFBL þ 5.250 (2.47)** 2.838 (2.19)**
DPX � �0.007 (�0.03) 0.050 (0.22)
INS � DPX ? �2.528 (�4.51)*** 1.869 (2.46)**
POST � DPX ? 0.630 (0.11) �5.479 (�1.28)
POST � INS � DPX ? �3.754 (�0.43) 5.791 (1.38)
DNI-PX þ 0.076 (1.73)* 0.040 (1.67)*
DRD þ 0.216 (0.29) 0.311 (0.61)
DGRW þ 0.902 (37.00)*** 0.144 (9.67)***
Interactions among INS, POST, and Non-Pension
Variables
Yes Yes
Fixed Firm and Year Effects Yes Yes
Adjusted R2 0.653 0.765
No. of Observations 7,887 7,887
(continued on next page)
1112 Yu
The Accounting ReviewMay 2013
D represents the changes in the following variables at the end of year t relative to the end of year
t�1. All the changes in the variables are deflated by the beginning year market value. The main
results are generally consistent with those using levels models.
Roles of Different Types of Institutional Investors
Bushee (1998) classifies institutions into transient, quasi-indexer, and dedicated institutions.
Quasi-indexer institutions generally follow index investment strategies and do not conduct
fundamental analysis. Therefore, the ownership of quasi-indexers may not capture differential
information processing associated with investor sophistication or the information environment.
Prior literature provides mixed evidence regarding the information-processing ability of transient
institutional investors. Bushee (1998, 2001) finds that transient institutional investors are short-
term-focused, and are more likely to follow momentum trading strategies, suggesting that transient
institutions may not use information disclosed in the footnotes. In contrast, Xue and Zhang (2011)
find that transient institutions also conduct fundamental analysis. Similarly, several other studies
find that transient institutional investors can predict a bad news break in a string of consecutive
earnings increases (Ke and Petroni 2004) and can mitigate stock mispricing (Ke and
Ramalingegowda 2005; Collins et al. 2003), suggesting that they are better informed and have
superior ability to process information.
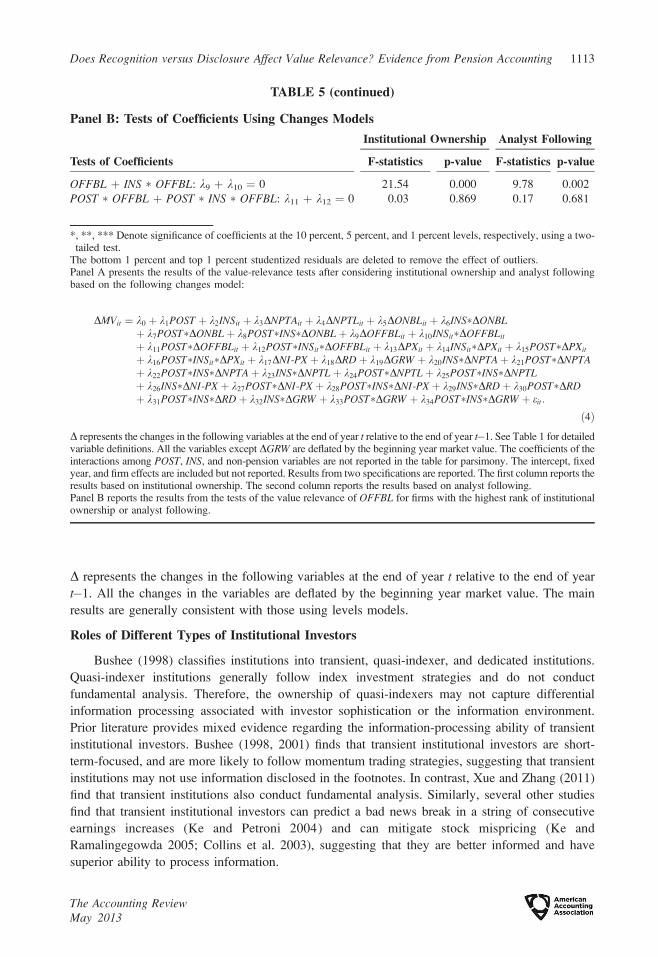
TABLE 5 (continued)
Panel B: Tests of Coefficients Using Changes Models
Tests of Coefficients
Institutional Ownership Analyst Following
F-statistics p-value F-statistics p-value
OFFBL þ INS � OFFBL: k9 þ k10 ¼ 0 21.54 0.000 9.78 0.002
POST � OFFBL þ POST � INS � OFFBL: k11 þ k12 ¼ 0 0.03 0.869 0.17 0.681
*, **, *** Denote significance of coefficients at the 10 percent, 5 percent, and 1 percent levels, respectively, using a two-tailed test.
The bottom 1 percent and top 1 percent studentized residuals are deleted to remove the effect of outliers.Panel A presents the results of the value-relevance tests after considering institutional ownership and analyst followingbased on the following changes model:
DMVit ¼ k0 þ k1POST þ k2INSit þ k3DNPTAit þ k4DNPTLit þ k5DONBLit þ k6INS�DONBLþ k7POST�DONBLþ k8POST�INS�DONBLþ k9DOFFBLit þ k10INSit�DOFFBLit
þ k11POST�DOFFBLit þ k12POST�INSit�DOFFBLit þ k13DPXit þ k14INSit�DPXit þ k15POST�DPXit
þ k16POST�INSit�DPXit þ k17DNI-PX þ k18DRDþ k19DGRW þ k20INS�DNPTAþ k21POST�DNPTAþ k22POST�INS�DNPTAþ k23INS�DNPTLþ k24POST�DNPTLþ k25POST�INS�DNPTLþ k26INS�DNI-PX þ k27POST�DNI-PX þ k28POST�INS�DNI-PX þ k29INS�DRDþ k30POST�DRDþ k31POST�INS�DRDþ k32INS�DGRW þ k33POST�DGRW þ k34POST�INS�DGRW þ eit:
ð4Þ
D represents the changes in the following variables at the end of year t relative to the end of year t�1. See Table 1 for detailedvariable definitions. All the variables except DGRW are deflated by the beginning year market value. The coefficients of theinteractions among POST, INS, and non-pension variables are not reported in the table for parsimony. The intercept, fixedyear, and firm effects are included but not reported. Results from two specifications are reported. The first column reports theresults based on institutional ownership. The second column reports the results based on analyst following.Panel B reports the results from the tests of the value relevance of OFFBL for firms with the highest rank of institutionalownership or analyst following.
Does Recognition versus Disclosure Affect Value Relevance? Evidence from Pension Accounting 1113
The Accounting ReviewMay 2013
The previous discussion suggests that if institutional ownership is indicative of investor
sophistication, then a more appropriate proxy for investor sophistication is the ownership of non-
quasi-indexers or dedicated institutions. In other words, we should find valuation differences
associated with the ownership of dedicated institutions, but no valuation differences associated with
the ownership of quasi-indexer institutions. To examine the associations between different types of
institutional ownership and the value relevance of disclosed versus recognized pension liabilities, I
use the factor and cluster analysis approach described in Bushee (1998, 2001) to classify
institutions based on their portfolio turnover (PTURN) and concentration (BLOCK).29
Consistent with Bushee (1998, 2001), the analysis indicates that transient institutions have
highest PTURN and lowest BLOCK, dedicated institutions have lowest PTURN and highest
BLOCK, and quasi-indexer institutions have relatively low PTURN and low BLOCK. The
untabulated proportion of institution-years in each group is roughly similar to those reported in
Bushee (1998, 2001). Specifically, the majority of the institutions are quasi-indexers (11,592
institutions-years), while dedicated institutions (3,316 institutions-years) and transient institutions
(5,042 institutions-years) account for 17 percent and 25 percent of the sample, respectively.
Additionally, untabulated results show that the magnitude of the mean of PTURN is larger
(less) than its standard errors for transient institutions (dedicated institutions and quasi-indexer
institutions), and the magnitude of the mean of BLOCK is larger (less) than its standard errors for
dedicated institutions (transient institutions and quasi-indexer institutions). These results are largely
consistent with Bushee and Noe (2000) and Bushee (2001). The smaller coefficient of variation
(i.e., standard deviation/factor mean) for PTURN for transient institutions suggests that the cluster
of transient institutions is more homogenous than the clusters of dedicated institutions and quasi-
indexer institutions, and the clusters of dedicated institutions may be further divided into more
clusters to reduce the sum of the squared error and the coefficient of variation.30 However, this
problem should bias my results against finding valuation differences across different levels of
dedicated institutional ownership if the ownership of transient institutions and quasi-indexers is not
indicative of investor sophistication or the information environment.
Table 6 reports the results based on model (3) using the scaled rank of the ownership of non-
quasi-indexers, dedicated institutions, and quasi-indexers, respectively, to measure INS. When the
scaled rank of the ownership of non-quasi-indexers or dedicated institutions is used to measure INS,
the signs and the significant levels of the key coefficients (INS � OFFBL, POST � OFFBL, and
POST � INS � OFFBL) are similar to those reported in Table 4. These results are consistent with the
view that dedicated institutions are more likely to process disclosed off-balance-sheet pension
liabilities by conducting fundamental analysis and, thus, their valuation of pension liabilities is less
likely to be affected by SFAS No. 158. When the scaled rank of the ownership of quasi-indexers is
used to measure INS, the key coefficients are not significant, consistent with the view that quasi-
indexers do not conduct fundamental analysis or use footnote information. Overall, the results
reported in Table 6 suggest that that the differences in the value relevance of OFFBL associated
with different levels of institutional ownership reported in Table 4 are unlikely to be driven by the
ownership of quasi-indexers.
29 Consistent with Bushee and Noe (2000) and Bushee (2001), the earnings momentum factor used by Bushee(1998) is omitted because of the time-series instability of the classification associated with using the momentumfactor.
30 I extract a more restricted cluster of dedicated institutions (1,196 institutions) with a smaller coefficient ofvariation for PTURN and BLOCK (the mean of PTURN is 0.240 and its standard deviation is 0.661, and the meanof BLOCK is 1.975 and its standard deviation is 1.470). The untabulated results using the ownership of dedicatedinstitutions based on this restricted cluster are qualitatively the same as those reported in Table 7. In particular,the signs and significance levels of the coefficients on the key interactions (INS � OFFBL, POST � OFFBL, andPOST � INS � OFFBL) are consistent with those reported in Table 7.
1114 Yu
The Accounting ReviewMay 2013
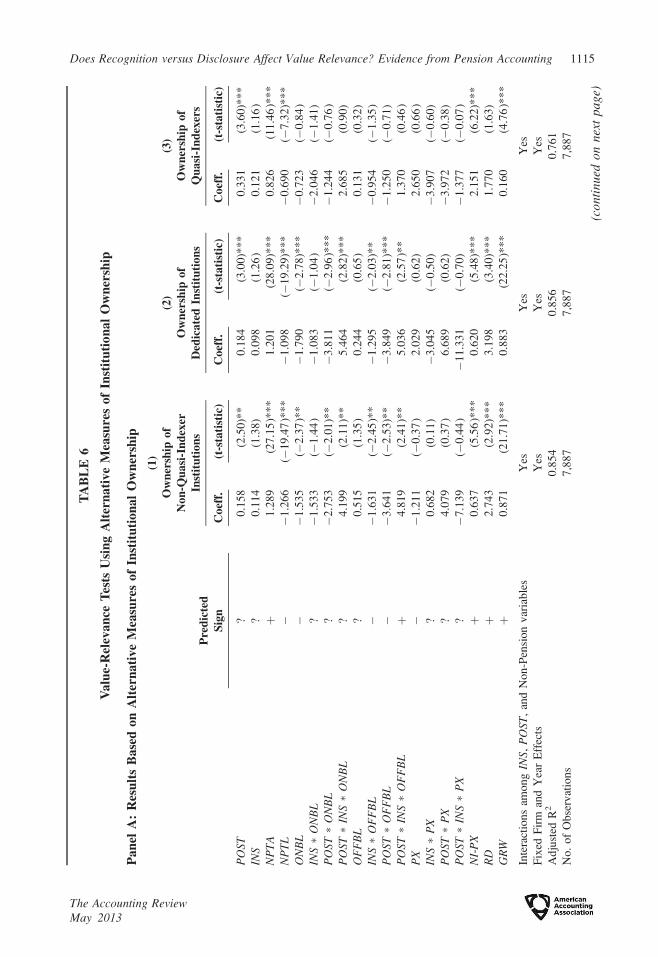
TA
BL
E6
Va
lue-
Rel
eva
nce
Tes
tsU
sin
gA
lter
na
tiv
eM
easu
res
of
Inst
itu
tio
na
lO
wn
ersh
ip
Pan
elA
:R
esu
lts
Base
don
Alt
ern
ati
ve
Mea
sure
sof
Inst
itu
tion
al
Ow
ner
ship
Pre
dic
ted
Sig
n
(1)
Ow
ner
ship
of
No
n-Q
ua
si-I
nd
exer
Inst
itu
tio
ns
(2)
Ow
ner
ship
of
Ded
ica
ted
Inst
itu
tio
ns
(3)
Ow
ner
ship
of
Qu
asi
-In
dex
ers
Coef
f.(t
-sta
tist
ic)
Coef
f.(t
-sta
tist
ic)
Coef
f.(t
-sta
tist
ic)
PO
ST?
0.1
58
(2.5
0)*
*0
.18
4(3
.00
)**
*0
.33
1(3
.60
)**
*
INS
?0
.11
4(1
.38
)0
.09
8(1
.26
)0
.12
1(1
.16
)
NP
TA
þ1
.28
9(2
7.1
5)*
**
1.2
01
(28
.09
)**
*0
.82
6(1
1.4
6)*
**
NP
TL
��
1.2
66
(�1
9.4
7)*
**
�1
.09
8(�
19
.29
)**
*�
0.6
90
(�7
.32
)**
*
ON
BL
��
1.5
35
(�2
.37
)**
�1
.79
0(�
2.7
8)*
**
�0
.72
3(�
0.8
4)
INS�
ON
BL
?�
1.5
33
(�1
.44
)�
1.0
83
(�1
.04
)�
2.0
46
(�1
.41
)
PO
ST�
ON
BL
?�
2.7
53
(�2
.01
)**
�3
.81
1(�
2.9
6)*
**
�1
.24
4(�
0.7
6)
PO
ST�
INS�
ON
BL
?4
.19
9(2
.11
)**
5.4
64
(2.8
2)*
**
2.6
85
(0.9
0)
OF
FB
L?
0.5
15
(1.3
5)
0.2
44
(0.6
5)
0.1
31
(0.3
2)
INS�
OF
FB
L�
�1
.63
1(�
2.4
5)*
*�
1.2
95
(�2
.03
)**
�0
.95
4(�
1.3
5)
PO
ST�
OF
FB
L�
�3
.64
1(�
2.5
3)*
*�
3.8
49
(�2
.81
)**
*�
1.2
50
(�0
.71
)
PO
ST�
INS�
OF
FB
Lþ
4.8
19
(2.4
1)*
*5
.03
6(2
.57
)**
1.3
70
(0.4
6)
PX
��
1.2
11
(�0
.37
)2
.02
9(0
.62
)2
.65
0(0
.66
)
INS�
PX
?0
.68
2(0
.11
)�
3.0
45
(�0
.50
)�
3.9
07
(�0
.60
)
PO
ST�
PX
?4
.07
9(0
.37
)6
.68
9(0
.62
)�
3.9
72
(�0
.38
)
PO
ST�
INS�
PX
?�
7.1
39
(�0
.44
)�
11
.33
1(�
0.7
0)
�1
.37
7(�
0.0
7)
NI-
PX
þ0
.63
7(5
.56
)**
*0
.62
0(5
.48
)**
*2
.15
1(6
.22
)**
*
RD
þ2
.74
3(2
.92
)**
*3
.19
8(3
.40
)**
*1
.77
0(1
.63
)
GR
Wþ
0.8
71
(21
.71
)**
*0
.88
3(2
2.2
5)*
**
0.1
60
(4.7
6)*
**
Inte
ract
ion
sam
on
gIN
S,P
OST
,an
dN
on
-Pen
sio
nv
aria
ble
sY
esY
esY
es
Fix
edF
irm
and
Yea
rE
ffec
tsY
esY
esY
es
Ad
just
edR
20
.85
40
.85
60
.76
1
No
.o
fO
bse
rvat
ion
s7
,88
77
,88
77
,88
7
(co
nti
nu
edo
nn
ext
pa
ge)
Does Recognition versus Disclosure Affect Value Relevance? Evidence from Pension Accounting 1115
The Accounting ReviewMay 2013

TA
BL
E6
(co
nti
nu
ed)
Pa
nel
B:
Tes
tso
fC
oef
fici
ents
Usi
ng
Alt
ern
ati
ve
Mea
sure
so
fIn
stit
uti
on
al
Ow
ner
ship
Tes
tso
fC
oef
fici
ents
Ow
ner
ship
of
No
n-Q
ua
si-I
nd
exer
sO
wn
ersh
ipo
fD
edic
ate
dIn
stit
uti
on
s
F-s
tati
stic
sp
-va
lue
F-s
tati
stic
sp
-va
lue
OF
FB
Lþ
INS�
OF
FB
L:h 9þ
h 10¼
05
.94
0.0
15
5.9
10
.01
5
PO
ST�
OF
FB
Lþ
PO
ST�
INS�
OF
FB
L:h 1
1þ
h 12¼
01
.60
0.2
06
1.5
50
.21
3
**,
***
Den
ote
signifi
cance
of
coef
fici
ents
atth
e5
per
cent
and
1per
cent
level
s,re
spec
tivel
y,
usi
ng
atw
o-t
aile
dte
st.
The
bott
om
1per
cent
and
top
1per
cent
studen
tize
dre
sidual
sar
edel
eted
tore
move
the
effe
ctof
outl
iers
.P
anel
Are
port
sth
ees
tim
atio
nre
sult
susi
ng
the
scal
edra
nk
of
the
ow
ner
ship
of
non-q
uas
i-in
dex
ers,
ded
icat
edin
stit
uti
ons,
and
quas
i-in
dex
ers,
resp
ecti
vel
y,
bas
edon
the
foll
ow
ing
level
sm
odel
:
MV
it¼
h 0þ
h 1P
OSTþ
h 2IN
Sitþ
h 3N
PT
Aitþ
h 4N
PT
Litþ
h 5O
NB
Litþ
h 6IN
S� O
NB
Lþ
h 7P
OST� O
NB
Lþ
h 8P
OST� I
NS� O
NB
Lþ
h 9O
FF
BL
itþ
h 10IN
Sit� O
FF
BL
it
þh 1
1P
OST� O
FF
BL
itþ
h 12P
OST� I
NS
it� O
FF
BL
itþ
h 13P
Xitþ
h 14IN
Sit� P
Xitþ
h 15P
OST� P
Xitþ
h 16P
OST� I
NS
it� P
Xitþ
h 17N
I-P
Xþ
h 18R
Dþ
h 19G
RW
þh 2
0IN
S� N
PT
Aþ
h 21P
OST� N
PT
Aþ
h 22P
OST� I
NS� N
PT
Aþ
h 23IN
S� N
PT
Lþ
h 24P
OST� N
PT
Lþ
h 25P
OST� I
NS� N
PT
Lþ
h 26IN
S� N
I-P
Xþ
h 27P
OST� N
I-P
Xþ
h 28P
OST� I
NS� N
I-P
Xþ
h 29IN
S� R
Dþ
h 30P
OST� R
Dþ
h 31P
OST� I
NS� R
Dþ
h 32IN
S� G
RWþ
h 33P
OST� G
RWþ
h 34P
OST� I
NS� G
RWþ
e it:
ð3Þ
See
Tab
le1
for
det
aile
dvar
iable
defi
nit
ions.
All
the
var
iable
sar
edefl
ated
by
sale
s.T
he
coef
fici
ents
of
the
inte
ract
ions
among
PO
ST
,IN
S,
and
the
non-p
ensi
on
var
iable
sar
enot
report
edin
the
table
for
par
sim
ony.
The
inte
rcep
t,fi
xed
yea
r,an
dfi
rmef
fect
sar
ein
cluded
but
not
report
ed.
The
firs
t(s
econd)
colu
mn
of
Pan
elB
report
sth
ere
sult
sfr
om
the
test
sof
the
val
ue
rele
van
ceof
OF
FB
Lfo
rfi
rms
wit
hth
ehig
hes
tra
nk
of
the
ow
ner
ship
of
non-q
uas
i-in
dex
erin
stit
uti
ons
(ded
icat
edin
stit
uti
ons)
.
1116 Yu
The Accounting ReviewMay 2013
The Confounding Effect of the PPA
The Pension Protection Act of 2006 (PPA) was signed into law on August 17, 2006. Given that
SFAS No. 158 is concurrent with the PPA, it is important to consider the potentially confounding
effect of the PPA on the change in the value relevance of off-balance-sheet pension liabilities. In
particular, the accelerated funding requirement of the PPA is likely to increase future cash outflows
for each dollar of unfunded pension liabilities, suggesting that the value relevance of net pension
liabilities will increase following the implementation of the PPA. However, my results are unlikely
to be driven by the PPA because of the following two reasons.
First, the recognition provision applies to all the firms with defined benefit pension plans, while
the PPA only affects a subset of the firms in my sample. Under the PPA, a plan’s funding target is
the present value of all benefits accrued or earned under the plan as of the beginning of the plan
year. Therefore, the funding target is a measure similar to ABO. The PPA affects the value
relevance of off-balance-sheet pension liabilities, only for firms with underfunded ABO.
Second, Franzoni and Marin (2006) suggest that investors do not fully understand the
implications of pension plan underfunding for future earnings and cash flows. If institutional
ownership and analyst following capture investor sophistication or the information environment,
then investors of firms with the lowest INS rank are not expected to understand the implications of
the PPA, and investors of firms with a higher level of institutional ownership or analyst following
should be more capable of understanding the negative effect of the PPA. Therefore, if the PPA
affects the value relevance of OFFBL, the coefficient on POST � OFFBL should be insignificant
and the coefficient on POST � INS � OFFBL should be negative. This is inconsistent with the
results documented in Table 4.
Reconciliation with Mitra and Hossain (2009)
This study differs from the MH paper in the following ways. First, my sample includes a panel
of firms from 1999 to 2007. In contrast, MH’s regression results are based solely on data from year
2006. My sample allows me to examine the value relevance of off-balance-sheet pension liabilities
in both pre- and post-158 periods rather than in the initial adoption year of SFAS No. 158, and test
the change in the value relevance following SFAS No. 158. Second, I use both levels and changes
models, and control for fixed firm effects and various balance sheet items in my analyses, while MH
draw their inference based on a cross-sectional regression of stock return on various comprehensive
income items in 2006, without controlling for fixed firm effects and balance sheet items.31
To reconcile my paper with the MH paper, I first construct a sample (hereafter, the
reconciliation sample) similar to the sample used by MH. I start with my levels sample and then
keep only the observations in year 2006 for which 2006 is the transition year. I then extract firms’
daily stock returns from CRSP and calculate the annual buy-and-hold stock returns ending three
months after the fiscal year-end. Finally, I identify the index types that firms belong to by using
Compustat Index Constituents. The final sample includes 460 firms. The number of firms in the
final sample is less than that in the MH sample, mainly because my levels sample does not include
financial firms.
To illustrate the importance of controlling for balance sheet items, I use DNPTA, DNPTL,
DONBL, and DOFFBL as control variables in addition to NI and DNI used in the MH paper.32 I
31 It is not possible to control for fixed firm effects when the MH sample is used because panel data are required toestimate fixed firm effects.
32 The amount of OFFBL in 2005 may differ from that of pension transition adjustments in 2006. The difference inthe amounts may also be associated with stock returns, if OFFBL is value relevant in the pre-158 period.Therefore, it is important to also control for DOFFBL.
Does Recognition versus Disclosure Affect Value Relevance? Evidence from Pension Accounting 1117
The Accounting ReviewMay 2013
cannot control for the other OCI components because of the unavailability of the data.33
Untabulated results show that, after controlling for these balance sheet items, the association
between returns and OFFBL is not significant, and the coefficient on OFFBL is significantly
negative for both the S&P 500 and the non-S&P 500 sample, suggesting that the overall change in
the value relevance and the size effect documented by MH disappear. In addition, including these
balance sheet items significantly increases the model’s explanatory power.
To further examine whether the association between stock returns and off-balance-sheet
pension liabilities for the reconciliation sample depends on institutional ownership and analyst
following, I partition the sample based on the median of institutional ownership (analyst following).
Untabulated results show that the association between stock returns and OFFBL is negative (not
significant) for the firms with institutional ownership (analyst following) below its median, and not
significant for the firms with institutional ownership (analyst following) above its median.
However, when the sample is partitioned based on the quartile of analyst following, consistent with
the results based on institutional ownership, the association between stock returns and OFFBL is
negative for the firms in the lowest quartile of analyst following, but not significant for the firms in
the highest quartile of analyst following.
Finally, I conduct the following analysis to investigate whether my results are driven by the
fact that institutional ownership and analyst following are correlated with firm size and pension plan
size. I first regress institutional ownership (analyst following) on firm size. The market value of
equity is used to measure firm size. The residuals from this regression are not correlated with firm
size. I then calculate the scaled rank of these residuals for each firm by ranking them into ten groups
(0 to 9) by decile points and dividing the group number by 9. Furthermore, I also calculate the
scaled rank of the residuals from the regression of institutional ownership (analyst following) on
firm size and pension plan size. PBO deflated by the market value of equity is used to measure
pension plan size. The residuals from this regression are not correlated with firm size and pension
plan size.
Table 7 reports the results based on model (3) using the scaled rank of the residuals
uncorrelated with firm size (firm size and pension plan size) to measure INS. The results are
generally consistent with those reported in Table 4, and suggest that the valuation differences across
different levels of institutional ownership or analyst following documented in Table 4 cannot be
explained by firm size or pension plan size.34
The Effect of Institutional Ownership and Analyst Following on Pension Mispricing
An alternative method to test whether the value relevance of disclosed versus recognized
pension liabilities differs across different levels of institutional ownership and analyst following is
to investigate the effect of institutional ownership and analyst following on the mispricing of off-
balance-sheet pension liabilities in the pre- and post-158 periods. Picconi (2006) finds that firms
with off-balance-sheet pension liabilities are mispriced because stock prices fail to reflect the
implication of off-balance-sheet pension liabilities. Similarly, Franzoni and Marin (2006) document
significantly negative abnormal returns for firms with severely underfunded pension plans, when
33 As reported in Mitra and Hossain (2009, Table 2), pension transition adjustment is generally not correlated withthe other OCI components, suggesting that omitting the other OCI components in the regression may not causethe omitted variable bias.
34 Using total assets to measure firm size or using the PBO deflated by total assets or total liabilities to measurepension plan size does not change the results qualitatively. In particular, the signs and significance levels of thecoefficients on the key interactions (INS � OFFBL, POST � OFFBL, and POST � INS � OFFBL) are consistentwith those reported in Table 8.
1118 Yu
The Accounting ReviewMay 2013
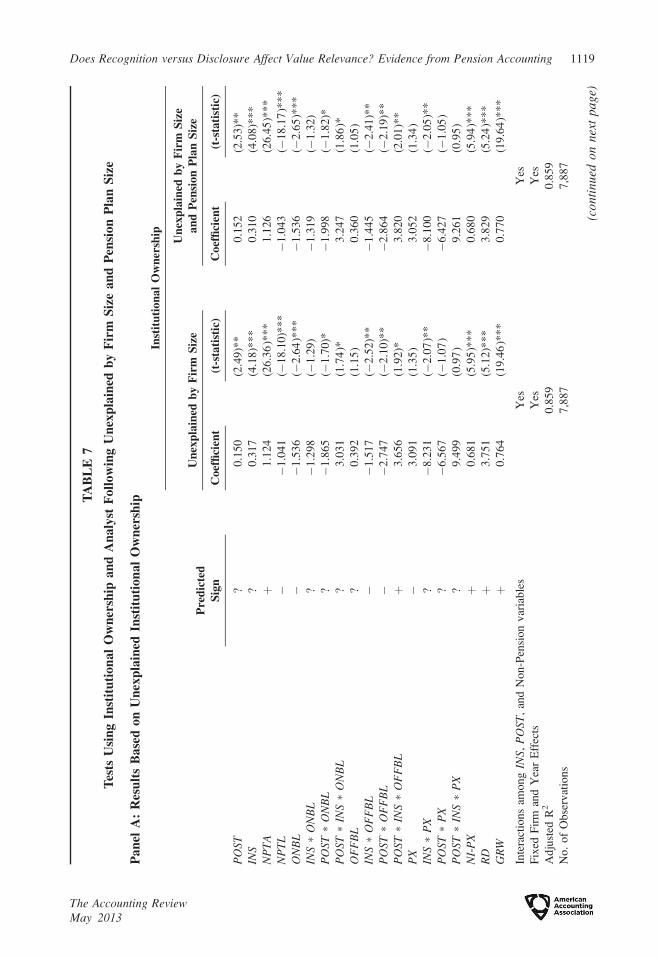
TA
BL
E7
Tes
tsU
sin
gIn
stit
uti
on
al
Ow
ner
ship
an
dA
na
lyst
Fo
llo
win
gU
nex
pla
ined
by
Fir
mS
ize
an
dP
ensi
on
Pla
nS
ize
Pa
nel
A:
Res
ult
sB
ase
do
nU
nex
pla
ined
Inst
itu
tio
na
lO
wn
ersh
ip
Pre
dic
ted
Sig
n
Inst
itu
tio
na
lO
wn
ersh
ip
Un
exp
lain
edb
yF
irm
Siz
eU
nex
pla
ined
by
Fir
mS
ize
an
dP
ensi
on
Pla
nS
ize
Co
effi
cien
t(t
-sta
tist
ic)
Co
effi
cien
t(t
-sta
tist
ic)
PO
ST?
0.1
50
(2.4
9)*
*0
.15
2(2
.53
)**
INS
?0
.31
7(4
.18
)**
*0
.31
0(4
.08
)**
*
NP
TA
þ1
.12
4(2
6.3
6)*
**
1.1
26
(26
.45
)**
*
NP
TL
��
1.0
41
(�1
8.1
0)*
**
�1
.04
3(�
18
.17
)**
*
ON
BL
��
1.5
36
(�2
.64
)**
*�
1.5
36
(�2
.65
)**
*
INS�
ON
BL
?�
1.2
98
(�1
.29
)�
1.3
19
(�1
.32
)
PO
ST�
ON
BL
?�
1.8
65
(�1
.70
)*�
1.9
98
(�1
.82
)*
PO
ST�
INS�
ON
BL
?3
.03
1(1
.74
)*3
.24
7(1
.86
)*
OF
FB
L?
0.3
92
(1.1
5)
0.3
60
(1.0
5)
INS�
OF
FB
L�
�1
.51
7(�
2.5
2)*
*�
1.4
45
(�2
.41
)**
PO
ST�
OF
FB
L�
�2
.74
7(�
2.1
0)*
*�
2.8
64
(�2
.19
)**
PO
ST�
INS�
OF
FB
Lþ
3.6
56
(1.9
2)*
3.8
20
(2.0
1)*
*
PX
�3
.09
1(1
.35
)3
.05
2(1
.34
)
INS�
PX
?�
8.2
31
(�2
.07
)**
�8
.10
0(�
2.0
5)*
*
PO
ST�
PX
?�
6.5
67
(�1
.07
)�
6.4
27
(�1
.05
)
PO
ST�
INS�
PX
?9
.49
9(0
.97
)9
.26
1(0
.95
)
NI-
PX
þ0
.68
1(5
.95
)**
*0
.68
0(5
.94
)**
*
RD
þ3
.75
1(5
.12
)**
*3
.82
9(5
.24
)**
*
GR
Wþ
0.7
64
(19
.46
)**
*0
.77
0(1
9.6
4)*
**
Inte
ract
ion
sam
on
gIN
S,
PO
ST,
and
No
n-P
ensi
on
var
iab
les
Yes
Yes
Fix
edF
irm
and
Yea
rE
ffec
tsY
esY
es
Ad
just
edR
20
.85
90
.85
9
No
.o
fO
bse
rvat
ion
s7
,88
77
,88
7
(co
nti
nu
edo
nn
ext
pa
ge)
Does Recognition versus Disclosure Affect Value Relevance? Evidence from Pension Accounting 1119
The Accounting ReviewMay 2013
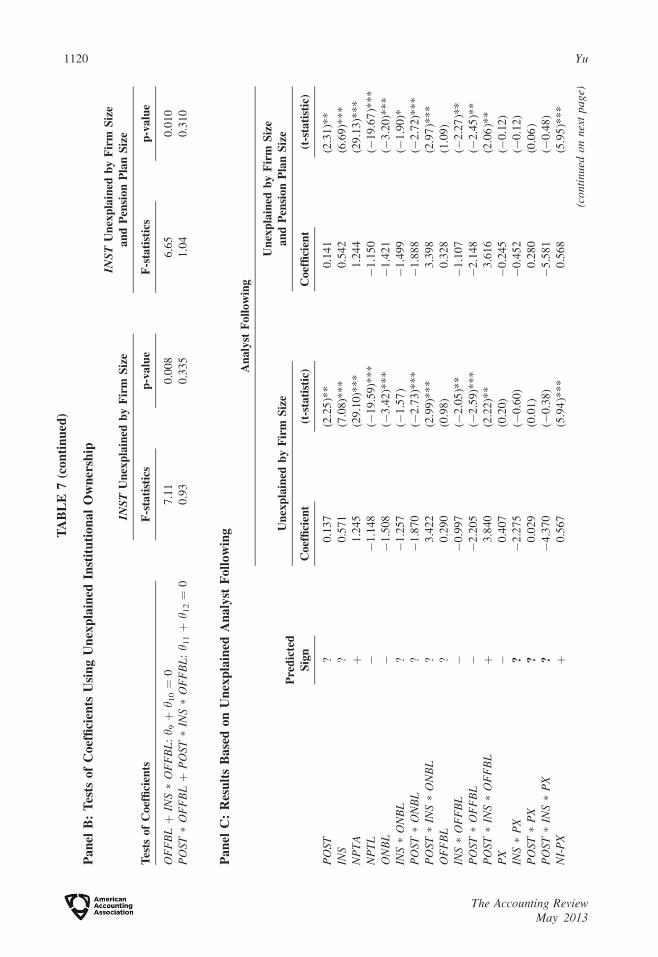
TA
BL
E7
(co
nti
nu
ed)
Pa
nel
B:
Tes
tso
fC
oef
fici
ents
Usi
ng
Un
exp
lain
edIn
stit
uti
on
al
Ow
ner
ship
Tes
tso
fC
oef
fici
ents
INS
TU
nex
pla
ined
by
Fir
mS
ize
INS
TU
nex
pla
ined
by
Fir
mS
ize
an
dP
ensi
on
Pla
nS
ize
F-s
tati
stic
sp
-va
lue
F-s
tati
stic
sp
-va
lue
OF
FB
Lþ
INS�
OF
FB
L:h 9þ
h 10¼
07
.11
0.0
08
6.6
50
.01
0
PO
ST�
OF
FB
Lþ
PO
ST�
INS�
OF
FB
L:h 1
1þ
h 12¼
00
.93
0.3
35
1.0
40
.31
0
Pa
nel
C:
Res
ult
sB
ase
do
nU
nex
pla
ined
An
aly
stF
oll
ow
ing
Pre
dic
ted
Sig
n
An
aly
stF
oll
ow
ing
Un
exp
lain
edb
yF
irm
Siz
eU
nex
pla
ined
by
Fir
mS
ize
an
dP
ensi
on
Pla
nS
ize
Co
effi
cien
t(t
-sta
tist
ic)
Co
effi
cien
t(t
-sta
tist
ic)
PO
ST?
0.1
37
(2.2
5)*
*0
.14
1(2
.31
)**
INS
?0
.57
1(7
.08
)**
*0
.54
2(6
.69
)**
*
NP
TA
þ1
.24
5(2
9.1
0)*
**
1.2
44
(29
.13
)**
*
NP
TL
��
1.1
48
(�1
9.5
9)*
**
�1
.15
0(�
19
.67
)**
*
ON
BL
��
1.5
08
(�3
.42
)**
*�
1.4
21
(�3
.20
)**
*
INS�
ON
BL
?�
1.2
57
(�1
.57
)�
1.4
99
(�1
.90
)*
PO
ST�
ON
BL
?�
1.8
70
(�2
.73
)**
*�
1.8
88
(�2
.72
)**
*
PO
ST�
INS�
ON
BL
?3
.42
2(2
.99
)**
*3
.39
8(2
.97
)**
*
OF
FB
L?
0.2
90
(0.9
8)
0.3
28
(1.0
9)
INS�
OF
FB
L�
�0
.99
7(�
2.0
5)*
*�
1.1
07
(�2
.27
)**
PO
ST�
OF
FB
L�
�2
.20
5(�
2.5
9)*
**
�2
.14
8(�
2.4
5)*
*
PO
ST�
INS�
OF
FB
Lþ
3.8
40
(2.2
2)*
*3
.61
6(2
.06
)**
PX
�0
.40
7(0
.20
)�
0.2
45
(�0
.12
)
INS�
PX
?�
2.2
75
(�0
.60
)�
0.4
52
(�0
.12
)
PO
ST�
PX
?0
.02
9(0
.01
)0
.28
0(0
.06
)
PO
ST�
INS�
PX
?�
4.3
70
(�0
.38
)�
5.5
81
(�0
.48
)
NI-
PX
þ0
.56
7(5
.94
)**
*0
.56
8(5
.95
)**
*
(con
tinu
edo
nn
ext
pa
ge)
1120 Yu
The Accounting ReviewMay 2013
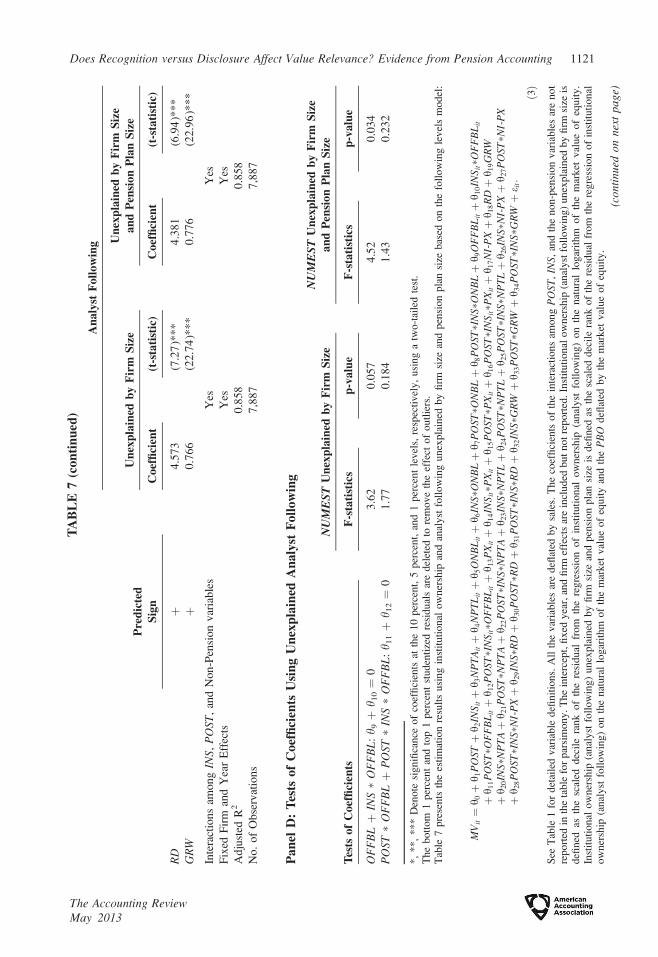
TA
BL
E7
(co
nti
nu
ed)
Pre
dic
ted
Sig
n
An
aly
stF
oll
ow
ing
Un
exp
lain
edb
yF
irm
Siz
eU
nex
pla
ined
by
Fir
mS
ize
an
dP
ensi
on
Pla
nS
ize
Co
effi
cien
t(t
-sta
tist
ic)
Co
effi
cien
t(t
-sta
tist
ic)
RD
þ4
.57
3(7
.27
)**
*4
.38
1(6
.94
)**
*
GR
Wþ
0.7
66
(22
.74
)**
*0
.77
6(2
2.9
6)*
**
Inte
ract
ion
sam
on
gIN
S,
PO
ST,
and
No
n-P
ensi
on
var
iab
les
Yes
Yes
Fix
edF
irm
and
Yea
rE
ffec
tsY
esY
es
Ad
just
edR
20
.85
80
.85
8
No
.o
fO
bse
rvat
ion
s7
,88
77
,88
7
Pa
nel
D:
Tes
tso
fC
oef
fici
ents
Usi
ng
Un
exp
lain
edA
na
lyst
Fo
llo
win
g
Tes
tso
fC
oef
fici
ents
NU
ME
ST
Un
exp
lain
edb
yF
irm
Siz
eN
UM
ES
TU
nex
pla
ined
by
Fir
mS
ize
an
dP
ensi
on
Pla
nS
ize
F-s
tati
stic
sp
-va
lue
F-s
tati
stic
sp
-va
lue
OF
FB
Lþ
INS�
OF
FB
L:h 9þ
h 10¼
03
.62
0.0
57
4.5
20
.03
4
PO
ST�
OF
FB
Lþ
PO
ST�
INS�
OF
FB
L:h 1
1þ
h 12¼
01
.77
0.1
84
1.4
30
.23
2
*,
**,
***
Den
ote
signifi
cance
of
coef
fici
ents
atth
e10
per
cent,
5per
cent,
and
1per
cent
level
s,re
spec
tivel
y,
usi
ng
atw
o-t
aile
dte
st.
The
bott
om
1per
cent
and
top
1per
cent
studen
tize
dre
sidual
sar
edel
eted
tore
move
the
effe
ctof
outl
iers
.T
able
7pre
sents
the
esti
mat
ion
resu
lts
usi
ng
inst
ituti
onal
ow
ner
ship
and
anal
yst
foll
ow
ing
unex
pla
ined
by
firm
size
and
pen
sion
pla
nsi
zebas
edon
the
foll
ow
ing
level
sm
odel
:
MV
it¼
h 0þ
h 1P
OSTþ
h 2IN
Sitþ
h 3N
PT
Aitþ
h 4N
PT
Litþ
h 5O
NB
Litþ
h 6IN
S� O
NB
Lþ
h 7P
OST� O
NB
Lþ
h 8P
OST� I
NS� O
NB
Lþ
h 9O
FF
BL
itþ
h 10IN
Sit� O
FF
BL
it
þh 1
1P
OST� O
FF
BL
itþ
h 12P
OST� I
NS
it� O
FF
BL
itþ
h 13P
Xitþ
h 14IN
Sit� P
Xitþ
h 15P
OST� P
Xitþ
h 16P
OST� I
NS
it� P
Xitþ
h 17N
I-P
Xþ
h 18R
Dþ
h 19G
RW
þh 2
0IN
S� N
PT
Aþ
h 21P
OST� N
PT
Aþ
h 22P
OST� I
NS� N
PT
Aþ
h 23IN
S� N
PT
Lþ
h 24P
OST� N
PT
Lþ
h 25P
OST� I
NS� N
PT
Lþ
h 26IN
S� N
I-P
Xþ
h 27P
OST� N
I-P
Xþ
h 28P
OST� I
NS� N
I-P
Xþ
h 29IN
S� R
Dþ
h 30P
OST� R
Dþ
h 31P
OST� I
NS� R
Dþ
h 32IN
S� G
RWþ
h 33P
OST� G
RWþ
h 34P
OST� I
NS� G
RWþ
e it:
ð3Þ
See
Tab
le1
for
det
aile
dvar
iable
defi
nit
ions.
All
the
var
iable
sar
edefl
ated
by
sale
s.T
he
coef
fici
ents
of
the
inte
ract
ions
among
PO
ST
,IN
S,
and
the
non-p
ensi
on
var
iable
sar
enot
report
edin
the
table
for
par
sim
ony.
The
inte
rcep
t,fi
xed
yea
r,an
dfi
rmef
fect
sar
ein
cluded
but
not
report
ed.
Inst
ituti
onal
ow
ner
ship
(anal
yst
foll
ow
ing)
unex
pla
ined
by
firm
size
isdefi
ned
asth
esc
aled
dec
ile
rank
of
the
resi
dual
from
the
regre
ssio
nof
inst
ituti
onal
ow
ner
ship
(anal
yst
foll
ow
ing)
on
the
nat
ura
llo
gar
ithm
of
the
mar
ket
val
ue
of
equit
y.
Inst
ituti
onal
ow
ner
ship
(anal
yst
foll
ow
ing)
unex
pla
ined
by
firm
size
and
pen
sion
pla
nsi
zeis
defi
ned
asth
esc
aled
dec
ile
rank
of
the
resi
dual
from
the
regre
ssio
nof
inst
ituti
onal
ow
ner
ship
(anal
yst
foll
ow
ing)
on
the
nat
ura
llo
gar
ithm
of
the
mar
ket
val
ue
of
equit
yan
dth
eP
BO
defl
ated
by
the
mar
ket
val
ue
of
equit
y.
(con
tinu
edo
nn
ext
pa
ge)
Does Recognition versus Disclosure Affect Value Relevance? Evidence from Pension Accounting 1121
The Accounting ReviewMay 2013

TA
BL
E7
(co
nti
nu
ed)
The
firs
t(s
econd)
colu
mn
of
Pan
elA
report
sth
ere
sult
sbas
edon
the
scal
edra
nk
of
inst
ituti
onal
ow
ner
ship
unex
pla
ined
by
firm
size
(firm
size
and
pen
sio
npla
nsi
ze).
The
firs
t(s
econd)
colu
mn
of
Pan
elB
report
sth
ere
sult
sfr
om
the
test
sof
the
val
ue
rele
van
ceof
OF
FB
Lfo
rfi
rms
wit
hth
ehig
hes
tra
nk
of
inst
ituti
onal
ow
ner
ship
unex
pla
ined
by
firm
size
(firm
size
and
pen
sion
pla
nsi
ze).
The
firs
t(s
econd)
colu
mn
of
Pan
elC
report
sth
ere
sult
sbas
edon
the
scal
edra
nk
of
anal
yst
foll
ow
ing
unex
pla
ined
by
firm
size
(firm
size
and
pen
sion
pla
nsi
ze).
The
firs
t(s
econd)
colu
mn
of
Pan
elD
report
sth
ere
sult
sfr
om
the
test
sof
the
val
ue
rele
van
ceof
OF
FB
Lfo
rfi
rms
wit
hth
ehig
hes
tra
nk
of
anal
yst
foll
ow
ing
unex
pla
ined
by
firm
size
(firm
size
and
pen
sion
pla
nsi
ze).
1122 Yu
The Accounting ReviewMay 2013
the implications of pension underfunding hit earnings and cash flows around earnings
announcements in the following periods. Their results are consistent with the view that investors
are more likely to understand recognized information (earnings and cash flows) than disclosed
information (off-balance-sheet pension liabilities).35
If off-balance-sheet pension liabilities are more likely to be reflected in stock prices for firms
with a higher level of institutional ownership or analyst following, then firms with a higher level of
institutional ownership or analyst following are less likely to be mispriced and, thus should
experience a smaller decrease in the mispricing following SFAS No. 158. Following Picconi
(2006), I use the following model to test the arguments:
Ritþ1 ¼ b0 þ b1POST þ b2INSit þ b3OFFBLit þ b4INSit�OFFBLit þ b5POST�OFFBLit
þ b6POST�INSit�OFFBLit þ CONTROLþ eit: ð5Þ
R is the one-year-ahead buy-and-hold return. POST, INS, and OFFBL are as defined in model (3).
The main control variables are seven other market anomaly variables: Financial Leverage, Book-to-Market ratio, Price-to-Earnings ratio, Total Accruals, Net Operating Assets, Beta, and Size. I also
control for the interactions between INS and these market anomaly variables and the interactions
between POST and these market anomaly variables. Industry dummies and year dummies are
included, but not reported.
Panel A of Table 8 reports the effects of institutional ownership or analyst following on the
one-year-ahead buy-and-hold return predictability of off-balance-sheet pension liabilities.
Consistent with the view that firms with a higher level of institutional ownership or analyst
following are less likely to be mispriced, b3 is significantly negative and b4 is significantly positive.
Consistent with the argument that firms with a higher level of institutional ownership or analyst
following experience a smaller decrease in the mispricing following SFAS No. 158, b5 is
significantly positive, and b6 is significantly negative. Panel B of Table 8 shows that the sum of b3
and b4 and the sum of b5 and b6 are not significantly different from zero, suggesting that for firms
with the highest INS rank, OFFBL are not mispriced in the pre-158 period and the predictive power
of OFFBL for future returns are not affected by SFAS No. 158.
VII. SUMMARY AND CONCLUDING REMARKS
This study examines whether institutional ownership and analyst following affect the value
relevance of disclosed versus recognized pension liabilities. I find that off-balance-sheet pension
liabilities are more value relevant for firms with a higher level of institutional ownership or analyst
following in the pre-158 period. More importantly, I find that SFAS No. 158 increases the value
relevance of previously disclosed off-balance-sheet pension liabilities for firms with a low level of
institutional ownership or analyst following, and that the increase in the value relevance becomes
less pronounced for firms with a higher level of institutional ownership or analyst following.
Overall, the results suggest that recognition of previously disclosed information does not affect all
the firms homogenously. This study also highlights the importance of considering institutional
ownership and analyst following in the research on the value relevance of disclosed versus
recognized information.
My results are consistent with the view that investors have difficulty in understanding disclosed
information. Alternatively, my results may also be explained by difference in investor assessments
of reliability of disclosed versus recognized information. Future research can further contribute to
the literature by differentiating between these two explanations. Whether investors’ differential
35 Their results are less likely to be explained by slower processing of disclosed information than recognizedinformation.
Does Recognition versus Disclosure Affect Value Relevance? Evidence from Pension Accounting 1123
The Accounting ReviewMay 2013
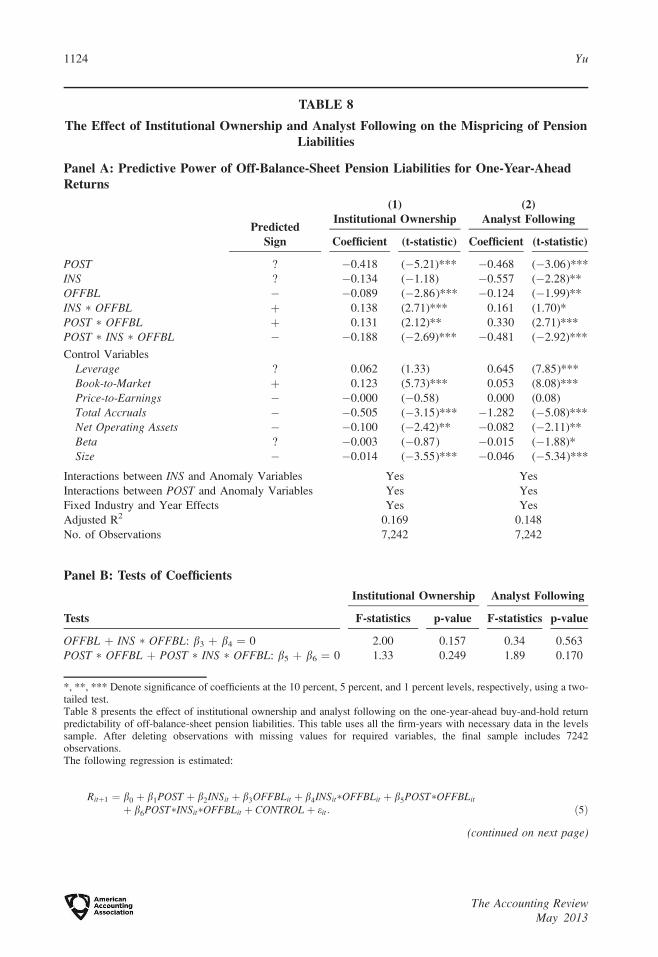
TABLE 8
The Effect of Institutional Ownership and Analyst Following on the Mispricing of PensionLiabilities
Panel A: Predictive Power of Off-Balance-Sheet Pension Liabilities for One-Year-AheadReturns
PredictedSign
(1)Institutional Ownership
(2)Analyst Following
Coefficient (t-statistic) Coefficient (t-statistic)
POST ? �0.418 (�5.21)*** �0.468 (�3.06)***
INS ? �0.134 (�1.18) �0.557 (�2.28)**
OFFBL � �0.089 (�2.86)*** �0.124 (�1.99)**
INS � OFFBL þ 0.138 (2.71)*** 0.161 (1.70)*
POST � OFFBL þ 0.131 (2.12)** 0.330 (2.71)***
POST � INS � OFFBL � �0.188 (�2.69)*** �0.481 (�2.92)***
Control Variables
Leverage ? 0.062 (1.33) 0.645 (7.85)***
Book-to-Market þ 0.123 (5.73)*** 0.053 (8.08)***
Price-to-Earnings � �0.000 (�0.58) 0.000 (0.08)
Total Accruals � �0.505 (�3.15)*** �1.282 (�5.08)***
Net Operating Assets � �0.100 (�2.42)** �0.082 (�2.11)**
Beta ? �0.003 (�0.87) �0.015 (�1.88)*
Size � �0.014 (�3.55)*** �0.046 (�5.34)***
Interactions between INS and Anomaly Variables Yes Yes
Interactions between POST and Anomaly Variables Yes Yes
Fixed Industry and Year Effects Yes Yes
Adjusted R2 0.169 0.148
No. of Observations 7,242 7,242
Panel B: Tests of Coefficients
Tests
Institutional Ownership Analyst Following
F-statistics p-value F-statistics p-value
OFFBL þ INS � OFFBL: b3 þ b4 ¼ 0 2.00 0.157 0.34 0.563
POST � OFFBL þ POST � INS � OFFBL: b5 þ b6 ¼ 0 1.33 0.249 1.89 0.170
*, **, *** Denote significance of coefficients at the 10 percent, 5 percent, and 1 percent levels, respectively, using a two-tailed test.Table 8 presents the effect of institutional ownership and analyst following on the one-year-ahead buy-and-hold returnpredictability of off-balance-sheet pension liabilities. This table uses all the firm-years with necessary data in the levelssample. After deleting observations with missing values for required variables, the final sample includes 7242observations.The following regression is estimated:
Ritþ1 ¼ b0 þ b1POST þ b2INSit þ b3OFFBLit þ b4INSit�OFFBLit þ b5POST�OFFBLit
þ b6POST�INSit�OFFBLit þ CONTROLþ eit: ð5Þ
(continued on next page)
1124 Yu
The Accounting ReviewMay 2013
treatment of disclosed versus recognized items is driven by reliability differences or
information-processing-related factors has different implications for standard-setters and practi-
tioners. For example, if the differential treatment is driven by investors having difficulty in
understanding disclosed information, then appropriate training programs or advanced technologies,
such as the XBRL technology, can be initiated to make disclosure more accessible and
comprehensible so that disclosure would be an acceptable alternative for recognition, especially in
the case that recognition is not feasible.
REFERENCES
Ahmed, A. S., E. Kilic, and G. J. Lobo. 2006. Does recognition vs. disclosure matter? Evidence from value-
relevance of banks’ recognized and disclosed derivative financial instruments. The Accounting
Review 81: 567–588.
Ayers, B., and R. Freeman. 2003. Evidence that analyst following and institutions accelerate the pricing of
future earnings. Review of Accounting Studies 8: 47–68.
Balsam, S., E. Bartov, and C. Marquardt. 2002. Accruals management, investor sophistication, and equity
valuation: Evidence from 10-Q filings. Journal of Accounting Research 40: 987–1012.
Barth, M. E. 1991. Relative measurement errors among alternative pension asset and liability measures. The
Accounting Review 66: 433–463.
Barth, M. E., W. H. Beaver, and W. R. Landsman. 1992. The market valuation implications of net periodic
pension cost components. Journal of Accounting and Economics 15: 27–62.
Barth, M. E. 1994. Fair value accounting: Evidence from investment securities and the market valuation of
banks. The Accounting Review 69: 1–25.
Barth, M. E., W. H. Beaver, and W. R. Landsman. 2001. The relevance of the value relevance literature for
accounting standard setting: Another view. Journal of Accounting and Economics 31: 77–104.
Barth, M. E., G. Clinch, and T. Shibano. 2003. Market effects of recognition and disclosure. Journal of
Accounting Research 41: 581–609.
Bartov, E., S. Radhakrishnan, and I. Krinsky. 2000. Investor sophistication and patterns in stock returns
after earnings announcements. The Accounting Review 75: 43–63.
Beyer, A., D. A. Cohen, T. Z. Lys, and B. R. Walther. 2010. The financial reporting environment: Review
of the recent literature. Journal of Accounting and Economics 50: 296–343.
TABLE 8 (continued)
Ritþ1 is the one-year-ahead buy-and-hold return. POST, INS, and OFFBL are as defined in Table 1. OFFBL is deflated bytotal assets. The main control variables are seven other market anomaly variables: Financial Leverage, Book-to-Market,Price-to-Earnings, Total Accruals, Net Operating Assets, Beta, and Size where:Financial Leverage ¼ Total Liabilities/Total Assets ¼ LT/AT;Book-to-Market ¼ Book Value/Market Value ¼ SEQ/(CSHO � PRCC_F);Price-to-Earnings ¼ Fiscal Year Closing Stock Price/EPS ¼ PRCC_F/EPSPX;Total Accruals¼ (Earnings Before Extraordinary Items� Cash FlowþExtraordinary Items)/Lagged Total Assets¼ (IBC
� OANCF þ XIDOC)/Lagged AT;Net Operating Assets ¼ (Operating Assets � Operating Liabilities)/Lagged Total Assets; ¼ (DLC þ DLTT þ MIB þ
UPSTK þ CEQ � CHE)/Lagged AT;Beta ¼ beta deciles are obtained from the CRSP database; andSize ¼ size deciles are obtained from the CRSP database.The coefficients of the interactions between INS and the seven anomaly variables, and those of the interactions betweenPOST and the seven anomaly variables, are not reported in the table for parsimony. The intercept, fixed year, andindustry effects are included but not reported. Results from two specifications are reported. The first column reports theresults based on institutional ownership. The second column reports the results based on analyst following.Panel B reports the results from the tests of the predictability of OFFBL for future returns for firms with the highest rankof institutional ownership or analyst following.
Does Recognition versus Disclosure Affect Value Relevance? Evidence from Pension Accounting 1125
The Accounting ReviewMay 2013
Bhushan, R. 1994. An informational efficiency perspective on the post-earnings announcement drift.
Journal of Accounting and Economics 18: 45–65.
Bonner, S. E., B. R. Walther, and S. M. Young. 2003. Sophisticated and unsophisticated investors’
reactions to analysts’ forecast revisions conditional on factors that are associated with forecast
accuracy. The Accounting Review 78: 679–706.
Bushee, B. 1998. The influence of institutional investors on myopic R&D investment behavior. The
Accounting Review 73: 305–333.
Bushee, B. 2001. Do institutional investors prefer near-term earnings over long-run value? Contemporary
Accounting Research 18: 207–246.
Bushee, B., and C. Noe. 2000. Corporate disclosure practices, institutional investors, and stock return
volatility. Journal of Accounting Research 38: 171–202.
Callen, J. L., O. Hope, and D. Segal. 2005. Domestic and foreign earnings, stock return variability, and the
impact of investor sophistication. Journal of Accounting Research 43: 377–412.
Collins, D. W., G. Gong, and P. Hribar. 2003. Investor sophistication and the mispricing of accruals. Review
of Accounting Studies 8: 251–276.
Davis-Friday, P., L. Folami, C. Liu, and H. Mittelstaedt. 1999. The value relevance of financial statement
recognition vs. disclosure: Evidence from SFAS No. 106. The Accounting Review 74: 403–423.
Davis-Friday, P., C. Liu, and H. Mittelstaedt. 2004. Recognition and disclosure reliability: Evidence from
SFAS No. 106. Contemporary Accounting Research 21: 399–429.
Dearman, D., and M. Shields. 2005. Avoiding accounting fixation: Determinants of cognitive adaptation to
differences in accounting method. Contemporary Accounting Research 22: 351–384.
Dhaliwal, D. 1986. Measurement of financial leverage in the presence of unfunded pension liabilities. The
Accounting Review 61: 651–661.
D’Souza, J., K. Ramesh, and M. Shen. 2010. The interdependence between institutional ownership and
information dissemination by data aggregators. The Accounting Review 85: 159–193.
El-Gazzar, S. M. 1998. Predisclosure information and institutional ownership: A cross-sectional examination
of market revaluations during earnings announcement period. The Accounting Review 73: 119–129.
Espahbodi, H., P. Espahbodi, Z. Rezaee, and H. Rehranian. 2002. Stock price reaction and value relevance
of recognition vs. disclosure: The case of stock-based compensation. Journal of Accounting and
Economics 33: 343–373.
Frankel, R., and X. Li. 2004. The characteristics of a firm’s information environment and the information
asymmetry between insiders and outsiders. Journal of Accounting and Economics 37: 229–259.
Franzoni, F., and J. M. Marin. 2006. Pension plan funding and stock market efficiency. Journal of Finance
61: 921–956.
Frederickson, J. R., F. D. Hodge, and J. H. Pratt. 2006. The evolution of stock option accounting:
Disclosure, voluntary recognition, mandated recognition, and management disavowals. TheAccounting Review 81: 1073–1093.
Gompers, P., and A. Metrick. 2001. Institutional investors and equity prices. Quarterly Journal of
Economics 116: 229–59.
Gopalakrishnan, V. 1994. The effect of recognition vs. disclosure on investor valuation: The case of pension
accounting. Review of Quantitative Finance and Accounting 4: 383–396.
Hann, R. N., F. Heflin, and K. R. Subramanayam. 2007a. Fair-value pension accounting. Journal of
Accounting and Economics 44: 328–358.
Hann, R. N., Y. Lu, and K. R. Subramanayam. 2007b. Uniformity vs. flexibility: Evidence from pricing of
the pension obligation. The Accounting Review 82: 107–137.
Hirshleifer, D., and S. Teoh. 2003. Limited attention, information disclosure, and financial reporting.
Journal of Accounting and Economics 36: 337–386.
Hirst, E., and P. Hopkins. 1998. Comprehensive income reporting and analysts’ valuation judgments.
Journal of Accounting Research 36: 47–75.
Hirst, E., P. Hopkins, and J. Wahlen. 2004. Fair values, income measurement, and bank analysts’ risk and
valuation judgments. The Accounting Review 79: 453–472.
1126 Yu
The Accounting ReviewMay 2013
Hobson, J., and S. Kachelmeier. 2005. Strategic disclosure of risky prospects: A laboratory experiment. TheAccounting Review 80: 825–846.
Hong, H., T. Lim, and J. Stein. 2000. Bad news travels slowly: Size, analyst coverage, and the profitability
of momentum strategies. Journal of Finance 55: 265–295.
Johnson, T. 1992. Research on disclosure. Accounting Horizons 6: 101–103.
Ke, B., and K. Petroni. 2004. How informed are actively trading institutional investors? Evidence from their
trading behavior before a break in a string of consecutive earnings increases. Journal of AccountingResearch 42: 895–927.
Ke, B., and S. Ramalingegowda. 2005. Do institutional investors exploit the post-earnings announcement
drift? Journal of Accounting and Economics 39: 25–53.
Koonce, L., M. McAnally, and M. Mercer. 2005. How do investors judge the risk of financial items? TheAccounting Review 80: 221–241.
Kothari, S. P., and J. L. Zimmerman. 1995. Price and return models. Journal of Accounting and Economics20: 155–193.
Landsman, W. 1986. An empirical investigation of pension fund property rights. The Accounting Review61: 662–691.
Lang, M. H., K. V. Lins, and D. P. Miller. 2003. ADRs, analysts, and accuracy: Does cross listing in the
U.S. improve a firm’s information environment and increase market value? Journal of AccountingResearch 41: 317–45.
Libby, R., M. Nelson, and J. Hunton. 2006. Recognition v. disclosure, auditor tolerance for misstatement,
and the reliability of stock-compensation and lease information. Journal of Accounting Research 44:
533–560.
Maines, L., and L. McDaniel. 2000. Effects of comprehensive-income characteristics on nonprofessional
investors’ judgments: The role of financial statement presentation format. The Accounting Review 75:
179–207.
Mitra, S., and M. Hossain. 2009. Value-relevance of pension transition adjustments and other
comprehensive income components in the adoption year of SFAS No. 158. Review of QuantitativeFinance and Accounting 33: 279–301.
Moody’s Investor Services. 2006. Approach to Global Standard Adjustments in the Analysis of FinancialStatements for Non-Financial Corporations. (February). Available at: http://www3.nd.edu/;carecob/
April%202007%20Conference/Analytical%20Adjustments%20-%20Part%20I%20updated.pdf
Nizalova, O., and I. Murtazashvili. 2011. Exogenous Treatment and Endogenous Factors: Vanishing ofOmitted Variable Bias on the Interaction Term. Discussion paper, Kyiv School of Economics and
University of Pittsburgh.
O’Brien, P. 1988. Analysts’ forecasts as earnings expectations. Journal of Accounting and Economics 10:
59–193.
O’Brien, P., and R. Bhushan. 1990. Analyst following and institutional ownership. Journal of AccountingResearch 28: 55–76.
Ohlson, J. A. 1995. Earnings, book values, and dividends in equity valuation. Contemporary AccountingResearch 11: 661–688.
Picconi, M. 2006. The perils of pensions: Does pension accounting lead investors and analysts astray? TheAccounting Review 81: 925–955.
Walther, B. R. 1997. Investor sophistication and market earnings expectations. Journal of AccountingResearch 35: 157–179.
Washington Trust Bank. 2006. Defined Benefit Pension Liabilities: How Onerous are They? (December).
Available at: https://www.watrust.com/WealthMgmt/NewsThatMatters/Archive/WP_Defined_
Benefit_Pension_Liabilities.pdf
Xue, Y., and M. Zhang. 2011. Fundamental analysis, institutional investment, and limits to arbitrage.
Journal of Business Finance and Accounting 38: 1156–1183.
Does Recognition versus Disclosure Affect Value Relevance? Evidence from Pension Accounting 1127
The Accounting ReviewMay 2013


![NaviFields: Relevance fields for adaptive VR navigationsro.sussex.ac.uk/70845/1/NaviField.pdf · which can affect user’s presence [3], and might only be well suited for specific](https://img.pdfslide.us/doc/110x75/605b115e8cf57c6a6d093c28/navifields-relevance-fields-for-adaptive-vr-which-can-affect-useras-presence.jpg)