Embed Size (px)
Citation preview

Does Public-Sector Employment Fully Crowd Out Private-Sector Employment?
Alberto Behar and Junghwan Mok
WP/13/146

© 2013 International Monetary Fund WP/13/146
IMF Working Paper
Middle East and Central Asia Department
Does Public-Sector Employment Fully Crowd Out Private-Sector Employment?
Prepared by Alberto Behar and Junghwan Mok1
Authorized for distribution by Paul Cashin
June 2013
Abstract
We quantify the extent to which public-sector employment crowds out private-sector employment using specially assembled datasets for a large cross-section of developing and advanced countries, and discuss the implications for countries in the Middle East, North Africa, Caucasus and Central Asia. These countries simultaneously display high unemployment rates, low private-sector employment rates and high proportions of government-sector employment. Regressions of either private-sector employment rates or unemployment rates on two measures of public-sector employment point to full crowding out. This means that high rates of public employment, which incur substantial fiscal costs, have a large negative impact on private employment rates and do not reduce overall unemployment rates.
JEL Classification Numbers: J21, J23, J68, H59
Keywords: Employment, Crowding out, Middle East and Central Asia
Authors’ E-Mail Addresses: [email protected], [email protected]
1 The authors thank Gohar Abajyan, Kathleen Beegle, Paul Cashin, Allan Dizioli, Sanaa Farid, Prakash Loungani, Kia Penso, Mai Dao, participants in the Middle East and Central Asia Department Discussion Forum, and attendees at the World Bank Middle East and North Africa Office of the Chief Economist Seminar. This work was conducted while Mr. Mok was a summer intern in the Middle East and Central Asia Department, IMF.
This Working Paper should not be reported as representing the views of the IMF.
The views expressed in this Working Paper are those of the author(s) and do not necessarily represent those of the IMF or IMF policy. Working Papers describe research in progress by the author(s) and are published to elicit comments and to further debate.
2
Contents Page
I. Introduction ............................................................................................................................ 3
II. Literature Review ................................................................................................................. 5
III. Data Sources........................................................................................................................ 7
IV. Descriptive Analysis ........................................................................................................... 8
V. Econometric Analysis ........................................................................................................ 16 A. Specification and Estimation .......................................................................... 16
B. Unemployment and Public Employment ........................................................ 19 C. Private-Sector Employment and Public Employment .................................... 20 D. MCD Analysis ................................................................................................. 22 E. Implications for Labor Force Participation ..................................................... 23
VI. Conclusion ........................................................................................................................ 24
References ............................................................................................................................... 25 Appendix I. Regressions of Unemployment Rate on Public Employment ............................. 28 Appendix II. Regressions of Private-Sector Employment on Public Employment ................ 32 Appendix III. Regression with MCD Interaction Terms and Controls .................................. 36
Tables Table 1 : Public and Private Employment in the MCD Countries .................................. 13 Table 2 : Regression of Unemployment Rate on Public Employment Rate ................... 20 Table 3 : Regression of Private-Sector Employment Rate on Public Employment Rate ............................................................................................................................. 21 Table 4 : Regression with MCD Region Interaction Terms ........................................... 23 Figures Figure 1 : Overview of Key Labor Statistics, 2008–2011 average ................................... 8 Figure 2 : Unemployment Rate, weighted by labor force ................................................. 9
Figure 3 : Private-Sector Employment Rate ................................................................... 10 Figure 4 : The Importance of Public-Sector Employment, 2008–2011 average ............. 11
Figure 5 : Proportion of Public Employment in the MCD countries, latest year ............ 12 Figure 6 : Unemployment and Public Employment, 2006–11 average .......................... 15 Figure 7 : Correlation between Public- and Private-Sector Employment, 2006–11 average ........................................................................................................................ 15
3
I. INTRODUCTION
Unemployment fell over much of the first decade of the 21st century, but those gains are being reversed in the aftermath of the great recession of 2008. Employment rates are at their lowest levels in two decades. As noted by Layard, Nickell, and Jackman (2005), unemployment matters because it generally reduces output and income, increases inequality, erodes human capital, and has immeasurable psychic costs. Furthermore, unemployment decreases the chances that a young democracy will survive (Kapstein and Converse, 2008). As shown by the recent experiences of many of the Arab countries now undergoing political transitions, and as a warning to governments elsewhere, unemployment often goes hand in hand with political and macroeconomic instability. The primacy of this issue is evidenced by its being the topic of the World Bank flagship World Development Report 2013: Jobs (World Bank, 2012a). Unemployment is an especially important problem for many countries in the Middle East, North Africa, Caucasus, and Central Asia (Middle East and Central Asia Department (MCD) countries).2 The employment situation, which has been amongst the worst in the world, has received further recent setbacks following the onset of the Arab Spring, and faces additional challenges in the wake of a fast-growing labor force, such that it features regularly in a number of regional flagship reports.3 As the IMF warned well before the events of Tahrir Square,4 and as Campante and Chor (2012) argued thereafter, high unemployment may have contributed to the onset of an unprecedented wave of popular revolutions in the Middle East and North Africa. While many of the recent moves in unemployment have been related to the business cycle, structural unemployment remains a major component. There is an established literature investigating the importance of labor market institutions and other factors in explaining unemployment patterns.5 Within the realm of fiscal policy, lower tax wedges, wage subsidies, and active labor market programs could boost labor demand, while targeted tax relief, together with benefit and pension reform, could increase labor supply in advanced countries. These measures could complement more important structural reforms in the labor, capital, and product markets (IMF, 2012a). The contribution of this paper is to investigate the effects of public hiring of workers on labor market outcomes, specifically unemployment and private employment. In particular, does 2 These countries refer to IMF members in the IMF’s Middle East and Central Asia Department, plus Turkey and West Bank and Gaza.
3 See for example World Bank (2012b) and various issues of the Middle East and Central Asia Regional
Economic Outlook (IMF 2010, IMF 2011a, IMF 2011b).
4 See IMF (2010). Furthermore, the IMF Managing Director warned in Morocco in the summer of 2010 that the youth unemployment problem in the region was a “ticking time bomb”.
5 An extensive list includes Freeman (2005), Nickell (1997), and Blanchard and Wolfers (2000).

4
public hiring increase (“crowd in”) private employment or decrease (“crowd out”) private employment? If the latter, is the effect “partial crowding out,” such that the net effect is a fall in unemployment; “full crowding out”, such that overall unemployment is unchanged; or “more than full crowding out,” such that unemployment rises? Many would agree that crowding in would be a good outcome of government hiring and that a net rise in unemployment would be a bad outcome of government hiring. It is arguably the case that a private-sector job is more desirable than a public-sector job from a public policy point of view, because no change in unemployment means government resources could have been allocated elsewhere. Furthermore, there is evidence that a large government share in economic activity can be negative for long-term growth because of the distortionary effects of taxation, inefficient government spending due in part to rent-seeking or lower worker productivity, and the crowding out of private investment.6 As a result, it’s questionable whether partial crowding out—a fall in both unemployment and private-sector employment—would be worth the potential long-term growth impacts. Crowding out could occur through a number of channels. Derived labor demand can be affected through crowding out of the product market, possibly via higher taxes, higher interest rates, and competition from state-owned enterprises. It can occur through the labor market, where higher wages, more job security, or a higher probability of finding a public-sector job can make an individual more likely to seek or wait for public-sector employment rather than search for or accept a job in the private sector (Feldmann, 2009a, 2009b; Espinoza, forthcoming). Finally, it can occur in the education market, where individuals seek qualifications appropriate for entering the public sector rather than skills needed for productive employment in the private sector (Salehi-isfahani and Dhillon, 2008). For these reasons, a number of policy documents suggest that public-sector hiring is inhibiting private-sector employment in the Middle East and elsewhere (World Bank, 2012b; IMF, 2012a). As discussed in Section II, there is prior evidence that crowding-out effects are sufficiently large to increase unemployment in a number of advanced countries. However, there has hitherto not been a thorough investigation of how public employment affects labor market outcomes in developing countries. We fill this gap in the literature by investigating the effects of public employment on both private employment and on unemployment. An important part of our contribution lies in the assembly of the dataset to expand the number of non-OECD countries, as is described in Section III. We also pay special attention to the MCD countries, where crowding out has been suspected as part of the explanation for its poor labor market performance,7 and where the data gaps have been especially large. Our dataset contains two measures of public employment. The first is a narrow measure corresponding to employment in the public administration based on occupation type, while the broader measure can also include other forms of public employment, including state-owned enterprises.
6 See Easterly and Rebelo (1993), Barro and Sala-i-Martin (2004), and Aschauer (1989).
7 See IMF (2010), Salehi-isfahani and Dhillon (2008), World Bank ( 2012b), and Espinoza (forthcoming).
5
In Section IV, the data confirm stylized facts that unemployment and private-sector employment outcomes in the MCD are among the worst in the world, and that the relative size of government employment is high by global standards. The data also suggest that the relative importance of government employment has been falling over time, but may not be capturing recent pressures to accelerate public-sector hiring. Our core empirical analysis in Section V relies on four sets of regression specifications, namely regressions of unemployment on public employment and of private employment on public employment, using both broad and narrow measures of public employment and a variety of estimation approaches. Overall, the results point to full crowding out; that is, every public job comes at the cost of a private-sector job, and does not reduce overall unemployment. In reverse, the results imply that public restraint does not exacerbate unemployment. For the MCD countries, there is slight evidence of larger crowding-out effects. As a result, Section VI suggests that public-sector hiring at best offers no employment benefit and should be replaced with more socially beneficial fiscal expenditure. It also offers suggestions for further research.
II. LITERATURE REVIEW
While there has been extensive research on government crowding out of private investment (Aschauer, 1989), and on the importance of public employment in fiscal policy, few studies have explored the crowding-out effects of public-sector employment on private-sector employment and, hence, unemployment. The most related and relevant work to this paper is by Algan et al. (2002), who explore the consequences of public-sector employment for labor market performance. Using pooled cross-section and annual time-series data for 17 OECD countries from 1960 to 2000, they run regressions of the unemployment rate and/or the private-sector employment rate on the public-sector employment rate. Empirical evidence from the employment equation suggests that the creation of 100 public jobs crowds out 150 private-sector jobs. The unemployment equation estimates suggest that 100 public jobs add 33 unemployed workers overall. Either equation points to more than full crowding out. Combining the two results, the authors infer that 17 individuals would leave the labor force. Malley and Moutos (1996) find evidence of full crowding out in Sweden by applying Vector Error Correction Model estimation to time series data on public and private employment. Crowding out can occur through the product market if government activity replaces products that would have been provided by the private sector. They theoretically point out that the substitutability of public and private goods is the key determinant of the size of the crowding-out effect. The increase in public jobs to produce highly substitutable products can directly displace private jobs. However, if public and private products are complements, there’s the possibility of crowding in if the public service improves the marginal product of labor in the private sector. Algan et al. (2002) also find stronger crowding-out effects in countries where the share of public spending in substitutable activities is high. In addition to the above papers, which emphasize crowding out through the product market, some studies try to isolate crowding out through the labor market. For example, public-sector
6
employment practices can drive up wages in the private sector. Demekas and Kontolemis (2000) emphasize the different objective of the government from that of the private sector as an employer. Thus, its decision directly impacts labor market performance through the wage determination channel. They test their argument empirically using unemployment, public employment, and public and private wage data for Greece. VAR estimation shows that an increase in public wages leads to a more than proportional increase in private wages such that there is an increase in the private to public wage differential. It also shows that unemployment is positively correlated with the private to public wage differential, which implies public-sector crowding out of private-sector employment through wages.8 Faggio and Overman (2012) emphasize wage effects and the tradability of goods in the local economy. In their theoretical framework, an increase in local employment in the public sector leads to an increase in local wages, which reduces private employment; but it also leads to a subsequent increase in local demand for goods. The increased local demand for nontradable goods leads to higher employment, while demand for tradable goods has no employment effect if local demand is negligible relative to total demand. As a result, public-sector employment crowds out employment in the tradable sector but crowds in employment in the nontradable sector. Using UK regional survey data, they find that the size of crowding out in the tradable sector is about the same as the crowding-in effect in the nontradable sector, so there is no crowding-out effect overall in the short run. However, they find that crowding out occurs over a longer time period. All the papers above treat advanced countries. To the best of our knowledge, very little empirical work in this area has been extended to developing countries. Feldmann (2009a, 2009b) analyzes the effect of government size on the unemployment rate in developing countries. Regressions on panel data show that a larger public sector is correlated with higher overall unemployment rates, as well as with unemployment among women and youth. Moreover, a larger public sector increases the share of long-term unemployed in the total number of unemployed. However, in the Feldmann studies, the overall size of government is measured by the sub-index ‘size of government’ from the ‘Economic Freedom of the World’ index. This sub-index9 includes high income taxes, high interest rates due to government investment, and a number of other potential channels through which unemployment can be increased. However, the aforementioned study is not about crowding out effects of public sector employment and does not make any use of public and private employment data. The next section describes how we build a panel data set of private and public employment that includes both advanced and developing countries. 8 Lamo, Perez, and Schuknecht (2012) find that the private sector appears to have a stronger influence on the public sector than the reverse, but Perez and Sanchez (2010) find the opposite.
9 This index consists of general government consumption (as a percentage of total consumption), transfers and subsidies (as a percentage of GDP), the role of state-owned enterprises in the economy, government investment (as a percentage of total investment), and income/payroll taxes.

7
III. DATA SOURCES
We have collected data for up to 194 countries over the period 1988–2011. The primary sources for standard labor market data, including unemployment rates and the labor force, are the Key Indicators of the Labor Market (KILM) and LABORSTA databases provided by the International Labor Organization (ILO) as well as the IMF World Economic Outlook (WEO). Our contribution to the literature includes the assembly of data on public and private employment and other indicators for a wide range of developing and advanced countries. MCD countries’ employment data is especially limited in terms of sample length, country coverage, and consistency. Taking care to generate consistent series, we supplement the above sources with MCD data from various individual country reports and specific pieces of data provided to the IMF by the country authorities. Definitions of “public sector” are different across countries and organizations, so we choose two definitions and generate corresponding public employment datasets, namely a “narrow” measure also referred to as “public administration” and a “broad” measure. 1. When the national authorities report their labor force statistics to the ILO and other sources, they categorize all occupations according to United Nations’ International Standard Industrial Classification of economic activity (ISIC). Among these occupations, “Public administration and defense; compulsory social security” is the one related to the public sector. We use this as the ‘narrow’ measure of public employment, which we also refer to as ‘public administration’ employment, which excludes other public investment or business activities.10
2. Meanwhile, in addition to the public employment data above, the ILO LABORSTA dataset provides its own collection of public sector employment data, “Public Sector Employment”. This dataset includes not only governmental agencies but also state-owned enterprises (SOEs).11 We call this the ‘broad’ measure of public employment, preserving the term ‘public sector’.
Since many countries do not report private-sector employment separately, we calculate private-sector employment by subtracting public employment from total employment where necessary. Thus, the “narrow” and “broad” measures produce two corresponding private-sector employment datasets. We will refer to both series as “private-sector employment” or
10 Detailed definitions can be found at the United Nations Statistics Division homepage (http://unstats.un.org), which states: “This section includes activities of a governmental nature, normally carried out by the public administration. This includes the enactment and judicial interpretation of laws and their pursuant regulation, as well as the administration of programs based on them, legislative activities, taxation, national defense, public order and safety, immigration services, foreign affairs and the administration of government programs. This section also includes compulsory social security activities.”
11 Detailed definitions can be found on the ILO homepage (http://laborsta.ilo.org). The following forms part of the explanation: “The total public sector employment covers all employment of general government sector as defined in System of National Accounts 1993 plus employment of publicly owned enterprises and companies, resident and operating at central, state (or regional) and local levels of government. It covers all persons employed directly by those institutions, without regard for the particular type of employment contract.”
8
just “private employment” regardless of whether these correspond to the broad or narrow measures of public employment. When calculating public and private employment rates, we divide private and public employment by the labor force, which is primarily obtained from the ILO and supplemented with data from other sources. Similarly, the ILO is the principal source of unemployment data. For regression purposes, we construct another dataset consisting of control variables. Real GDP growth, the urbanization rate, and trade openness are drawn from the IMF WEO database. In addition, we extract the labor rigidity indicators from the “Economic Freedom of the World (EFW)” index. We will discuss control variables when we describe our specification of regression models.
IV. DESCRIPTIVE ANALYSIS
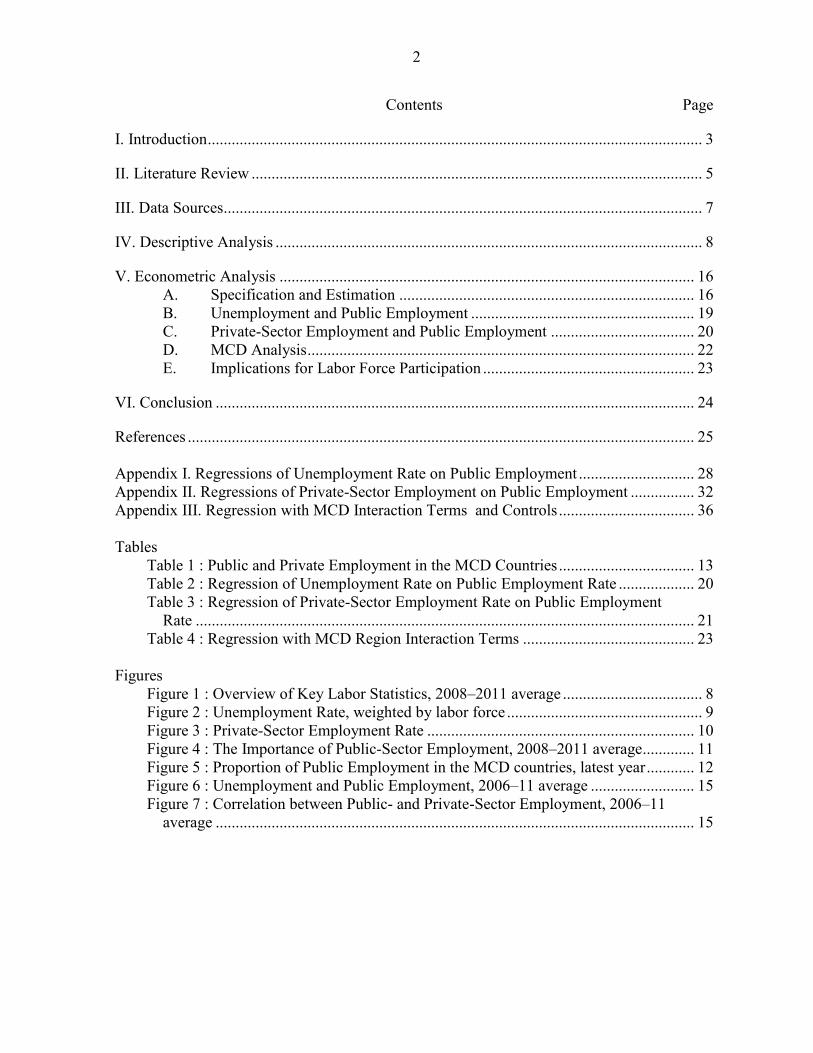
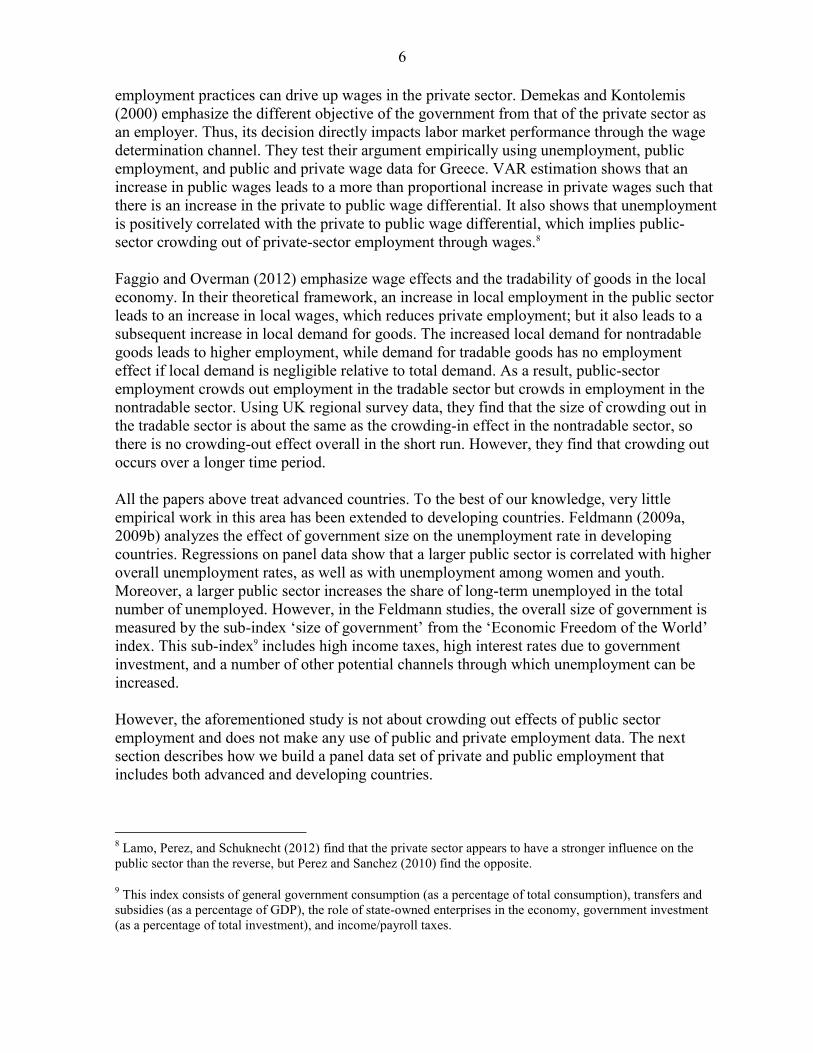
Figure 1 demonstrates the problem and the potential cause we seek to investigate: The MCD region has higher unemployment, lower private-sector employment, and a much more prominent role for the state as an employer than the rest of the world (ROW).
Figure 1: Overview of Key Labor Statistics, 2008–2011 average
Sources: Country authorities; and International Labor Organization.
In particular, the left panel shows that the MCD unemployment rate, which averages about 9 percent, is almost one and a half times that of the ROW. If we define the private sector as those not in any public-sector employment including SOEs, the blue bar in the middle panel shows that the MCD private-sector employment rate, at about 70 percent, is almost 10
9
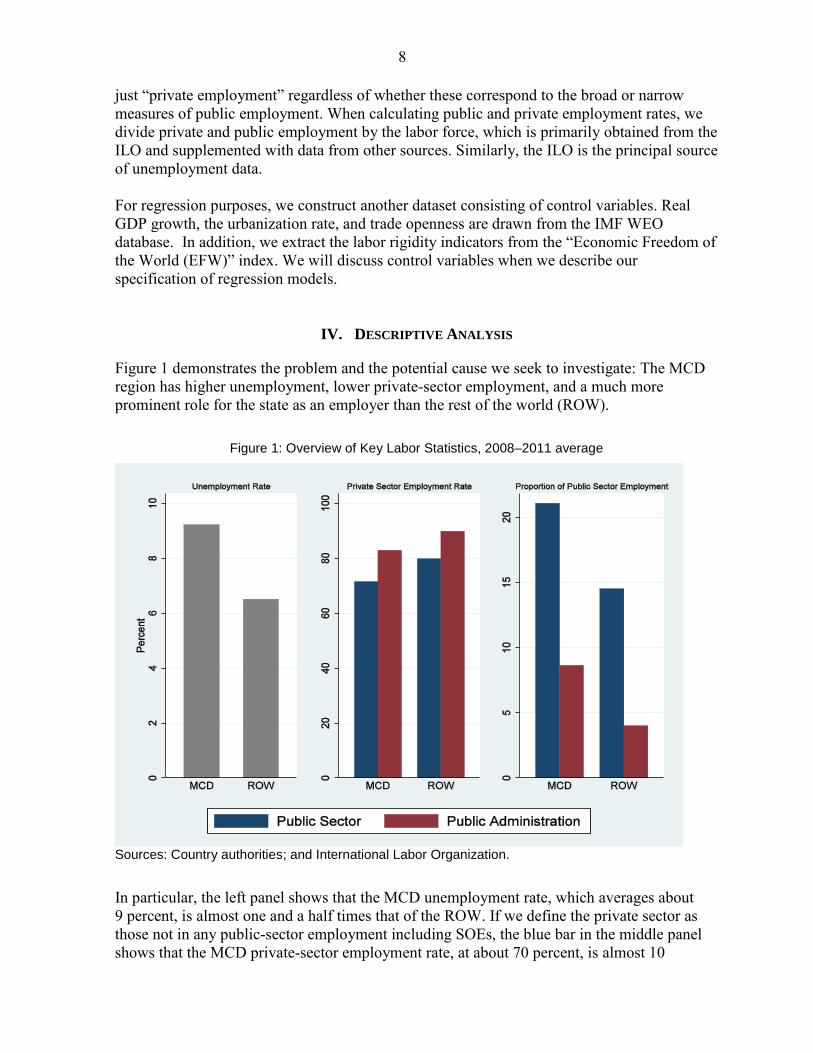
percentage points lower than in the ROW. Using the same definition, the blue bar in the right panel shows that more than 20 percent of all MCD employees are in the public sector, which is one and a half times as high as elsewhere. Using instead the definitions in red, where the private sector is defined as those not in the public administration, it can be seen that private-sector employment rates are also lower in the MCD than the rest of the world, and that the proportion of MCD employment in the public administration is higher than elsewhere. The rest of this section sets out to describe these facts in more detail. We divide the MCD countries into two groups: The MENAP12 countries and the CCA13 countries. We group the other countries following the country classification in the IMF’s World Economic Outlook and choose four groups for comparison: Advanced Economies (ADV), Developing Asia (Asia), Central and Eastern Europe (CEE) and Latin America and the Caribbean (LAC). In order to maintain a consistent sample despite numerous gaps in data availability, and to remove the effect of cyclical fluctuation, we average the variables over four-year periods.
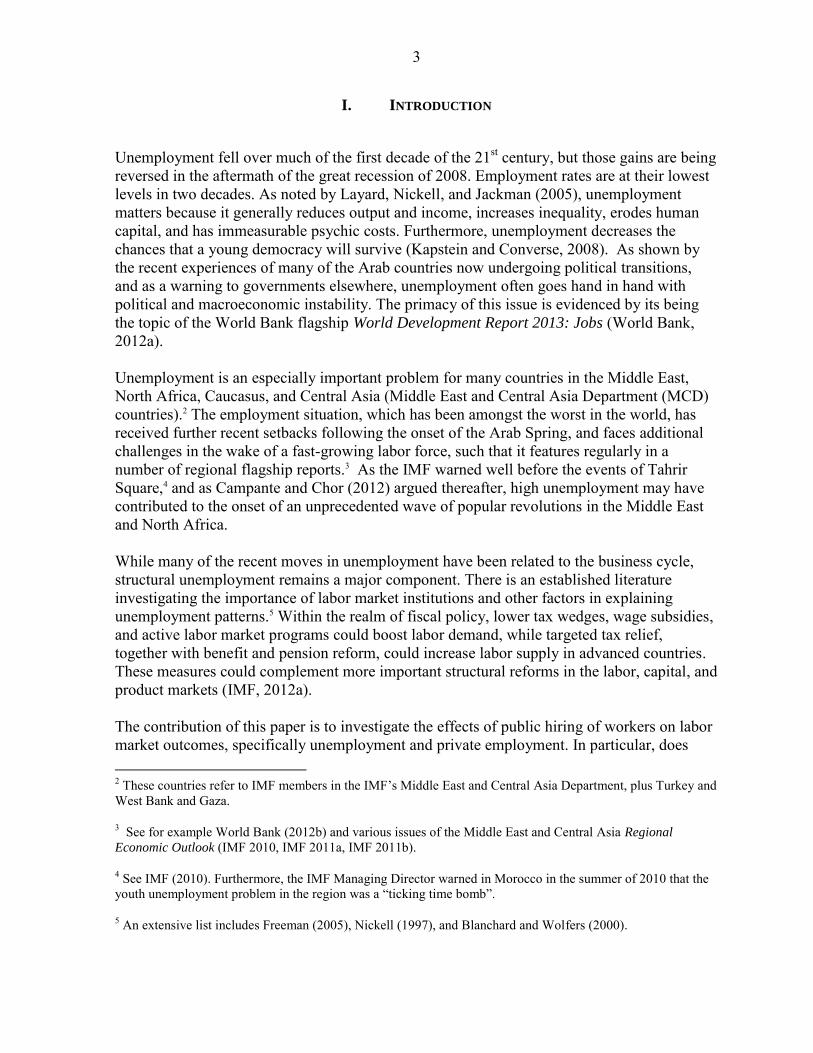
Figure 2: Unemployment Rate, weighted by labor force
Sources: Country authorities; and International Labor Organization.
Figure 2 presents the evolution of unemployment. The regional average is weighted by the size of the labor force in each country. The MENAP region shows a high unemployment rate, consistently around 10 percent. This is currently similar in magnitude to the rate in the CCA
12 Subject to data availability, MENAP refers to the countries of the Middle East and North Africa, and includes Afghanistan and Pakistan, which are IMF members in the Middle East and Central Asia Department, as well as Turkey and the West Bank and Gaza. See also IMF (2012b) for additional information.
13 CCA denotes the following Caucasus and Central Asia countries: Armenia, Azerbaijan, Georgia, Kazakhstan, Kyrgyz Republic, Tajikistan, Turkmenistan, and Uzbekistan.
10
countries14 for which consistent long-range data are available, and where unemployment has been falling since 2000. This graph confirms that unemployment is generally a chronic problem in the MCD region.15 The CEE region, which shares many economic and historical characteristics with the CCA countries, also shares unemployment patterns.
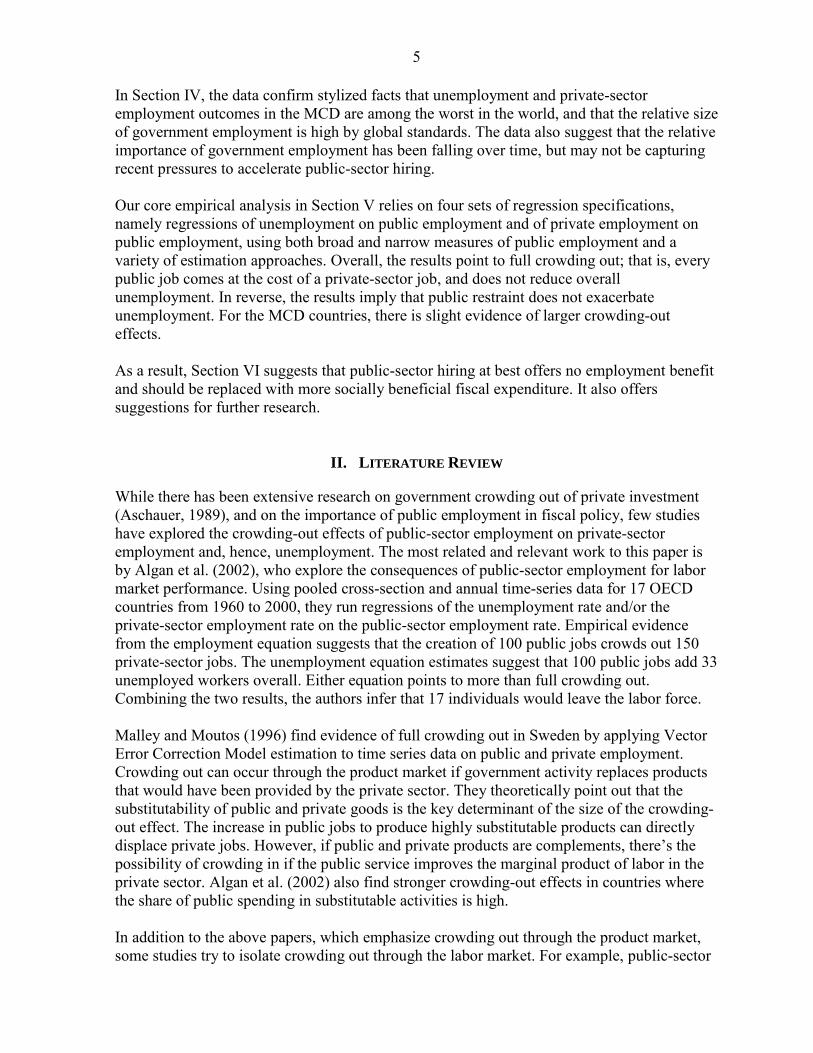
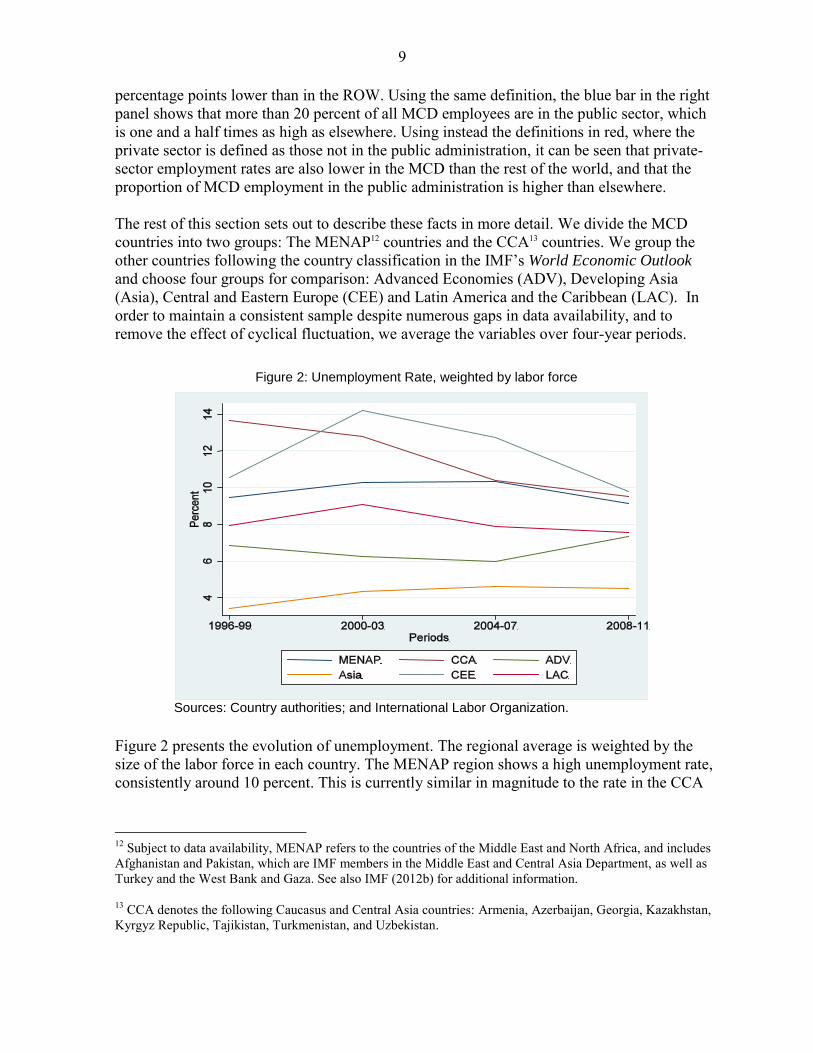
Figure 3: Private-Sector Employment Rate
Sources: Country authorities; and International Labor Organization.
Figure 3 presents the regional averages of private-sector employment rates weighted by the labor force. The left (right) panel shows the private-sector employment rate that corresponds to the broad (narrow) definition of public-sector employment, which was in blue (red) in Figure 1. In the left panel, we see that the employment rate for the MCD countries is lower than in all regions except the CEE, and that this has been the case for a long time. We also see that both the CCA and CEE experienced similar substantial rises in private-sector employment rates. In the right panel, we see that MENAP private-sector employment rates are by far the lowest, and have been so since at least the mid-1990s, although they show some signs of increasing slightly since 2000. CCA private-sector employment, which in this
14 Due to the data availability over a sufficiently long period, the weighted average for CCA unemployment is calculated only with Armenia, Azerbaijan, Georgia, Kazakhstan, and Kyrgyz Republic.
15 Depending on the choice of regional grouping, the MENA region is often calculated to have the highest regional unemployment average in the world, especially for youth unemployment. See for example World Bank (2012c).
11
definition includes employees in SOEs, is not materially lower than most regions and also appears to show a slight rise since 2000.
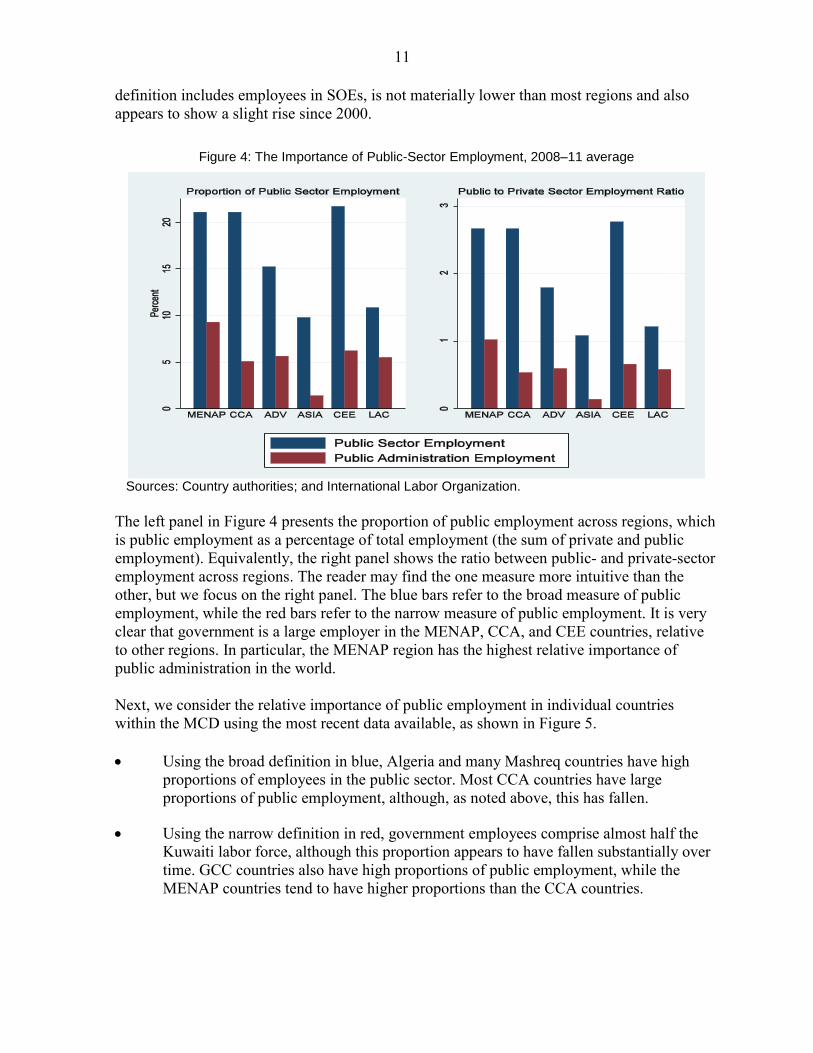
Figure 4: The Importance of Public-Sector Employment, 2008–11 average
Sources: Country authorities; and International Labor Organization.
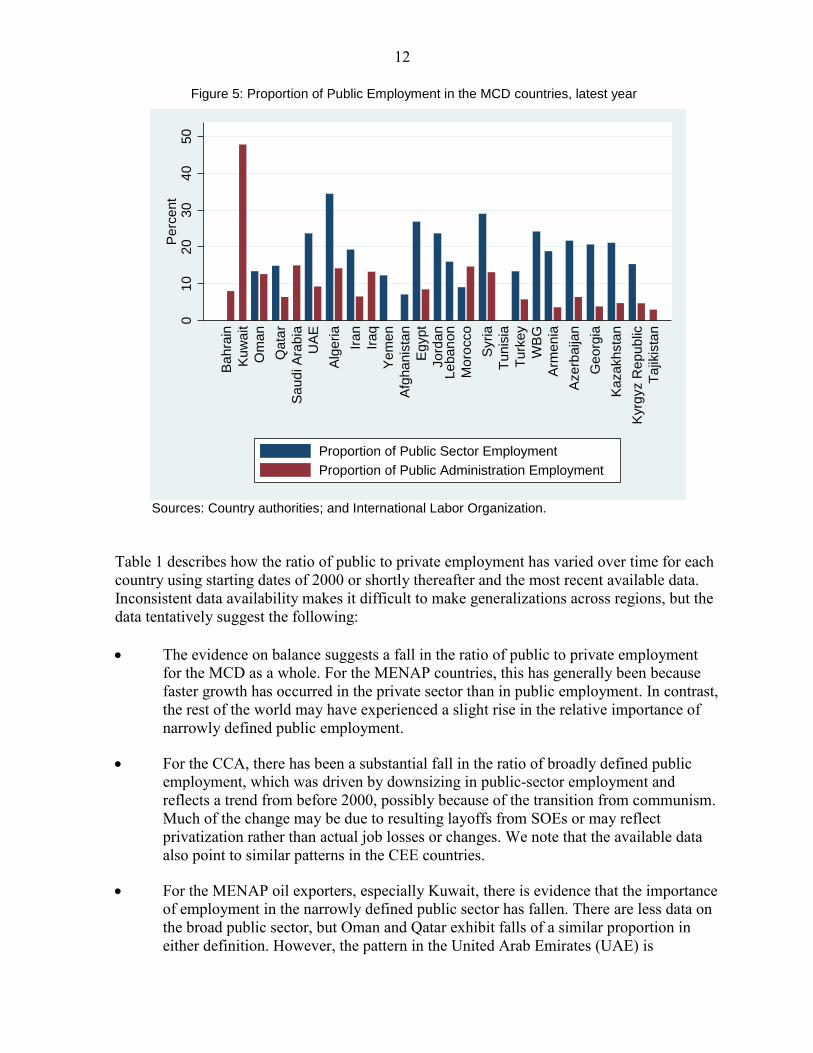
The left panel in Figure 4 presents the proportion of public employment across regions, which is public employment as a percentage of total employment (the sum of private and public employment). Equivalently, the right panel shows the ratio between public- and private-sector employment across regions. The reader may find the one measure more intuitive than the other, but we focus on the right panel. The blue bars refer to the broad measure of public employment, while the red bars refer to the narrow measure of public employment. It is very clear that government is a large employer in the MENAP, CCA, and CEE countries, relative to other regions. In particular, the MENAP region has the highest relative importance of public administration in the world. Next, we consider the relative importance of public employment in individual countries within the MCD using the most recent data available, as shown in Figure 5. Using the broad definition in blue, Algeria and many Mashreq countries have high
proportions of employees in the public sector. Most CCA countries have large proportions of public employment, although, as noted above, this has fallen.
Using the narrow definition in red, government employees comprise almost half the Kuwaiti labor force, although this proportion appears to have fallen substantially over time. GCC countries also have high proportions of public employment, while the MENAP countries tend to have higher proportions than the CCA countries.
12
Figure 5: Proportion of Public Employment in the MCD countries, latest year
Sources: Country authorities; and International Labor Organization.
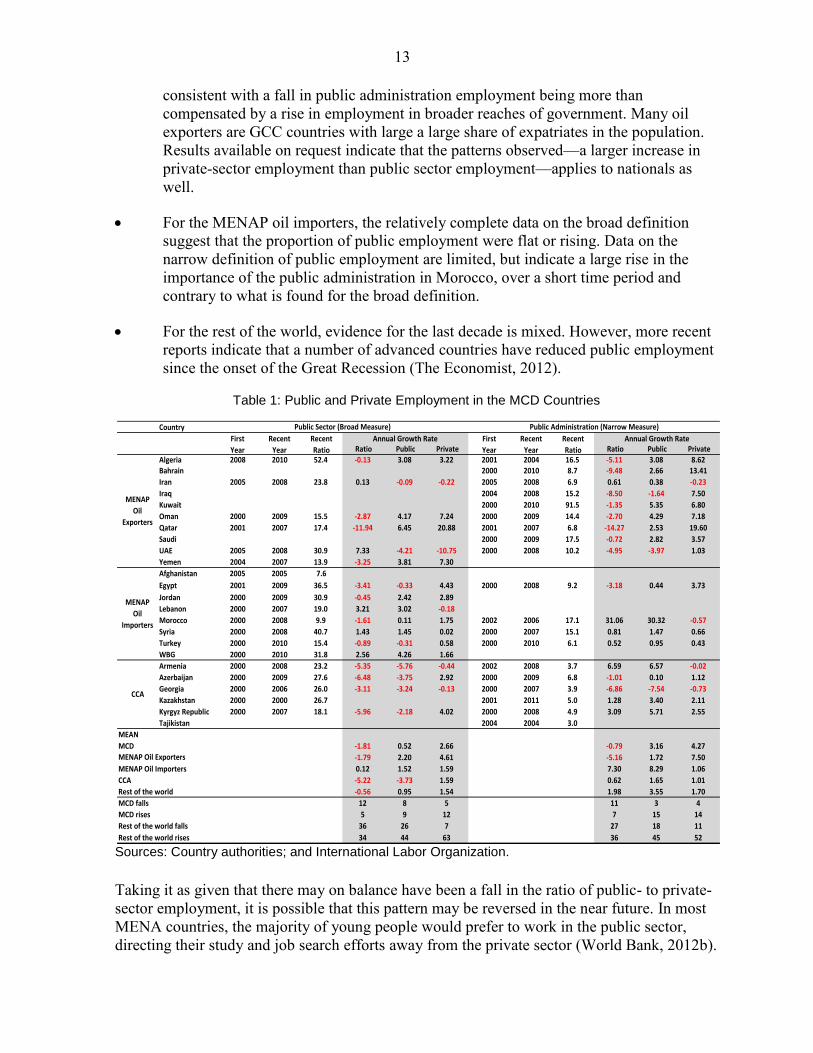
Table 1 describes how the ratio of public to private employment has varied over time for each country using starting dates of 2000 or shortly thereafter and the most recent available data. Inconsistent data availability makes it difficult to make generalizations across regions, but the data tentatively suggest the following: The evidence on balance suggests a fall in the ratio of public to private employment
for the MCD as a whole. For the MENAP countries, this has generally been because faster growth has occurred in the private sector than in public employment. In contrast, the rest of the world may have experienced a slight rise in the relative importance of narrowly defined public employment.
For the CCA, there has been a substantial fall in the ratio of broadly defined public employment, which was driven by downsizing in public-sector employment and reflects a trend from before 2000, possibly because of the transition from communism. Much of the change may be due to resulting layoffs from SOEs or may reflect privatization rather than actual job losses or changes. We note that the available data also point to similar patterns in the CEE countries.
For the MENAP oil exporters, especially Kuwait, there is evidence that the importance of employment in the narrowly defined public sector has fallen. There are less data on the broad public sector, but Oman and Qatar exhibit falls of a similar proportion in either definition. However, the pattern in the United Arab Emirates (UAE) is
010
20
30
40
50
Perc
ent
Ba
hra
in
Kuw
ait
Om
an
Qata
r
Saud
i A
rabia
UA
E
Alg
eri
a
Ira
n
Ira
q
Ye
me
n
Afg
han
ista
n
Eg
ypt
Jo
rda
nLe
ban
on
Moro
cco
Syri
a
Tu
nis
ia
Turk
ey
WB
G
Arm
en
ia
Azerb
aija
n
Ge
org
ia
Kazakhsta
n
Kyrg
yz R
epublic
Ta
jikis
tan
Proportion of Public Sector Employment
Proportion of Public Administration Employment
13
consistent with a fall in public administration employment being more than compensated by a rise in employment in broader reaches of government. Many oil exporters are GCC countries with large a large share of expatriates in the population. Results available on request indicate that the patterns observed—a larger increase in private-sector employment than public sector employment—applies to nationals as well.
For the MENAP oil importers, the relatively complete data on the broad definition suggest that the proportion of public employment were flat or rising. Data on the narrow definition of public employment are limited, but indicate a large rise in the importance of the public administration in Morocco, over a short time period and contrary to what is found for the broad definition.
For the rest of the world, evidence for the last decade is mixed. However, more recent reports indicate that a number of advanced countries have reduced public employment since the onset of the Great Recession (The Economist, 2012).
Table 1: Public and Private Employment in the MCD Countries
Sources: Country authorities; and International Labor Organization.
Taking it as given that there may on balance have been a fall in the ratio of public- to private-sector employment, it is possible that this pattern may be reversed in the near future. In most MENA countries, the majority of young people would prefer to work in the public sector, directing their study and job search efforts away from the private sector (World Bank, 2012b).
Country
Ratio Public Private Ratio Public Private
Algeria 2008 2010 52.4 -0.13 3.08 3.22 2001 2004 16.5 -5.11 3.08 8.62
Bahrain 2000 2010 8.7 -9.48 2.66 13.41
Iran 2005 2008 23.8 0.13 -0.09 -0.22 2005 2008 6.9 0.61 0.38 -0.23
Iraq 2004 2008 15.2 -8.50 -1.64 7.50
Kuwait 2000 2010 91.5 -1.35 5.35 6.80
Oman 2000 2009 15.5 -2.87 4.17 7.24 2000 2009 14.4 -2.70 4.29 7.18
Qatar 2001 2007 17.4 -11.94 6.45 20.88 2001 2007 6.8 -14.27 2.53 19.60
Saudi 2000 2009 17.5 -0.72 2.82 3.57
UAE 2005 2008 30.9 7.33 -4.21 -10.75 2000 2008 10.2 -4.95 -3.97 1.03
Yemen 2004 2007 13.9 -3.25 3.81 7.30
Afghanistan 2005 2005 7.6
Egypt 2001 2009 36.5 -3.41 -0.33 4.43 2000 2008 9.2 -3.18 0.44 3.73
Jordan 2000 2009 30.9 -0.45 2.42 2.89
Lebanon 2000 2007 19.0 3.21 3.02 -0.18
Morocco 2000 2008 9.9 -1.61 0.11 1.75 2002 2006 17.1 31.06 30.32 -0.57
Syria 2000 2008 40.7 1.43 1.45 0.02 2000 2007 15.1 0.81 1.47 0.66
Turkey 2000 2010 15.4 -0.89 -0.31 0.58 2000 2010 6.1 0.52 0.95 0.43
WBG 2000 2010 31.8 2.56 4.26 1.66
Armenia 2000 2008 23.2 -5.35 -5.76 -0.44 2002 2008 3.7 6.59 6.57 -0.02
Azerbaijan 2000 2009 27.6 -6.48 -3.75 2.92 2000 2009 6.8 -1.01 0.10 1.12
Georgia 2000 2006 26.0 -3.11 -3.24 -0.13 2000 2007 3.9 -6.86 -7.54 -0.73
Kazakhstan 2000 2000 26.7 2001 2011 5.0 1.28 3.40 2.11
Kyrgyz Republic 2000 2007 18.1 -5.96 -2.18 4.02 2000 2008 4.9 3.09 5.71 2.55
Tajikistan 2004 2004 3.0
MEAN
MCD -1.81 0.52 2.66 -0.79 3.16 4.27
-1.79 2.20 4.61 -5.16 1.72 7.50
MENAP Oil Importers 0.12 1.52 1.59 7.30 8.29 1.06
CCA -5.22 -3.73 1.59 0.62 1.65 1.01
Rest of the world -0.56 0.95 1.54 1.98 3.55 1.70
MCD falls 12 8 5 11 3 4
MCD rises 5 9 12 7 15 14
Rest of the world falls 36 26 7 27 18 11
Rest of the world rises 34 44 63 36 45 52
Public Sector (Broad Measure) Public Administration (Narrow Measure)
First
Year
Recent
Year
Recent
Ratio
Annual Growth Rate First
Year
Recent
Year
Recent
Ratio
Annual Growth Rate
MENAP
Oil
Exporters
MENAP
Oil
Importers
CCA
MENAP Oil Exporters
14
Over the next few years, GDP growth rates are expected to be substantially lower than they were over the observed data period leading up to the 2008 collapse of Lehman Brothers, because of the ensuing global slowdown and the political unrest associated with the events of the Arab Spring, despite the beneficial effects of high oil prices for hydrocarbon exporters (IMF, 2012b). All other things being equal, this slower growth will entail a slower rate of private-sector job creation. In contrast, either due to political pressure associated with the turmoil or to spend the proceeds of a commodity boom (Frankel, Vegh, and Vuletin, 2012), a number of initiatives to increase government employment have been announced in the MENAP region (IMF, 2011a), which could result in an acceleration in hiring and wage bills.16 These initiatives accompany measures to increase government wages and benefits. As a result, recent budget information and IMF forecasts point to a substantial rise in government expenditure on public employment in both the MENAP and CCA countries (IMF, 2012b).
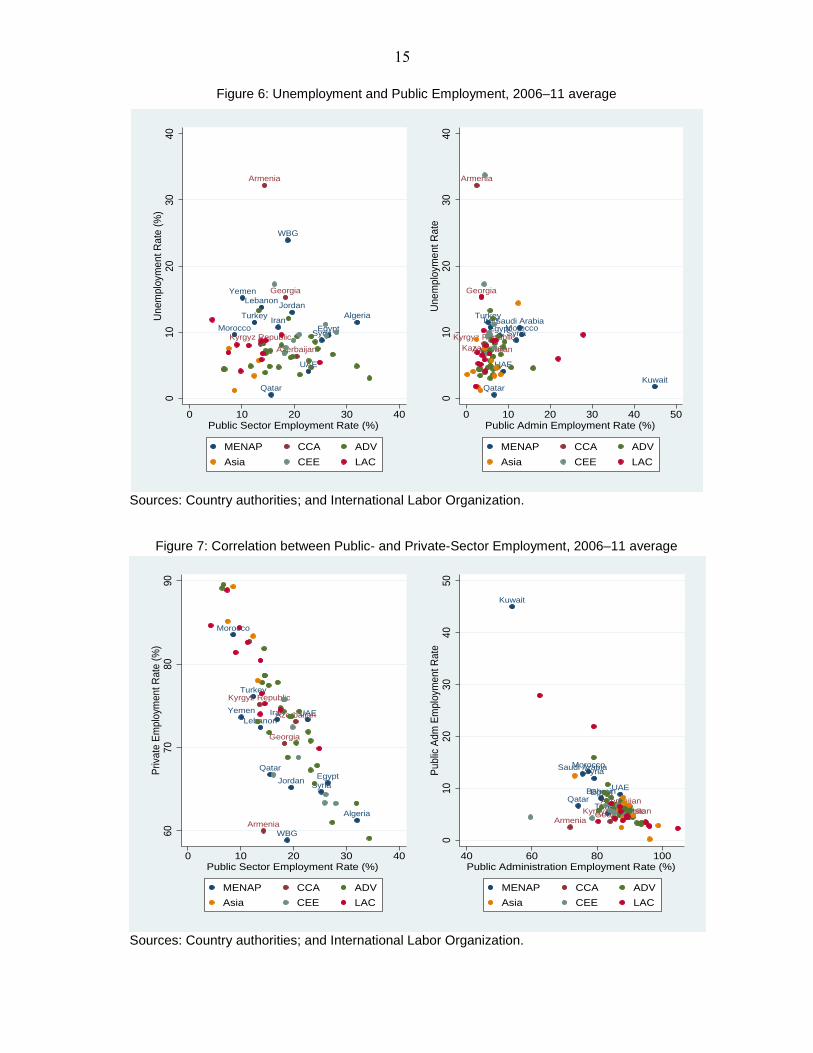
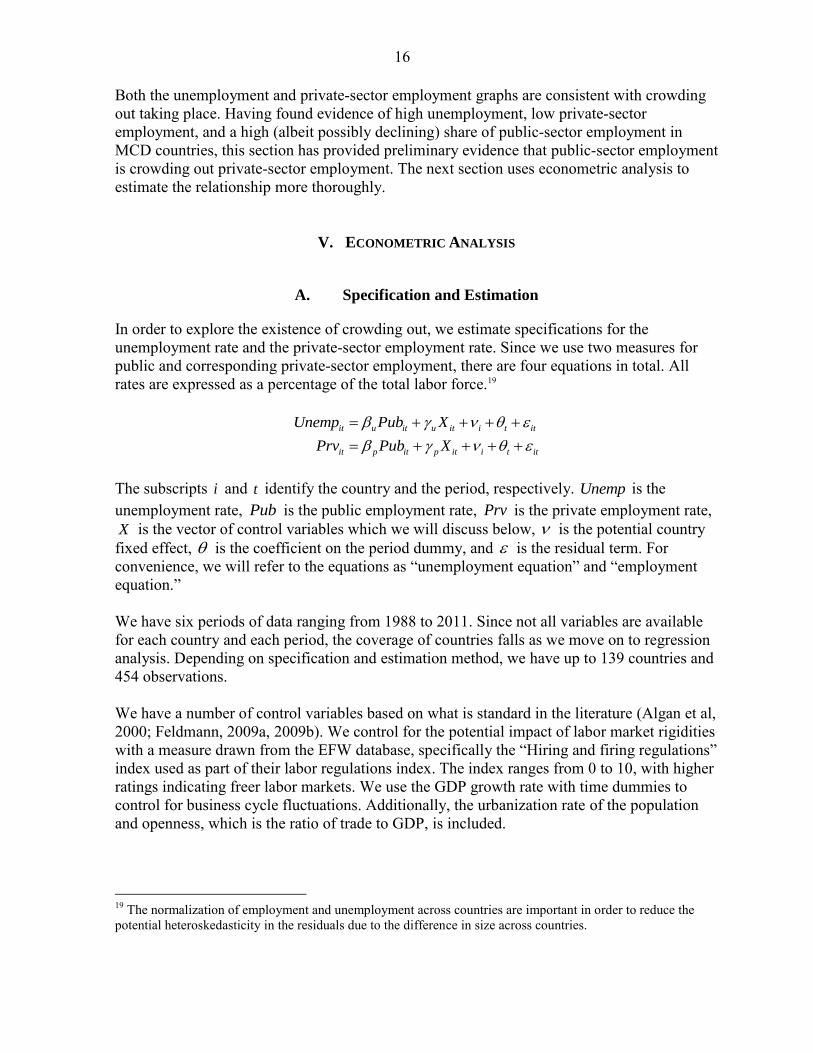
Having described the characteristics of the key variables, we begin to investigate if they are correlated. Figure 6 shows the relationship between the unemployment rate17 and public-sector employment rates with different measures. Whether we use the broad definition (left panel) or the narrow definition (right panel), there is no clear relationship between unemployment and public employment. Variations in unemployment in the MCD region and elsewhere could be due to a number of structural factors.18 Potential causes pertinent to the MCD countries could include the demographic transition, skills mismatches, labor market rigidities, and high reservation wages (IMF, 2010). While there is no obvious relationship between public employment and overall unemployment, Figure 7 shows a striking result. Both graphs show clear negative correlations between the public employment rate and the private-sector employment rate. The left panel, with the broad measure, implies a strong negative relationship. The graphical evidence suggests that this negative relationship applies across the world and within the MCD region in particular.
16 To give some context, the 2012 budget of Oman plans to hire more than 36,000 Omanis in the public sector, which would be twice the historical rate. For Saudi Arabia, the 2012 budget provides for an additional 60,000 jobs in the Ministry of the Interior alone, which would be well above the historical rate for the entire government.
17 Armenia has high unemployment rates according to the ILO data, which we use for its broader coverage, but the more limited unemployment data available on the WEO database indicates unemployment rates of nearly 20 percent.
18 See for example Freeman (2005), Nickell (1997), Blanchard and Wolfers (2000), Baker, Glynn, Howell and Schmitt (2007) as well as Bernal-Verdugo, Furceri and Guillaume (2012) for differing views.
15
Figure 6: Unemployment and Public Employment, 2006–11 average
Sources: Country authorities; and International Labor Organization.
Figure 7: Correlation between Public- and Private-Sector Employment, 2006–11 average
Sources: Country authorities; and International Labor Organization.
Algeria
EgyptIran
JordanLebanon
Morocco
Qatar
Syria
Turkey
UAE
WBG
Yemen
Armenia
Azerbaijan
Georgia
Kyrgyz Republic
01
02
030
40
Un
em
plo
yme
nt R
ate
(%
)
0 10 20 30 40Public Sector Employment Rate (%)
MENAP CCA ADV
Asia CEE LAC
EgyptIran
Kuwait
Morocco
Qatar
Saudi Arabia
Syria
Turkey
UAE
Armenia
Azerbaijan
Georgia
Kazakhstan
Kyrgyz Republic
01
02
030
40
Une
mp
loym
en
t R
ate
0 10 20 30 40 50Public Admin Employment Rate (%)
MENAP CCA ADV
Asia CEE LAC
Algeria
Egypt
Iran
Jordan
Lebanon
Morocco
Qatar
Syria
Turkey
UAE
WBG
Yemen
Armenia
Azerbaijan
Georgia
Kyrgyz Republic
60
70
80
90
Priva
te E
mplo
ymen
t R
ate
(%
)
0 10 20 30 40Public Sector Employment Rate (%)
MENAP CCA ADV
Asia CEE LAC
BahrainEgypt
Iran
Kuwait
Morocco
Qatar
Saudi ArabiaSyria
Turkey
UAE
Armenia
Azerbaijan
GeorgiaKazakhstanKyrgyz Republic
010
20
30
40
50
Pu
blic
Ad
m E
mplo
yme
nt R
ate
40 60 80 100Public Administration Employment Rate (%)
MENAP CCA ADV
Asia CEE LAC
16
Both the unemployment and private-sector employment graphs are consistent with crowding out taking place. Having found evidence of high unemployment, low private-sector employment, and a high (albeit possibly declining) share of public-sector employment in MCD countries, this section has provided preliminary evidence that public-sector employment is crowding out private-sector employment. The next section uses econometric analysis to estimate the relationship more thoroughly.
V. ECONOMETRIC ANALYSIS
A. Specification and Estimation
In order to explore the existence of crowding out, we estimate specifications for the unemployment rate and the private-sector employment rate. Since we use two measures for public and corresponding private-sector employment, there are four equations in total. All rates are expressed as a percentage of the total labor force.19
it u it u it i t it
it p it p it i t it
Unemp Pub X
Prv Pub X
The subscripts i and t identify the country and the period, respectively. Unemp is the unemployment rate, Pub is the public employment rate, Prv is the private employment rate, X is the vector of control variables which we will discuss below, is the potential country fixed effect, is the coefficient on the period dummy, and is the residual term. For convenience, we will refer to the equations as “unemployment equation” and “employment equation.” We have six periods of data ranging from 1988 to 2011. Since not all variables are available for each country and each period, the coverage of countries falls as we move on to regression analysis. Depending on specification and estimation method, we have up to 139 countries and 454 observations. We have a number of control variables based on what is standard in the literature (Algan et al, 2000; Feldmann, 2009a, 2009b). We control for the potential impact of labor market rigidities with a measure drawn from the EFW database, specifically the “Hiring and firing regulations” index used as part of their labor regulations index. The index ranges from 0 to 10, with higher ratings indicating freer labor markets. We use the GDP growth rate with time dummies to control for business cycle fluctuations. Additionally, the urbanization rate of the population and openness, which is the ratio of trade to GDP, is included.
19 The normalization of employment and unemployment across countries are important in order to reduce the potential heteroskedasticity in the residuals due to the difference in size across countries.
17
We use several estimation methods that will yield consistent results. For simplicity and uniformity, the discussion in the body of the paper focuses on the fixed effect (FE) within-groups estimation method. The right-hand side of our regressions has public employment rates that are likely to be correlated with country-specific but time-invariant unobservable characteristics. If those characteristics affect the unemployment rate or private-sector employment rate, it is important to eliminate those sources of bias. In particular, although we took considerable care to use definitions that were consistent across countries, the fixed effects also control for slight differences in measurement, which by definition would be correlated with the explanatory variables. One potential concern is that public hiring may respond to labor market conditions over time, for example increasing during periods of slack private-sector labor demand. Therefore, any negative relationship between public and private hiring may reflect a rise in the former taking place in response to a fall in the latter. In a statistical sense, this can lead to biased estimates of the causal effect of public employment on private employment (and, analogously, unemployment). To the extent that private employment is low because of long-term structural factors, this source of endogeneity is expunged by the use of fixed effects. To the extent that private-sector labor demand is lower during periods of weak economic activity, this is controlled for by the GDP growth rate. To the extent that changes in labor legislation over time may affect private-sector hiring for a given level of economic activity, this is controlled for by the hiring and firing regulations index. Nonetheless, there may be a residual source of endogeneity due to unobservable time-varying country-specific factors. It is not automatic that the source of endogeneity would lead to an overestimate of crowding out. For example, a demographics-driven rise in the labor force in a demand-constrained environment could lead to a rise in unemployment. Government could plausibly increase the pace of hiring in response, but this would only lead to upward bias if hiring increased sufficiently to increase the public employment rate as a share of the labor force. A small increase that does not match the increase in the labor force in percentage terms would in fact lead to a downward bias and an underestimate of crowding out. Equivalently, a large increase in the labor force may not be matched by a rise in private hiring in a demand-constrained environment, such that the private employment rate falls. The number of government hires could well rise in response, but it is the rate relative to the labor force that determines whether crowding out is over- or underestimated.20 We have presented examples where government employment increases in response to weak private labor demand, but it is also possible that slack in the labor market is associated with 20 Following standard analysis (Wooldridge, 2002:62), depending on the nature of the correlation between the variables of interest and the error term, the bias of the estimate for the unemployment coefficient is shown by:
. is the estimate of the coefficient on the public employment rate (Pub) in the
equation for unemployment. L is the omitted factor in the error term. If we have a development that, ceteris paribus, increases the unemployment rate, >0), will be upward biased if that factor is positively correlated with the public hiring rate. Similarly, the bias of the estimate for the private employment coefficient is given by:
. >0 would generally imply 0. There is an underestimate of if the development
is positively correlated with the public hiring rate.
18
lower government revenues, which would tend to reduce government hiring. Therefore, while treating public employment as exogenous can cause bias, there is no a priori reason to suspect bias of a particular direction that exaggerates crowding out. Many studies attempt to address endogeneity using long lags of multiple government size measures directly (Feldman, 2009a) or as instruments (Feldman, 2009b), three-stage-least squares (Algan et al, 2002), cointegration analysis that allows for multiple cointegrating vectors (Malley and Moutos, 1996), or time-series causality analysis (Christopoulos and Tsionas, 2002). Regardless of the method used, their results indicate unidirectional employment effects from the public to the private sector. In this paper, we investigate the potential bias in either direction by using Generalized Method of Moments (GMM) estimations.21Also known as Generalized Instrumental Variables (GIV), additional moment conditions are provided by means of instruments, if valid. We apply GMM/GIV in a static framework (Cameron and Trivedi, 2006), taking advantage of advances in the field of dynamic panel data estimation22 to estimate each specification as a system using multiple additional moment conditions. In particular, we can use potentially multiple lags of the endogenous variables (public employment and GDP growth) in levels as instruments for first-differenced estimation of the specifications together with potentially multiple lags of the differences as instruments for the levels equations. An advantage of this approach over traditional 2SLS is that the additional instruments can yield potentially large efficiency gains.23 For further robustness checks, results from other estimation methods are reported in the Appendices. To control for possible autocorrelation within each country or common across the panel, we run the fixed-effect (FE) estimation with autoregressive disturbances. In addition to FE estimators, we also use random effects (RE) estimation methods, with and without autoregressive disturbances. To check for possible persistence in a dynamic panel framework, we run regressions with one or two lags of the dependent variable. Because this, by construction, generates endogeneity bias, we make use of dynamic systems GMM estimation, which we also deploy to account for the possible endogeneity of public employment and GDP.
21 We also attempted specifications in which public-sector/administration employment is regressed on either private-sector employment or overall unemployment. We found that the coefficients were close to zero in three of the four specifications.
22 See for example Arellano and Bond (1991), Ahn and Schmidt (1995), and Blundell and Bond (1998). The Appendices contains estimates of dynamic panels.
23 Our use of internal instruments is dictated by data availability. External instruments are not available for a panel of developing countries and their validity, as in the case of the fiscal multipliers literature, is still a topic of debate.
19
B. Unemployment and Public Employment
Before presenting the estimation results, we pause to clarify how to interpret the coefficients on the public employment rate. If the coefficient, u , is close to -1, we can say the additional public jobs are purely accounted for by a fall in unemployment, which means there is no net flow of workers from the private sector to the public sector and, hence, no crowding out. If
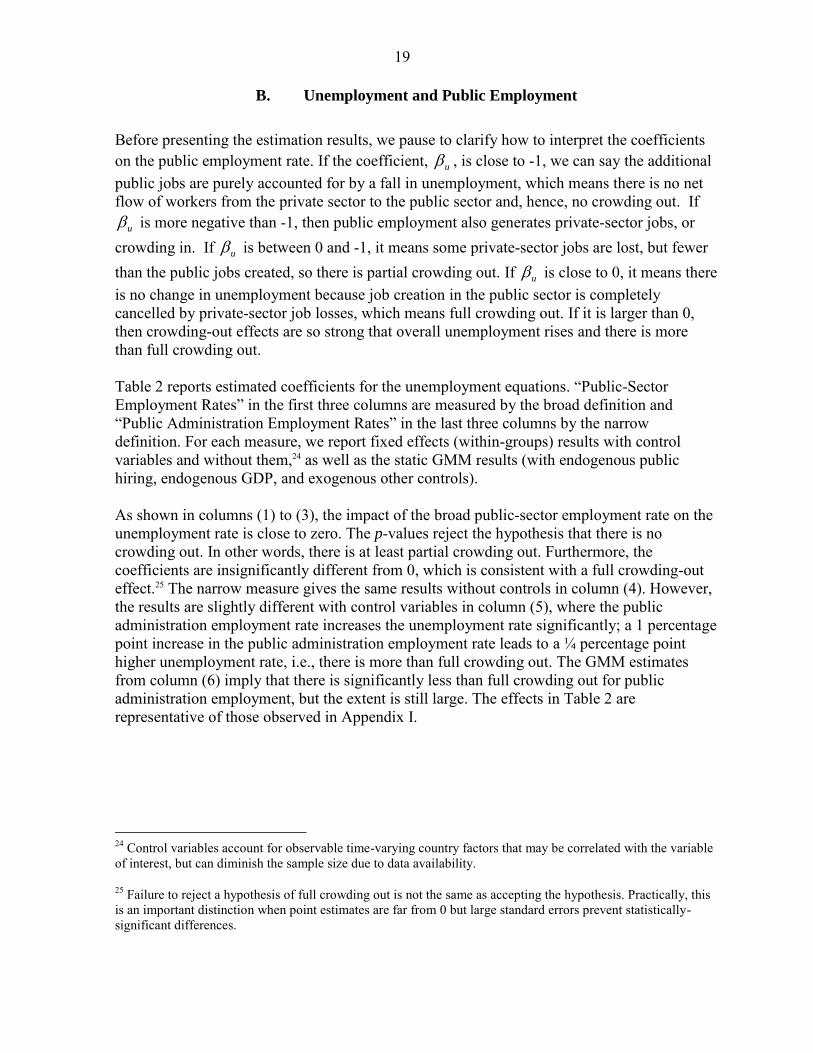
u is more negative than -1, then public employment also generates private-sector jobs, or crowding in. If u is between 0 and -1, it means some private-sector jobs are lost, but fewer than the public jobs created, so there is partial crowding out. If u is close to 0, it means there is no change in unemployment because job creation in the public sector is completely cancelled by private-sector job losses, which means full crowding out. If it is larger than 0, then crowding-out effects are so strong that overall unemployment rises and there is more than full crowding out. Table 2 reports estimated coefficients for the unemployment equations. “Public-Sector Employment Rates” in the first three columns are measured by the broad definition and “Public Administration Employment Rates” in the last three columns by the narrow definition. For each measure, we report fixed effects (within-groups) results with control variables and without them,24 as well as the static GMM results (with endogenous public hiring, endogenous GDP, and exogenous other controls). As shown in columns (1) to (3), the impact of the broad public-sector employment rate on the unemployment rate is close to zero. The p-values reject the hypothesis that there is no crowding out. In other words, there is at least partial crowding out. Furthermore, the coefficients are insignificantly different from 0, which is consistent with a full crowding-out effect.25 The narrow measure gives the same results without controls in column (4). However, the results are slightly different with control variables in column (5), where the public administration employment rate increases the unemployment rate significantly; a 1 percentage point increase in the public administration employment rate leads to a ¼ percentage point higher unemployment rate, i.e., there is more than full crowding out. The GMM estimates from column (6) imply that there is significantly less than full crowding out for public administration employment, but the extent is still large. The effects in Table 2 are representative of those observed in Appendix I.
24 Control variables account for observable time-varying country factors that may be correlated with the variable of interest, but can diminish the sample size due to data availability.
25 Failure to reject a hypothesis of full crowding out is not the same as accepting the hypothesis. Practically, this is an important distinction when point estimates are far from 0 but large standard errors prevent statistically- significant differences.
20
Table 2: Regression of Unemployment Rate on Public Employment Rate
C. Private-Sector Employment and Public Employment
If the coefficient,p , is positive, it means public employment generates private-sector
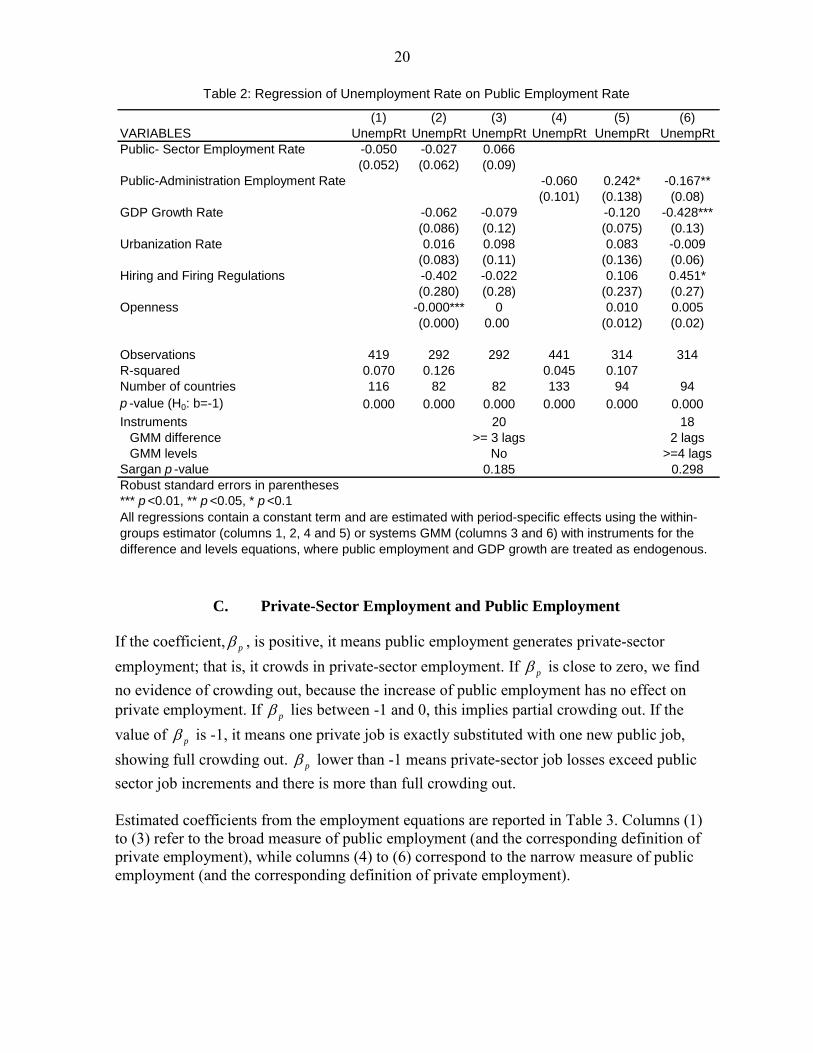
employment; that is, it crowds in private-sector employment. If p is close to zero, we find no evidence of crowding out, because the increase of public employment has no effect on private employment. If p lies between -1 and 0, this implies partial crowding out. If the value of p is -1, it means one private job is exactly substituted with one new public job, showing full crowding out. p lower than -1 means private-sector job losses exceed public sector job increments and there is more than full crowding out. Estimated coefficients from the employment equations are reported in Table 3. Columns (1) to (3) refer to the broad measure of public employment (and the corresponding definition of private employment), while columns (4) to (6) correspond to the narrow measure of public employment (and the corresponding definition of private employment).
(1) (2) (3) (4) (5) (6)
VARIABLES UnempRt UnempRt UnempRt UnempRt UnempRt UnempRt
Public- Sector Employment Rate -0.050 -0.027 0.066
(0.052) (0.062) (0.09)
Public-Administration Employment Rate -0.060 0.242* -0.167**
(0.101) (0.138) (0.08)
GDP Growth Rate -0.062 -0.079 -0.120 -0.428***
(0.086) (0.12) (0.075) (0.13)
Urbanization Rate 0.016 0.098 0.083 -0.009
(0.083) (0.11) (0.136) (0.06)
Hiring and Firing Regulations -0.402 -0.022 0.106 0.451*
(0.280) (0.28) (0.237) (0.27)
Openness -0.000*** 0 0.010 0.005
(0.000) 0.00 (0.012) (0.02)
Observations 419 292 292 441 314 314
R-squared 0.070 0.126 0.045 0.107
Number of countries 116 82 82 133 94 94
p -value (H0: b=-1) 0.000 0.000 0.000 0.000 0.000 0.000
Instruments 20 18
GMM difference >= 3 lags 2 lags
GMM levels No >=4 lags
Sargan p -value 0.185 0.298
Robust standard errors in parentheses
*** p <0.01, ** p <0.05, * p <0.1
All regressions contain a constant term and are estimated with period-specific effects using the within-
groups estimator (columns 1, 2, 4 and 5) or systems GMM (columns 3 and 6) with instruments for the
difference and levels equations, where public employment and GDP growth are treated as endogenous.
21
Table 3 : Regression of Private-Sector Employment Rate on Public Employment Rate
Consistent with the two scatter plots of public and private employment rates in Figure 7, all coefficients indicate a very strong negative relationship between public- and private-sector employment rates. For example, 100 new public jobs crowd out 98 private jobs (column (2)). Generally, the coefficients are close to -1 and are not significantly different from that value despite being precisely estimated. Any deviations from this value are not systematic. Crowding out is estimated to be lower when public administration is endogenous than when it is exogenous—as was the case in Table 2—but crowding out is estimated to be higher when the broadly defined public sector is endogenous than when it is exogenous. The coefficient estimates in Appendix II mostly have an absolute value that is slightly but insignificantly less than 1. Taken together with the unemployment results, public employment just about fully crowds out private-sector employment regardless of the definition, such that a rise in government hiring would be offset by decreases in private employment, resulting in no change in overall unemployment. Of course, these results apply symmetrically to decreases in government
(1) (2) (3) (4) (5) (6)
VARIABLES PrvEmpRtPrvEmpRtPrvEmpRtPrvEmpRt PrvEmpRt PrvEmpRt
Public- Sector Employment Rate -0.849*** -0.979*** -1.271***
(0.060) (0.052) (0.12)
Public-Administration Employment Rate -1.007*** -1.059*** -0.795***
(0.168) (0.204) (0.14)
GDP Growth Rate -0.059 -0.115 0.086 0.193
(0.108) (0.13) (0.147) (0.18)
Urbanization Rate -0.248* -0.102 -0.143 -0.008
(0.126) (0.09) (0.195) (0.10)
Hiring and Firing Regulations 0.204 -0.416 -0.255 -0.504
(0.326) (0.41) (0.343) (0.43)
Openness 0.000*** 0.000 0.026 0.036
(0.000) 0.00 (0.022) (0.02)
Observations 396 282 282 454 315 315
R-squared 0.488 0.644 0.139 0.148
Number of countries 110 80 80 139 94 94
p -value (H0: b=-1) 0.014 0.680 0.027 0.968 0.772 0.129
Instruments 22 30
GMM difference 2 lags >= 2 lagsGMM levels >= 2 lags >= 4 lags
Sargan p -value 0.218 0.385
Robust standard errors in parentheses
*** p <0.01, ** p <0.05, * p <0.1
All regressions contain a constant term and are estimated with period-specific effects using the within-
groups estimator (columns 1,2, 4 and 5) or systems GMM (columns 3 and 6) with instruments for the
difference and levels equations, where public employment and GDP growth are treated as endogenous.
22
hiring, so that reduced government hiring would be almost completely offset by additional private-sector jobs.26
D. MCD Analysis
In this section, we explore whether MCD countries show stronger or weaker crowding-out effects than the rest of the world. To this end, we add interaction terms with MENAP and CCA region dummies to the original equations. However, the lower coverage of countries for each region may induce identification problems, which would be worsened if we use control variables. Given that there are only eight countries in the CCA region, the reduction of observations is quite critical. Therefore, we focus on the model without control variables in this section. This also precluded meaningful identification using GMM or other Instrumental Variables estimators. See Appendix III for results with control variables and other estimation methods.
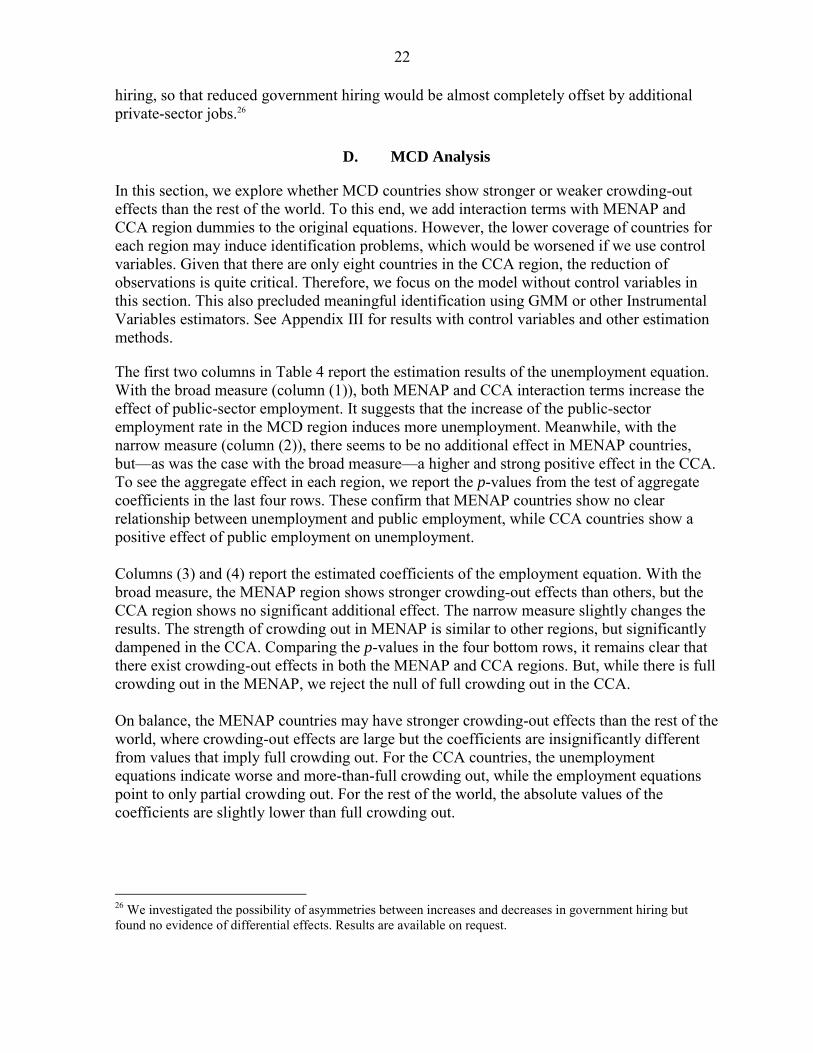
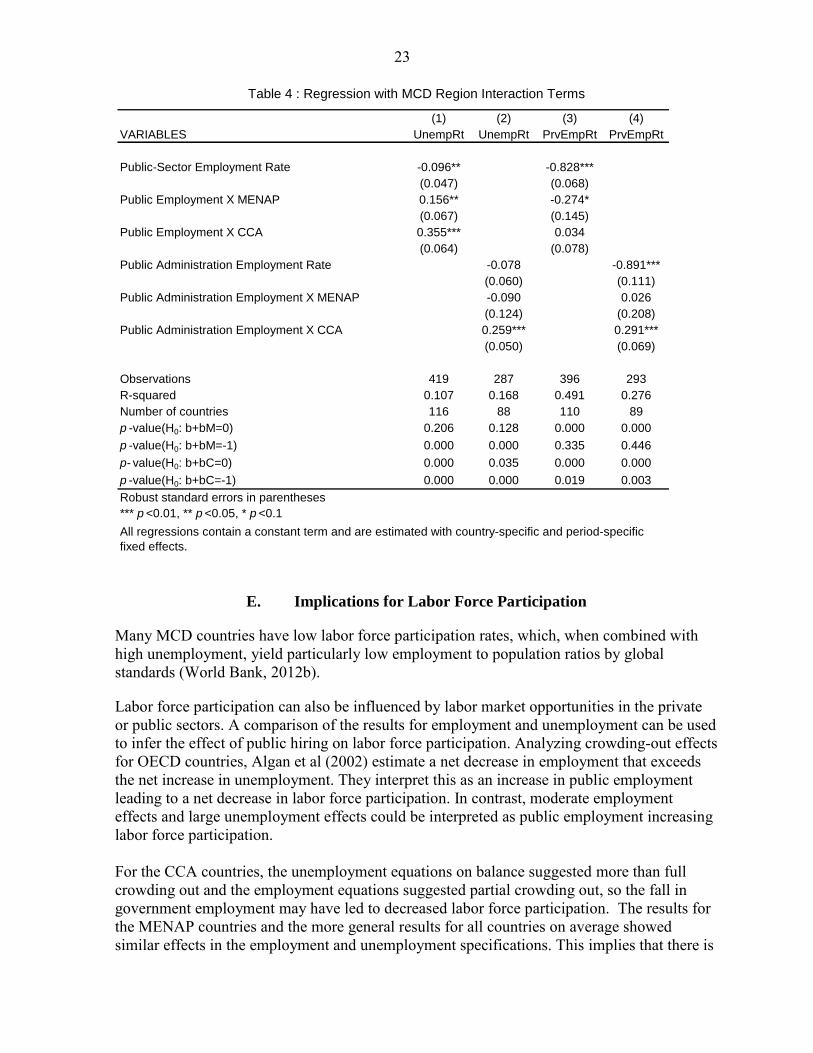
The first two columns in Table 4 report the estimation results of the unemployment equation. With the broad measure (column (1)), both MENAP and CCA interaction terms increase the effect of public-sector employment. It suggests that the increase of the public-sector employment rate in the MCD region induces more unemployment. Meanwhile, with the narrow measure (column (2)), there seems to be no additional effect in MENAP countries, but—as was the case with the broad measure—a higher and strong positive effect in the CCA. To see the aggregate effect in each region, we report the p-values from the test of aggregate coefficients in the last four rows. These confirm that MENAP countries show no clear relationship between unemployment and public employment, while CCA countries show a positive effect of public employment on unemployment. Columns (3) and (4) report the estimated coefficients of the employment equation. With the broad measure, the MENAP region shows stronger crowding-out effects than others, but the CCA region shows no significant additional effect. The narrow measure slightly changes the results. The strength of crowding out in MENAP is similar to other regions, but significantly dampened in the CCA. Comparing the p-values in the four bottom rows, it remains clear that there exist crowding-out effects in both the MENAP and CCA regions. But, while there is full crowding out in the MENAP, we reject the null of full crowding out in the CCA. On balance, the MENAP countries may have stronger crowding-out effects than the rest of the world, where crowding-out effects are large but the coefficients are insignificantly different from values that imply full crowding out. For the CCA countries, the unemployment equations indicate worse and more-than-full crowding out, while the employment equations point to only partial crowding out. For the rest of the world, the absolute values of the coefficients are slightly lower than full crowding out.
26 We investigated the possibility of asymmetries between increases and decreases in government hiring but found no evidence of differential effects. Results are available on request.
23
Table 4 : Regression with MCD Region Interaction Terms
E. Implications for Labor Force Participation
Many MCD countries have low labor force participation rates, which, when combined with high unemployment, yield particularly low employment to population ratios by global standards (World Bank, 2012b).
Labor force participation can also be influenced by labor market opportunities in the private or public sectors. A comparison of the results for employment and unemployment can be used to infer the effect of public hiring on labor force participation. Analyzing crowding-out effects for OECD countries, Algan et al (2002) estimate a net decrease in employment that exceeds the net increase in unemployment. They interpret this as an increase in public employment leading to a net decrease in labor force participation. In contrast, moderate employment effects and large unemployment effects could be interpreted as public employment increasing labor force participation. For the CCA countries, the unemployment equations on balance suggested more than full crowding out and the employment equations suggested partial crowding out, so the fall in government employment may have led to decreased labor force participation. The results for the MENAP countries and the more general results for all countries on average showed similar effects in the employment and unemployment specifications. This implies that there is
(1) (2) (3) (4)
VARIABLES UnempRt UnempRt PrvEmpRt PrvEmpRt
Public-Sector Employment Rate -0.096** -0.828***
(0.047) (0.068)
Public Employment X MENAP 0.156** -0.274*
(0.067) (0.145)
Public Employment X CCA 0.355*** 0.034
(0.064) (0.078)
Public Administration Employment Rate -0.078 -0.891***
(0.060) (0.111)
Public Administration Employment X MENAP -0.090 0.026
(0.124) (0.208)
Public Administration Employment X CCA 0.259*** 0.291***
(0.050) (0.069)
Observations 419 287 396 293
R-squared 0.107 0.168 0.491 0.276
Number of countries 116 88 110 89
p -value(H0: b+bM=0) 0.206 0.128 0.000 0.000
p -value(H0: b+bM=-1) 0.000 0.000 0.335 0.446
p- value(H0: b+bC=0) 0.000 0.035 0.000 0.000
p -value(H0: b+bC=-1) 0.000 0.000 0.019 0.003
Robust standard errors in parentheses
*** p <0.01, ** p <0.05, * p <0.1
All regressions contain a constant term and are estimated with country-specific and period-specific
fixed effects.
24
generally no large net effect on labor force participation. However, a more detailed analysis of the direct relationship between labor force participation and public hiring would be a welcome potential corroboration of the analysis in this paper.
VI. CONCLUSION
Regressions of unemployment on public employment and of private employment on public employment, each of which is based on two definitions of public employment, find robust evidence that public employment crowds out private employment. The magnitude is statistically indistinguishable from full crowding out. Therefore, for our complete sample of developing and advanced countries, a public job typically comes at the cost of a private-sector job and therefore does not reduce overall unemployment. For the Middle East, North Africa, Caucasus and Central Asian (MCD) countries, crowding-out effects could be stronger than elsewhere.
At a time when many countries find themselves having to improve their fiscal positions, identifying and curtailing inefficient expenditures that have unintended consequences is paramount. Public-sector hiring: (i) does not reduce unemployment, (ii) increases the fiscal burden, and (iii) inhibits long-term growth through reductions in private-sector employment. Together, this would imply that public hiring is detrimental to long term fiscal sustainability with limited benefit, so that scarce resources could be better spent on other social needs, including protecting the most vulnerable. We have shown that the public sector is an important employer in MCD countries. Our results show that public hiring will, at best, not reduce overall unemployment. The data hint that public employment has fallen over time in MCD countries, and show a sizeable reduction in the broadly defined public sector in the CCA countries. The econometric results also imply that this did not worsen unemployment. However, there are signs that the MCD trend may change in the medium term. The youth of the region continue to prefer public employment, and a number of public hiring initiatives have recently been announced in response to the Arab Spring. At a time when private-sector employment growth in all countries may be under strain because of slower post-Lehman growth and political uncertainty, our results suggest that public hiring could worsen the problem. Our results have drawn on evidence based on various measures of employment. While there are many plausible mechanisms, further work would be needed to identify which of these may operate. For example, complementary analysis of the relationship between wages in the private and public sectors, which many MCD governments have increased, would shed light on whether crowding out occurs through the labor market by increasing reservation wages. Analysis based on the relationship between government wage shares, tax rates, and private-sector employment could also be useful. This may be less of an issue for many countries in the MCD region, where income taxes are low or absent. In contrast, countries in the MCD region and elsewhere could benefit from rigorous investigation of the efficacy of a wage subsidy or salary top-up scheme for private-sector employment.
25
REFERENCES
Algan, Y. Cahuc and A. Zylberberg, 2002, “Public Employment and Labour Market Performance,” Economic Policy, 34, pp. 7–65. Arellano, M. and S. Bond, 1992, “Some Tests of Specification for Panel Data: Monte Carlo Evidence and an Application to Employment Equations,” Review of Economic Studies, 58(2), pp. 277–97. Aschauer, D., 1989, “Does Public Capital Crowd Out Private Capital?” Journal of Monetary
Economics, 24(2), pp. 171–88. Baker, D., D. Glynn, A. Howell and J. Schmitt, 2007, “Are Protective Labor Market Institutions at the Root of Unemployment? A Critical Review of the Evidence,” Capitalism
and Society, 2(1), pp. 1–71. Baltagi, B. and P. Wu, 1999, “Unequally Spaced Panel Data Regressions With AR(1) Disturbances,” Econometric Theory, 15(06), pp. 814–23. Barro, R. and X. Sala‐i‐Martin, 2004, “Economic Growth,” 2nd edition (London: MIT Press). Bernal-Verdugo, L., D. Furceri and D. Guillaume, 2012, “Labor market Flexibility and Unemployment; New Empirical Evidence of Static and Dynamic Effects,” IMF Working Paper 12/64 (Washington: International Monetary Fund).
Blanchard, O. and J. Wolfers, 2000, “The Role Shocks and Institutions in the Rise of European Unemployment: The Aggregate Evidence,” The Economic Journal, 110, C1–C33. Campante, F. and D. Chor, 2012, “Why was the Arab World Poised for Revolution? Schooling, Economic Opportunities, and the Arab Spring,” Journal of Economic
Perspectives, 26(2), pp. 167–88. Demekas, D. and Z. Kontolemis, 2000, “Government Employment, Wages and Labour Market Performance,” Oxford Bulletin of Economics and Statistics, 62, pp. 391–414. Easterly, W. and S. Rebelo, 1993, “Fiscal Policy and Economic Growth: An Empirical Investigation,” Journal of Monetary Economics, 32(3), pp. 417–58. Espinoza, R. (forthcoming), “Government Spending, Subsidies and Economic Efficiency in the GCC,” in R. Espinoza, G. Fayad and A. Prasad (eds.), The Macroeconomics of the Arab
States of the Gulf, Oxford University Press. Faggio, G. and H. Overman, 2012, “The Effect of Public Sector Employment on Local Labour Markets,” SERC Discussion Paper, 111. Feldmann, H., 2009a, “Government Size and Unemployment: Evidence from Developing Countries,” The Journal of Developing Areas, 43(1), pp. 315–30.
26
Feldmann, H., 2009b, “Government Size and Unemployment in Developing Countries,” Applied Economics Letters, Vol. 17, No. 3, pp. 289–92. Freeman, R., 2005, “Labor Market Institutions without Blinders: The Debate over Flexibility and Labor Market Performance,” International Economic Journal, 19(2), pp. 129–45. Frankel, J., C. Vegh and G. Vuletin, 2012, “On Graduation from Procyclicality,”Journal of
Development Economics. International Monetary Fund, 2010, Middle East and Central Asia Regional Economic
Outlook: October 2010 (Washington). International Monetary Fund, 2011a, Middle East and Central Asia Regional Economic
Outlook: May 2011 (Washington). International Monetary Fund, 2011b, Middle East and Central Asia Regional Economic
Outlook: October 2011 (Washington). International Monetary Fund, 2012a, Fiscal Policy and Employment in Advanced and Emerging Economies, Fiscal Affairs Department Policy Paper (Washington). International Monetary Fund, 2012b, Middle East and Central Asia Regional Economic
Outlook: November 2012 (Washington). Kapstein, E. and N. Converse, 2008, “The Fate of Young Democracies,” (Cambridge: Cambridge University Press). Layard, R., S. Nickell and R. Jackman, 2005, “Unemployment: Macroeconomic Performance
and the Labor Market,”2nd
Edition (Oxford: Oxford University Press). Lamo, A., J. Perez, and L. Schuknecht, 2012, “Public or Private Sector Wage Leadership? An International Perspective,” Scandinavian Journal of Economics, 114(1), pp. 228-244. Malley, J. and T. Moutos, 1996, “Does Government Employment “Crowd-out” Private Employment? Evidence from Sweden,” Scandinavian Journal of Economics, 98(2), pp. 289-302. Nickell, S., 1997, “Unemployment and Labor Market Rigidities: Europe vs North America,” Journal of Economic Perspectives, 11(3), pp. 55–74. Perez, J. and A. Sanchez, 2010, “Is There a Signaling Role for Public Wages?” European Central Bank Working Paper No. 1148 (January). Salehi-isfahani, D. and N. Dhillon, 2008, “Stalled Youth Transitions in the Middle East, A Framework for Policy Reform,” Dubai School of Government, Middle East Youth Initiative Working Papers, No. 8.
27
The Economist, 2012, Parsing Public Payrolls, October 27th U.S. edition. Wooldridge, J., 2002, “Econometric Analysis of Cross-Section and Panel Data,” (Cambridge, Massachusetts: MIT Press). World Bank, 2012a, World Development Report 2013: Jobs (Washington). World Bank, 2012b, Free to Prosper: Jobs in the Middle East and North Africa—Overview (Washington). World Bank, 2012c, Enabling Employment Miracles, Middle East and North Africa Regional Economic Update: Spring 2012 (Washington).
28
APPENDIX I. REGRESSIONS OF UNEMPLOYMENT RATE ON PUBLIC EMPLOYMENT
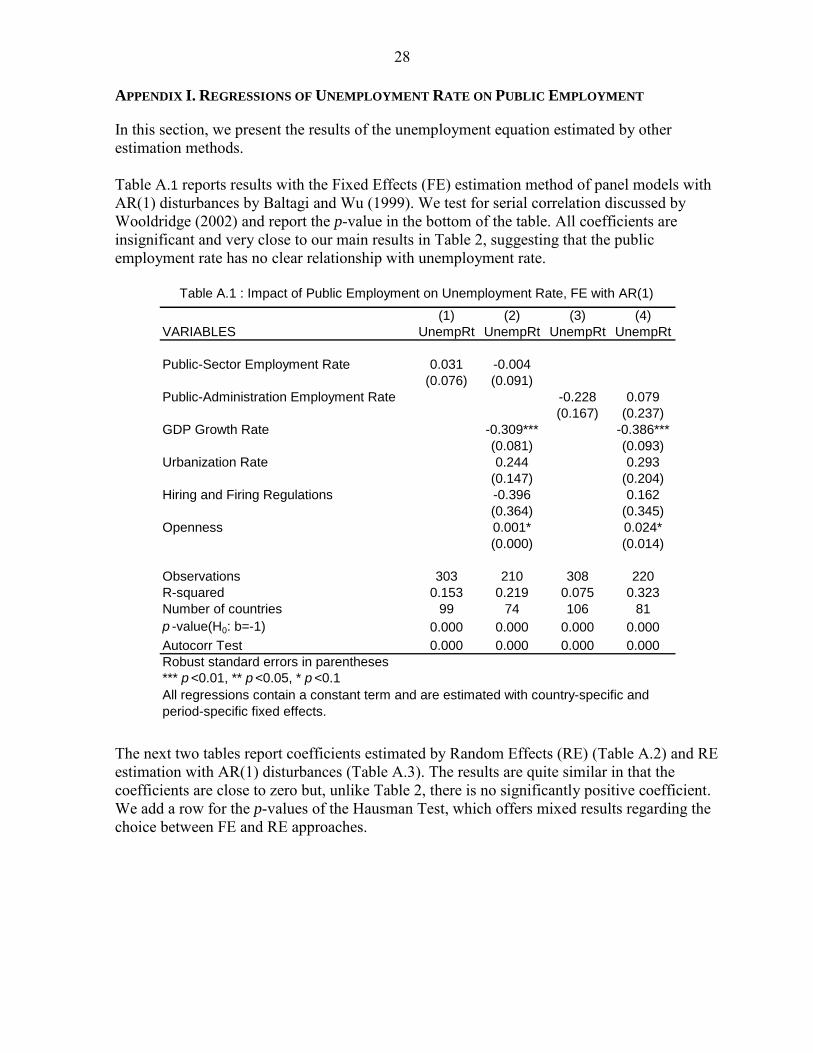
In this section, we present the results of the unemployment equation estimated by other estimation methods. Table A.1 reports results with the Fixed Effects (FE) estimation method of panel models with AR(1) disturbances by Baltagi and Wu (1999). We test for serial correlation discussed by Wooldridge (2002) and report the p-value in the bottom of the table. All coefficients are insignificant and very close to our main results in Table 2, suggesting that the public employment rate has no clear relationship with unemployment rate.
Table A.1 : Impact of Public Employment on Unemployment Rate, FE with AR(1)
The next two tables report coefficients estimated by Random Effects (RE) (Table A.2) and RE estimation with AR(1) disturbances (Table A.3). The results are quite similar in that the coefficients are close to zero but, unlike Table 2, there is no significantly positive coefficient. We add a row for the p-values of the Hausman Test, which offers mixed results regarding the choice between FE and RE approaches.
(1) (2) (3) (4)
VARIABLES UnempRt UnempRt UnempRt UnempRt
Public-Sector Employment Rate 0.031 -0.004
(0.076) (0.091)
Public-Administration Employment Rate -0.228 0.079
(0.167) (0.237)
GDP Growth Rate -0.309*** -0.386***
(0.081) (0.093)
Urbanization Rate 0.244 0.293
(0.147) (0.204)
Hiring and Firing Regulations -0.396 0.162
(0.364) (0.345)
Openness 0.001* 0.024*
(0.000) (0.014)
Observations 303 210 308 220
R-squared 0.153 0.219 0.075 0.323
Number of countries 99 74 106 81
p -value(H0: b=-1) 0.000 0.000 0.000 0.000
Autocorr Test 0.000 0.000 0.000 0.000
Robust standard errors in parentheses
*** p <0.01, ** p <0.05, * p <0.1
All regressions contain a constant term and are estimated with country-specific and
period-specific fixed effects.

29
Table A.2 : Impact of Public Employment on Unemployment Rate, RE
Table A.3 : Impact of Public Employment on Unemployment Rate, RE with AR(1)
(1) (2) (3) (4) VARIABLES UnempRt UnempRt UnempRt UnempRt
Public-Sector Employment Rate -0.029 -0.051 (0.028) (0.048)
Public Administration Employment Rate -0.034 0.022 (0.069) (0.097)
GDP Growth Rate -0.092 -0.093 (0.063) (0.072)
Urbanization Rate 0.036 0.033 (0.032) (0.037)
Hiring and Firing Regulations -0.468** -0.248 (0.224) (0.222)
Openness -0.000 -0.007 (0.000) (0.009)
Observations 419 292 441 314 Number of countries 116 82 133 94 Hausman Test 0.000 0.001 0.000 1.000 p -value(H 0: b=-1) 0.000 0.000 0.000 0.000 Autocorr Test 0.000 0.000 0.000 0.000 Robust standard errors in parentheses *** p <0.01, ** p <0.05, * p <0.1 All regressions contain a constant term and are estimated with region-specific and period- specific fixed effects.
(1) (2) (3) (4) VARIABLES UnempRt UnempRt UnempRt UnempRt
Public-Sector Employment Rate -0.035 -0.027 (0.040) (0.054)
Public-Administration Employment Rate -0.022 0.069 (0.078) (0.132)
GDP Growth Rate -0.053 -0.082 (0.086) (0.078)
Urbanization Rate 0.030 0.028 (0.038) (0.035)
Hiring and Firing Regulations -0.516** -0.183 (0.249) (0.235)
Openness -0.000*** -0.003 (0.000) (0.011)
Observations 419 292 441 314 Number of countries 116 82 133 94 Hausman Test 0.861 0.073 0.039 0.086 p -value(H 0 : b=-1) 0.000 0.000 0.000 0.000 Robust standard errors in parentheses *** p <0.01, ** p <0.05, * p <0.1 All regressions contain a constant term and are estimated with region-specific and period-specific fixed effects.
30
Table A.4 : Impact of Public Employment on Unemployment Rate, Systems GMM
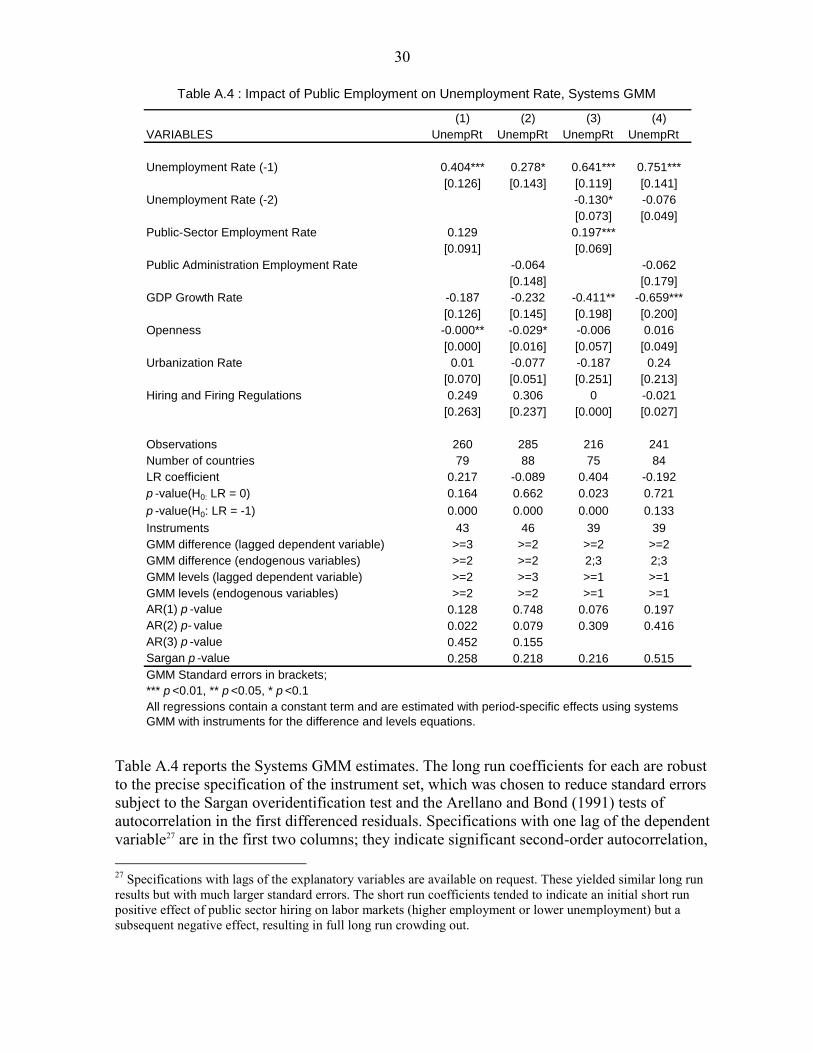
Table A.4 reports the Systems GMM estimates. The long run coefficients for each are robust to the precise specification of the instrument set, which was chosen to reduce standard errors subject to the Sargan overidentification test and the Arellano and Bond (1991) tests of autocorrelation in the first differenced residuals. Specifications with one lag of the dependent variable27 are in the first two columns; they indicate significant second-order autocorrelation, 27 Specifications with lags of the explanatory variables are available on request. These yielded similar long run results but with much larger standard errors. The short run coefficients tended to indicate an initial short run positive effect of public sector hiring on labor markets (higher employment or lower unemployment) but a subsequent negative effect, resulting in full long run crowding out.
(1) (2) (3) (4)
VARIABLES UnempRt UnempRt UnempRt UnempRt
Unemployment Rate (-1) 0.404*** 0.278* 0.641*** 0.751***
[0.126] [0.143] [0.119] [0.141]
Unemployment Rate (-2) -0.130* -0.076
[0.073] [0.049]
Public-Sector Employment Rate 0.129 0.197***
[0.091] [0.069]
Public Administration Employment Rate -0.064 -0.062
[0.148] [0.179]
GDP Growth Rate -0.187 -0.232 -0.411** -0.659***
[0.126] [0.145] [0.198] [0.200]
Openness -0.000** -0.029* -0.006 0.016
[0.000] [0.016] [0.057] [0.049]
Urbanization Rate 0.01 -0.077 -0.187 0.24
[0.070] [0.051] [0.251] [0.213]
Hiring and Firing Regulations 0.249 0.306 0 -0.021
[0.263] [0.237] [0.000] [0.027]
Observations 260 285 216 241
Number of countries 79 88 75 84
LR coefficient 0.217 -0.089 0.404 -0.192
p -value(H0: LR = 0) 0.164 0.662 0.023 0.721
p -value(H0: LR = -1) 0.000 0.000 0.000 0.133
Instruments 43 46 39 39
GMM difference (lagged dependent variable) >=3 >=2 >=2 >=2
GMM difference (endogenous variables) >=2 >=2 2;3 2;3
GMM levels (lagged dependent variable) >=2 >=3 >=1 >=1
GMM levels (endogenous variables) >=2 >=2 >=1 >=1
AR(1) p -value 0.128 0.748 0.076 0.197
AR(2) p- value 0.022 0.079 0.309 0.416
AR(3) p -value 0.452 0.155
Sargan p -value 0.258 0.218 0.216 0.515
GMM Standard errors in brackets;
*** p <0.01, ** p <0.05, * p <0.1
All regressions contain a constant term and are estimated with period-specific effects using systems
GMM with instruments for the difference and levels equations.

31
which would render many moment conditions invalid and requires the instrument set to be limited to longer lags, depending on the order of correlation (Arellano and Bond, 1991:279; Ahn and Schmidt, 1995:9). Given second-order autocorrelation, an alternative approach is to introduce an additional lag of the dependent variable, as done in columns (3) and (4). The long run effect is less precisely estimated because it comprises three coefficients. Nonetheless, the results point to more than full crowding out for public employment (significantly so in column (3)) and (insignificantly) less than full crowding out for public administration employment.
32
APPENDIX II. REGRESSIONS OF PRIVATE-SECTOR EMPLOYMENT ON PUBLIC EMPLOYMENT
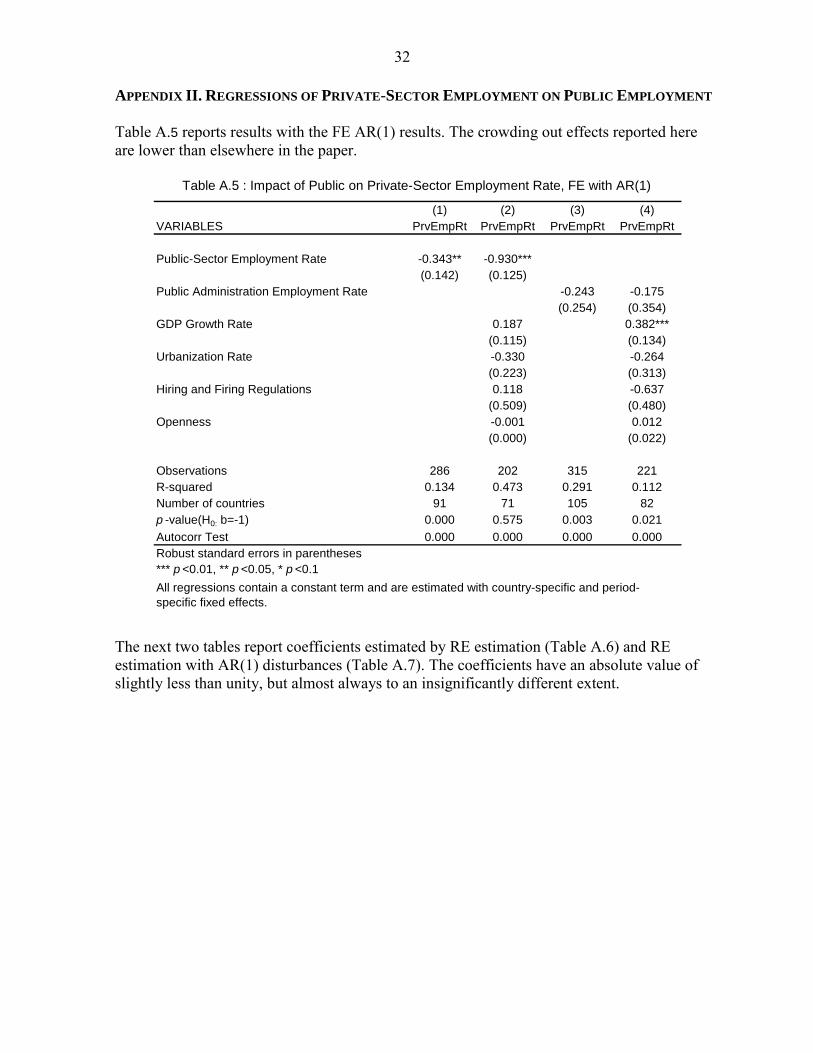
Table A.5 reports results with the FE AR(1) results. The crowding out effects reported here are lower than elsewhere in the paper.
Table A.5 : Impact of Public on Private-Sector Employment Rate, FE with AR(1)
The next two tables report coefficients estimated by RE estimation (Table A.6) and RE estimation with AR(1) disturbances (Table A.7). The coefficients have an absolute value of slightly less than unity, but almost always to an insignificantly different extent.
(1) (2) (3) (4)
VARIABLES PrvEmpRt PrvEmpRt PrvEmpRt PrvEmpRt
Public-Sector Employment Rate -0.343** -0.930***
(0.142) (0.125)
Public Administration Employment Rate -0.243 -0.175
(0.254) (0.354)
GDP Growth Rate 0.187 0.382***
(0.115) (0.134)
Urbanization Rate -0.330 -0.264
(0.223) (0.313)
Hiring and Firing Regulations 0.118 -0.637
(0.509) (0.480)
Openness -0.001 0.012
(0.000) (0.022)
Observations 286 202 315 221
R-squared 0.134 0.473 0.291 0.112
Number of countries 91 71 105 82
p -value(H0: b=-1) 0.000 0.575 0.003 0.021
Autocorr Test 0.000 0.000 0.000 0.000
Robust standard errors in parentheses
*** p <0.01, ** p <0.05, * p <0.1
All regressions contain a constant term and are estimated with country-specific and period-
specific fixed effects.
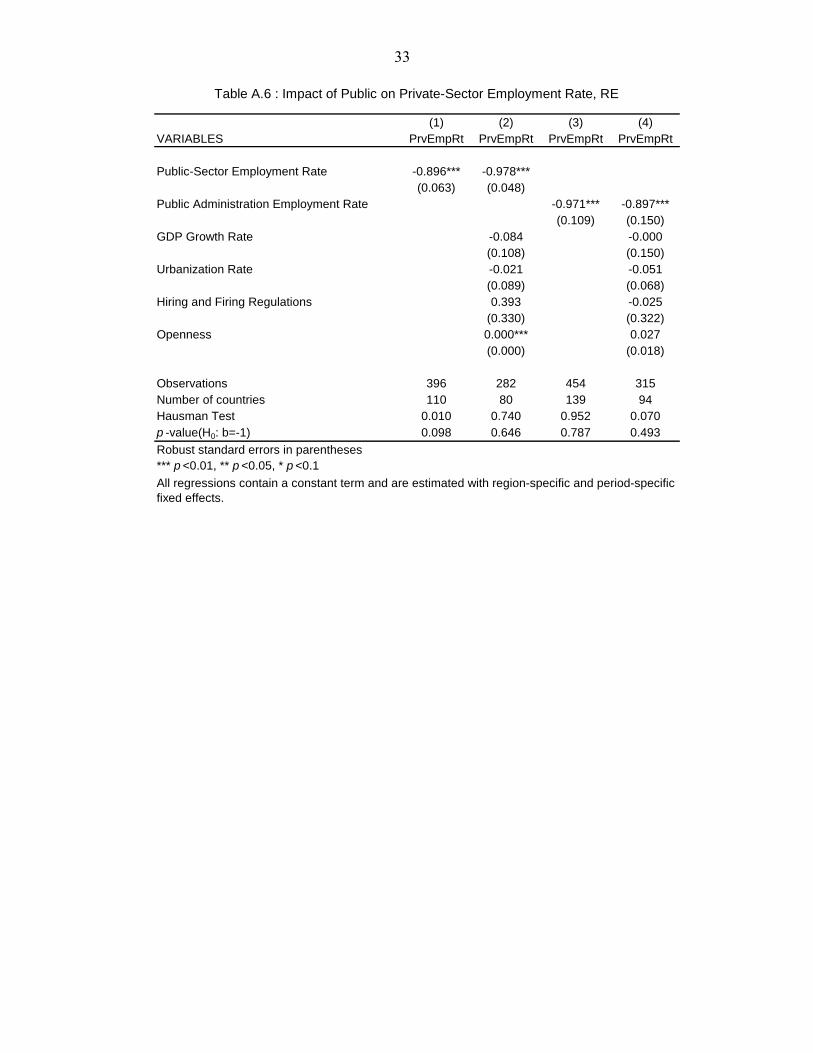
33
Table A.6 : Impact of Public on Private-Sector Employment Rate, RE
(1) (2) (3) (4)
VARIABLES PrvEmpRt PrvEmpRt PrvEmpRt PrvEmpRt
Public-Sector Employment Rate -0.896*** -0.978***
(0.063) (0.048)
Public Administration Employment Rate -0.971*** -0.897***
(0.109) (0.150)
GDP Growth Rate -0.084 -0.000
(0.108) (0.150)
Urbanization Rate -0.021 -0.051
(0.089) (0.068)
Hiring and Firing Regulations 0.393 -0.025
(0.330) (0.322)
Openness 0.000*** 0.027
(0.000) (0.018)
Observations 396 282 454 315
Number of countries 110 80 139 94
Hausman Test 0.010 0.740 0.952 0.070
p -value(H0: b=-1) 0.098 0.646 0.787 0.493
Robust standard errors in parentheses
*** p <0.01, ** p <0.05, * p <0.1
All regressions contain a constant term and are estimated with region-specific and period-specific
fixed effects.
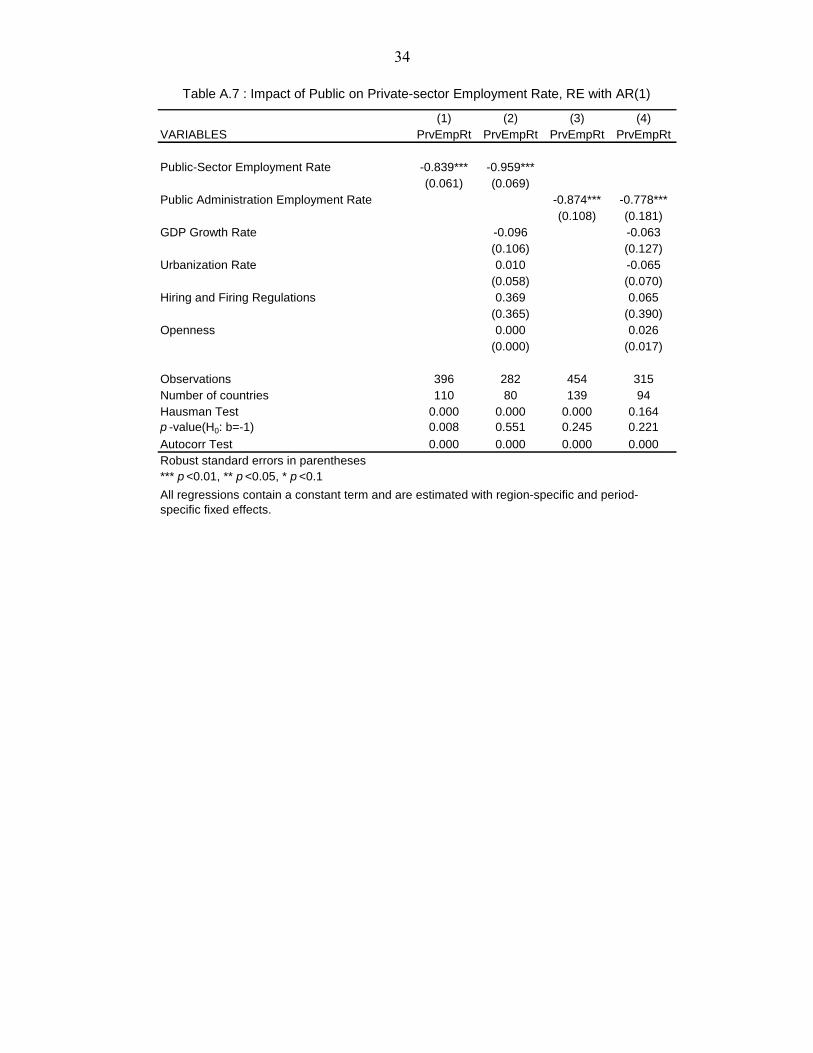
34
Table A.7 : Impact of Public on Private-sector Employment Rate, RE with AR(1)
(1) (2) (3) (4)
VARIABLES PrvEmpRt PrvEmpRt PrvEmpRt PrvEmpRt
Public-Sector Employment Rate -0.839*** -0.959***
(0.061) (0.069)
Public Administration Employment Rate -0.874*** -0.778***
(0.108) (0.181)
GDP Growth Rate -0.096 -0.063
(0.106) (0.127)
Urbanization Rate 0.010 -0.065
(0.058) (0.070)
Hiring and Firing Regulations 0.369 0.065
(0.365) (0.390)
Openness 0.000 0.026
(0.000) (0.017)
Observations 396 282 454 315
Number of countries 110 80 139 94
Hausman Test 0.000 0.000 0.000 0.164
p -value(H0: b=-1) 0.008 0.551 0.245 0.221
Autocorr Test 0.000 0.000 0.000 0.000
Robust standard errors in parentheses
*** p <0.01, ** p <0.05, * p <0.1
All regressions contain a constant term and are estimated with region-specific and period-
specific fixed effects.
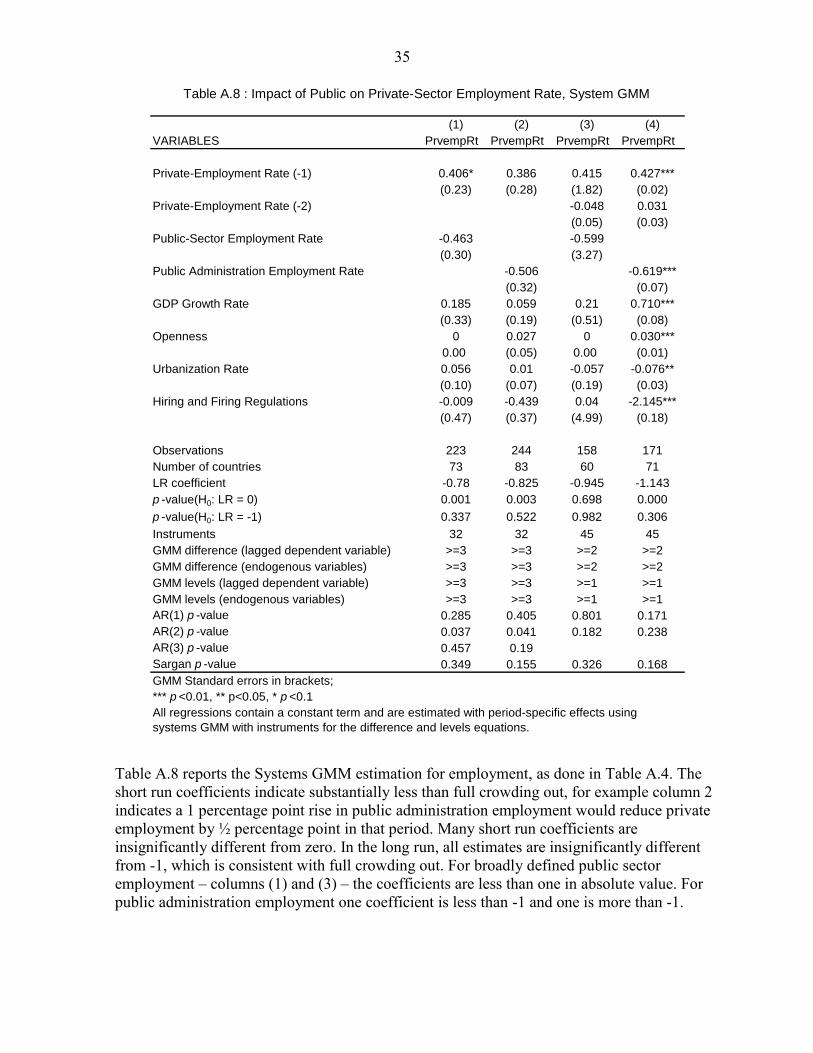
35
Table A.8 : Impact of Public on Private-Sector Employment Rate, System GMM
Table A.8 reports the Systems GMM estimation for employment, as done in Table A.4. The short run coefficients indicate substantially less than full crowding out, for example column 2 indicates a 1 percentage point rise in public administration employment would reduce private employment by ½ percentage point in that period. Many short run coefficients are insignificantly different from zero. In the long run, all estimates are insignificantly different from -1, which is consistent with full crowding out. For broadly defined public sector employment – columns (1) and (3) – the coefficients are less than one in absolute value. For public administration employment one coefficient is less than -1 and one is more than -1.
(1) (2) (3) (4)
VARIABLES PrvempRt PrvempRt PrvempRt PrvempRt
Private-Employment Rate (-1) 0.406* 0.386 0.415 0.427***
(0.23) (0.28) (1.82) (0.02)
Private-Employment Rate (-2) -0.048 0.031
(0.05) (0.03)
Public-Sector Employment Rate -0.463 -0.599
(0.30) (3.27)
Public Administration Employment Rate -0.506 -0.619***
(0.32) (0.07)
GDP Growth Rate 0.185 0.059 0.21 0.710***
(0.33) (0.19) (0.51) (0.08)
Openness 0 0.027 0 0.030***
0.00 (0.05) 0.00 (0.01)
Urbanization Rate 0.056 0.01 -0.057 -0.076**
(0.10) (0.07) (0.19) (0.03)
Hiring and Firing Regulations -0.009 -0.439 0.04 -2.145***
(0.47) (0.37) (4.99) (0.18)
Observations 223 244 158 171
Number of countries 73 83 60 71
LR coefficient -0.78 -0.825 -0.945 -1.143
p -value(H0: LR = 0) 0.001 0.003 0.698 0.000
p -value(H0: LR = -1) 0.337 0.522 0.982 0.306
Instruments 32 32 45 45
GMM difference (lagged dependent variable) >=3 >=3 >=2 >=2
GMM difference (endogenous variables) >=3 >=3 >=2 >=2
GMM levels (lagged dependent variable) >=3 >=3 >=1 >=1
GMM levels (endogenous variables) >=3 >=3 >=1 >=1
AR(1) p -value 0.285 0.405 0.801 0.171
AR(2) p -value 0.037 0.041 0.182 0.238
AR(3) p -value 0.457 0.19
Sargan p -value 0.349 0.155 0.326 0.168
GMM Standard errors in brackets;
*** p <0.01, ** p<0.05, * p <0.1
All regressions contain a constant term and are estimated with period-specific effects using
systems GMM with instruments for the difference and levels equations.
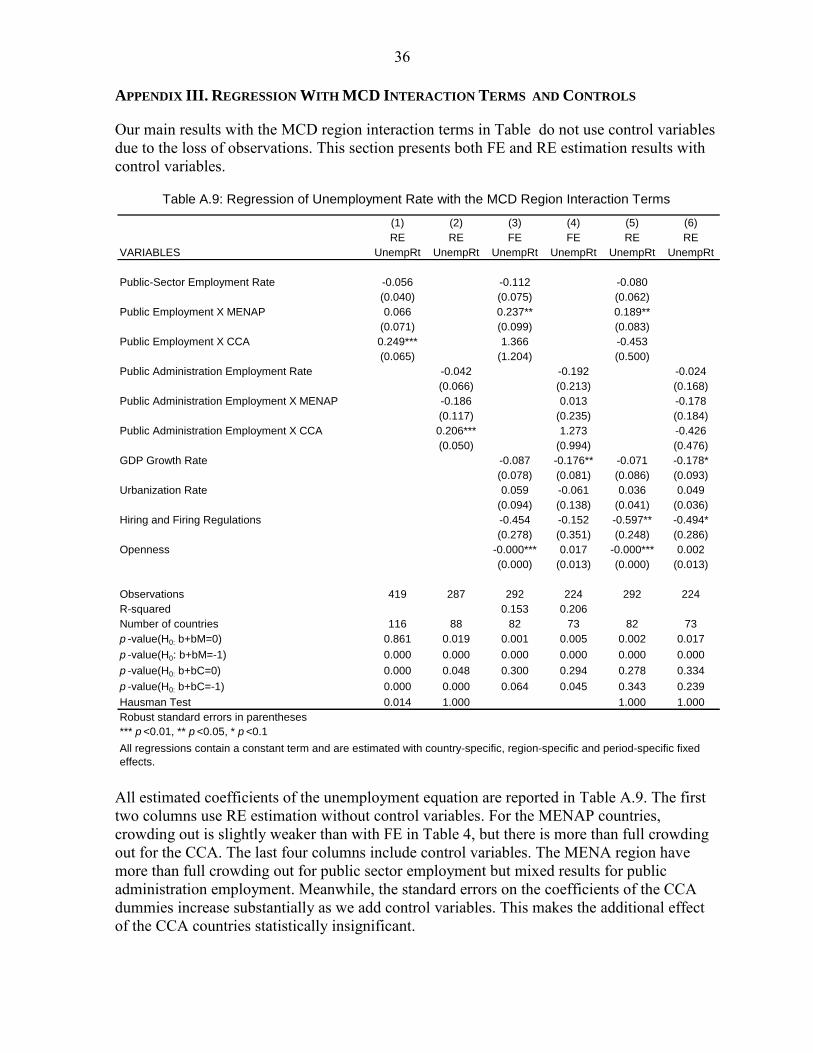
36
APPENDIX III. REGRESSION WITH MCD INTERACTION TERMS AND CONTROLS
Our main results with the MCD region interaction terms in Table do not use control variables due to the loss of observations. This section presents both FE and RE estimation results with control variables.
Table A.9: Regression of Unemployment Rate with the MCD Region Interaction Terms
All estimated coefficients of the unemployment equation are reported in Table A.9. The first two columns use RE estimation without control variables. For the MENAP countries, crowding out is slightly weaker than with FE in Table 4, but there is more than full crowding out for the CCA. The last four columns include control variables. The MENA region have more than full crowding out for public sector employment but mixed results for public administration employment. Meanwhile, the standard errors on the coefficients of the CCA dummies increase substantially as we add control variables. This makes the additional effect of the CCA countries statistically insignificant.
(1) (2) (3) (4) (5) (6)
RE RE FE FE RE RE
VARIABLES UnempRt UnempRt UnempRt UnempRt UnempRt UnempRt
Public-Sector Employment Rate -0.056 -0.112 -0.080
(0.040) (0.075) (0.062)
Public Employment X MENAP 0.066 0.237** 0.189**
(0.071) (0.099) (0.083)
Public Employment X CCA 0.249*** 1.366 -0.453
(0.065) (1.204) (0.500)
Public Administration Employment Rate -0.042 -0.192 -0.024
(0.066) (0.213) (0.168)
Public Administration Employment X MENAP -0.186 0.013 -0.178
(0.117) (0.235) (0.184)
Public Administration Employment X CCA 0.206*** 1.273 -0.426
(0.050) (0.994) (0.476)
GDP Growth Rate -0.087 -0.176** -0.071 -0.178*
(0.078) (0.081) (0.086) (0.093)
Urbanization Rate 0.059 -0.061 0.036 0.049
(0.094) (0.138) (0.041) (0.036)
Hiring and Firing Regulations -0.454 -0.152 -0.597** -0.494*
(0.278) (0.351) (0.248) (0.286)
Openness -0.000*** 0.017 -0.000*** 0.002
(0.000) (0.013) (0.000) (0.013)
Observations 419 287 292 224 292 224
R-squared 0.153 0.206
Number of countries 116 88 82 73 82 73
p -value(H0: b+bM=0) 0.861 0.019 0.001 0.005 0.002 0.017
p -value(H0: b+bM=-1) 0.000 0.000 0.000 0.000 0.000 0.000
p -value(H0: b+bC=0) 0.000 0.048 0.300 0.294 0.278 0.334
p -value(H0: b+bC=-1) 0.000 0.000 0.064 0.045 0.343 0.239
Hausman Test 0.014 1.000 1.000 1.000
Robust standard errors in parentheses
*** p <0.01, ** p <0.05, * p <0.1
All regressions contain a constant term and are estimated with country-specific, region-specific and period-specific fixed
effects.
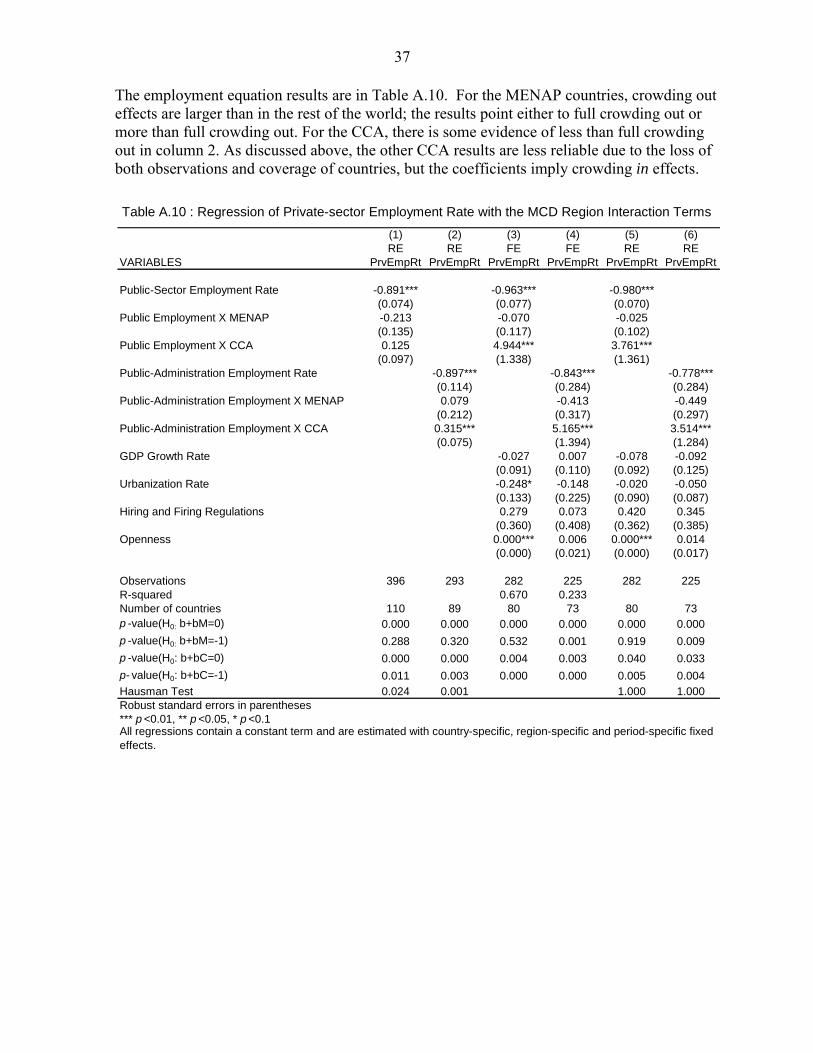
37
The employment equation results are in Table A.10. For the MENAP countries, crowding out effects are larger than in the rest of the world; the results point either to full crowding out or more than full crowding out. For the CCA, there is some evidence of less than full crowding out in column 2. As discussed above, the other CCA results are less reliable due to the loss of both observations and coverage of countries, but the coefficients imply crowding in effects.
Table A.10 : Regression of Private-sector Employment Rate with the MCD Region Interaction Terms
(1) (2) (3) (4) (5) (6)
RE RE FE FE RE RE
VARIABLES PrvEmpRt PrvEmpRt PrvEmpRt PrvEmpRt PrvEmpRt PrvEmpRt
Public-Sector Employment Rate -0.891*** -0.963*** -0.980***
(0.074) (0.077) (0.070)
Public Employment X MENAP -0.213 -0.070 -0.025
(0.135) (0.117) (0.102)
Public Employment X CCA 0.125 4.944*** 3.761***
(0.097) (1.338) (1.361)
Public-Administration Employment Rate -0.897*** -0.843*** -0.778***
(0.114) (0.284) (0.284)
Public-Administration Employment X MENAP 0.079 -0.413 -0.449
(0.212) (0.317) (0.297)
Public-Administration Employment X CCA 0.315*** 5.165*** 3.514***
(0.075) (1.394) (1.284)
GDP Growth Rate -0.027 0.007 -0.078 -0.092
(0.091) (0.110) (0.092) (0.125)
Urbanization Rate -0.248* -0.148 -0.020 -0.050
(0.133) (0.225) (0.090) (0.087)
Hiring and Firing Regulations 0.279 0.073 0.420 0.345
(0.360) (0.408) (0.362) (0.385)
Openness 0.000*** 0.006 0.000*** 0.014
(0.000) (0.021) (0.000) (0.017)
Observations 396 293 282 225 282 225
R-squared 0.670 0.233
Number of countries 110 89 80 73 80 73
p -value(H0: b+bM=0) 0.000 0.000 0.000 0.000 0.000 0.000
p -value(H0: b+bM=-1) 0.288 0.320 0.532 0.001 0.919 0.009
p -value(H0: b+bC=0) 0.000 0.000 0.004 0.003 0.040 0.033
p- value(H0: b+bC=-1) 0.011 0.003 0.000 0.000 0.005 0.004
Hausman Test 0.024 0.001 1.000 1.000
Robust standard errors in parentheses
*** p <0.01, ** p <0.05, * p <0.1All regressions contain a constant term and are estimated with country-specific, region-specific and period-specific fixed
effects.