Embed Size (px)
Citation preview
Does Prison Substance AbuseTreatment Reduce Recidivism?
Iowa Department of ManagementPerformance Audit Program
Performance Audit Report
Iowa Department of CorrectionsLicensed Substance Abuse Programs
May 25, 2007
Iowa Department of ManagementPerformance Audit Program
State Capitol Building1007 East Grand
Des Moines, IA 50319
Scott J. Vander Hart, Performance Auditor515/281-6536
515/242-5897 [email protected]
The Iowa Legislature has given the Iowa Department ofManagement (IDOM) authority to implement a system of
periodic performance audits in consultation with theLegislative Services Agency, Auditor of State and executive
branch agencies.
The performance audit is a key component of the IowaAccountable Government Act. Its purpose is to evaluate
agency performance, including program effectiveness, basedon performance measures, targets and supporting data.
In response, IDOM has created the consultative PerformanceAudit Program designed to improve state agencies ability to
achieve and demonstrate key results by offering relevant andpractical solutions to performance challenges.
DOC Licensed Substance Abuse Programs Page 1
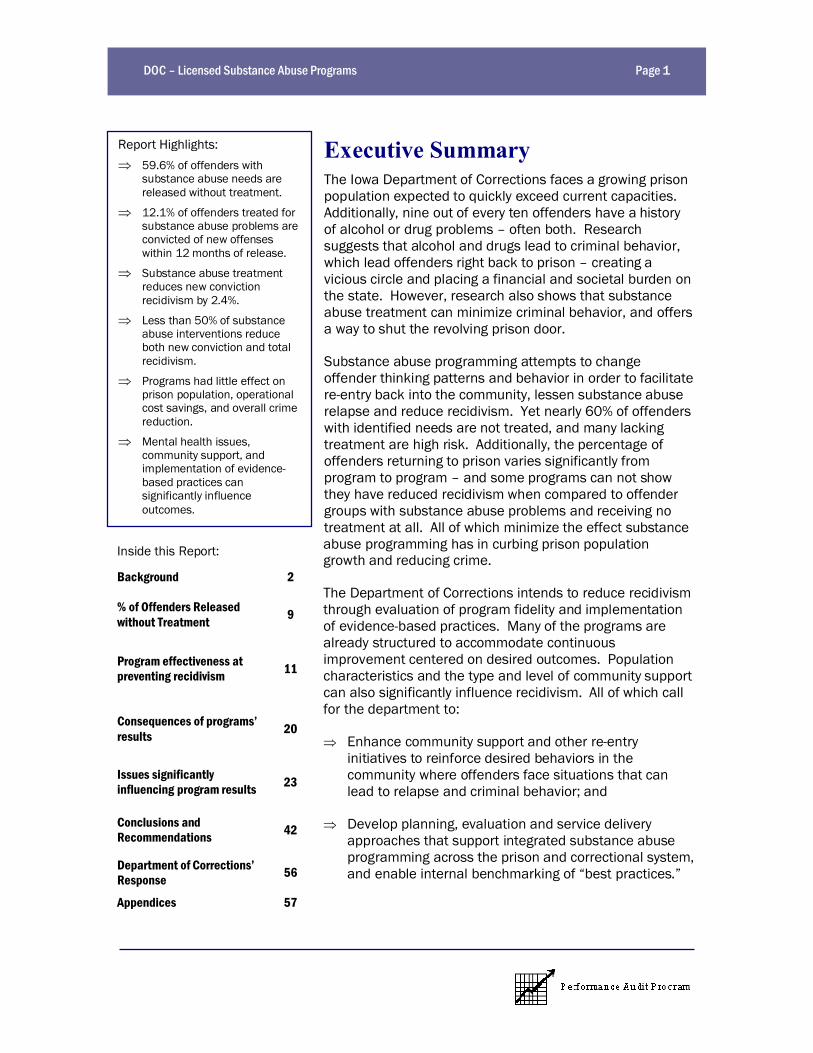
Executive SummaryThe Iowa Department of Corrections faces a growing prisonpopulation expected to quickly exceed current capacities.Additionally, nine out of every ten offenders have a historyof alcohol or drug problems often both. Researchsuggests that alcohol and drugs lead to criminal behavior,which lead offenders right back to prison creating avicious circle and placing a financial and societal burden onthe state. However, research also shows that substanceabuse treatment can minimize criminal behavior, and offersa way to shut the revolving prison door.
Substance abuse programming attempts to changeoffender thinking patterns and behavior in order to facilitatere-entry back into the community, lessen substance abuserelapse and reduce recidivism. Yet nearly 60% of offenderswith identified needs are not treated, and many lackingtreatment are high risk. Additionally, the percentage ofoffenders returning to prison varies significantly fromprogram to program and some programs can not showthey have reduced recidivism when compared to offendergroups with substance abuse problems and receiving notreatment at all. All of which minimize the effect substanceabuse programming has in curbing prison populationgrowth and reducing crime.
The Department of Corrections intends to reduce recidivismthrough evaluation of program fidelity and implementationof evidence-based practices. Many of the programs arealready structured to accommodate continuousimprovement centered on desired outcomes. Populationcharacteristics and the type and level of community supportcan also significantly influence recidivism. All of which callfor the department to:
Þ Enhance community support and other re-entryinitiatives to reinforce desired behaviors in thecommunity where offenders face situations that canlead to relapse and criminal behavior; and
Þ Develop planning, evaluation and service deliveryapproaches that support integrated substance abuseprogramming across the prison and correctional system,and enable internal benchmarking of best practices.
Inside this Report:
Background 2
% of Offenders Releasedwithout Treatment 9
Program effectiveness atpreventing recidivism 11
Consequences of programsresults 20
Issues significantlyinfluencing program results 23
Conclusions andRecommendations 42
Department of CorrectionsResponse 56
Appendices 57
Report Highlights:Þ 59.6% of offenders with
substance abuse needs arereleased without treatment.
Þ 12.1% of offenders treated forsubstance abuse problems areconvicted of new offenseswithin 12 months of release.
Þ Substance abuse treatmentreduces new convictionrecidivism by 2.4%.
Þ Less than 50% of substanceabuse interventions reduceboth new conviction and totalrecidivism.
Þ Programs had little effect onprison population, operationalcost savings, and overall crimereduction.
Þ Mental health issues,community support, andimplementation of evidence-based practices cansignificantly influenceoutcomes.
DOC Licensed Substance Abuse Programs Page 2
BackgroundThe National Institute on Drug Abuse(NIDA), one of the federalgovernment s lead agencies forsubstance abuse research, describesdrug addiction as a complex illness,characterized by compulsive, attimes, uncontrollable drugcraving, seeking and use( Drug Abuse Treatment 9).In 2004, 83% of stateprisoners had used illegaldrugs, and 53% met theDSM-IV1 criteria for drugdependence or abuse(Mumola and Karberg 1).The Department ofCorrections (DOC) findingsare similar. 90% ofoffenders within the prisonsystem have a history ofalcohol or drug problems, and roughly60% have had problems with bothdrugs and alcohol (Prell SubstanceAbuse 5). The statistics makeDrugs/Alcohol the top priority need ofoffenders within prison (DOC StrategicPlan 19).
Alcohol and Drug Use andAbuse Can Lead to CriminalBehaviorDrug use can lead to addiction,negative behaviors, and many healthrelated problems. Even experimentaluse can quickly grow into an addictiondepending on individual vulnerabilities.Over time, an individual s ability tochoose not to take drugs diminishes,
1 Criteria specified in the Diagnostic andStatistical Manual of Mental Disorders, fourthedition (DSM-IV).
and continued use persists regardlessof medical, psychological, and socialconsequences. Methamphetamine,Marijuana and Cocaine were identifiedas the three most prominent drugsused/abused by offenders in Iowa s
prison system (Prell SubstanceAbuse 5). Short-term effectsof such drug use include:impaired motor function andjudgment, and bizarre, erraticand violent behavior in highdoses (such as with cocaine).Long-term effects include:addiction, mood disturbances,irritability, aggressive andviolent behavior, paranoia,hallucinations, and health-related problems (NIDACocaine 4-5, Marijuana 5,
Methamphetamine 5).
Aggressive and violent behaviors andother drug effects can lead to criminaloffenses. Illegal drug use was found toincrease the odds of committing anycrime sixfold (NIJ Adult Patterns ).According to Mumola and Karberg,nearly a third of state prisonersnationally were under the influence ofillegal substances at the time of theiroffense, and over half had taken drugswithin the month of their offense (2).There is also an association betweendrug use and re-occurring crime. 21%more state prisoners dependent on orabusing drugs also had at least threeprior sentences to probation orincarceration when compared to otherinmates (Mumola and Karberg, 1).
Overtime, anindividual s
ability to choosenot to take drugsdiminishes, andcontinued use
persistsregardless of
medical,psychological,
and socialconsequences.
DOC Licensed Substance Abuse Programs Page 3
Treatment Can Reduce CriminalBehaviorSubstance abuse is a recognizeddynamic risk factor2, altering the needcan increase the likelihood of changingthe criminal behavior and closing therevolving prison door (NationalInstitute of Corrections 5; Bonta Risk-Needs 23). Long-term use of drugscan temporarily and permanently alterbrain anatomy and chemistry. Thealterations persists long after drug use(months to years) making it extremelydifficult for addicts to quit on their own(NIDA Drug Abuse Treatment 14;Treatment for Criminal Justice
Populations 1). This makes drugaddicts high risk for relapse even afterprolonged periods ofabstinence, suggesting theneed for treatment evenwith longer prisonsentences.
DOC intends to impact andreduce recidivism ofoffenders through evidence-based programming( Strategic Plan 5,Performance Plan 1, Self-
Assessment 15, 19, 38). Accordingto NIDA, substance abuse treatmenthas the potential to support this effort.They state, Treatment offers the bestalternative for interrupting the drugabuse/criminal justice cycle( Treatment for Criminal JusticePopulations 13).
2 Dynamic or changeable risk factors are alsoknown as criminogenic needs and serve aspredictors to criminal behavior.
Recent meta-analyses of treatmentprogram evaluations generally supportthe use of substance abuseprogramming as a means to reducedrug use and criminal behavior. Ameta-analysis conducted byPrendergast et al. concluded thattreatment programs, as practiced inthe United States, are effective atreducing drug use and crime (66).3The average effect sizes for drug useand crime were both positiveindicating on average, clients whoparticipated in treatment had betteroutcomes than did those who receivedno treatment or those who receivedminimal treatment (61).4 Effect sizeswere translated to reflect a 15% highersuccess rate on drug use outcomes,
and a 6% higher success rateon crime outcomes fortreatment groups (63).5Prendergast s study helpeddismiss claims that drugtreatment was not effective,and refocus on the question ofhow can treatment beimproved, and better addressthe needs of clients.
An analysis by Mitchell, Wilson, andMacKenzie focused more closely onthe subject of this audit
3 Meta-analysis conducted on 78 drug treatmentstudies conducted between 1965 and 1996.However, only 25 of the studies had crimeoutcome information. The analysis comparedthose who received drug treatment to those whoreceived minimal or no treatment. 59% of thestudies assigned participants randomly or quasi-randomly.4 Effect size is an index that measures themagnitude of a treatment effect.5 Binomial effect size display (BESD) equivalentwas used to determine the success rates.
evaluationsgenerally support
the use ofsubstance abuseprogramming as
a means toreduce drug use
and criminalbehavior.
DOC Licensed Substance Abuse Programs Page 4
incarceration-based substance abusetreatment programs. They concludethat incarceration-based programs aremodestly effective in reducing
recidivism .6 In the study, the generalrecidivism odds-ratio favored thetreatment group over the comparisongroup in 83% of the 65 evaluationshaving at least one measure for post-release offending.7 The generalrecidivism rate is translated to be 7%lower for treatment groups.Far fewer of theindependent evaluationsreviewed in this studyassessed post-release druguse. The meta-analysisresults for drug useoutcomes were not found tobe statistically significant(12, 17).8 In a study ofsubstance abuse programs within thefederal prison system, Pelissier et al.
6 The meta-analysis was based on 53 uniquestudies reporting the results of 66 independentevaluations with interventions conductedbetween 1980 and 2004. Two-thirds of thestudies were post-1996. The scope was thereview was experimental and quasi-experimentalevaluations of incarceration-based drugtreatment programs for juveniles and adults thatutilized a comparison group (no or minimaltreatment).7 General recidivism included re-arrests, re-convictions, and re-incarcerations.8 The odds-ratio compared the odds of an eventoccurring in comparison group to the odds of itoccurring in the treatment group. The meanodds-ratio for the general recidivism was 1.37,re-arrests 1.40, re-convictions 1.43, and re-incarcerations 1.22. An odds ratio of 1 impliesthat the event is equally likely in both groups.Results greater than one indicates that therecidivism event is more likely to happen incomparison group, values less than one wouldmake it less likely to occur. All were found to bestatistically significant.
further support the use of substanceabuse programs within correctionalsettings. They concluded that inmatesreceiving in-prison residentialtreatment were less likely to be re-arrested than untreated inmateswithin the first six months after release(329).9
Prison Programming
The DOC attempts to addressthis problem through theprovision of substance abuseprogramming to offendersthrough 15 licensed programsin eight institutions.10 In SFY2006, the licensed substanceabuse programs collectivelyhad the capacity to serve 2,014offenders. In SFY 2007, the
DOC budgeted $3.1 million for thedelivery of licensed substance abuseprograms ( Budget Details 2).
Although the substance abuseprograms were often developedindependently at the institutional-level,they all share a common purpose.Most employees, managers andstakeholders believe that theprograms are intended to changeoffender thinking patterns andbehavior in order to facilitate re-entryback into the community, lessensubstance abuse relapse, and reducerecidivism (Performance Audit
9 Male and female treatment subjects were drawnfrom 20 different prisons of medium, low andminimum security levels. Comparison subjectswere drawn from over 30 prisons. Both groupswere limited to those released to supervision.10 Programs conform to the licensure standardsoutlined in 641 Iowa Administrative CodeChapter 156.
Programs areintended to
change offenderthinking patternsand behaviors inorder to reduce
recidivism.
DOC Licensed Substance Abuse Programs Page 5
Manager Interviews, Employee Survey,and Stakeholder Survey). However,how the programs fulfill this purposediffers:
Þ the level of treatment varies amongthe licensed programs, four areinpatient residential programs, oneis an intensive outpatient program,and the remaining programs areoutpatient;
Þ the minimum program durationgenerally ranges from 12 to 40weeks (however, one program issignificantly longer spanning an18 month period);
Þ the hours per week spent in orintensity of program activities varyamong programs, and in manycases are dependent on individualcase plans; and
Þ the number of offenders per staffperson also varies significantlyfrom six offenders for every staffperson to 40.
However, the programs do share somecommon ground with 11 of the 15programs using curriculumsspecifically incorporating cognitive andcognitive-behavioral therapies. Oneprogram also uses a gender specificcurriculum designed to help womenrecover from substance abuse. Twoprograms curriculums are eclectic drawing from a variety of sources.
Although the programs are attemptingto lessen substance abuse relapseand criminal behavior, it is importantto note they can not control the results
but can only hope to influence them.
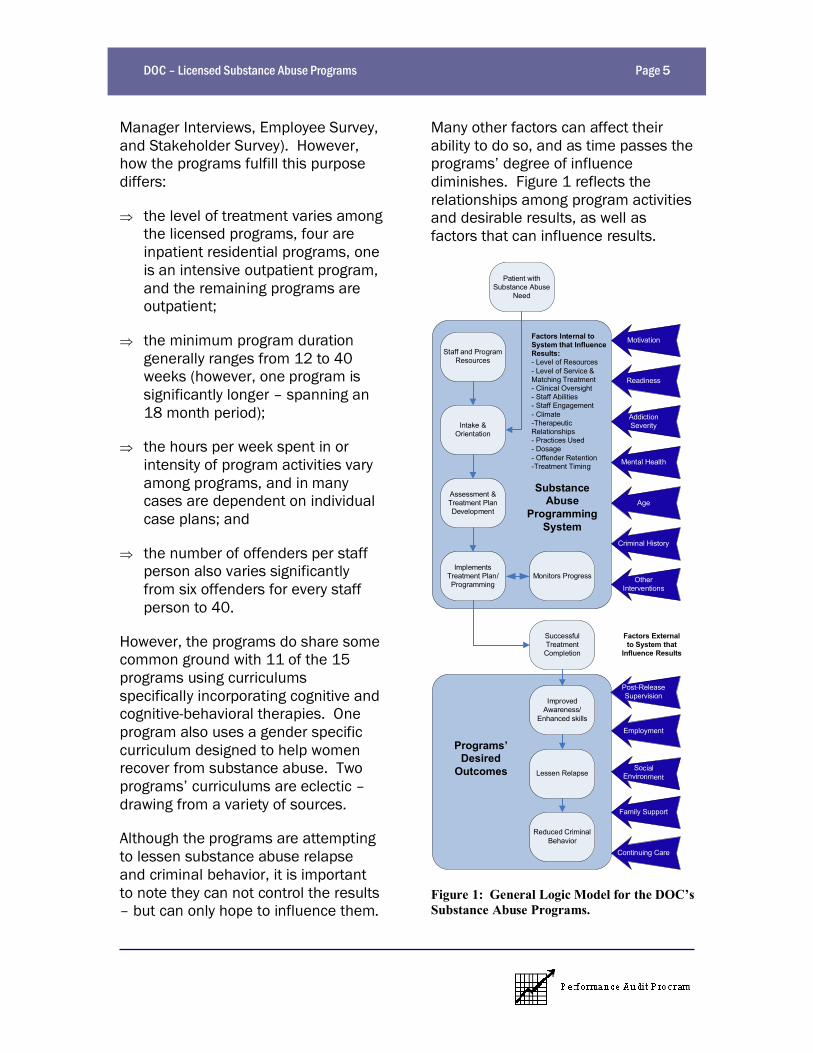
Many other factors can affect theirability to do so, and as time passes theprograms degree of influencediminishes. Figure 1 reflects therelationships among program activitiesand desirable results, as well asfactors that can influence results.
Patient withSubstance Abuse
Need
ImplementsTreatment Plan/Programming
ImprovedAwareness/
Enhanced skills
Reduced CriminalBehavior
Intake &Orientation
Monitors Progress
Assessment &Treatment PlanDevelopment
SuccessfulTreatmentCompletion
Staff and ProgramResources
SubstanceAbuse
ProgrammingSystem
Motivation
Readiness
AddictionSeverity
Mental Health
Factors Internal toSystem that InfluenceResults:- Level of Resources- Level of Service &Matching Treatment- Clinical Oversight- Staff Abilities- Staff Engagement- Climate-TherapeuticRelationships- Practices Used- Dosage- Offender Retention-Treatment Timing
OtherInterventions
SocialEnvironment
Family Support
Criminal History
Age
Employment
ProgramsDesired
Outcomes
Post-ReleaseSupervision
Continuing Care
Lessen Relapse
Factors Externalto System that
Influence Results
Figure 1: General Logic Model for the DOC sSubstance Abuse Programs.
DOC Licensed Substance Abuse Programs Page 6
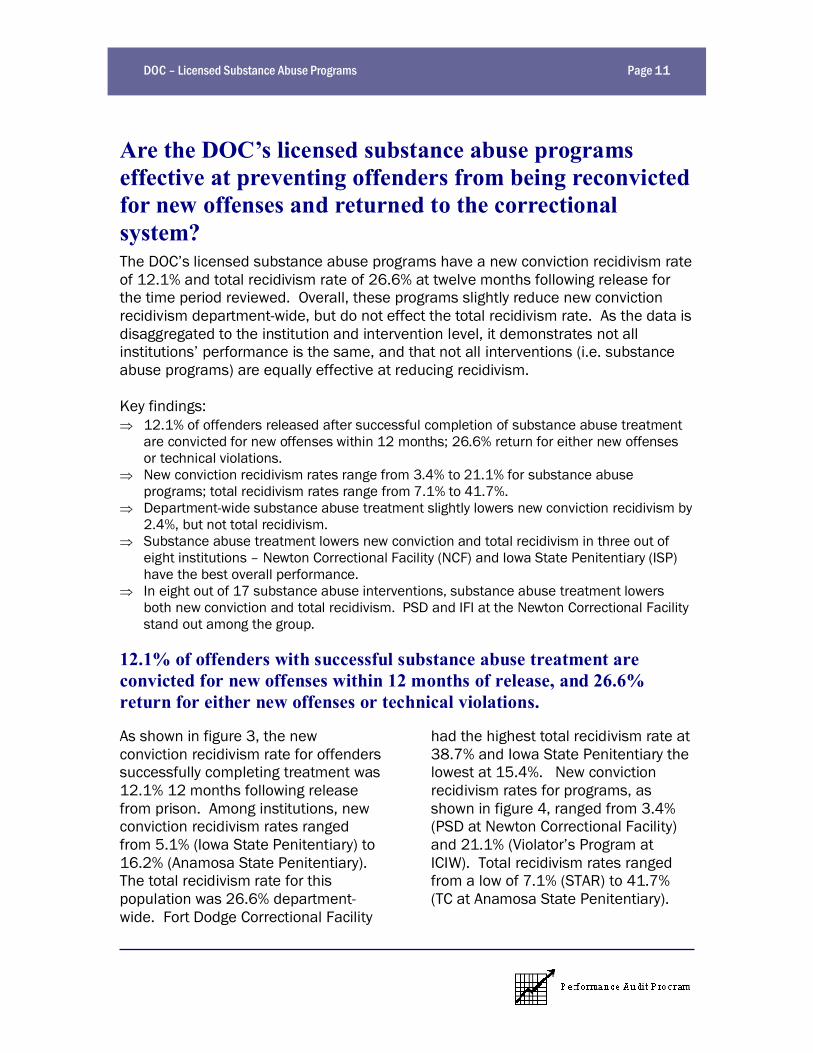
Audit Scope, Objectives and MethodologyThe performance audit focused on thelicensed substance abuse programsavailable to offenders in prison.Substance abuse programs wereselected, since substance abuse is thetop criminogenic need amongoffenders within Iowa s prisonsystem.11 The use of evidence-basedpractices is also a key strategyembraced by DOC to reduce offenderrecidivism, which can influence themeans for which treatment isdelivered. The offender populationwas set using offenders releasedbetween October 1, 2004 andDecember 31, 2005. The timeframewas limited because of availability ofsubstance abuse intervention data inIowa Corrections Offender Network(ICON).
The follow-up period to capturerecidivism information was one year.Two recidivism measures were used:new conviction resulting in prison orcommunity supervision; and newconviction or return to prison for anyreason (i.e. total recidivism rate). Exitor release was based on release fromprison due to end of sentence orentrance into community supervision.
The performance audit s purpose,developed as part of Iowa sAccountable Government Act, is toevaluate agency performance,including program effectiveness,based on performance measures,
11 Criminogenic needs are attributes of anoffender that when changed can reduce theprobability of criminal behavior.
targets and supporting. In accordancewith the program s legislative purpose,the following objectives wereestablished to evaluate theeffectiveness of licensed substanceabuse programs within DOC:
Objective 1: What percentage ofoffenders with a history of substanceabuse is released without treatment?
Objective 2: Are the DOC s licensedsubstance abuse programs effective atpreventing offenders from beingreconvicted for new offenses andreturned to the correctional system?What are the consequences of theprograms being effective or ineffectiveand why?1) Condition What are the
recidivism rates for offenderssuccessfully completing licensedsubstance abuse programs 12months following release fromprison?
2) Criteria How do the 12 monthrecidivism rates of offenderssuccessfully completing thesubstance abuse program compareto:a) offenders from the same
institution with a history ofsubstance abuse, but receivedno treatment;
b) offenders who started the sameprogram, but did notsuccessfully complete it; and
c) offenders from the sameinstitution without a history ofsubstance abuse?
DOC Licensed Substance Abuse Programs Page 7
3) Effect How does this impactcorrections population growth andoperational costs?
4) Causes a) Do the following variables
significantly influencerecidivism rates:i) Co-occurring mental health
problems,ii) Length of time between
treatment and release,iii) LSI-R score, andiv) Participation in community
aftercare?b) How does program
management, structure andstaffing influence recidivismrates?
Substance abuse needs wereidentified by LSI-R, Iowa Risk, CustodyClassifications, or JesnessAssessments. Treatment groupsinstitution and location were definedby location where treatment wasconcluded, which may differ from anoffender s release location.Comparison groups institution andlocation were based on offenderslocation at time of release foroffenders comprising these groups.
Comparisons were made by reviewingthe difference in recidivism ratesbetween the treatment group and thecomparison groups at the sameinstitution or location. The recidivismrates from the comparison group weresubtracted from the recidivism rate ofthe treatment group to determine thedifference. Negative values reflectpositive results the expectation isthat treatment groups will have a lowerrecidivism rate.
Causes were reviewed primarily bycontrolling for the specific variable ofinterest to see if a pattern emerges inrecidivism rates. Where patternsemerged at the department-wide andinstitutional levels, populationcharacteristics were reviewed at theprogram level if possible. Differencesin population characteristics betweentreatment group and comparisongroup were examined specifically forco-occurring mental health problems,LSI-R scores, and offenderdemographics. Length of timebetween treatment and release, andparticipation in community aftercarewere reviewed for each treatmentgroup at the institution and programlevel where possible.
The review of program management,structure and staffing was limitedsince many offenders receivedtreatment two to three years ago.Observations made during the audit,may not be representative to how theprogram operated at the timeoffenders in the data set were treated.Additionally, previous evidence-basedprogram assessments were conductedroughly two years prior to the offendersreceiving treatment, and they werelimited to five of the 15 programs.These evaluations are also limited to aspecific point in time, and may notadequately reflect how the offenders inthis data set were treated.
The variables were compared todifferences in recidivism rates for eachprogram to identify those which appearto affect the difference. The datacollection methodology for theperformance audit is provided inAppendix A. The data was

DOC Licensed Substance Abuse Programs Page 8
supplemented with policy andprocedure manual reviews, managerinterviews and employee andstakeholder surveys.

DOC Licensed Substance Abuse Programs Page 9
What percentage of offenders with a history ofsubstance abuse is released without treatment?
Lack of treatment resources was oneof the most pressing issues noted bymanagers, stakeholder and employeesalike. Budget and staffing reductionsand available treatment space limitDOC s ability to provide substanceabuse treatment to many of theoffenders in need (Performance Audit
Employee Survey, StakeholderSurvey; Howard and Phillips; Dick andComp; Dursky et al.; Bagby; Austin andKelly). Of those released from prison
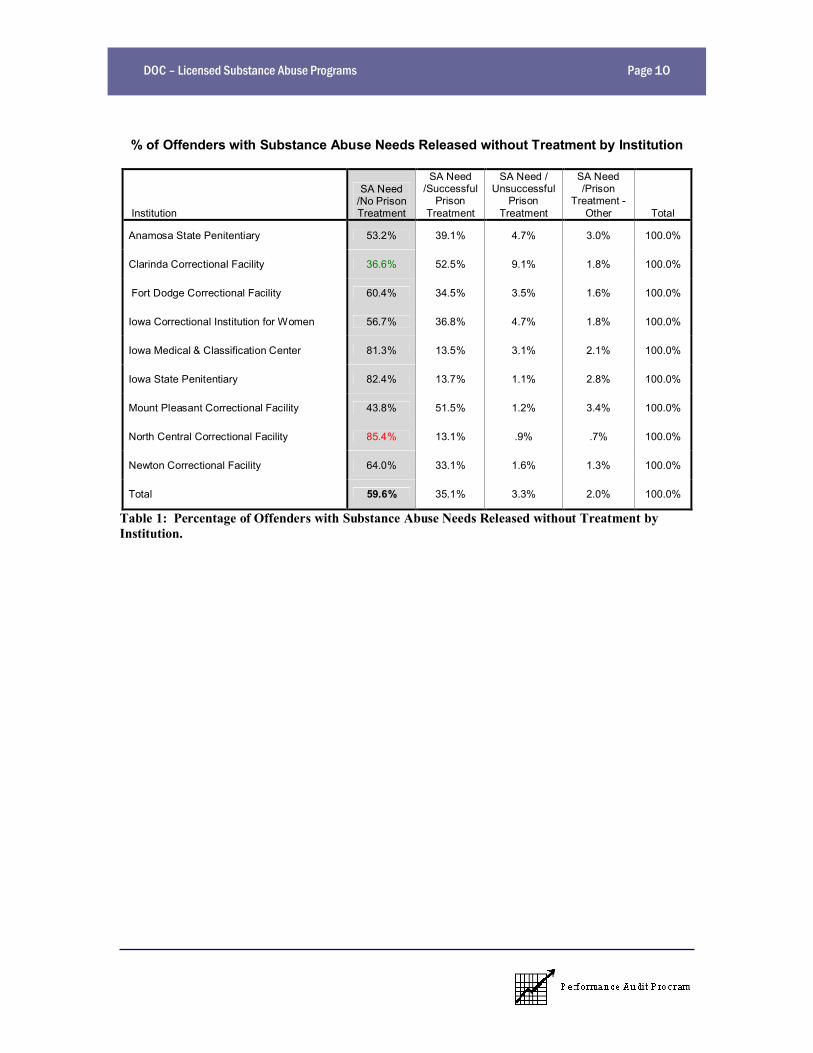
between October 1, 2004 andDecember 31, 2005, slightly less than60% of the offenders with substanceabuse needs had not receivedsubstance abuse treatment, as shownin Figure 2. North Central CorrectionalFacility had the largest percentage ofoffenders with substance abuse needsreleased without treatment at 85.4%and Clarinda Correctional Facility thefewest at 36.6%, as shown in Table 1.
59.6%
Percent of Offenders with Substance Abuse Need Released without Treatment
SA Need/Prison Treatment- Other
SA Need/UnsuccessfulPrison Treatment
SA Need/SuccessfulPrison Treatment
SA Need/No PrisonTreatment
Group
Figure 2: Percent of Offenders with Substance Abuse Need Released without Substance AbuseTreatment.
DOC Licensed Substance Abuse Programs Page 10
% of Offenders with Substance Abuse Needs Released without Treatment by Institution
Institution
SA Need/No PrisonTreatment
SA Need/Successful
PrisonTreatment
SA Need /Unsuccessful
PrisonTreatment
SA Need/Prison
Treatment -Other Total
Anamosa State Penitentiary 53.2% 39.1% 4.7% 3.0% 100.0%
Clarinda Correctional Facility 36.6% 52.5% 9.1% 1.8% 100.0%
Fort Dodge Correctional Facility 60.4% 34.5% 3.5% 1.6% 100.0%
Iowa Correctional Institution for Women 56.7% 36.8% 4.7% 1.8% 100.0%
Iowa Medical & Classification Center 81.3% 13.5% 3.1% 2.1% 100.0%
Iowa State Penitentiary 82.4% 13.7% 1.1% 2.8% 100.0%
Mount Pleasant Correctional Facility 43.8% 51.5% 1.2% 3.4% 100.0%
North Central Correctional Facility 85.4% 13.1% .9% .7% 100.0%
Newton Correctional Facility 64.0% 33.1% 1.6% 1.3% 100.0%
Total 59.6% 35.1% 3.3% 2.0% 100.0%
Table 1: Percentage of Offenders with Substance Abuse Needs Released without Treatment byInstitution.
DOC Licensed Substance Abuse Programs Page 11
Are the DOC s licensed substance abuse programseffective at preventing offenders from being reconvictedfor new offenses and returned to the correctionalsystem?The DOC s licensed substance abuse programs have a new conviction recidivism rateof 12.1% and total recidivism rate of 26.6% at twelve months following release forthe time period reviewed. Overall, these programs slightly reduce new convictionrecidivism department-wide, but do not effect the total recidivism rate. As the data isdisaggregated to the institution and intervention level, it demonstrates not allinstitutions performance is the same, and that not all interventions (i.e. substanceabuse programs) are equally effective at reducing recidivism.
Key findings:Þ 12.1% of offenders released after successful completion of substance abuse treatment
are convicted for new offenses within 12 months; 26.6% return for either new offensesor technical violations.
Þ New conviction recidivism rates range from 3.4% to 21.1% for substance abuseprograms; total recidivism rates range from 7.1% to 41.7%.
Þ Department-wide substance abuse treatment slightly lowers new conviction recidivism by2.4%, but not total recidivism.
Þ Substance abuse treatment lowers new conviction and total recidivism in three out ofeight institutions Newton Correctional Facility (NCF) and Iowa State Penitentiary (ISP)have the best overall performance.
Þ In eight out of 17 substance abuse interventions, substance abuse treatment lowersboth new conviction and total recidivism. PSD and IFI at the Newton Correctional Facilitystand out among the group.
12.1% of offenders with successful substance abuse treatment areconvicted for new offenses within 12 months of release, and 26.6%return for either new offenses or technical violations.
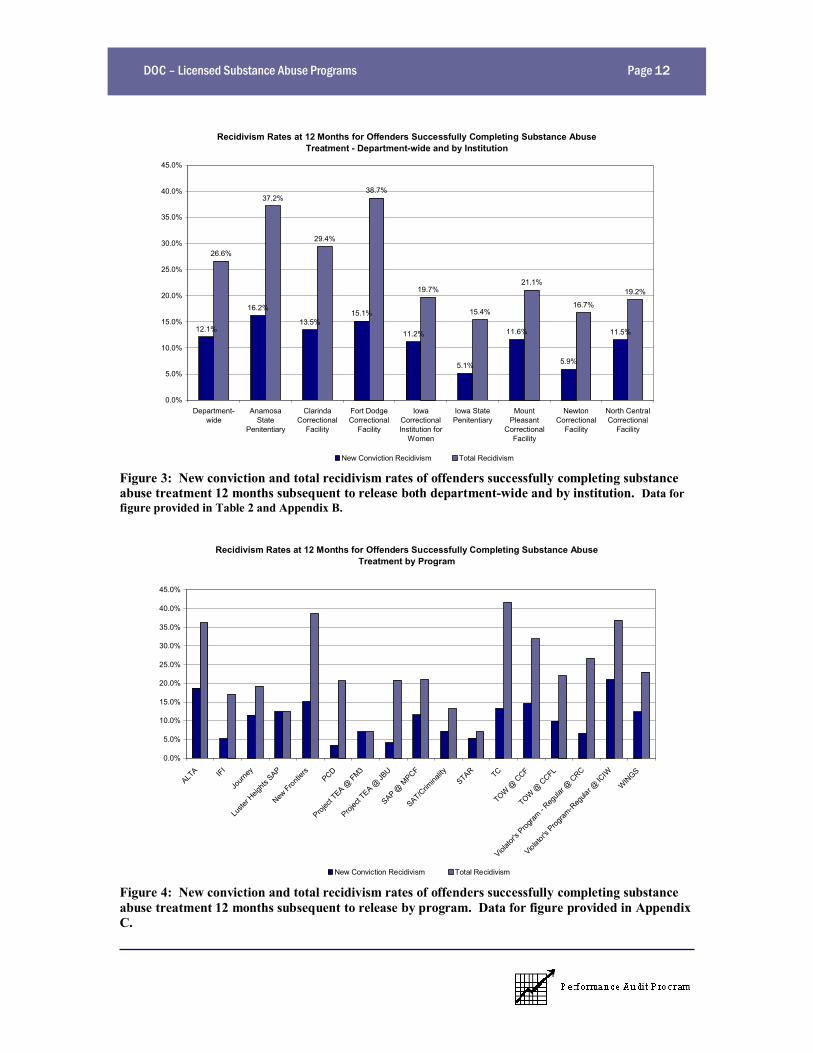
As shown in figure 3, the newconviction recidivism rate for offenderssuccessfully completing treatment was12.1% 12 months following releasefrom prison. Among institutions, newconviction recidivism rates rangedfrom 5.1% (Iowa State Penitentiary) to16.2% (Anamosa State Penitentiary).The total recidivism rate for thispopulation was 26.6% department-wide. Fort Dodge Correctional Facility
had the highest total recidivism rate at38.7% and Iowa State Penitentiary thelowest at 15.4%. New convictionrecidivism rates for programs, asshown in figure 4, ranged from 3.4%(PSD at Newton Correctional Facility)and 21.1% (Violator s Program atICIW). Total recidivism rates rangedfrom a low of 7.1% (STAR) to 41.7%(TC at Anamosa State Penitentiary).
DOC Licensed Substance Abuse Programs Page 12
Recidivism Rates at 12 Months for Offenders Successfully Completing Substance AbuseTreatment - Department-wide and by Institution
12.1%
16.2%
13.5%15.1%
11.2%
5.1%
11.6%
5.9%
11.5%
26.6%
37.2%
29.4%
38.7%
19.7%
15.4%
21.1%
16.7%
19.2%
0.0%
5.0%
10.0%
15.0%
20.0%
25.0%
30.0%
35.0%
40.0%
45.0%
Department-wide
AnamosaState
Penitentiary
ClarindaCorrectional
Facility
Fort DodgeCorrectional
Facility
IowaCorrectionalInstitution for
Women
Iowa StatePenitentiary
MountPleasant
CorrectionalFacility
NewtonCorrectional
Facility
North CentralCorrectional
Facility
New Conviction Recidivism Total Recidivism
Figure 3: New conviction and total recidivism rates of offenders successfully completing substanceabuse treatment 12 months subsequent to release both department-wide and by institution. Data forfigure provided in Table 2 and Appendix B.
Recidivism Rates at 12 Months for Offenders Successfully Completing Substance AbuseTreatment by Program
0.0%
5.0%
10.0%
15.0%
20.0%
25.0%
30.0%
35.0%
40.0%
45.0%
ALTA IFI
Journ
ey
Luste
r Heig
hts S
AP
New Fron
tiers
PCD
Projec
t TEA @
FM3
Projec
t TEA @
JBU
SAP @ M
PCF
SAT/Crim
inality
STAR TC
TOW @
CCF
TOW @
CCFL
Violato
r's P
rogram
- Reg
ular @
CRC
Violator's P
rogram
-Reg
ular @
ICIW
WINGS
New Conviction Recidivism Total Recidivism
Figure 4: New conviction and total recidivism rates of offenders successfully completing substanceabuse treatment 12 months subsequent to release by program. Data for figure provided in AppendixC.

DOC Licensed Substance Abuse Programs Page 13
Department-wide substance abuse treatment slightly lowers newconviction recidivism, but not total recidivism.
Within the prison system, newconviction recidivism rates were 0.3%lower for offenders successfullycompleting substanceabuse treatment programscompared to offenders withsubstance abuse needsreceiving no treatment inprison. The difference innew conviction recidivismrates associatesDepartment-wide successfulsubstance abuse treatmentwith a 2.4% reduction in recidivism fornew convictions12. However, the totalrecidivism rate for offenderssuccessfully completing substanceabuse treatment is 0.5% higher thanthose offenders with substance abuse
12 % change = ((12.4%-12.1%)/12.4%) X 100
needs and no treatment within prison.Although fewer offenders withsuccessful substance abuse program
completion were reconvictedfor new offenses, morereturned to the correctionalsystem due to technicalviolations. Collectively, DOC ssubstance abuse programs didnot demonstrate success foreither new convictions or totalrecidivism rates or whencompared to offenders
released with no substance abuseneeds. See Table 2 for additionalinformation.
Substance abusetreatment
reduces newconviction
recidivism forthose with
substance abuseneed by 2.4%
department-wide.
Recidivism Rates by Comparison Group
Recidivism Rates
Comparison GroupDid Not
RecidivateNew
ConvictionsTechnicalViolations Total
Count 659 94 90 184No SA Need% 78.2% 11.2% 10.7% 21.8%Count 1893 314 321 635
SA Need/No Prison Treatment% 74.9% 12.4% 12.7% 25.1%Count 1095 180 216 396
SA Need/Successful Prison Treatment% 73.4% 12.1% 14.5% 26.6%Count 95 22 24 46
SA Need/Unsuccessful Prison Treatment% 67.4% 15.6% 17.0% 32.6%Count 63 9 11 20
SA Need/Prison Treatment - Other% 75.9% 10.8% 13.3% 24.1%Count 3805 619 662 1281
Total General Population% 74.8% 12.2% 13.0% 25.2%
Table 2: Recidivism Rates by Comparison Group.
DOC Licensed Substance Abuse Programs Page 14
In three out of eight institutions, substance abuse treatment lowers newconviction and total recidivism.
NCF and ISP were the only institutionsto show success for both newconviction and total recidivism whencompared to the substance abuseneed/no prison treatment and nosubstance abuse need comparisongroups. North Central CorrectionalFacility (NCCF) also reflectedimprovement relative to newconviction and total recidivism, butonly when compared to the substanceabuse need/no prison treatmentgroup.
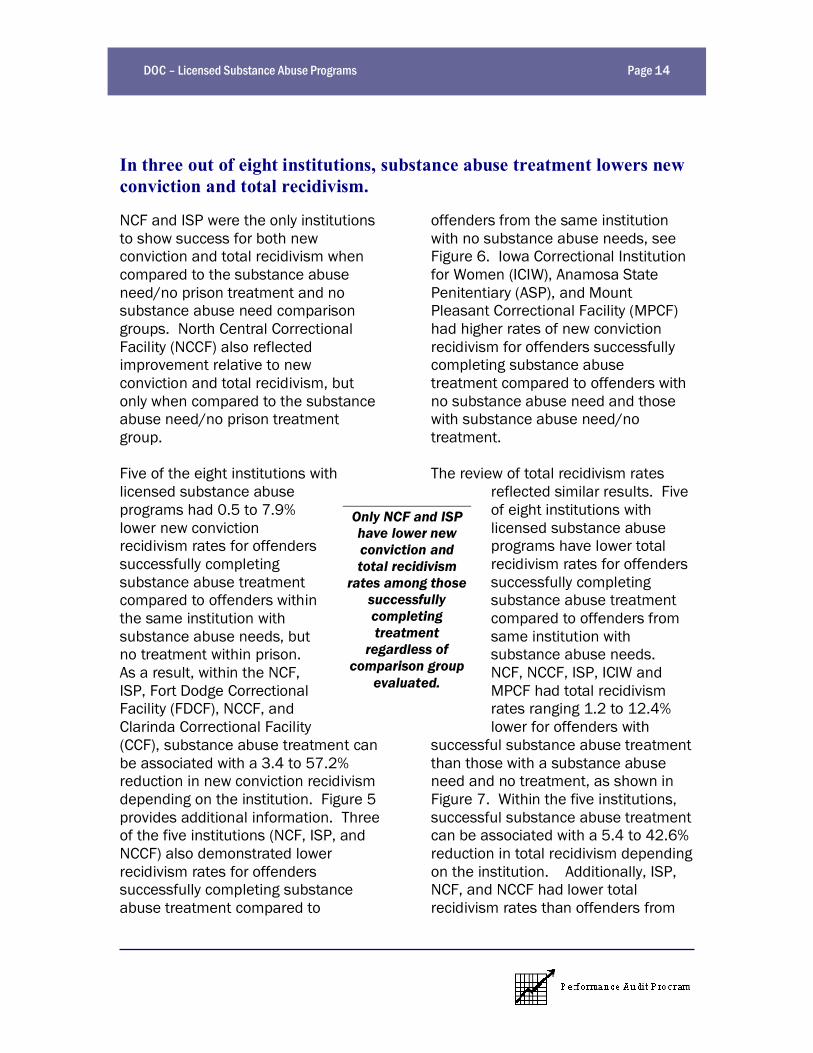
Five of the eight institutions withlicensed substance abuseprograms had 0.5 to 7.9%lower new convictionrecidivism rates for offenderssuccessfully completingsubstance abuse treatmentcompared to offenders withinthe same institution withsubstance abuse needs, butno treatment within prison.As a result, within the NCF,ISP, Fort Dodge CorrectionalFacility (FDCF), NCCF, andClarinda Correctional Facility(CCF), substance abuse treatment canbe associated with a 3.4 to 57.2%reduction in new conviction recidivismdepending on the institution. Figure 5provides additional information. Threeof the five institutions (NCF, ISP, andNCCF) also demonstrated lowerrecidivism rates for offenderssuccessfully completing substanceabuse treatment compared to
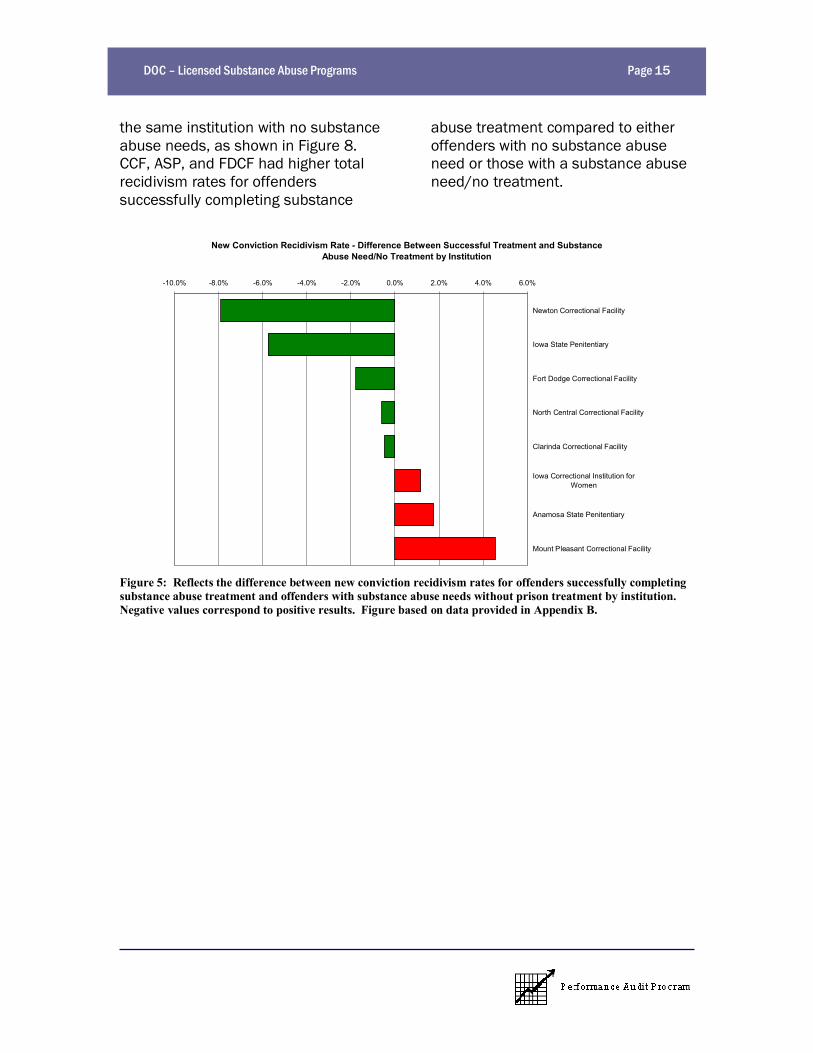
offenders from the same institutionwith no substance abuse needs, seeFigure 6. Iowa Correctional Institutionfor Women (ICIW), Anamosa StatePenitentiary (ASP), and MountPleasant Correctional Facility (MPCF)had higher rates of new convictionrecidivism for offenders successfullycompleting substance abusetreatment compared to offenders withno substance abuse need and thosewith substance abuse need/notreatment.
The review of total recidivism ratesreflected similar results. Fiveof eight institutions withlicensed substance abuseprograms have lower totalrecidivism rates for offenderssuccessfully completingsubstance abuse treatmentcompared to offenders fromsame institution withsubstance abuse needs.NCF, NCCF, ISP, ICIW andMPCF had total recidivismrates ranging 1.2 to 12.4%lower for offenders with
successful substance abuse treatmentthan those with a substance abuseneed and no treatment, as shown inFigure 7. Within the five institutions,successful substance abuse treatmentcan be associated with a 5.4 to 42.6%reduction in total recidivism dependingon the institution. Additionally, ISP,NCF, and NCCF had lower totalrecidivism rates than offenders from
Only NCF and ISPhave lower newconviction andtotal recidivism
rates among thosesuccessfullycompletingtreatment
regardless ofcomparison group
evaluated.
DOC Licensed Substance Abuse Programs Page 15
the same institution with no substanceabuse needs, as shown in Figure 8.CCF, ASP, and FDCF had higher totalrecidivism rates for offenderssuccessfully completing substance
abuse treatment compared to eitheroffenders with no substance abuseneed or those with a substance abuseneed/no treatment.
New Conviction Recidivism Rate - Difference Between Successful Treatment and SubstanceAbuse Need/No Treatment by Institution
-10.0% -8.0% -6.0% -4.0% -2.0% 0.0% 2.0% 4.0% 6.0%
Newton Correctional Facility
Iowa State Penitentiary
Fort Dodge Correctional Facility
North Central Correctional Facility
Clarinda Correctional Facility
Iowa Correctional Institution forWomen
Anamosa State Penitentiary
Mount Pleasant Correctional Facility
Figure 5: Reflects the difference between new conviction recidivism rates for offenders successfully completingsubstance abuse treatment and offenders with substance abuse needs without prison treatment by institution.Negative values correspond to positive results. Figure based on data provided in Appendix B.
DOC Licensed Substance Abuse Programs Page 16
New Conviction Recidivism Rate - Difference Between Successful Treatment and NoSubstance Abuse Need by Institution
-10.0% -8.0% -6.0% -4.0% -2.0% 0.0% 2.0% 4.0% 6.0% 8.0%
Newton Correctional Facility
Iowa State Penitentiary
Fort Dodge Correctional Facility
Clarinda Correctional Facility
Iowa Correctional Institution forWomen
North Central Correctional Facility
Mount Pleasant Correctional Facility
Anamosa State Penitentiary
Figure 6: Reflects the difference between new conviction recidivism rates for offenders successfully completingsubstance abuse treatment and offenders with no substance abuse need by institution. Negative valuescorrespond to positive results. Figure based on data provided in Appendix B.
Total Recidivism Rate - Difference Between Successful Treatment and Substance AbuseNeed/No Treatment by Institution
-15.0% -10.0% -5.0% 0.0% 5.0% 10.0% 15.0%
Newton Correctional Facility
North Central Correctional Facility
Iowa State Penitentiary
Iowa Correctional Institution forWomen
Mount Pleasant Correctional Facility
Clarinda Correctional Facility
Anamosa State Penitentiary
Fort Dodge Correctional Facility
Figure 7: Reflects the difference between total recidivism rates for offenders successfully completing substanceabuse treatment and offenders with substance abuse needs and no prison substance abuse treatment byinstitution. Negative values correspond to positive results. Figure based on data provided in Appendix B.
DOC Licensed Substance Abuse Programs Page 17
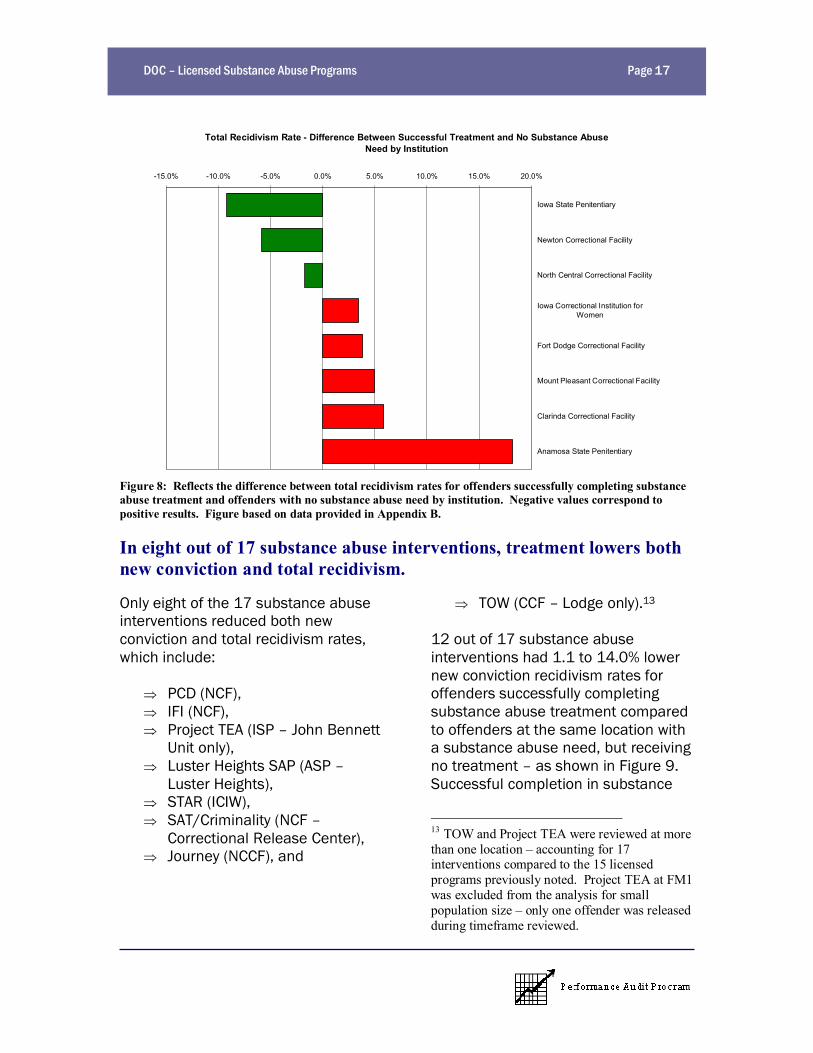
Total Recidivism Rate - Difference Between Successful Treatment and No Substance AbuseNeed by Institution
-15.0% -10.0% -5.0% 0.0% 5.0% 10.0% 15.0% 20.0%
Iowa State Penitentiary
Newton Correctional Facility
North Central Correctional Facility
Iowa Correctional Institution forWomen
Fort Dodge Correctional Facility
Mount Pleasant Correctional Facility
Clarinda Correctional Facility
Anamosa State Penitentiary
Figure 8: Reflects the difference between total recidivism rates for offenders successfully completing substanceabuse treatment and offenders with no substance abuse need by institution. Negative values correspond topositive results. Figure based on data provided in Appendix B.
In eight out of 17 substance abuse interventions, treatment lowers bothnew conviction and total recidivism.
Only eight of the 17 substance abuseinterventions reduced both newconviction and total recidivism rates,which include:
Þ PCD (NCF),Þ IFI (NCF),Þ Project TEA (ISP John Bennett
Unit only),Þ Luster Heights SAP (ASP
Luster Heights),Þ STAR (ICIW),Þ SAT/Criminality (NCF
Correctional Release Center),Þ Journey (NCCF), and
Þ TOW (CCF Lodge only).13
12 out of 17 substance abuseinterventions had 1.1 to 14.0% lowernew conviction recidivism rates foroffenders successfully completingsubstance abuse treatment comparedto offenders at the same location witha substance abuse need, but receivingno treatment as shown in Figure 9.Successful completion in substance
13 TOW and Project TEA were reviewed at morethan one location accounting for 17interventions compared to the 15 licensedprograms previously noted. Project TEA at FM1was excluded from the analysis for smallpopulation size only one offender was releasedduring timeframe reviewed.
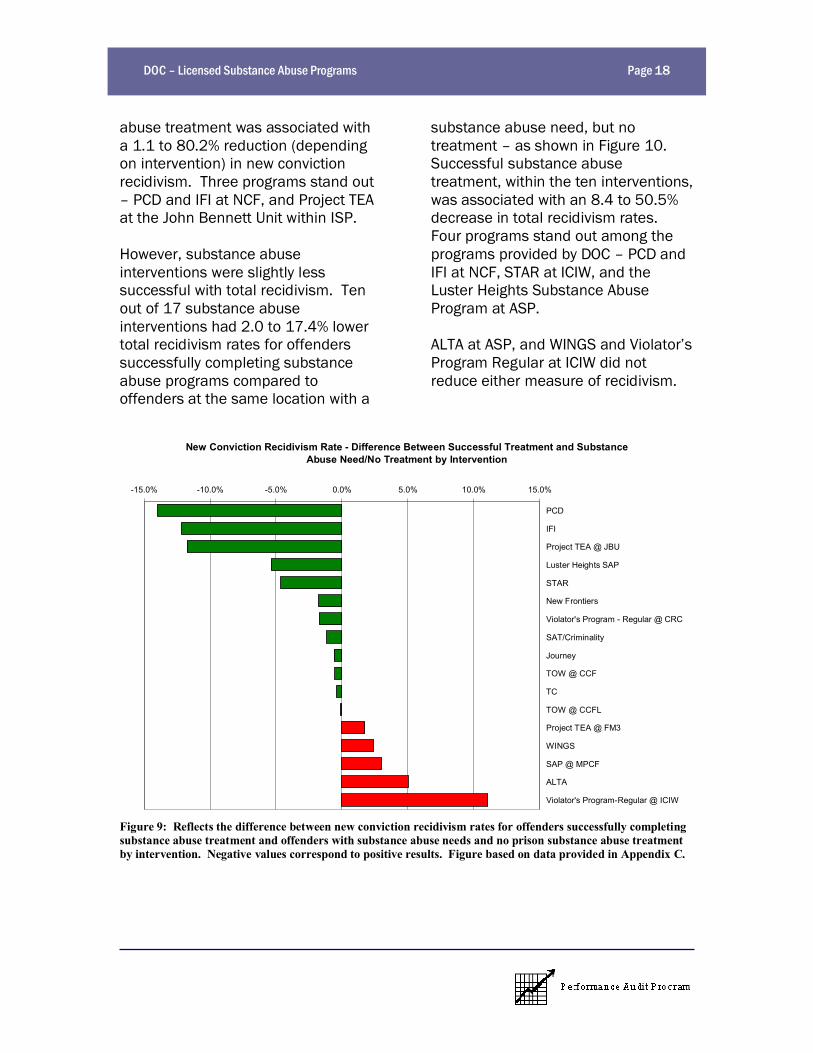
DOC Licensed Substance Abuse Programs Page 18
abuse treatment was associated witha 1.1 to 80.2% reduction (dependingon intervention) in new convictionrecidivism. Three programs stand out
PCD and IFI at NCF, and Project TEAat the John Bennett Unit within ISP.
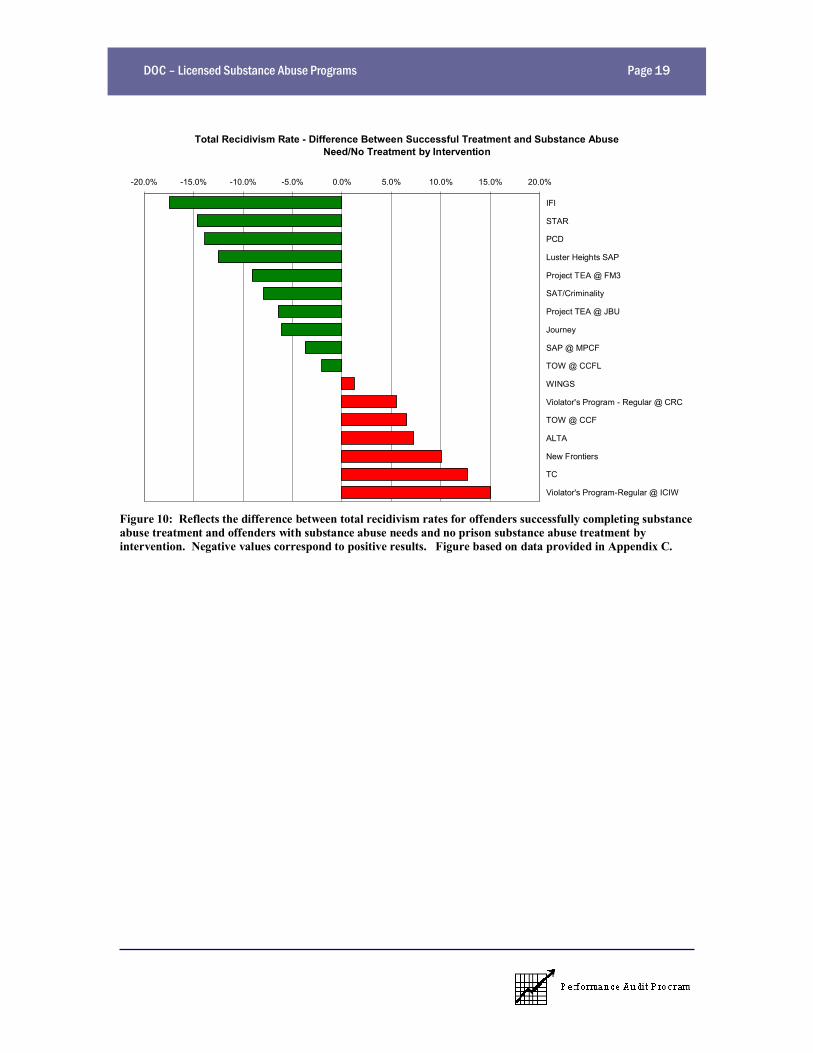
However, substance abuseinterventions were slightly lesssuccessful with total recidivism. Tenout of 17 substance abuseinterventions had 2.0 to 17.4% lowertotal recidivism rates for offenderssuccessfully completing substanceabuse programs compared tooffenders at the same location with a
substance abuse need, but notreatment as shown in Figure 10.Successful substance abusetreatment, within the ten interventions,was associated with an 8.4 to 50.5%decrease in total recidivism rates.Four programs stand out among theprograms provided by DOC PCD andIFI at NCF, STAR at ICIW, and theLuster Heights Substance AbuseProgram at ASP.
ALTA at ASP, and WINGS and Violator sProgram Regular at ICIW did notreduce either measure of recidivism.
New Conviction Recidivism Rate - Difference Between Successful Treatment and SubstanceAbuse Need/No Treatment by Intervention
-15.0% -10.0% -5.0% 0.0% 5.0% 10.0% 15.0%
PCD
IFI
Project TEA @ JBU
Luster Heights SAP
STAR
New Frontiers
Violator's Program - Regular @ CRC
SAT/Criminality
Journey
TOW @ CCF
TC
TOW @ CCFL
Project TEA @ FM3
WINGS
SAP @ MPCF
ALTA
Violator's Program-Regular @ ICIW
Figure 9: Reflects the difference between new conviction recidivism rates for offenders successfully completingsubstance abuse treatment and offenders with substance abuse needs and no prison substance abuse treatmentby intervention. Negative values correspond to positive results. Figure based on data provided in Appendix C.
DOC Licensed Substance Abuse Programs Page 19
Total Recidivism Rate - Difference Between Successful Treatment and Substance AbuseNeed/No Treatment by Intervention
-20.0% -15.0% -10.0% -5.0% 0.0% 5.0% 10.0% 15.0% 20.0%
IFI
STAR
PCD
Luster Heights SAP
Project TEA @ FM3
SAT/Criminality
Project TEA @ JBU
Journey
SAP @ MPCF
TOW @ CCFL
WINGS
Violator's Program - Regular @ CRC
TOW @ CCF
ALTA
New Frontiers
TC
Violator's Program-Regular @ ICIW
Figure 10: Reflects the difference between total recidivism rates for offenders successfully completing substanceabuse treatment and offenders with substance abuse needs and no prison substance abuse treatment byintervention. Negative values correspond to positive results. Figure based on data provided in Appendix C.
DOC Licensed Substance Abuse Programs Page 20
What are the consequences of the programs results?There are a number of consequences associated with recidivism reductions, such as:
Þ Reductions in the incarcerated offender population or at least a reduction in theprojected growth which is stressing the existing prison infrastructure;
Þ Cost savings associated with keeping offenders out of the prison system and/orcorrectional system; and
Þ Societal benefits from reduced crime.
Key findings:
Þ The substance abuse programs overall did very little to curb the growing prisonpopulation during the14-month review period.
Þ Cost savings is not produced Department-wide, but institutions like NCF highlightpotential with over $134,000 in saved operational costs one year following offenderrelease.
Þ Across the department, substance abuse treatment prevented less than five newoffenses from occurring during the 14 month review period.
Overall, substance abuse programs did not curb the growing prisonpopulation.
The offender population in prison isexpected to increase by over 31% inthe next ten years, causing inmatecapacity to be exceeded by 72% forfemales and 52% for males (Stageberg3). Readmissions to prison are one ofthe factors influencing prison growth.The 2,086 readmissions occurred instate fiscal year 2006 and areexpected to increase 20.8% over thenext ten years (Stageberg 9). Thereadmission growth makes treatmentinterventions a key area of focus not
only for recidivism, but as a strategy tohelp curb the prison inmate populationgrowth. Unfortunately, because thetotal recidivism rate was not loweredthrough DOC s substance abuseprograms (SA need/no treatment totalrecidivism rate was 25.1% comparedto 26.6% for those successfullycompleting treatment see table 2) prison population growth shouldcontinue to grow at the same rateprojected.
Cost savings was not produced Department-wide, but institutionshighlight potential savings.It costs $23,367 annually to house anoffender in prison, and preventing oneoffender from returning to prison fromparole or work release saves roughly$5,400 in incarceration costs (DOCQuick Facts 1; Prell Population
Growth 13).14 Although there wascost savings of over $8 millionassociated with offenders releasedduring the timeframe reviewed who
14 Annual costs estimated by taking the averagedaily cost and multiplying it by 365.
DOC Licensed Substance Abuse Programs Page 21
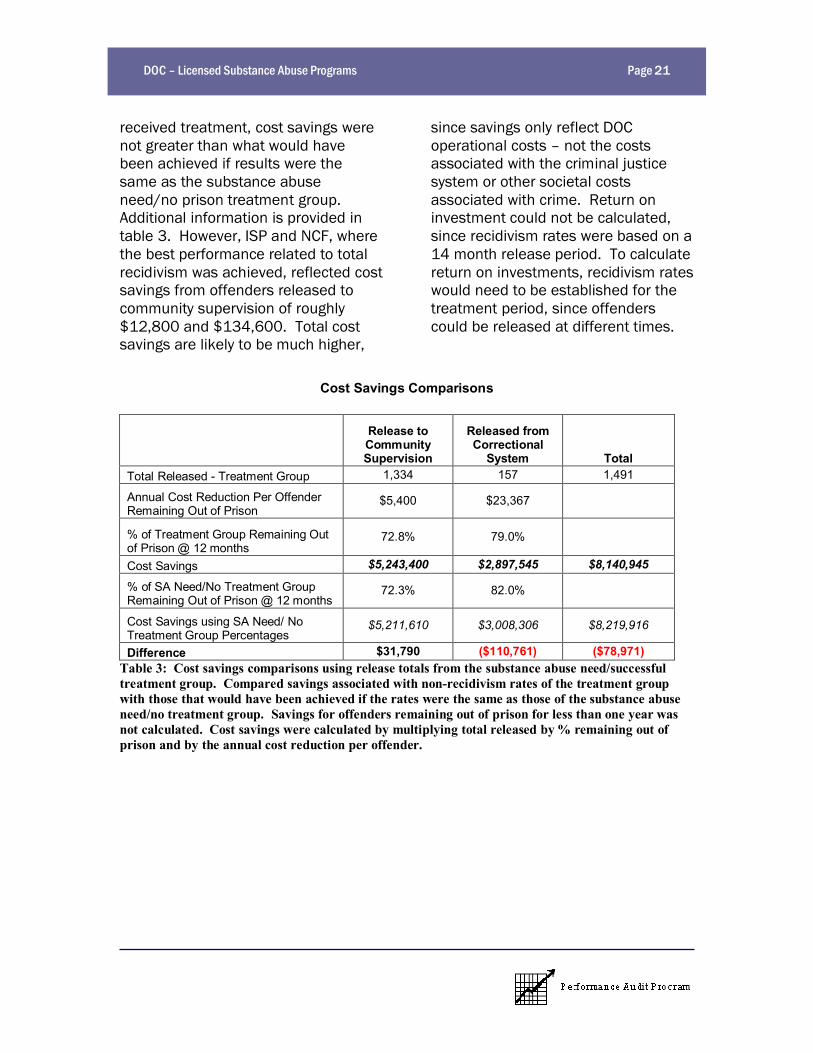
received treatment, cost savings werenot greater than what would havebeen achieved if results were thesame as the substance abuseneed/no prison treatment group.Additional information is provided intable 3. However, ISP and NCF, wherethe best performance related to totalrecidivism was achieved, reflected costsavings from offenders released tocommunity supervision of roughly$12,800 and $134,600. Total costsavings are likely to be much higher,
since savings only reflect DOCoperational costs not the costsassociated with the criminal justicesystem or other societal costsassociated with crime. Return oninvestment could not be calculated,since recidivism rates were based on a14 month release period. To calculatereturn on investments, recidivism rateswould need to be established for thetreatment period, since offenderscould be released at different times.
Cost Savings Comparisons
Release toCommunitySupervision
Released fromCorrectional
System TotalTotal Released - Treatment Group 1,334 157 1,491
Annual Cost Reduction Per OffenderRemaining Out of Prison
$5,400 $23,367
% of Treatment Group Remaining Outof Prison @ 12 months
72.8% 79.0%
Cost Savings $5,243,400 $2,897,545 $8,140,945
% of SA Need/No Treatment GroupRemaining Out of Prison @ 12 months
72.3% 82.0%
Cost Savings using SA Need/ NoTreatment Group Percentages
$5,211,610 $3,008,306 $8,219,916
Difference $31,790 ($110,761) ($78,971)Table 3: Cost savings comparisons using release totals from the substance abuse need/successfultreatment group. Compared savings associated with non-recidivism rates of the treatment groupwith those that would have been achieved if the rates were the same as those of the substance abuseneed/no treatment group. Savings for offenders remaining out of prison for less than one year wasnot calculated. Cost savings were calculated by multiplying total released by % remaining out ofprison and by the annual cost reduction per offender.
DOC Licensed Substance Abuse Programs Page 22
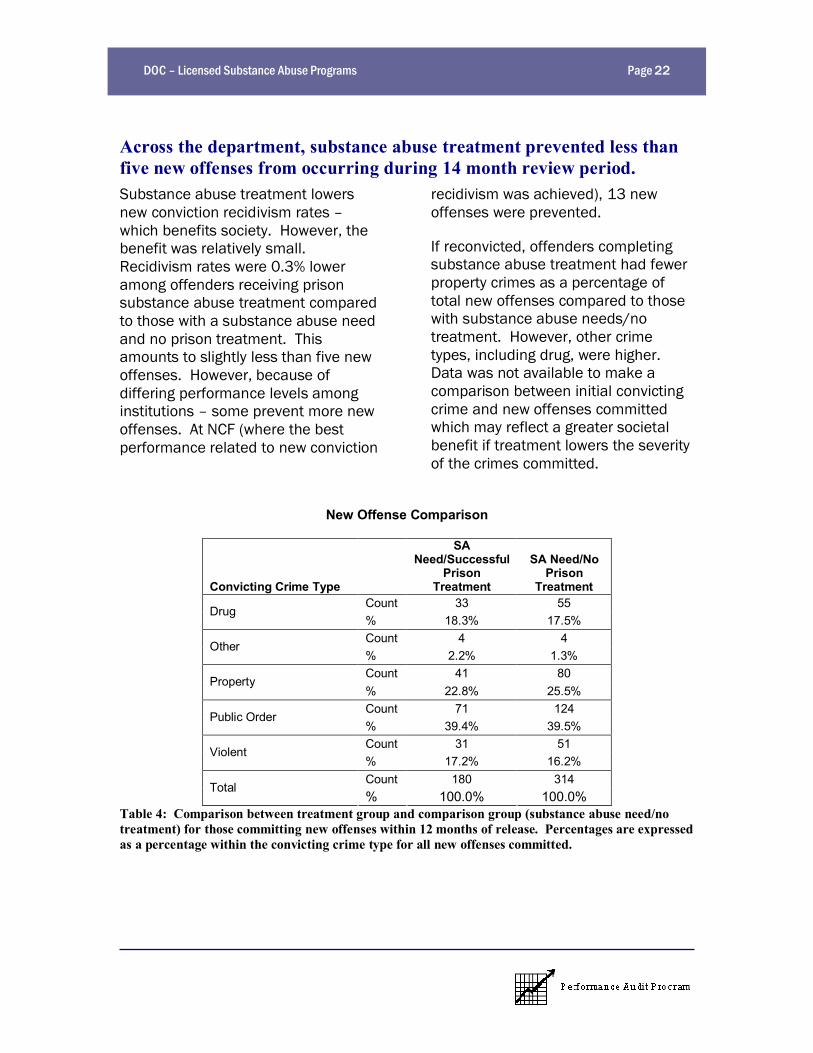
Across the department, substance abuse treatment prevented less thanfive new offenses from occurring during 14 month review period.Substance abuse treatment lowersnew conviction recidivism rates which benefits society. However, thebenefit was relatively small.Recidivism rates were 0.3% loweramong offenders receiving prisonsubstance abuse treatment comparedto those with a substance abuse needand no prison treatment. Thisamounts to slightly less than five newoffenses. However, because ofdiffering performance levels amonginstitutions some prevent more newoffenses. At NCF (where the bestperformance related to new conviction
recidivism was achieved), 13 newoffenses were prevented.
If reconvicted, offenders completingsubstance abuse treatment had fewerproperty crimes as a percentage oftotal new offenses compared to thosewith substance abuse needs/notreatment. However, other crimetypes, including drug, were higher.Data was not available to make acomparison between initial convictingcrime and new offenses committedwhich may reflect a greater societalbenefit if treatment lowers the severityof the crimes committed.
New Offense Comparison
Convicting Crime Type
SANeed/Successful
PrisonTreatment
SA Need/NoPrison
TreatmentCount 33 55
Drug% 18.3% 17.5%Count 4 4
Other% 2.2% 1.3%Count 41 80
Property% 22.8% 25.5%Count 71 124
Public Order% 39.4% 39.5%Count 31 51
Violent% 17.2% 16.2%Count 180 314
Total% 100.0% 100.0%
Table 4: Comparison between treatment group and comparison group (substance abuse need/notreatment) for those committing new offenses within 12 months of release. Percentages are expressedas a percentage within the convicting crime type for all new offenses committed.
DOC Licensed Substance Abuse Programs Page 23
What issues significantly influence program results?Evaluating program effectiveness using outcomes is complicated. When changes tooutcomes occur, programs are often unable to explain why. The cumulative effect ofnumerous events or situations influence results (in this case recidivism results) makeit challenging to understand what is truly causing observed changes. Many times,changes simply cannot be attributed or attached to one particular cause, or theprogram s contribution is relatively small in comparison to other factors and makes itdifficult to see how operational or strategic changes are impacting results, see figure11.
Key findings:Þ Both new conviction and total recidivism rates were higher among offenders with mental
health diagnosis highlighting the challenge to effectively treat individuals with multipleneeds.
Þ Treatment should be made as close to an offender s release date, so new skills areretained before offenders face high risk situations questionable data made thisvariable difficult to evaluate.
Þ Offenders with higher risks had higher recidivism rates.Þ Additional support in the community whether it is through supervision or continuing
substance abuse treatment lowers new conviction recidivism.Þ Older offenders were less likely to be reconvicted for new offenses, and incur technical
violations.Þ African Americans had higher new and total recidivism rates than Caucasians and other
minority groups highlighting socioeconomic conditions/issues within communitiesAfrican American offenders come from and return to.
Þ DOC has yet to fully identify where evidence-based practices are being successfullyimplemented.
Þ DOC does not consistently measure addiction severity, and responsivity factors reducingconfidence that treatment approaches are best suited for individual offendercharacteristics.
Þ 22.8% of offenders treated by the substance abuse program were classified in low tolow/moderate risk category whereas over 1,800 offenders with substance abuseneeds and classified with moderate to high risks, and received no treatment while inprison. 500 of the higher risk individuals were released due to the end of their sentenceleaving no other opportunity to provide treatment while in the correctional system.
Þ Consistent system-level measures are needed to enhance DOC s ability to manage forresults, and enable program comparisons.
Þ More frequent recognition of quality work and ensuring adequate resources areavailable could enhance employee engagement.
DOC Licensed Substance Abuse Programs Page 24
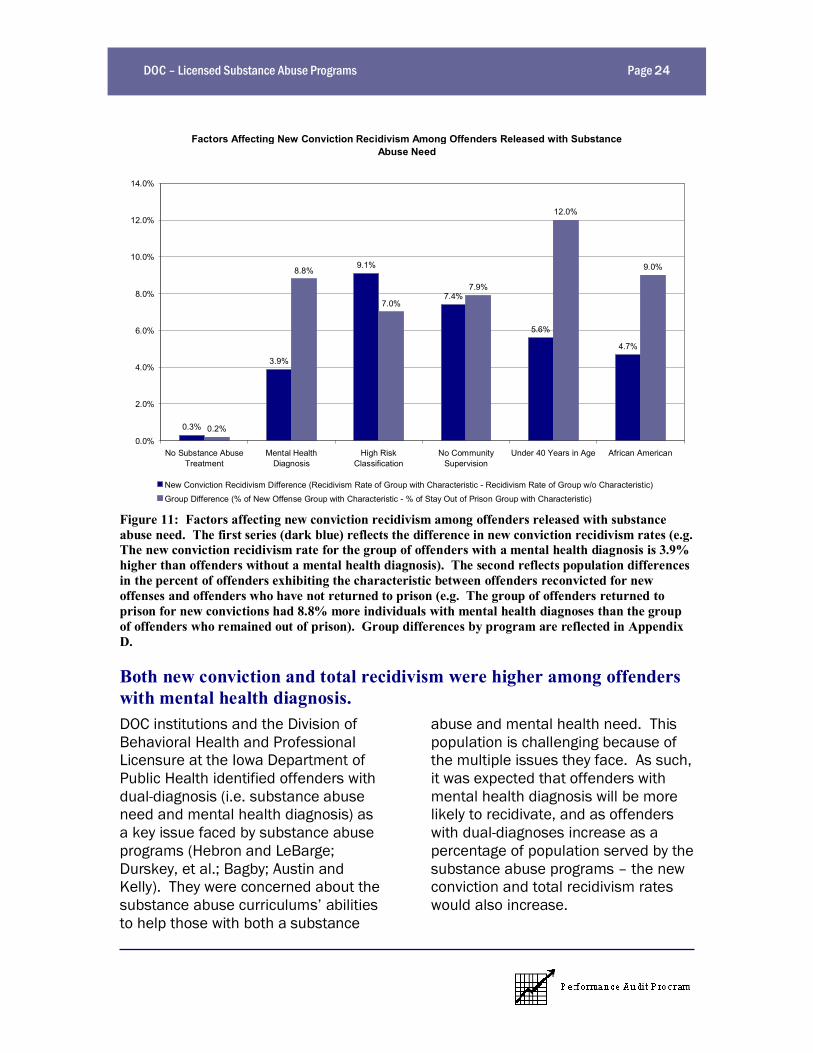
Factors Affecting New Conviction Recidivism Among Offenders Released with SubstanceAbuse Need
0.3%
3.9%
9.1%
7.4%
5.6%
4.7%
0.2%
8.8%
7.0%
7.9%
12.0%
9.0%
0.0%
2.0%
4.0%
6.0%
8.0%
10.0%
12.0%
14.0%
No Substance AbuseTreatment
Mental HealthDiagnosis
High RiskClassification
No CommunitySupervision
Under 40 Years in Age African American
New Conviction Recidivism Difference (Recidivism Rate of Group with Characteristic - Recidivism Rate of Group w/o Characteristic)
Group Difference (% of New Offense Group with Characteristic - % of Stay Out of Prison Group with Characteristic)
Figure 11: Factors affecting new conviction recidivism among offenders released with substanceabuse need. The first series (dark blue) reflects the difference in new conviction recidivism rates (e.g.The new conviction recidivism rate for the group of offenders with a mental health diagnosis is 3.9%higher than offenders without a mental health diagnosis). The second reflects population differencesin the percent of offenders exhibiting the characteristic between offenders reconvicted for newoffenses and offenders who have not returned to prison (e.g. The group of offenders returned toprison for new convictions had 8.8% more individuals with mental health diagnoses than the groupof offenders who remained out of prison). Group differences by program are reflected in AppendixD.
Both new conviction and total recidivism were higher among offenderswith mental health diagnosis.DOC institutions and the Division ofBehavioral Health and ProfessionalLicensure at the Iowa Department ofPublic Health identified offenders withdual-diagnosis (i.e. substance abuseneed and mental health diagnosis) asa key issue faced by substance abuseprograms (Hebron and LeBarge;Durskey, et al.; Bagby; Austin andKelly). They were concerned about thesubstance abuse curriculums abilitiesto help those with both a substance
abuse and mental health need. Thispopulation is challenging because ofthe multiple issues they face. As such,it was expected that offenders withmental health diagnosis will be morelikely to recidivate, and as offenderswith dual-diagnoses increase as apercentage of population served by thesubstance abuse programs the newconviction and total recidivism rateswould also increase.
DOC Licensed Substance Abuse Programs Page 25
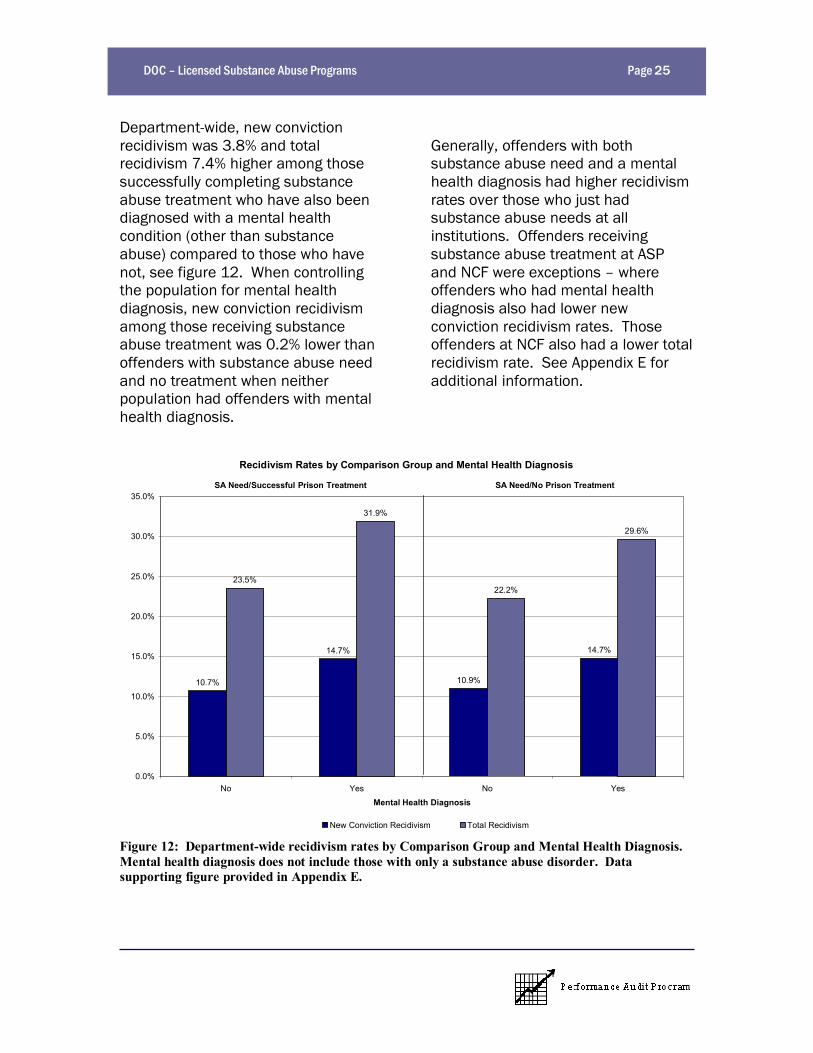
Department-wide, new convictionrecidivism was 3.8% and totalrecidivism 7.4% higher among thosesuccessfully completing substanceabuse treatment who have also beendiagnosed with a mental healthcondition (other than substanceabuse) compared to those who havenot, see figure 12. When controllingthe population for mental healthdiagnosis, new conviction recidivismamong those receiving substanceabuse treatment was 0.2% lower thanoffenders with substance abuse needand no treatment when neitherpopulation had offenders with mentalhealth diagnosis.
Generally, offenders with bothsubstance abuse need and a mentalhealth diagnosis had higher recidivismrates over those who just hadsubstance abuse needs at allinstitutions. Offenders receivingsubstance abuse treatment at ASPand NCF were exceptions whereoffenders who had mental healthdiagnosis also had lower newconviction recidivism rates. Thoseoffenders at NCF also had a lower totalrecidivism rate. See Appendix E foradditional information.
Recidivism Rates by Comparison Group and Mental Health Diagnosis
10.7%
14.7%
10.9%
14.7%
23.5%
31.9%
22.2%
29.6%
0.0%
5.0%
10.0%
15.0%
20.0%
25.0%
30.0%
35.0%
No Yes No Yes
Mental Health Diagnosis
New Conviction Recidivism Total Recidivism
SA Need/Successful Prison Treatment SA Need/No Prison Treatment
Figure 12: Department-wide recidivism rates by Comparison Group and Mental Health Diagnosis.Mental health diagnosis does not include those with only a substance abuse disorder. Datasupporting figure provided in Appendix E.

DOC Licensed Substance Abuse Programs Page 26
The amount of time between the conclusion of treatment and releasemay influence recidivism, but data reliability made this difficult toevaluate.DOC attempts to time treatment withan offender s target release date tohelp improve offender outcomesfollowing release. The length of timebetween when an offender receivessubstance abuse treatment and whenthey are released from prison isbelieved to effect recidivism. Thelonger the length of time; the harder itbecomes to retain the skills acquiredduring treatment. This lessens theoffender s ability to apply the newskills in the community environmentwhere they encounter high risksituations that could lead to substanceabuse relapse and criminal behavior.However, the reliability of treatmentend date was questionable impairingthe audit s ability to examine itsrelationship to recidivism. Two issues
indicated questionable treatment enddate data:
Þ A small percentage of offendershad treatment end dates that weremore recent than their releasedate; and
Þ The Violator Programs at both CRCand ICIW reflected more than 80%of their treatment populationcompleting treatment more than ayear prior to release.
The offenders in the violator programsare released once they havesuccessfully completed treatment,therefore these programs should havea very small percentage if any inprison so long after treatment.
High risk offenders had higher recidivism rates.Dynamic risk factors, includingcriminogenic needs, serve as predictorof adult offender recidivism15. Asnoted by Gendreu et al.,LSI-R, the instrument usedby DOC, producescorrelations withrecidivism 62 75% oftime, and is better thanother actuarial measuresavailable (590).Lowenkamp and Betchelalso noted that LSI-R use
15 Dynamic risk factors include: antisocialpersonality, attitudes and behavior, interpersonalconflict, personal distress, social achievement,and recent drug/alcohol abuse.
in Iowa was significantly related topredicting future criminal activity (30).Offenders with higher risks are more
likely to recidivate than those atlower risk levels, and populationswith higher percentage ofoffenders within the high riskcategory is believed to havehigher recidivism rates. Figures13 and 14, show the recidivismrates progressively increase asthe risk level of the offenderpopulation increases.
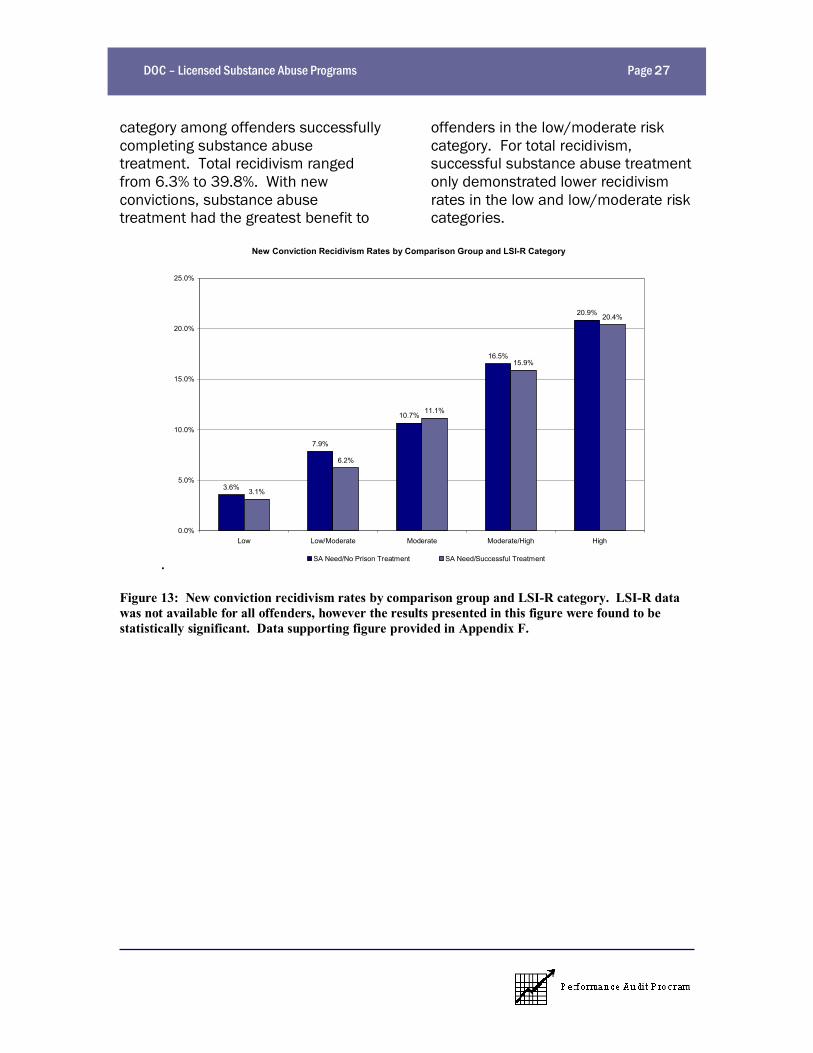
Department-wide new convictionsrecidivism rates ranged from 3.1% ofthose within the low risk category to20.4% of those in the high risk
New convictionrecidivism rates
are 17.3% higherfor offenders
classified high riskcompared to
offenders in lowrisk category.
DOC Licensed Substance Abuse Programs Page 27
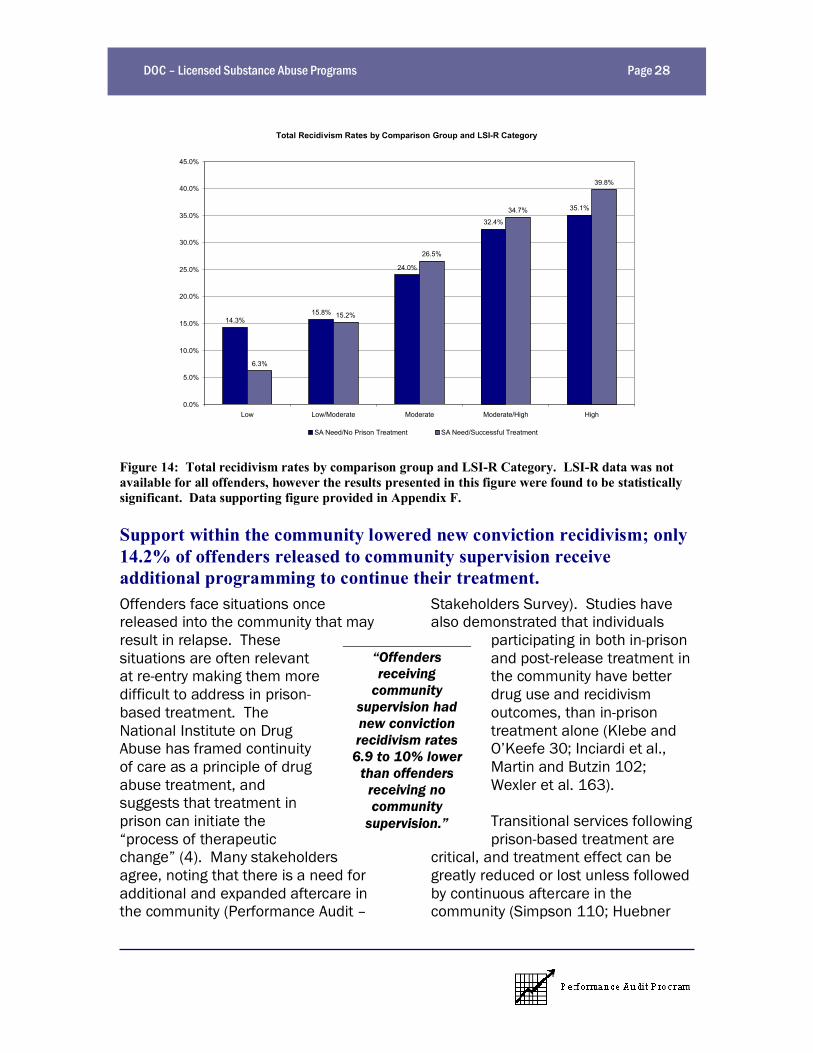
category among offenders successfullycompleting substance abusetreatment. Total recidivism rangedfrom 6.3% to 39.8%. With newconvictions, substance abusetreatment had the greatest benefit to
offenders in the low/moderate riskcategory. For total recidivism,successful substance abuse treatmentonly demonstrated lower recidivismrates in the low and low/moderate riskcategories.
.
New Conviction Recidivism Rates by Comparison Group and LSI-R Category
3.6%
7.9%
10.7%
16.5%
20.9%
3.1%
6.2%
11.1%
15.9%
20.4%
0.0%
5.0%
10.0%
15.0%
20.0%
25.0%
Low Low/Moderate Moderate Moderate/High High
SA Need/No Prison Treatment SA Need/Successful Treatment
Figure 13: New conviction recidivism rates by comparison group and LSI-R category. LSI-R datawas not available for all offenders, however the results presented in this figure were found to bestatistically significant. Data supporting figure provided in Appendix F.
DOC Licensed Substance Abuse Programs Page 28
Total Recidivism Rates by Comparison Group and LSI-R Category
14.3%15.8%
24.0%
32.4%
35.1%
6.3%
15.2%
26.5%
34.7%
39.8%
0.0%
5.0%
10.0%
15.0%
20.0%
25.0%
30.0%
35.0%
40.0%
45.0%
Low Low/Moderate Moderate Moderate/High High
SA Need/No Prison Treatment SA Need/Successful Treatment
Figure 14: Total recidivism rates by comparison group and LSI-R Category. LSI-R data was notavailable for all offenders, however the results presented in this figure were found to be statisticallysignificant. Data supporting figure provided in Appendix F.
Support within the community lowered new conviction recidivism; only14.2% of offenders released to community supervision receiveadditional programming to continue their treatment.Offenders face situations oncereleased into the community that mayresult in relapse. Thesesituations are often relevantat re-entry making them moredifficult to address in prison-based treatment. TheNational Institute on DrugAbuse has framed continuityof care as a principle of drugabuse treatment, andsuggests that treatment inprison can initiate theprocess of therapeutic
change (4). Many stakeholdersagree, noting that there is a need foradditional and expanded aftercare inthe community (Performance Audit
Stakeholders Survey). Studies havealso demonstrated that individuals
participating in both in-prisonand post-release treatment inthe community have betterdrug use and recidivismoutcomes, than in-prisontreatment alone (Klebe andO Keefe 30; Inciardi et al.,Martin and Butzin 102;Wexler et al. 163).
Transitional services followingprison-based treatment are
critical, and treatment effect can begreatly reduced or lost unless followedby continuous aftercare in thecommunity (Simpson 110; Huebner
Offendersreceiving
communitysupervision hadnew convictionrecidivism rates
6.9 to 10% lowerthan offenders
receiving nocommunity
supervision.
DOC Licensed Substance Abuse Programs Page 29
25). Pelissier et al. conclude that firsttwo months after release are crucial,noting that the first priority ofprobation officers and treatmentproviders may need to be onidentifying how to avoid the high-risksituations for drug use and on findingalternative coping mechanisms toresist the temptation to use drugs(332). The Iowa Department of PublicHealth staff agreed that the transitionto the community is full of challengesand changes requiringcomprehensive discharge planning(Austin and Kelly). However,community treatment providers do notalways have comprehensiveknowledge on treatment providedduring incarceration (PerformanceAudit Stakeholders Survey).Impaired communication betweenprison and the community could limitcommunity aftercare s effectivenesswhen available.
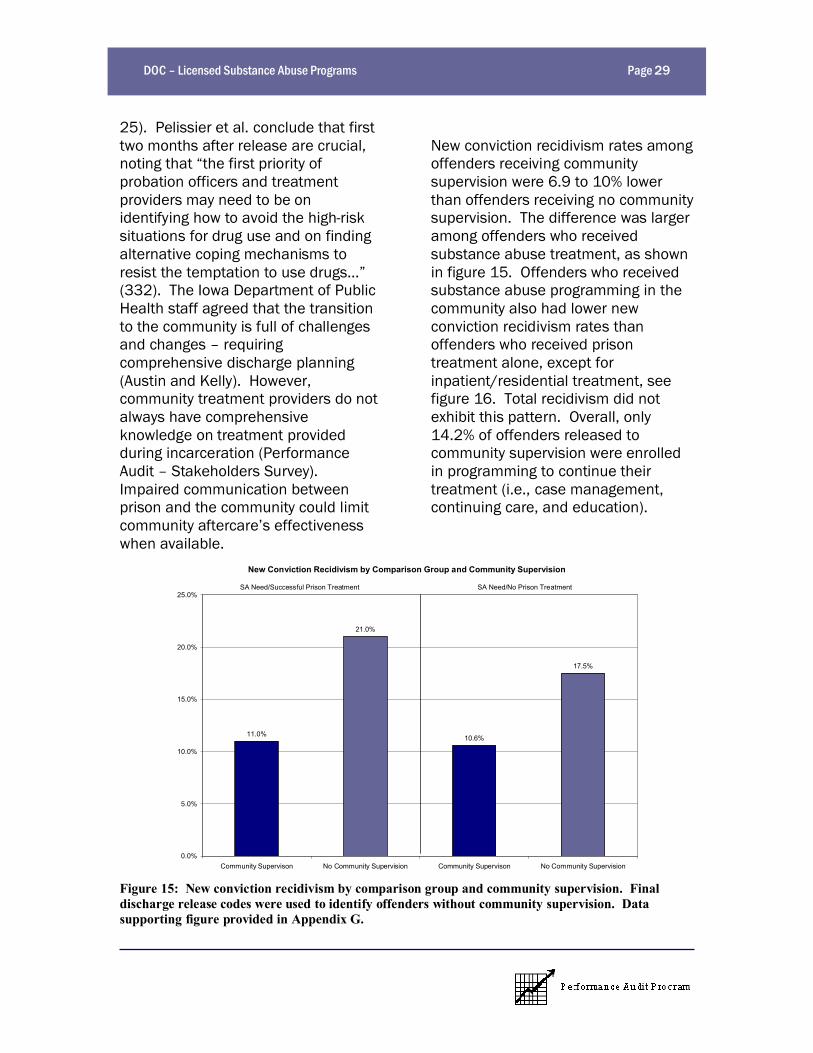
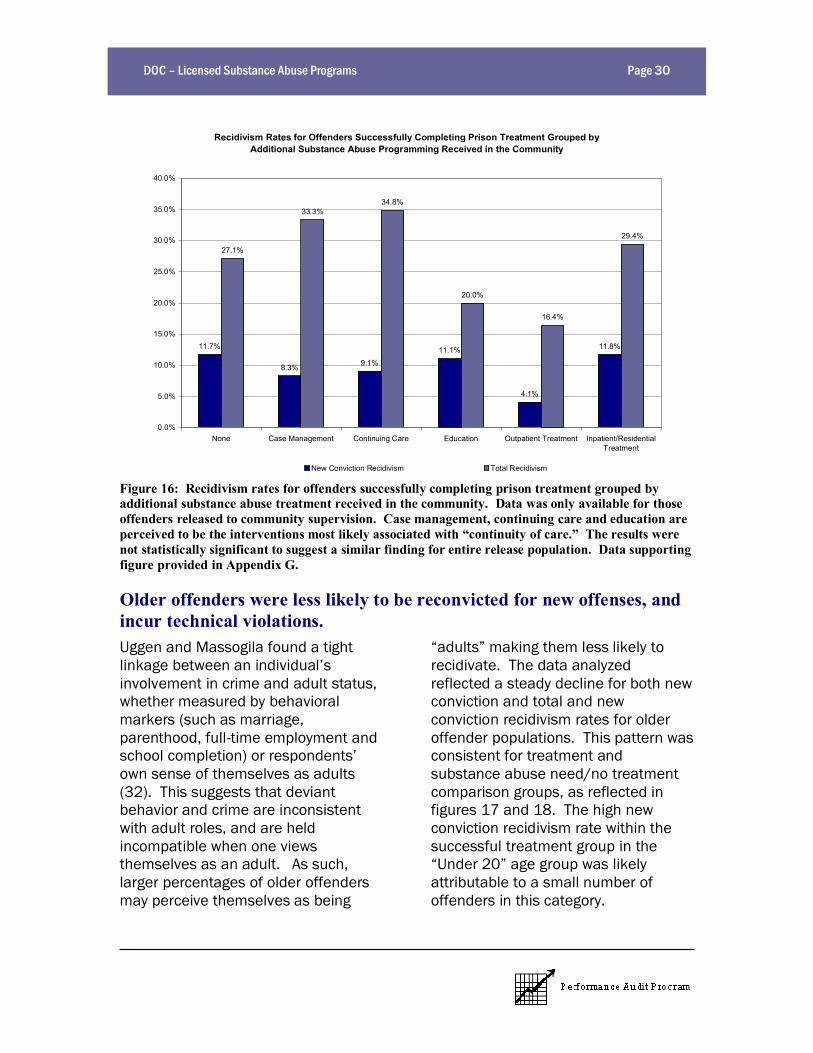
New conviction recidivism rates amongoffenders receiving communitysupervision were 6.9 to 10% lowerthan offenders receiving no communitysupervision. The difference was largeramong offenders who receivedsubstance abuse treatment, as shownin figure 15. Offenders who receivedsubstance abuse programming in thecommunity also had lower newconviction recidivism rates thanoffenders who received prisontreatment alone, except forinpatient/residential treatment, seefigure 16. Total recidivism did notexhibit this pattern. Overall, only14.2% of offenders released tocommunity supervision were enrolledin programming to continue theirtreatment (i.e., case management,continuing care, and education).
New Conviction Recidivism by Comparison Group and Community Supervision
11.0%
21.0%
10.6%
17.5%
0.0%
5.0%
10.0%
15.0%
20.0%
25.0%
Community Supervison No Community Supervision Community Supervison No Community Supervision
SA Need/Successful Prison Treatment SA Need/No Prison Treatment
Figure 15: New conviction recidivism by comparison group and community supervision. Finaldischarge release codes were used to identify offenders without community supervision. Datasupporting figure provided in Appendix G.
DOC Licensed Substance Abuse Programs Page 30
Recidivism Rates for Offenders Successfully Completing Prison Treatment Grouped byAdditional Substance Abuse Programming Received in the Community
11.7%
8.3% 9.1%11.1%
4.1%
11.8%
27.1%
33.3%34.8%
20.0%
16.4%
29.4%
0.0%
5.0%
10.0%
15.0%
20.0%
25.0%
30.0%
35.0%
40.0%
None Case Management Continuing Care Education Outpatient Treatment Inpatient/ResidentialTreatment
New Conviction Recidivism Total Recidivism
Figure 16: Recidivism rates for offenders successfully completing prison treatment grouped byadditional substance abuse treatment received in the community. Data was only available for thoseoffenders released to community supervision. Case management, continuing care and education areperceived to be the interventions most likely associated with continuity of care. The results werenot statistically significant to suggest a similar finding for entire release population. Data supportingfigure provided in Appendix G.
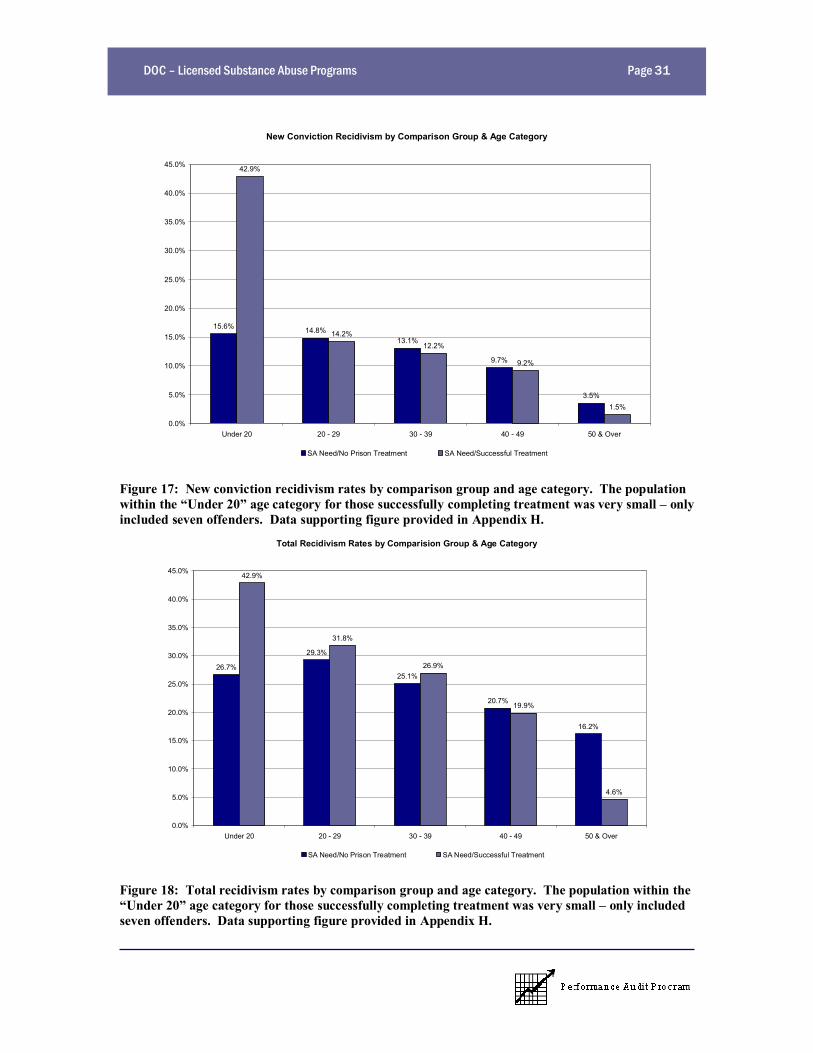
Older offenders were less likely to be reconvicted for new offenses, andincur technical violations.Uggen and Massogila found a tightlinkage between an individual sinvolvement in crime and adult status,whether measured by behavioralmarkers (such as marriage,parenthood, full-time employment andschool completion) or respondentsown sense of themselves as adults(32). This suggests that deviantbehavior and crime are inconsistentwith adult roles, and are heldincompatible when one viewsthemselves as an adult. As such,larger percentages of older offendersmay perceive themselves as being
adults making them less likely torecidivate. The data analyzedreflected a steady decline for both newconviction and total and newconviction recidivism rates for olderoffender populations. This pattern wasconsistent for treatment andsubstance abuse need/no treatmentcomparison groups, as reflected infigures 17 and 18. The high newconviction recidivism rate within thesuccessful treatment group in theUnder 20 age group was likely
attributable to a small number ofoffenders in this category.
DOC Licensed Substance Abuse Programs Page 31
New Conviction Recidivism by Comparison Group & Age Category
15.6% 14.8%13.1%
9.7%
3.5%
42.9%
14.2%12.2%
9.2%
1.5%
0.0%
5.0%
10.0%
15.0%
20.0%
25.0%
30.0%
35.0%
40.0%
45.0%
Under 20 20 - 29 30 - 39 40 - 49 50 & Over
SA Need/No Prison Treatment SA Need/Successful Treatment
Figure 17: New conviction recidivism rates by comparison group and age category. The populationwithin the Under 20 age category for those successfully completing treatment was very small onlyincluded seven offenders. Data supporting figure provided in Appendix H.
Total Recidivism Rates by Comparision Group & Age Category
26.7%
29.3%
25.1%
20.7%
16.2%
42.9%
31.8%
26.9%
19.9%
4.6%
0.0%
5.0%
10.0%
15.0%
20.0%
25.0%
30.0%
35.0%
40.0%
45.0%
Under 20 20 - 29 30 - 39 40 - 49 50 & Over
SA Need/No Prison Treatment SA Need/Successful Treatment
Figure 18: Total recidivism rates by comparison group and age category. The population within theUnder 20 age category for those successfully completing treatment was very small only included
seven offenders. Data supporting figure provided in Appendix H.
DOC Licensed Substance Abuse Programs Page 32
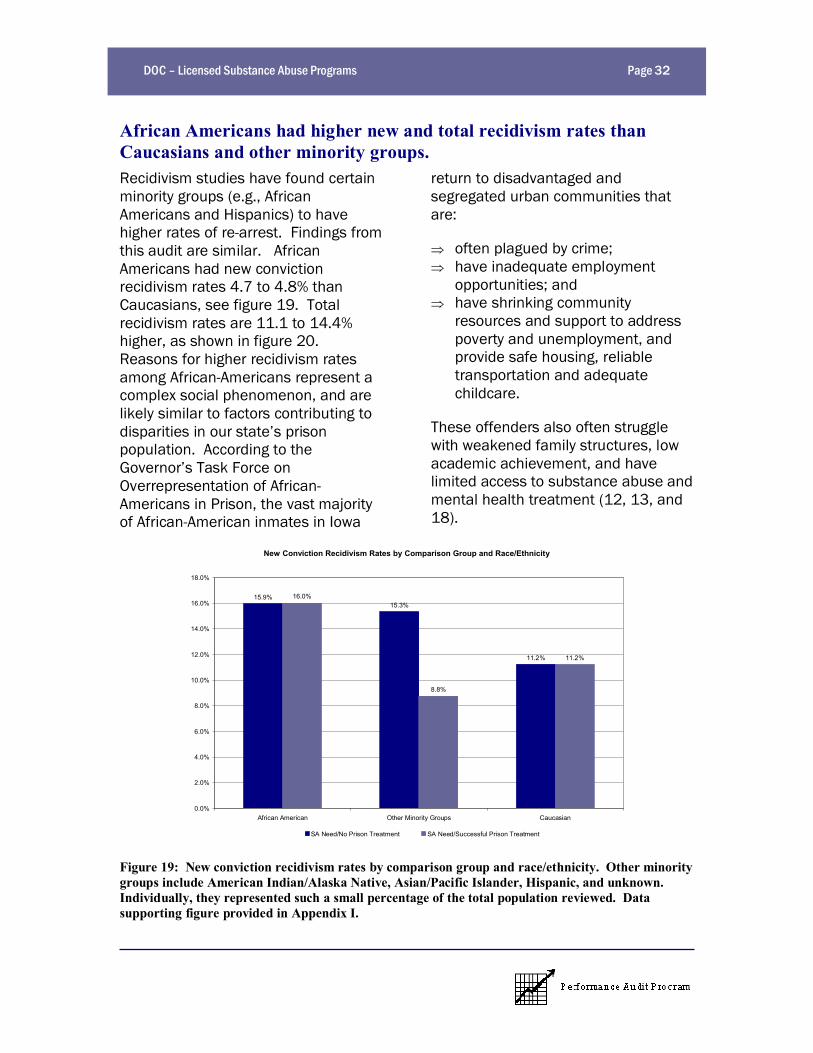
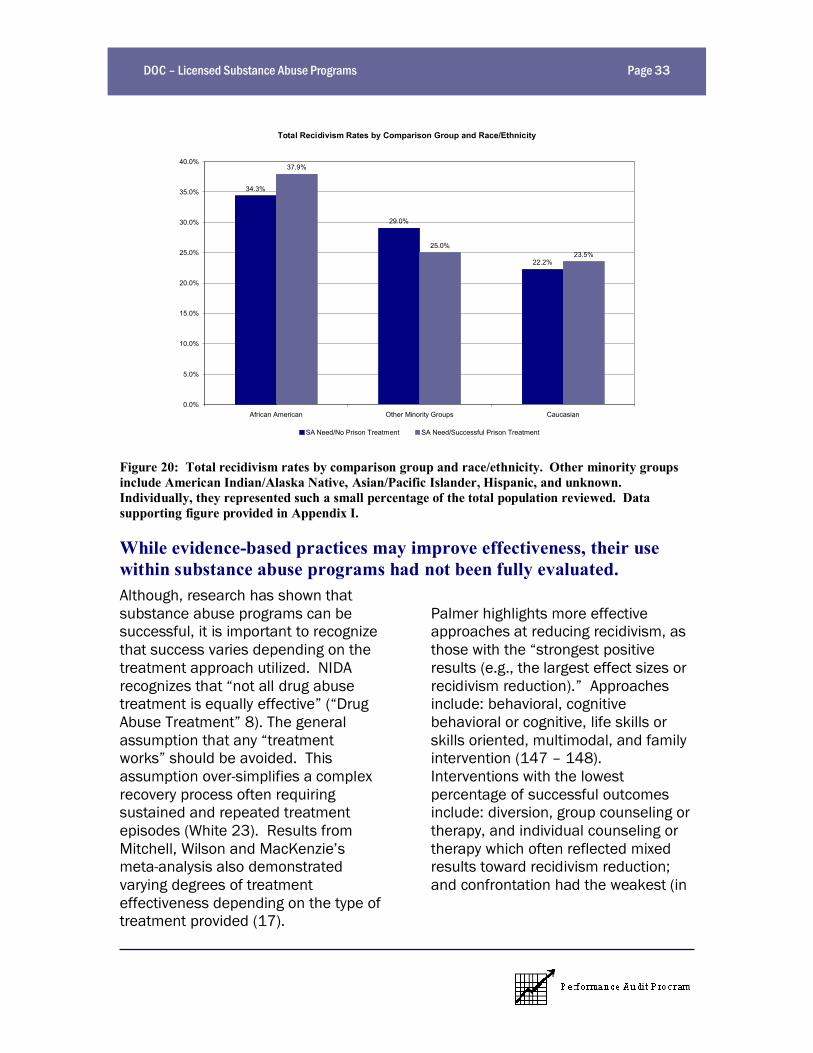
African Americans had higher new and total recidivism rates thanCaucasians and other minority groups.Recidivism studies have found certainminority groups (e.g., AfricanAmericans and Hispanics) to havehigher rates of re-arrest. Findings fromthis audit are similar. AfricanAmericans had new convictionrecidivism rates 4.7 to 4.8% thanCaucasians, see figure 19. Totalrecidivism rates are 11.1 to 14.4%higher, as shown in figure 20.Reasons for higher recidivism ratesamong African-Americans represent acomplex social phenomenon, and arelikely similar to factors contributing todisparities in our state s prisonpopulation. According to theGovernor s Task Force onOverrepresentation of African-Americans in Prison, the vast majorityof African-American inmates in Iowa
return to disadvantaged andsegregated urban communities thatare:
Þ often plagued by crime;Þ have inadequate employment
opportunities; andÞ have shrinking community
resources and support to addresspoverty and unemployment, andprovide safe housing, reliabletransportation and adequatechildcare.
These offenders also often strugglewith weakened family structures, lowacademic achievement, and havelimited access to substance abuse andmental health treatment (12, 13, and18).
New Conviction Recidivism Rates by Comparison Group and Race/Ethnicity
15.9%15.3%
11.2%
16.0%
8.8%
11.2%
0.0%
2.0%
4.0%
6.0%
8.0%
10.0%
12.0%
14.0%
16.0%
18.0%
African American Other Minority Groups Caucasian
SA Need/No Prison Treatment SA Need/Successful Prison Treatment
Figure 19: New conviction recidivism rates by comparison group and race/ethnicity. Other minoritygroups include American Indian/Alaska Native, Asian/Pacific Islander, Hispanic, and unknown.Individually, they represented such a small percentage of the total population reviewed. Datasupporting figure provided in Appendix I.
DOC Licensed Substance Abuse Programs Page 33
Total Recidivism Rates by Comparison Group and Race/Ethnicity
34.3%
29.0%
22.2%
37.9%
25.0%23.5%
0.0%
5.0%
10.0%
15.0%
20.0%
25.0%
30.0%
35.0%
40.0%
African American Other Minority Groups Caucasian
SA Need/No Prison Treatment SA Need/Successful Prison Treatment
Figure 20: Total recidivism rates by comparison group and race/ethnicity. Other minority groupsinclude American Indian/Alaska Native, Asian/Pacific Islander, Hispanic, and unknown.Individually, they represented such a small percentage of the total population reviewed. Datasupporting figure provided in Appendix I.
While evidence-based practices may improve effectiveness, their usewithin substance abuse programs had not been fully evaluated.Although, research has shown thatsubstance abuse programs can besuccessful, it is important to recognizethat success varies depending on thetreatment approach utilized. NIDArecognizes that not all drug abusetreatment is equally effective ( DrugAbuse Treatment 8). The generalassumption that any treatmentworks should be avoided. Thisassumption over-simplifies a complexrecovery process often requiringsustained and repeated treatmentepisodes (White 23). Results fromMitchell, Wilson and MacKenzie smeta-analysis also demonstratedvarying degrees of treatmenteffectiveness depending on the type oftreatment provided (17).
Palmer highlights more effectiveapproaches at reducing recidivism, asthose with the strongest positiveresults (e.g., the largest effect sizes orrecidivism reduction). Approachesinclude: behavioral, cognitivebehavioral or cognitive, life skills orskills oriented, multimodal, and familyintervention (147 148).Interventions with the lowestpercentage of successful outcomesinclude: diversion, group counseling ortherapy, and individual counseling ortherapy which often reflected mixedresults toward recidivism reduction;and confrontation had the weakest (in
DOC Licensed Substance Abuse Programs Page 34
fact, the most negative)(Palmer, 135, 146).16
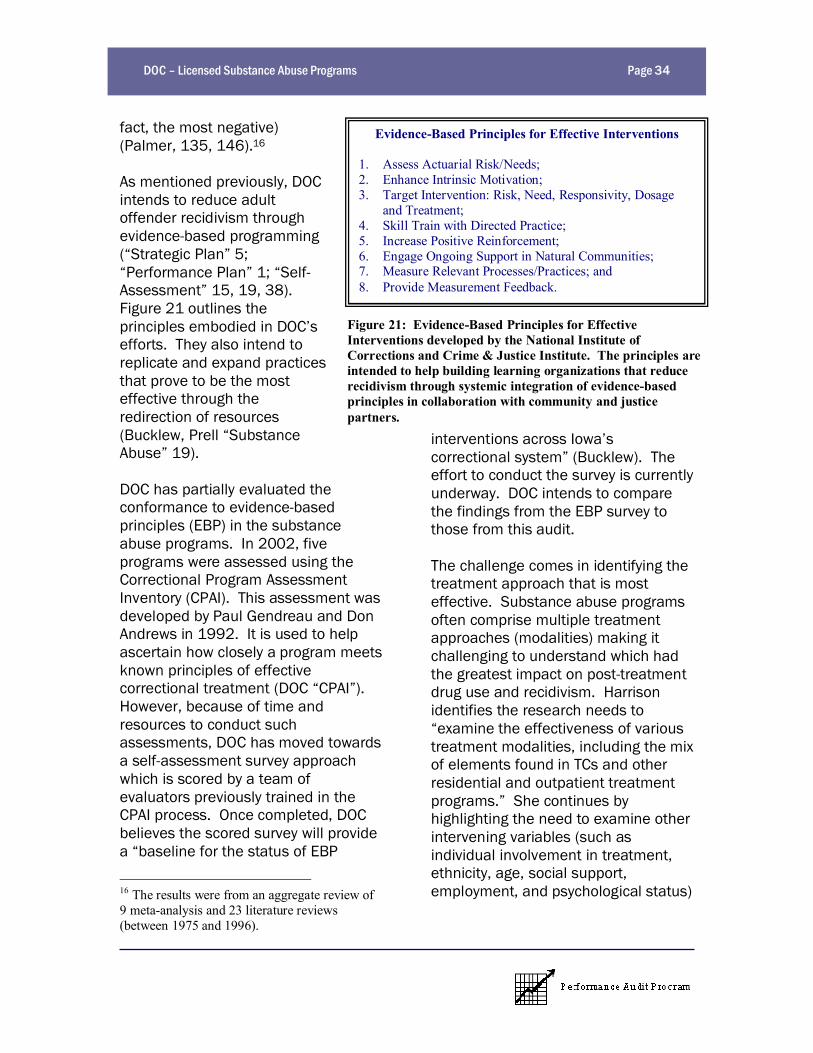
As mentioned previously, DOCintends to reduce adultoffender recidivism throughevidence-based programming( Strategic Plan 5;Performance Plan 1; Self-
Assessment 15, 19, 38).Figure 21 outlines theprinciples embodied in DOC sefforts. They also intend toreplicate and expand practicesthat prove to be the mosteffective through theredirection of resources(Bucklew, Prell SubstanceAbuse 19).
DOC has partially evaluated theconformance to evidence-basedprinciples (EBP) in the substanceabuse programs. In 2002, fiveprograms were assessed using theCorrectional Program AssessmentInventory (CPAI). This assessment wasdeveloped by Paul Gendreau and DonAndrews in 1992. It is used to helpascertain how closely a program meetsknown principles of effectivecorrectional treatment (DOC CPAI ).However, because of time andresources to conduct suchassessments, DOC has moved towardsa self-assessment survey approachwhich is scored by a team ofevaluators previously trained in theCPAI process. Once completed, DOCbelieves the scored survey will providea baseline for the status of EBP
16 The results were from an aggregate review of9 meta-analysis and 23 literature reviews(between 1975 and 1996).
interventions across Iowa scorrectional system (Bucklew). Theeffort to conduct the survey is currentlyunderway. DOC intends to comparethe findings from the EBP survey tothose from this audit.
The challenge comes in identifying thetreatment approach that is mosteffective. Substance abuse programsoften comprise multiple treatmentapproaches (modalities) making itchallenging to understand which hadthe greatest impact on post-treatmentdrug use and recidivism. Harrisonidentifies the research needs toexamine the effectiveness of various
treatment modalities, including the mixof elements found in TCs and otherresidential and outpatient treatmentprograms. She continues byhighlighting the need to examine otherintervening variables (such asindividual involvement in treatment,ethnicity, age, social support,employment, and psychological status)
Evidence-Based Principles for Effective Interventions
1. Assess Actuarial Risk/Needs;2. Enhance Intrinsic Motivation;3. Target Intervention: Risk, Need, Responsivity, Dosage
and Treatment;4. Skill Train with Directed Practice;5. Increase Positive Reinforcement;6. Engage Ongoing Support in Natural Communities;7. Measure Relevant Processes/Practices; and8. Provide Measurement Feedback.
Figure 21: Evidence-Based Principles for EffectiveInterventions developed by the National Institute ofCorrections and Crime & Justice Institute. The principles areintended to help building learning organizations that reducerecidivism through systemic integration of evidence-basedprinciples in collaboration with community and justicepartners.
DOC Licensed Substance Abuse Programs Page 35
that play a role and may predicttreatment efficacy (478-479).
The Iowa Practice ImprovementCollaborative also note that although
the term evidence-based practice iscommonly used, there is still noconsensus on what exactly constitutesan evidence-based practice (4).
DOC assesses offender risk and needs at institutions, but does notconsistently measure addiction severity, and responsivity factors.DOC utilizes LSI-R (Level of ServiceInventory) as the main tool forassessing actuarial risk/needs ofoffenders. When properlyadministered, such assessments helpidentify the level of supervision andtypes of treatment required byoffenders. However, Durrant statesthat the LSI-R assessmentsare completed at offendersassigned institution notreception, this limitspotential treatmentmatches to those within theinstitution assigned (2).
Institutions expressed theneed for a consistent state-wide assessment tool thatcomplements the LSI-R. LSI-Ridentifies a substance abuse need butdoes not indicate the level of addictionseverity, or prevalence of mentalhealth issues (Howard and Phillips,Nelson, and Bagby). Assessments todetermine the required level ofsubstance abuse treatment werepreviously conducted during reception,but due to budget reductions theservice is no longer provided (Durrant2).
The LSI-R is also limited in assessingoffender responsivity (DOC, CPAI ).Responsivity is critical becausesubstance abuse treatment is mainly
an inside job that is it happenswithin the offender. Responsivityfactors include offender characteristicssuch as: motivation, personalitycharacteristics, cognitive andintellectual deficits, and demographicvariables which may or may not becriminogenic needs, but can impact
treatment choices (BontaOffender Assessment 17;
Kennedy 20). Offenderscognitive and verbal skills mayimpair their ability to graspcomplex ideas, and limit theeffectiveness of some cognitive-based programs. Additionally,responsivity factors are notalways criminogenic need, butthat does not diminish their
importance:
Levels of anxiety are poor predictorsof recidivism and decreases in anxietyare not associated with reductions inrecidivism. Yet, the anxiety levels ofoffenders could impact on the choiceof treatment. For example, an angermanagement program may work wellin a group format consisting ofrelatively non anxious individuals. Forclients who are extremely anxious insocial situations however, theprogram would be more effective ifdelivered on an individual basis(Bonta, 17).
Such factors could have significantimplications regarding the
Offenderscognitive and
verbal skills mayimpair their abilityto grasp complex
ideas, and limit theeffectiveness ofsome cognitive-
based programs.
DOC Licensed Substance Abuse Programs Page 36
effectiveness of the program,regardless of a program s therapeuticintegrity or competency of its staff.Kennedy concludes, the need for asystematic and comprehensiveassessment of responsivity and itsrelated constructs (i.e., motivation andtreatment readiness) is essential forthe successful planning,implementation and delivery ofappropriate and effective treatmentprograms (21). A similar argumentcould be made for why systematic andcomprehensive assessments ofaddiction severity and mental healthconditions are essential.
Consistent approaches for offenderresponsivity assessments are notevident from reviewing DOC policy andprocedure manuals. Some programsmake use of psychological/socialassessment questionnaires (DOCICIW - Treatment 4; ICIW Violator
Program 3; TOW 1). Newton notesthe use of Client Management
Classification (CMC) and Jesness fortheir violator program ( NCF ViolatorProgram 3). Most other programs, ifnoted at all discuss making use ofvarious assessments when available;or rely on classification notes, pre-sentence investigations, and other lessstructured approaches (DOC ASP 17;NCF - PSD 3; MPCF 3).
Addiction severity assessments andinstruments used reflected littleconsistency among substance abuseprograms. FDCF noted utilizingSubstance Abuse Subtle ScreeningInventory (SASSI), and Adult SubstanceUse Survey (ASUS) (DOC NewFrontiers 24). NCCF also notes theuse of SASSI (DOC NCCF 4). Otherinstitutions policies make noreference to any instruments, refer toan evaluation conducted by MECCA, orjust reference the data collectedduring the intake process at IowaMedical and Classification Center(IMCC).
22.8% of offenders treated had low to low/moderate risks, while over1,800 moderate to high risk offenders with substance abuse needsreceived no treatment.According to the National Institute ofCorrections and Crime and JusticeInstitute, the risk principle calls forprograms to prioritize supervision andtreatment resources for higher riskoffenders (3). Their premise is thatprioritizing the higher risk offendersplaces emphasis on harm-reductionand public safety, since higher riskoffenders have a greater need for pro-social skills and thinking developmentand are more likely to commit newoffenses (4). Bonta concurs statingthat research evidence suggests that
it is the higher risk client that canbenefit from treatment more so thanthe lower risk offender ( OffenderAssessment 16).
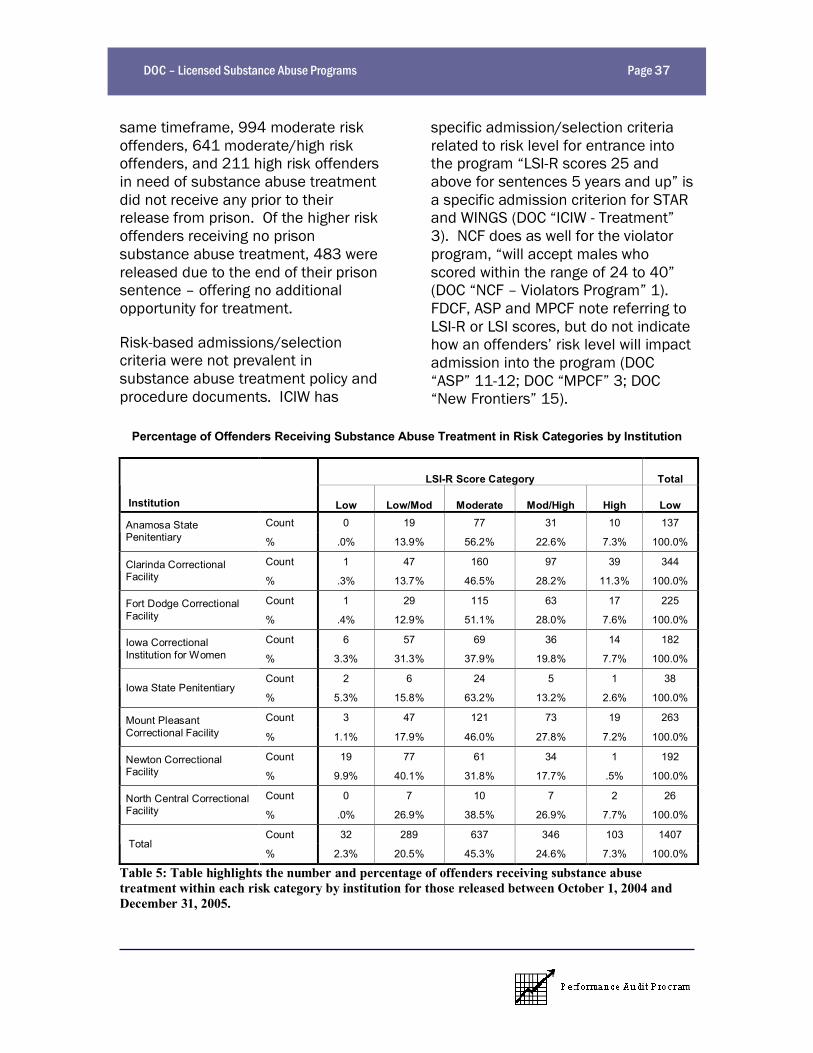
22.8% of the offenders (321offenders) released with substanceabuse treatment had low tolow/moderate risk levels withNewton Correctional Facility having50% of the offenders treated in thetwo lower risk categories, andAnamosa State Penitentiary the leastat 13.9% - see table 5. During the
DOC Licensed Substance Abuse Programs Page 37
same timeframe, 994 moderate riskoffenders, 641 moderate/high riskoffenders, and 211 high risk offendersin need of substance abuse treatmentdid not receive any prior to theirrelease from prison. Of the higher riskoffenders receiving no prisonsubstance abuse treatment, 483 werereleased due to the end of their prisonsentence offering no additionalopportunity for treatment.
Risk-based admissions/selectioncriteria were not prevalent insubstance abuse treatment policy andprocedure documents. ICIW has
specific admission/selection criteriarelated to risk level for entrance intothe program LSI-R scores 25 andabove for sentences 5 years and up isa specific admission criterion for STARand WINGS (DOC ICIW - Treatment3). NCF does as well for the violatorprogram, will accept males whoscored within the range of 24 to 40(DOC NCF Violators Program 1).FDCF, ASP and MPCF note referring toLSI-R or LSI scores, but do not indicatehow an offenders risk level will impactadmission into the program (DOCASP 11-12; DOC MPCF 3; DOCNew Frontiers 15).
Percentage of Offenders Receiving Substance Abuse Treatment in Risk Categories by Institution
LSI-R Score Category Total
Institution Low Low/Mod Moderate Mod/High High LowCount 0 19 77 31 10 137Anamosa State
Penitentiary % .0% 13.9% 56.2% 22.6% 7.3% 100.0%
Count 1 47 160 97 39 344Clarinda CorrectionalFacility % .3% 13.7% 46.5% 28.2% 11.3% 100.0%
Count 1 29 115 63 17 225Fort Dodge CorrectionalFacility % .4% 12.9% 51.1% 28.0% 7.6% 100.0%
Count 6 57 69 36 14 182Iowa CorrectionalInstitution for Women % 3.3% 31.3% 37.9% 19.8% 7.7% 100.0%
Count 2 6 24 5 1 38Iowa State Penitentiary
% 5.3% 15.8% 63.2% 13.2% 2.6% 100.0%
Count 3 47 121 73 19 263Mount PleasantCorrectional Facility % 1.1% 17.9% 46.0% 27.8% 7.2% 100.0%
Count 19 77 61 34 1 192Newton CorrectionalFacility % 9.9% 40.1% 31.8% 17.7% .5% 100.0%
Count 0 7 10 7 2 26North Central CorrectionalFacility % .0% 26.9% 38.5% 26.9% 7.7% 100.0%
Count 32 289 637 346 103 1407 Total
% 2.3% 20.5% 45.3% 24.6% 7.3% 100.0%
Table 5: Table highlights the number and percentage of offenders receiving substance abusetreatment within each risk category by institution for those released between October 1, 2004 andDecember 31, 2005.
DOC Licensed Substance Abuse Programs Page 38
The data is notcompiled in such a
way to seechanges over time,
nor is there aconsistent
approach usedacross programsminimizing the
data s usefulnessfor program
comparisons.
System-level measures are either inconsistent or do not exist acrossprograms limiting performance management capabilities new datasystems may offer solutions.Licensure standards for substanceabuse treatment programs incorrectional facilities provide theframework for establishing consistentsystem-level measures. 641 IowaAdministrative Code Paragraph156.3(13) requires programs todocument the quality of inmate careand use that information todetect trends and patternsof performance. IowaDepartment of PublicHealth staff said thisrequirement was initiatedthree years ago, andprogress has been made.However, it is left to theindividual programs todefine the criteria they willlook at (Austin and Kelly).The effort is a step in theright direction, but when thecriteria are developed independently ithinders the ability for DOC to use theinformation collected for programcomparison purposes.
Many of the programs attempt to learnfrom offenders completing treatmentabout the quality of their programsthrough a survey or interviewconducted when offenders exit theprogram. The survey or interviewresults serve as a gauge for offendersatisfaction and a mechanism to learnwhat is working and what is not(Howard and Phillips; Dick and Comp;Nelson; Johnson; Dursky et al.; Bagby;Lawson et al.). The informationcollected in this way is reviewed
periodically (monthly, quarterly or atthe end of the treatment session).Programs tend to look for patterns inresponses given for issues to addressand improvements to make. The datais not compiled in such a way to seechanges over time, nor is there aconsistent approach used across
programs minimizing the data susefulness for programcomparisons.
FDCF, ASP, and NCCFdiscussed the use of pre andpost tests as ways to assess ormeasure learning that takesplace as a result of the program(Dick and Comp; Hebron andLaBarge; Johnson). Tests usedare usually associated with theprogram s curriculum, andresults are often kept in
offender files. No indication wasprovided that the information isaggregated to assess the programsperformance relative to offenderlearning over time. One institution didnot believe the test they use to be thegreatest, but did not have anotheralternative available. NCF conductspre and post tests using the criminalsentiment scale, which measureschanges in antisocial attitudes (Durskyet al.).17 This was the only approach
17 The Criminal Sentiment Scale instrumentmeasures antisocial attitudes to determineoffender tolerance for the law and identificationwith criminal activities, and reflects tendenciesto have antisocial attitudes.
DOC Licensed Substance Abuse Programs Page 39
promises to helpwith various
researchissues/questions,and will place all
individual data in adatabase enablingthe aggregation of
data.
identified that attempts toquantitatively measure behavioralchanges. However, the data producedby the criminal sentiment scale testwas not mentioned when discussingperformance data periodicallyreviewed for management purposes suggesting it may be collected at theindividual level, but not aggregated toassess program performance. ISP andICIW noted that behavior change is notspecifically measured but is capturedthrough discussions between theoffender and counselor.The information is likelykept in progress notes andnot used for measuringprogram effectiveness(Lawson et al; Bagby).
Institutions also discussedfollowing-up on offendersonce they exit treatmentprograms. However, whatthey check and when they checkvaries. FDCF said an 18 monthrecidivism check is conducted bycounselors (Dick and Comp). MPCFconducts follow-ups at 30, 60, and 90days, six months and one yearfollowing treatment completion tocheck on arrests, parole violations andconvictions (Nelson). ASP said thatrecidivism data is collected every sixmonths on the TC for grant reportingpurposes, but was not collected forALTA and LH SAT (Hebron andLeBarge). NCCF sends mailings tooffenders one year after treatment, but
does not have good response rates,and ISP reviews ICON for behaviorissues recorded by parole officers andurinalysis results (Johnson; Lawson etal.).
DOC has begun to pilot test the IowaService Management and ReportingTool (I-SMART) in two institutions whichpromises to help with various researchissues/questions, and will place allindividual record data in a databaseenabling the aggregation of data
(Lawson et al). According to theIowa Department of PublicHealth, a key goal for I-SMARTis to advance thestandardization and quality oftreatment data to provide thebest available treatmentinformation for managing andmonitoring system outcomes( I-SMART ). It will allowproviders using the system to
capture data related to intake,treatment services, discharge, andfollow-up tracking. However, anotherchief benefit is that it will enable thesharing of treatment information withinthe constraints of individual privacyregulations, which is critical accordingto stakeholders to enhance communityaftercare. Additionally, DOC s ICONsystem promises to offer a standardapproach for gathering recidivismdata, as reflected in this performanceaudit, which will be beneficial forconducting future outcomeevaluations.
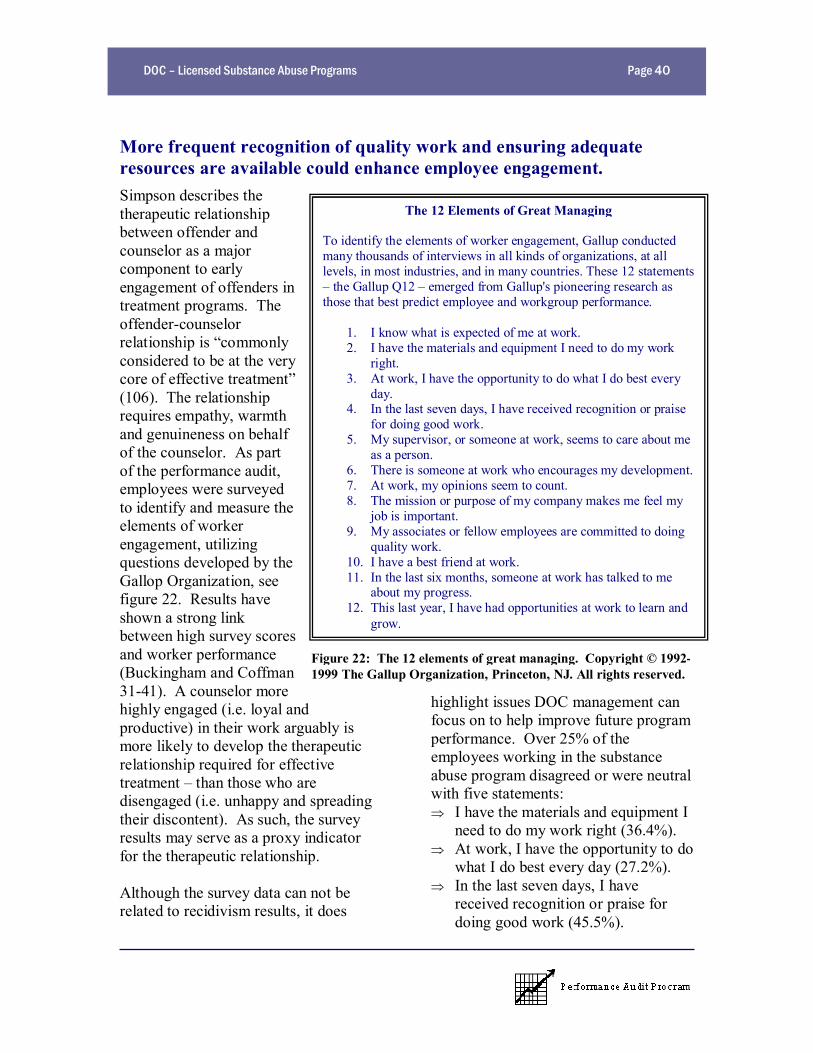
DOC Licensed Substance Abuse Programs Page 40
More frequent recognition of quality work and ensuring adequateresources are available could enhance employee engagement.Simpson describes thetherapeutic relationshipbetween offender andcounselor as a majorcomponent to earlyengagement of offenders intreatment programs. Theoffender-counselorrelationship is commonlyconsidered to be at the verycore of effective treatment(106). The relationshiprequires empathy, warmthand genuineness on behalfof the counselor. As partof the performance audit,employees were surveyedto identify and measure theelements of workerengagement, utilizingquestions developed by theGallop Organization, seefigure 22. Results haveshown a strong linkbetween high survey scoresand worker performance(Buckingham and Coffman31-41). A counselor morehighly engaged (i.e. loyal andproductive) in their work arguably ismore likely to develop the therapeuticrelationship required for effectivetreatment than those who aredisengaged (i.e. unhappy and spreadingtheir discontent). As such, the surveyresults may serve as a proxy indicatorfor the therapeutic relationship.
Although the survey data can not berelated to recidivism results, it does
highlight issues DOC management canfocus on to help improve future programperformance. Over 25% of theemployees working in the substanceabuse program disagreed or were neutralwith five statements:Þ I have the materials and equipment I
need to do my work right (36.4%).Þ At work, I have the opportunity to do
what I do best every day (27.2%).Þ In the last seven days, I have
received recognition or praise fordoing good work (45.5%).
The 12 Elements of Great Managing
To identify the elements of worker engagement, Gallup conductedmany thousands of interviews in all kinds of organizations, at alllevels, in most industries, and in many countries. These 12 statements the Gallup Q12 emerged from Gallup's pioneering research as
those that best predict employee and workgroup performance.
1. I know what is expected of me at work.2. I have the materials and equipment I need to do my work
right.3. At work, I have the opportunity to do what I do best every
day.4. In the last seven days, I have received recognition or praise
for doing good work.5. My supervisor, or someone at work, seems to care about me
as a person.6. There is someone at work who encourages my development.7. At work, my opinions seem to count.8. The mission or purpose of my company makes me feel my
job is important.9. My associates or fellow employees are committed to doing
quality work.10. I have a best friend at work.11. In the last six months, someone at work has talked to me
about my progress.12. This last year, I have had opportunities at work to learn and
grow.
Figure 22: The 12 elements of great managing. Copyright © 1992-1999 The Gallup Organization, Princeton, NJ. All rights reserved.
DOC Licensed Substance Abuse Programs Page 41
Þ At work, my opinions seem to count(30.9%).
Þ I have a best friend at work (34.5%).
Over 25% disagreed with receivingrecognition and praise in last seven days,and 18.2% disagreed with having thematerials and equipment to do their jobright. The percentages were higheramong survey respondents.18 Surveydata is provided in Appendix J.
18 65% of DOC employees working in thesubstance abuse programs responded to theemployee survey.

DOC Licensed Substance Abuse Programs Page 42
Conclusions and RecommendationsDOC has begun to look for ways to improve their substance abuse treatmentprograms, and is committed to reducing recidivism specifically with efforts to:
Þ evaluate the utilization of EBPs within interventions and programs;Þ develop program corrective action plans to drive the implementation of EBPs; andÞ redirect resources into promising or excellent strategies.
Even though connecting the implementation of evidence-based practices toimprovements in recidivism is not possible currently, research supports their use.DOC should continually strive to evaluate, integrate and implement evidence-basedpractices into their treatment offerings.
Many of the licensed substance abuse programs have also established qualityassurance programs to allow ongoing continual improvement, focused on makingsmall programmatic changes, which over time taken collectively have thepotential to greatly affect program results. While the quality assurance programsoffer a good start, DOC s efforts could be greatly enhanced with instruments tomonitor patient progress or aggregate patient records to provide measures ofmotivation, engagement, and functioning and for these measures to be trackedover time. Such measures have the benefit of demonstrating program effectiveness,identifying problem areas and supporting focused improvement efforts. Approachingmeasurement consistently across the prison system will provide the added benefit ofidentifying unique programmatic problems from systemic problems prominent acrossthe entire prison-system.
DOC also has the need to fully understand dynamic population characteristics acrossthe system. The limited information presents challenges in knowing which type oftreatment in terms of intensity, duration, and modalities used are of greater needDepartment-wide. Currently, the delivery of appropriate and effective treatment ishindered by restricting programming to what is available at the institution where theoffender has been placed, which may not best fit the offender s needs. It also placesthe burden of challenging offender populations, such as those with co-occurringdisorders (mental health and substance abuse need), on the institutions whereprogramming may not adequately address the problem.
While many strategies can be implemented within the prison-system, some issuescall for a broader approach. Recidivism rate changes associated with communitysupervision, enrollment in community based substance abuse programming, andenvironmental factors associated with higher recidivism rates among AfricanAmericans suggest the need for enhanced social support systems and networkswithin communities. More offenders need continuing support and care in thecommunity to maintain and further enhance treatment received while in prison.
DOC Licensed Substance Abuse Programs Page 43
The following recommendations are offered for DOC s consideration:
Þ Enhance community support networks and release planning to positively reinforcedesired behaviors;
Þ Develop a consistent assessment protocol and standard intake process;Þ Develop a system for monitoring program performance, setting targets and furthering the
use of evidence-based practices;Þ Deliver substance abuse programming across the correctional system in an integrated
fashion; andÞ Develop strategies to give substance abuse treatment staff positive recognition and
praise on a frequent basis.
All of the recommendations discussed below will require DOC to manage change.Employees and stakeholders must understand the real costs, benefits and rationale.A communication plan accompanying strategies the Department intends to moveforward with will be beneficial. The mantra regarding change management is tocommunicate early and often.
Enhance community support networks and release planning topositively reinforce desired behaviors.Community aftercare is a critical element to NIDA. They have it listed as a principleof drug abuse treatment for criminal justice populations Continuity of care isessential for drug abusers re-entering the community ( Treatment for CriminalJustice Populations 5). Community aftercare is also listed as an evidence basedprinciples for effective interventions, Engage ongoing support in naturalcommunities, see figure 21. Its importance is further supported by researchers inthe substance abuse field, Simpson states that nowhere is the importance oftransitional services treatment more evident than for correctional populations,especially community re-entry programs that follow prison-based treatment (110).Data presented in this audit suggests that community aftercare can reducerecidivism. The following information presents a number of short-term and long-termactions DOC can undertake to enhance community support networks and releaseplanning that will positively reinforce desired behaviors and reduce recidivism.
Short-term actions:
1. Review recidivism data geographically by region or county where offendersare located following release to identify where additional support may berequired. Release location variable was not part of the data set reviewed aspart of this performance audit.
2. Review the discharge planning process to ensure substance abuse aftercarerequirements are incorporated and detailed in offenders discharge plans.
DOC Licensed Substance Abuse Programs Page 44
3. Reinforce treatment received in prison by encouraging offendersparticipation in self-help and peer support groups and religious activities afterrelease that will improve offenders bonds to pro-social community members(National Institute of Corrections 6).
4. Enhance or expand interventions that increase offenders family contact andeducate family members how they can better support offenders recovery.
5. Evaluate the effectiveness of I-SMART pilot in conveying prison treatmentinformation to providers in the community, and mainstream the system toother programs if success is demonstrated.
Long-term actions:
1. Develop partnerships with community-based organizations and substanceabuse providers to ensure services are available to offenders after theirrelease from prison.
2. Develop and pilot test a coordinated, supportive approach to communitysupervision that emphasizes offenders pro-social goals in their conditions torelease and encourages positive responses to attainment of these goals (Re-Entry Policy Council 5). See Step n Out behavioral management approachoutlined on www.cjdats.org. The goal of the approach is to enable communitysupervision officials to become more of a change agent, and to rely less onnegative sanctions which lead to recidivism due to technical violations.
3. Enable local care providers to meet with offenders prior to their release andto be involved in discharge planning. The Re-Entry Policy Council suggestscommunity-based providers are likely to be more familiar with the communityto which an individual will return after his or her incarceration than arecorrections staff (12).
In order to leverage departmental resources, DOC may want to explore ways to focussuch initiatives, the following are some examples:
Þ Build partnerships in communities where African Americans reside to help combatprevalent socioeconomic issues.
Þ Build partnerships in communities where higher recidivism rates are evident.Þ Enhance discharge planning for higher risk offenders, or with those mental health
diagnoses.
Develop a consistent assessment protocol and standard intake process.The assessment process is arguably one of the most critical functions DOC conducts,because with growing prison populations and declining resources where and howservices are provided become more and more critical with each admission. Thefollowing four offender classification factors help with security decisions and guidingtreatment:
DOC Licensed Substance Abuse Programs Page 45
Þ Risk,Þ Need (criminogenic needs),Þ Responsivity, andÞ Professional discretion, which uses professional judgment to assess variables, deemed
important (Kennedy 19, Bonta Offender Assessment 16-17).
However, as Bonta notes, interview questions can vary from offender to offender, andthe range of error associated with measurement instruments available can makeassessing offenders challenging. He suggests a multi-method measurement oftheoretically relevant factors as a way to reduce error and increase the accuracy ofthe assessment. This approach combines the use of a measurement instrument(test) and a structured interview ( Offender Assessment 15-16). DOC utilizes thevalidated LSI-R to assess risk and need (Lowenkamp and Bechtel). Classificationnotes and pre-sentence investigation are also utilized by a number of substanceabuse programs as part of their intake phase, but were not reviewed as part of thisaudit. However, the consistent use of instruments related to mental health, addictionseverity and responsivity is not apparent.
Short-term actions:
1. Review addiction severity instruments. According to a study of prisoner intakesystems, SASSI, the Texas Christian University Drug Dependency Screen(TCUDDS) and the Addiction Severity Index (ASI) are common instrumentsused nationally (Hardyman et al. 12).
2. Review mental health instruments. Millon Clinical Multiaxial Inventory (MCMI)and Minnesota Multiphasic Personality Inventory (MMPI) were more commoninstruments used to assess psychopathology and address compulsivebehaviors (Hardyman et al. 12).
3. Review responsivity instruments. Kennedy discusses CMC and the JesnessPersonality Inventory, as commonly used instruments for responsivity, buthighlights LSI Ontario Revision (OR) as the first risk assessment instrumentto incorporate a section on special responsivity considerations . Thesection measures motivation as a barrier, denial/minimization, interpersonalanxiety, cultural issues, low intelligence and communication barriers (21).Bonta highlights other valid and reliable measures for intelligence, anxiety,and interpersonal maturity ( Offender Assessment 18).
4. Review existing interview methodologies used, and identify ways to establishstructured interviews that will help ensure consistency in administration.
5. Develop a standard comprehensive assessment protocol and intake process.In the DOC executive meeting on December 18, 2006, it was noted that 1)there is not a state-wide assessment, and 2) there is a need to make thereception/intake process at IMCC more efficient. DOC may want to considerutilizing a lean tool called Design for Lean Sigma, which is a methodology to
DOC Licensed Substance Abuse Programs Page 46
create a new service, product or process; is applicable to any high-valueproject that needs a significant amount of new design; and places strongemphasis on capturing and understanding the customer and organizationneeds.
6. Train assessment staff on how the assessment and intake process will workand how to use the instruments.
7. Develop training material so substance abuse counselors and other treatmentstaff understand how the comprehensive assessment works and know how touse the information from the assessment in developing individual treatmentplans.
Long-term actions:
1. Train substance abuse counselors and other treatment staff.
2. Validate any new measurement instruments used.
3. Conduct an assessment to identify gaps in treatment services offered withinthe correctional system.
4. Establish treatment acceptance criteria for treatment offerings based oninformation provided by the comprehensive assessment. The criteria shouldbe unique, so that it is appropriate for the specific intervention, yet standardamong similar interventions.
5. Redirect staffing resources, especially those with strong substance abuseexpertise to support the assessment function.
Develop a system for monitoring program performance, setting targetsand furthering the use of evidence-based practices.
System-level measures allow program comparisons, help programs tell their story,track progress over time, and identify improvement opportunities. Measuringrelevant processes/practices and providing measurement feedback are also twoprinciples of for effective interventions (National Institute of Corrections and Crime &Justice Institute 7). The litmus test for any measurement system is how it is used.Managers need to define the specific purpose for the measurement system andspecific measures, and how it will be used as well as what it will be answering.Measures should help agencies manage themselves better drive improvement,measure progress towards achieving one s mission (or at least to know whether ornot they are doing a better job), and help answer key questions that stakeholdershave about the program.
DOC Licensed Substance Abuse Programs Page 47
Short-term actions:
1. Continue efforts to assess the use of evidence-based practices to betterinventory what practices are used and where they are implemented. The IowaConsortium for Substance Abuse Research and Evaluation highlight thatnumerous studies show positive outcomes in a variety of fields includingsubstance abuse treatment when programs accurately implementevidence-based protocols (24). The integrity of program implementation isjust as important as understanding program results whether it is relapse orrecidivism.
2. Identify key aspects of the program that are the most important. The TCUTreatment Model highlights six broad areas, which may establish commonaspects programs can look at: patient attributes, program attributes, earlyengagement, early recovery, stabilized recovery, and post-treatment outcomes(Simpson 103). DOC work on evidence-based practices provides a start onwhat to look at.
3. Identify who will have questions about aspects of the substance abuseprogram, and what questions they will have, and how the answers to thosequestions would be used.
a. Internally, DOC has interest in knowing how well programs areimplementing evidence-based practices and how do offenders changeas a result of treatment, whereas policy makers are interested inbroader outcome related questions such as does the program keepoffenders from returning to prison? In these cases, the answers willgenerally be used for driving improvements and allocating resources.
b. DOC may want to consider asking stakeholders what questions theyhave about the substance abuse programs.
4. Prioritize questions to answer. Generally, resources are not available toanswer every possible question. Additionally, attempting to answer too manyquestions through measurement can hinder DOC s ability to explain what thedata is telling you, which is just as important as the data itself.
a. When prioritizing, DOC should look for commonalities among questionsasked.
b. Most performance management efforts place focus on outcomes,Iowa s Accountable Government Act is no different. DOC shouldconsider focusing on more immediate outcomes for the substanceabuse programs. Although reduced recidivism is key result, a lot ofvariables influence it. Incremental offender change is a moreimmediate outcome that can be directly attributable to the substanceabuse program it is also more immediate giving management anopportunity to react, and make necessary changes.
DOC Licensed Substance Abuse Programs Page 48
c. DOC must also have information that will help explain unusual orunexpected outcomes. For instance, dosage is a key principle foreffective treatment so are offenders in therapeutic tasks 40% ormore of their time? Does a drop in offenders meeting the dosagestandard coincide with a reduction in the amount of change exhibitedby offenders?
5. Identify data needed to help answer your questions; and how and when it willbe collected.
a. Queries have been built to answer recidivism questions related to thisaudit, which can be used.
b. I-SMART database piloted in two institutions may offer otheropportunities.
c. Samples may be sufficient treatment managers are already samplingcase files for quality assurance purposes, what other questions canthey answer during this exercise? If sampling is used, questionsasked, and how they are answered should be consistent across thesubstance abuse programs.
d. DOC could continue to use the Q12 survey questions to measureemployee engagement, as a proxy for therapeutic relationships.
e. Some questions may need new data such as monitoring the changein an offender s dynamic risk factors as a result of treatment, oroffender engagement during treatment.
f. Consider how DOC will need the data disaggregated consideringgeographical or other demographic characteristics. In order to avoid acentral office orientation, it is important to include measures that arerelevant at the institution and program level as well.
g. Avoid unnecessary precision or confidence requirements that are oflittle benefit and only make measurement more costly.
h. Collect and document data to support monitoring performance overtime and observing changes.
i. Ensure what is measured and how frequently it is measured isconsistent over time and across programs.
6. Baseline and set targets and standards for action for every measure intendedto monitor performance. This helps establish what level of performance isexpected and provides a means to signal problems. It also allows substanceabuse programs to explore creative/innovative approaches for achievingtargets. Having targets and standards can help evaluate a program orprocesses fidelity how close is the process or program implemented in theway it was intended.
DOC Licensed Substance Abuse Programs Page 49
7. Assign individuals responsible for each performance measure identified.
8. Make the data visual utilizing graphical analysis of the data. This reportprovides some examples, other techniques are run and control charts, whichare especially useful for time series data.
9. Use the data. Substance abuse programs have quality assurance teams orcommittees, and most also have periodic employee/team meetings wheremonitoring system data can be reviewed and corrective action plans devised.With measures that are consistently measured over time and acrossprograms, the monitoring systems will support the inside out approach forimplementing the Principles of Evidence-Based Practices allowing forcomparisons across programs in search of best or at least better practicesto replicate in other areas of the department (National Institute of Correctionsand Crime & Justice Institute 12).
10.Share the data. The data, in some cases, was collected to answerstakeholder questions let them see it. Some of the substance abuseprograms have advisory groups, which may serve as a good place to start.
Long-term actions:
1. Develop a system for external benchmarking of other incarceration-basedsubstance abuse programs/models supported by research. Although it isgood to look internally for utilization of evidence-based practices, externalreview can provide new insights, and identify other practices or strategies thatwould benefit DOC s substance abuse programs. It can also serve as a majorcatalyst for change, and would allow DOC to build upon the work of others.External benchmarking should only be considered after DOC s internalmonitoring and benchmarking methods are well developed.
Deliver substance abuse programming across the correctional system inan integrated fashion.
As noted previously, most of the substance abuse programming offered by DOC wasdeveloped at the institution level. Independent program development createstreatment programs that are specific to the institution rather than supportive of acomprehensive departmental system and may not adequately address servicegaps when looking at needs across the department. Also, the small percentage ofoffenders receiving continuing substance abuse programming in the community,suggests that many of DOC s treatment programs are stand alone where therapeuticchange is hopefully completed while the offender is incarcerated, rather than as partof a treatment continuum spanning incarceration, work release and parole.Approaching substance abuse programming in an integrated fashion promotesconsistent delivery of services, as well as, provides for the standardization of keyprocesses such as offender assessment and discharge planning. It would alsoallow DOC to focus on advantages that incarceration-based treatment offers such
DOC Licensed Substance Abuse Programs Page 50
as time. As Inciardi et al. notes, there is the time and opportunity for focused andcomprehensive treatment, perhaps for the first time in a drug offender s career (91).
Short-term actions:
1. Work with Community Based Correction Districts to develop a multistagetreatment continuum model. Durrant notes that CBC facilities are an integraland critical part of the correctional system (16). Exploring how the prison-based and community-based substance abuse programs work together is anatural extension to DOC s efforts to evaluate the use of evidence-basedpractices and may offer opportunities to deliver services more costeffectively. The multistage model used within the Delaware correctionalsystem since the mid-1990 has been the subject of many studies whereprimary treatment is provided in the prison system, transitional treatment isprovided in a work release setting and aftercare is provided when the offenderenters parole or is placed under some other form of community supervision(Inciardi et al. 91-92). This approach may also support utilizing prisontreatment resources for offenders with more severe addictions requiring moreintensive treatment. While others with less severe addictions could be treatedin the community rather than in prison.
2. Evaluate opportunities to create prison-wide centers that address specificissues or needs. Focusing on a specific issue or problem typically allows for agreater degree of specialization that is not possible or practical in allsituations. The co-occurrence of mental health and substance abuse needsmay be appropriate for such a center.
Develop strategies to give substance abuse treatment staff positiverecognition and praise on a frequent basis.
Evidence-based practices suggest that effective correctional programs are ones whoutilize rewards at a much higher rate than punishments as a way to change offenderbehavior (DOC CPAI ). The same principle can be applied to employees in the formof frequent recognition and praise that:
Þ Focus on positive interactions;Þ Promote positive emotions that can profoundly influence employee productivity; andÞ Enhance therapeutic relationships that are critical in substance abuse treatment.
This is especially critical in the field of substance abuse treatment, where relapse isprevalent and often considered inevitable.
DOC Licensed Substance Abuse Programs Page 51
Short-term actions:
1. Develop strategies to increase positive interactions occurring within workteams. How Full is Your Bucket? by Tom Rath and Donald O. Clifton andwww.bucketbook.com offer some simple and practical suggestions on howan organization can increase positive interactions.
DOC Licensed Substance Abuse Programs Page 52
ReferencesAustin, Dean and Cindy Kelly. Personal interview. 05 Feb. 2007.
Bagby, Robin. Personal interview. 02 Feb. 2007.
Bonta, James. Offender Assessment: General issues and considerations. FORUM on CorrectionsResearch 12.2 (May 2000): 14-18.
Bonta, James. Risk-Needs Assessment and Treatment. Choosing Correctional Options That Work:Defining the Demand and Evaluating the Supply. Ed. Alan T. Harland. Thousand Oaks, CA: SAGEPublications, Inc., 1996. 18-32.
Buckingham, Marcus and Curt Coffman. First, Break All the Rules: What the World s GreatestManagers Do Differently. New York, NY: Simon and Schuster, 1999.
Bucklew, Jeanette. E-mail to DOC Wardens, District Directors and Treatment Service Staff. 14 Nov.2006.
Dick, Mary and Tony Comp. Personal interview. 25 Jan. 2007.
Durrant Group, Inc. State of Iowa Systematic Study for the State Correctional System. Des Moines, IA:Iowa Department of Corrections, 2007.
Durskey, Jill, Dorthy Hanneman, Larry Liscomb, and Katrina Carter-Larson. Personal interview. 02Feb. 2007.
Gendreau, Paul, Tracy Little, and Claire Goggin. A Meta-analysis of the Predictors of Adult OffenderRecidivism: What Works! Criminology 34.4 (1996): 575-607.
Hardyman, Patricia L., James Austin, and Johnette Peyton. Prisoner Intake Systems: Assessing Needsand Classifying Prisoners. Washington, DC: National Institute of Corrections, Prisons Division, U.S.Department of Justice, 2004.
Harrison, Lana D. "The Revolving Prison Door for Drug-Involved Offenders: Challenges andOpportunities." Crime & Delinquency 47.3 (July 2001): 462-484.
Hebron, Steve and Dennis LeBarge. Personal interview. 22 Jan. 2007.
Howard, Shawn and Roxanne Phillips. Personal interview. 26 Jan. 2007.
Huebner, Beth M. Drug Abuse, Treatment, and Probationer Recidivism. Chicago, IL: Illinois CriminalJustice Information Authority, 2006.
Inciardi, James A., Steven S. Martin, and Clifford A. Butzin. Five-Year Outcomes of TherapeuticCommunity Treatment of Drug-Involved Offenders After Release From Prison. Crime & Delinquency50.1 (January 2004): 88-107.
Iowa Department of Corrections. Agency Performance Plan FY 2007. Des Moines, IA: IowaDepartment of Corrections, 2006.
Iowa Department of Corrections. Anamosa State Penitentiary, Substance Abuse Program ProceduresManual. Anamosa, IA: Anamosa State Penitentiary, Iowa Department of Corrections, 2006.
Iowa Department of Corrections. Correctional Program Assessment Inventory Final Reports. DesMoines, IA: Iowa Department of Corrections, 2002.
Iowa Department of Corrections. New Frontiers Substance Abuse Treatment Program Policy andProcedures Manual. Fort Dodge, IA: Fort Dodge Correctional Facility, Iowa Department of Corrections,2004.
DOC Licensed Substance Abuse Programs Page 53
Iowa Department of Corrections. Institution Budget Details for FY06 & FY07 Budgeted. Des Moines,IA: Iowa Department of Corrections, 2006.
Iowa Department of Corrections. Iowa Correctional Institution for Women Substance AbuseTreatment Policy, No. 109.111. Mitchellville, IA: Iowa Correctional Institution for Women, IowaDepartment of Corrections, 2003.
Iowa Department of Corrections. Iowa Correctional Institution for Women Violator Program Policy,No. 109.121. Mitchellville, IA: Iowa Correctional Institution for Women, Iowa Department ofCorrections, 2004.
Iowa Department of Corrections. NCCF Journey Program Policy and Procedures Manual. RockwellCity, IA: North Central Correctional Facility, Iowa Department of Corrections.
Iowa Department of Corrections. Mt. Pleasant Correctional Facility Substance Abuse Programming.Mt. Pleasant, IA: Mt. Pleasant Correctional Facility, Iowa Department of Corrections, 2007.
Iowa Department of Corrections. Newton Correctional Facility-Primary Substance Abuse Program StaffProcedures and Treatment Records, O.M. 27-2. Newton, IA: Newton Correctional Facility, IowaDepartment of Corrections, 2001.
Iowa Department of Corrections. Newton Correctional Facility-Violator Program, O.M. 30-1. Newton,IA: Newton Correctional Facility, Iowa Department of Corrections, 2001.
Iowa Department of Corrections. March 2007 Quick Facts. Des Moines, IA: Iowa Department ofCorrections, 2007.
Iowa Department of Corrections. TOW Intake and Assessment, TOW-IX-07. Clarinda, IA: ClarindaCorrectional Facility, Iowa Department of Corrections, 2006.
Iowa Department of Corrections. Self-Assessment. Des Moines, IA: Iowa Department of Corrections,2004.
Iowa Department of Corrections. 2006-2007 Strategic Plan. Des Moines, IA: Iowa Department ofCorrections, 2006.
Iowa Department of Public Health. I-smart Background. May 11, 2007.<http://www.idph.state.ia.us/ismart/background.asp>.
Johnson, Robert. Personal Interview. 29 Jan. 2007.
Kennedy, Sharon. Treatment responsivity: Reducing recidivism by enhancing treatmenteffectiveness. FORUM on Corrections Research 12.2 (May 2000): 19-23.
Klebe, Kelli J. and Maureen O Keefe. Outcome Evaluation of the Crossroads to Freedom House andPeer 1 Therapeutic Communities Project. Washington, DC: National Institute of Justice, U.S.Department of Justice, 2004.
Lawson, Roger, Anne Daily, and Bob Schnieder. Personal interview. 02 Feb. 2007.
Lowenkamp, Christopher and Kristin Bechtel. Validating the LSI-R on an Iowa Probation and ParoleSample. Cincinnati, OH: University of Cincinnati, 2006.
Mitchell, Ojmarrh, David B. Wilson, and Doris L. MacKenzie. The Effectiveness of Incarceration-BasedDrug Treatment on Criminal Behavior. September 2006 <http://www.campbellcollaboration.org/doc-pdf/Incarceration-BasedDrugTxSept06final.pdf>.
Mumola, Christopher J. and Jennifer C. Karberg. Special Report: Drug Use and Dependence, Stateand Federal Prisoners, 2004. Washington, DC: Office of Justice Programs, U.S. Department of Justice,2006.
DOC Licensed Substance Abuse Programs Page 54
National Institute of Justice. Research Preview: Adult Patterns of Criminal Behavior. Washington, DC:National Institute of Justice, Office of Justice Programs, U.S. Department of Justice, 1996.
National Institute of Corrections, and Crime & Justice Institute. Implementing Evidence-BasedPractice in Community Corrections: The Principles of Effective Intervention. Washington, DC: NationalInstitute of Corrections, Community Corrections Division, U.S. Department of Justice, 2004.
National Institute on Drug Abuse. Principles of Drug Abuse Treatment: A Research-Based Guide.Washington, DC: National Institute on Drug Abuse, National Institutes of Health, U.S. Department ofHealth and Human Services, 1999.
National Institute on Drug Abuse. Principles of Drug Abuse Treatment for Criminal JusticePopulations. Washington, DC: National Institute on Drug Abuse, National Institutes of Health, U.S.Department of Health and Human Services, 2006.
National Institute on Drug Abuse. Research Report Series Cocaine Abuse and Addiction.Washington, DC: National Institute on Drug Abuse, National Institutes of Health, U.S. Department ofHealth and Human Services, 2004.
National Institute on Drug Abuse. Research Report Series Marijuana Abuse. Washington, DC:National Institute on Drug Abuse, National Institutes of Health, U.S. Department of Health and HumanServices, 2005.
National Institute on Drug Abuse. Research Report Series Methamphetamine Abuse and Addiction.Washington, DC: National Institute on Drug Abuse, National Institutes of Health, U.S. Department ofHealth and Human Services, 2006.
Nelson, Jay. Personal interview. 26 Jan. 2007.
Palmer, Ted. Programmatic and Nonprogrammatic Aspects of Successful Intervention. ChoosingCorrectional Options That Work: Defining the Demand and Evaluating the Supply. Ed. Alan T. Harland.Thousand Oaks, CA: SAGE Publications, Inc., 1996. 131-182.
Pelissier, Bernadette, Susan Wallace, Joyce Ann O Neil, Gerald G. Gaes, Scott Camp, William Rhodes,and William Saylor. "Federal Prison Residential Drug Treatment Reduces Substance Use and ArrestsAfter Release." American Journal of Drug and Alcohol Abuse 27(2) (2001): 315-337.
Prendergast, Michael L., Deborah Podus, Eunice Chang, Darren Urada. "The effectiveness of drugabuse treatment: a meta-analysis of comparison group studies." Drug and Alcohol Dependence 67(2002): 53-72.
Prell, Lettie. Report to the Board of Corrections on Population Growth. Des Moines, IA: IowaDepartment of Corrections, 2006.
Prell, Lettie. Report to the Board of Corrections on Substance Abuse. Des Moines, IA: IowaDepartment of Corrections, 2006.
Re-Entry Policy Council. Substance Abuse Treatment and Re-Entry. Report of the Re-Entry PolicyCouncil: Charting the Safe and Successful Return of Prisoners to the Community. New York, NY: Re-Entry Policy Council, Council of State Governments, 2005.
Simpson, D. Dwayne. A conceptual framework for drug treatment process and outcomes. Journal ofSubstance Abuse Treatment. 27 (2004): 99-121.
Stageberg, Paul. Iowa Prison Population Forcast. Des Moines, IA: Criminal & Juvenile JusticePlanning, Iowa Department of Human Rights, 2006.
State of Iowa. Report of the Governor s Task Force on Overrepresentation of African-Americans inPrison. Des Moines, IA: Office of Governor Thomas J. Vilsack, State of Iowa, 2001.
DOC Licensed Substance Abuse Programs Page 55
Uggen, Christopher and Michael Massoglia. Settling Down and Aging Out: Desistence from Crime as aSeparate Facet of the Transition to Adulthood. October 23, 2006.<http://cas.uchicago.edu/workshops/crime/Crime%20and%20Punishment%20Workshop/Fall%20Quarter%202006_files/Uggen_Massoglia_10_06.pdf>.
Wexler, Harry K., George De Leon, George Thomas, David Kressel, and Jean Peters. The Amity PrisonTC Evaluation: Reincarceration Outcomes. Criminal Justice and Behavior 26.2 (June 1999): 147-167.
White, William L. "Treatment Works! Is it time for a new slogan?" Addiction Professional 3.1 (January2005): 22-26.
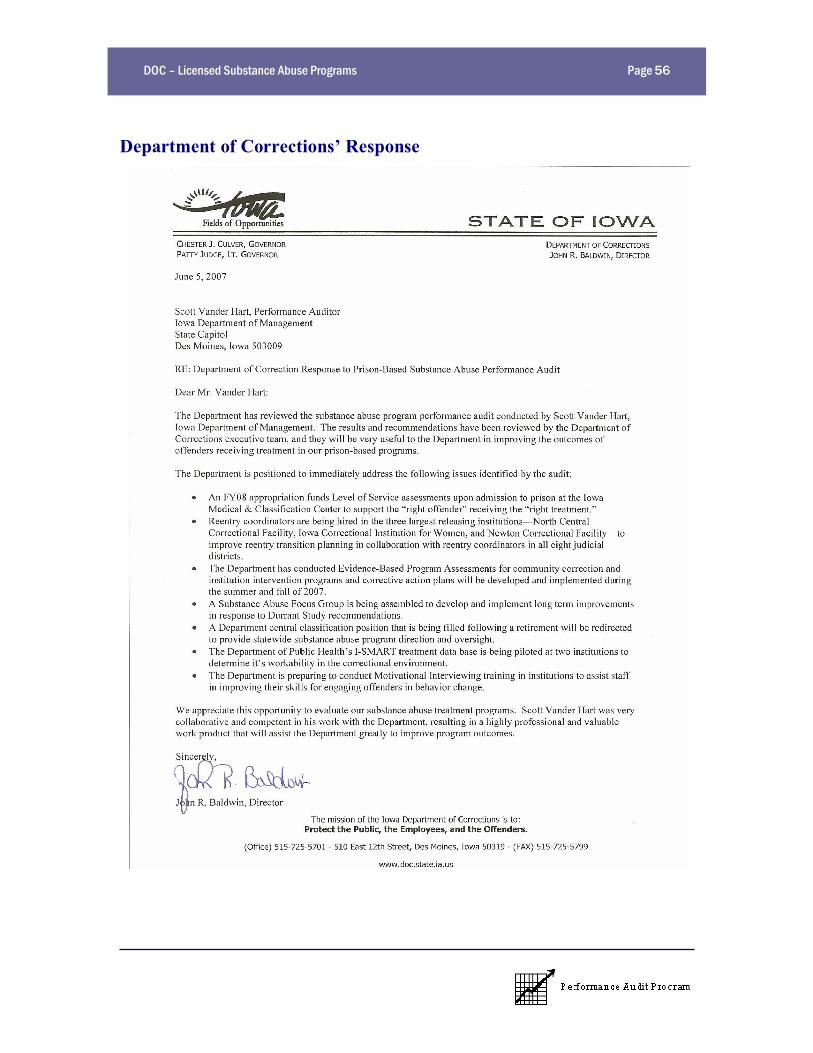
DOC Licensed Substance Abuse Programs Page 56
Department of Corrections Response
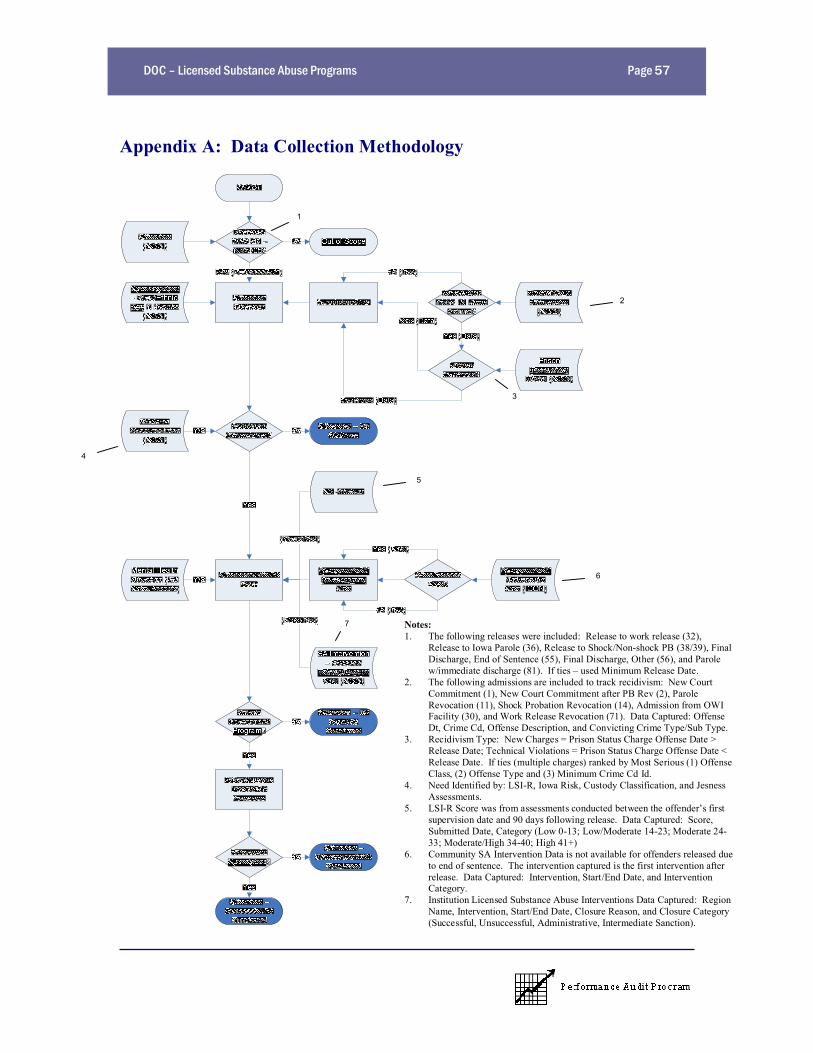
DOC Licensed Substance Abuse Programs Page 57
Notes:1. The following releases were included: Release to work release (32),
Release to Iowa Parole (36), Release to Shock/Non-shock PB (38/39), FinalDischarge, End of Sentence (55), Final Discharge, Other (56), and Parolew/immediate discharge (81). If ties used Minimum Release Date.
2. The following admissions are included to track recidivism: New CourtCommitment (1), New Court Commitment after PB Rev (2), ParoleRevocation (11), Shock Probation Revocation (14), Admission from OWIFacility (30), and Work Release Revocation (71). Data Captured: OffenseDt, Crime Cd, Offense Description, and Convicting Crime Type/Sub Type.
3. Recidivism Type: New Charges = Prison Status Charge Offense Date >Release Date; Technical Violations = Prison Status Charge Offense Date <Release Date. If ties (multiple charges) ranked by Most Serious (1) OffenseClass, (2) Offense Type and (3) Minimum Crime Cd Id.
4. Need Identified by: LSI-R, Iowa Risk, Custody Classification, and JesnessAssessments.
5. LSI-R Score was from assessments conducted between the offender s firstsupervision date and 90 days following release. Data Captured: Score,Submitted Date, Category (Low 0-13; Low/Moderate 14-23; Moderate 24-33; Moderate/High 34-40; High 41+)
6. Community SA Intervention Data is not available for offenders released dueto end of sentence. The intervention captured is the first intervention afterrelease. Data Captured: Intervention, Start/End Date, and InterventionCategory.
7. Institution Licensed Substance Abuse Interventions Data Captured: RegionName, Intervention, Start/End Date, Closure Reason, and Closure Category(Successful, Unsuccessful, Administrative, Intermediate Sanction).
Appendix A: Data Collection Methodology
1
2
3
4
5
6
7
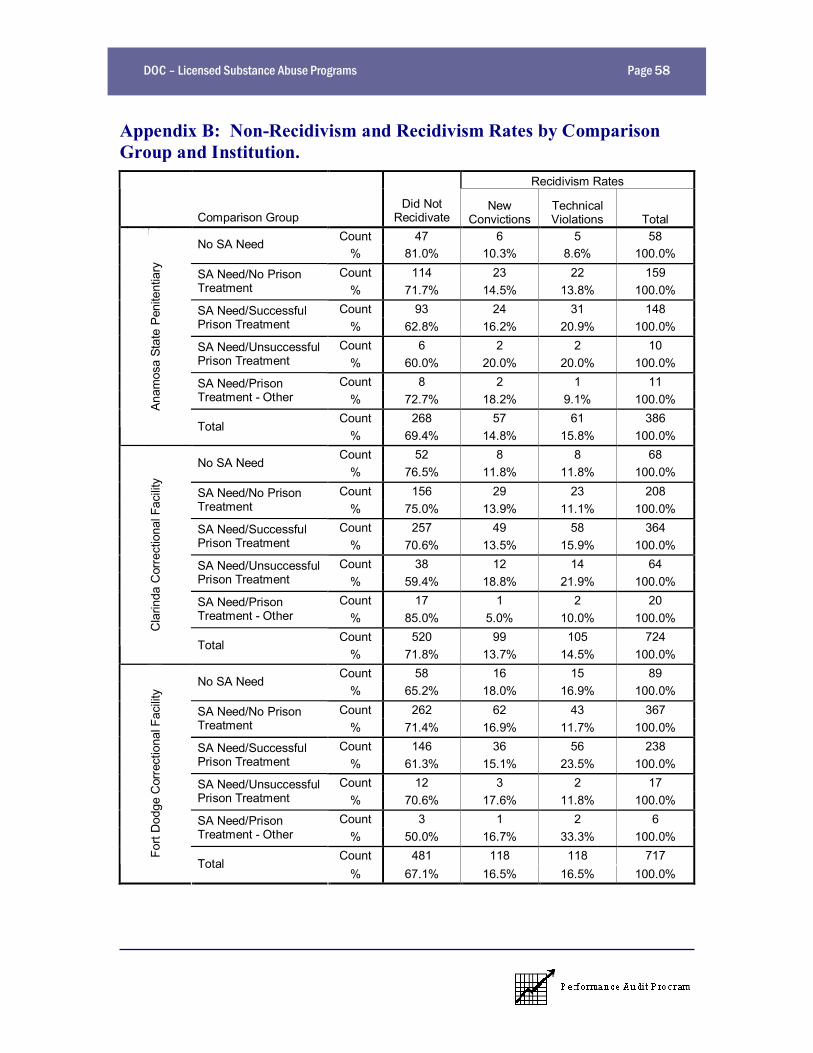
DOC Licensed Substance Abuse Programs Page 58
Appendix B: Non-Recidivism and Recidivism Rates by ComparisonGroup and Institution.
Recidivism Rates
InstitutionComparison Group
Did NotRecidivate
NewConvictions
TechnicalViolations Total
Count 47 6 5 58No SA Need% 81.0% 10.3% 8.6% 100.0%
Count 114 23 22 159SA Need/No PrisonTreatment % 71.7% 14.5% 13.8% 100.0%
Count 93 24 31 148SA Need/SuccessfulPrison Treatment % 62.8% 16.2% 20.9% 100.0%
Count 6 2 2 10SA Need/UnsuccessfulPrison Treatment % 60.0% 20.0% 20.0% 100.0%
Count 8 2 1 11SA Need/PrisonTreatment - Other % 72.7% 18.2% 9.1% 100.0%
Count 268 57 61 386
Anam
osa
Stat
e Pe
nite
ntia
ry
Total% 69.4% 14.8% 15.8% 100.0%
Count 52 8 8 68No SA Need
% 76.5% 11.8% 11.8% 100.0%Count 156 29 23 208SA Need/No Prison
Treatment % 75.0% 13.9% 11.1% 100.0%Count 257 49 58 364SA Need/Successful
Prison Treatment % 70.6% 13.5% 15.9% 100.0%Count 38 12 14 64SA Need/Unsuccessful
Prison Treatment % 59.4% 18.8% 21.9% 100.0%Count 17 1 2 20SA Need/Prison
Treatment - Other % 85.0% 5.0% 10.0% 100.0%Count 520 99 105 724
Cla
rinda
Cor
rect
iona
l Fac
ility
Total% 71.8% 13.7% 14.5% 100.0%
Count 58 16 15 89No SA Need
% 65.2% 18.0% 16.9% 100.0%Count 262 62 43 367SA Need/No Prison
Treatment % 71.4% 16.9% 11.7% 100.0%Count 146 36 56 238SA Need/Successful
Prison Treatment % 61.3% 15.1% 23.5% 100.0%Count 12 3 2 17SA Need/Unsuccessful
Prison Treatment % 70.6% 17.6% 11.8% 100.0%Count 3 1 2 6SA Need/Prison
Treatment - Other % 50.0% 16.7% 33.3% 100.0%Count 481 118 118 717Fo
rt D
odge
Cor
rect
iona
l Fac
ility
Total% 67.1% 16.5% 16.5% 100.0%
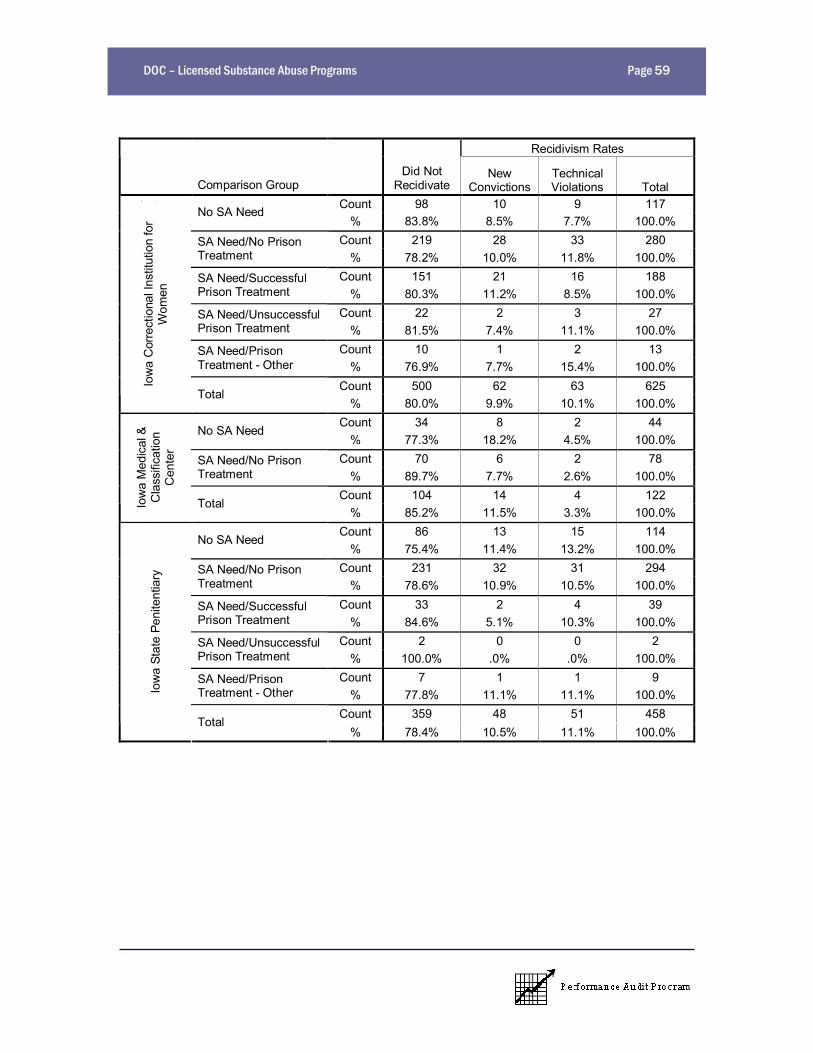
DOC Licensed Substance Abuse Programs Page 59
Recidivism Rates
InstitutionComparison Group
Did NotRecidivate
NewConvictions
TechnicalViolations Total
Count 98 10 9 117No SA Need% 83.8% 8.5% 7.7% 100.0%
Count 219 28 33 280SA Need/No PrisonTreatment % 78.2% 10.0% 11.8% 100.0%
Count 151 21 16 188SA Need/SuccessfulPrison Treatment % 80.3% 11.2% 8.5% 100.0%
Count 22 2 3 27SA Need/UnsuccessfulPrison Treatment % 81.5% 7.4% 11.1% 100.0%
Count 10 1 2 13SA Need/PrisonTreatment - Other % 76.9% 7.7% 15.4% 100.0%
Count 500 62 63 625Iow
a C
orre
ctio
nal I
nstit
utio
n fo
rW
omen
Total% 80.0% 9.9% 10.1% 100.0%
Count 34 8 2 44No SA Need
% 77.3% 18.2% 4.5% 100.0%Count 70 6 2 78SA Need/No Prison
Treatment % 89.7% 7.7% 2.6% 100.0%Count 104 14 4 122
Iow
a M
edic
al &
Cla
ssifi
catio
nC
ente
r
Total% 85.2% 11.5% 3.3% 100.0%
Count 86 13 15 114No SA Need
% 75.4% 11.4% 13.2% 100.0%Count 231 32 31 294SA Need/No Prison
Treatment % 78.6% 10.9% 10.5% 100.0%Count 33 2 4 39SA Need/Successful
Prison Treatment % 84.6% 5.1% 10.3% 100.0%Count 2 0 0 2SA Need/Unsuccessful
Prison Treatment % 100.0% .0% .0% 100.0%Count 7 1 1 9SA Need/Prison
Treatment - Other % 77.8% 11.1% 11.1% 100.0%Count 359 48 51 458
Iow
a St
ate
Peni
tent
iary
Total% 78.4% 10.5% 11.1% 100.0%
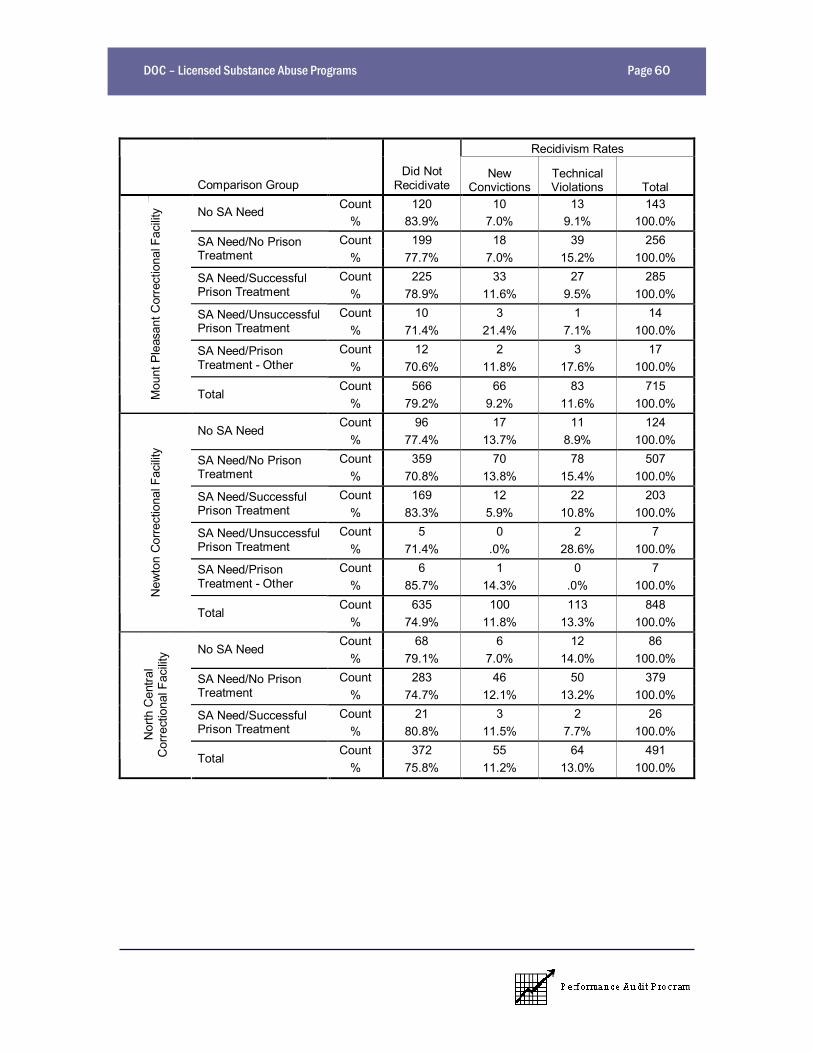
DOC Licensed Substance Abuse Programs Page 60
Recidivism Rates
InstitutionComparison Group
Did NotRecidivate
NewConvictions
TechnicalViolations Total
Count 120 10 13 143No SA Need% 83.9% 7.0% 9.1% 100.0%
Count 199 18 39 256SA Need/No PrisonTreatment % 77.7% 7.0% 15.2% 100.0%
Count 225 33 27 285SA Need/SuccessfulPrison Treatment % 78.9% 11.6% 9.5% 100.0%
Count 10 3 1 14SA Need/UnsuccessfulPrison Treatment % 71.4% 21.4% 7.1% 100.0%
Count 12 2 3 17SA Need/PrisonTreatment - Other % 70.6% 11.8% 17.6% 100.0%
Count 566 66 83 715
Mou
nt P
leas
ant C
orre
ctio
nal F
acilit
y
Total% 79.2% 9.2% 11.6% 100.0%
Count 96 17 11 124No SA Need
% 77.4% 13.7% 8.9% 100.0%Count 359 70 78 507SA Need/No Prison
Treatment % 70.8% 13.8% 15.4% 100.0%Count 169 12 22 203SA Need/Successful
Prison Treatment % 83.3% 5.9% 10.8% 100.0%Count 5 0 2 7SA Need/Unsuccessful
Prison Treatment % 71.4% .0% 28.6% 100.0%Count 6 1 0 7SA Need/Prison
Treatment - Other % 85.7% 14.3% .0% 100.0%Count 635 100 113 848
New
ton
Cor
rect
iona
l Fac
ility
Total% 74.9% 11.8% 13.3% 100.0%
Count 68 6 12 86No SA Need
% 79.1% 7.0% 14.0% 100.0%Count 283 46 50 379SA Need/No Prison
Treatment % 74.7% 12.1% 13.2% 100.0%Count 21 3 2 26SA Need/Successful
Prison Treatment % 80.8% 11.5% 7.7% 100.0%Count 372 55 64 491
Nor
th C
entra
lC
orre
ctio
nal F
acilit
y
Total% 75.8% 11.2% 13.0% 100.0%
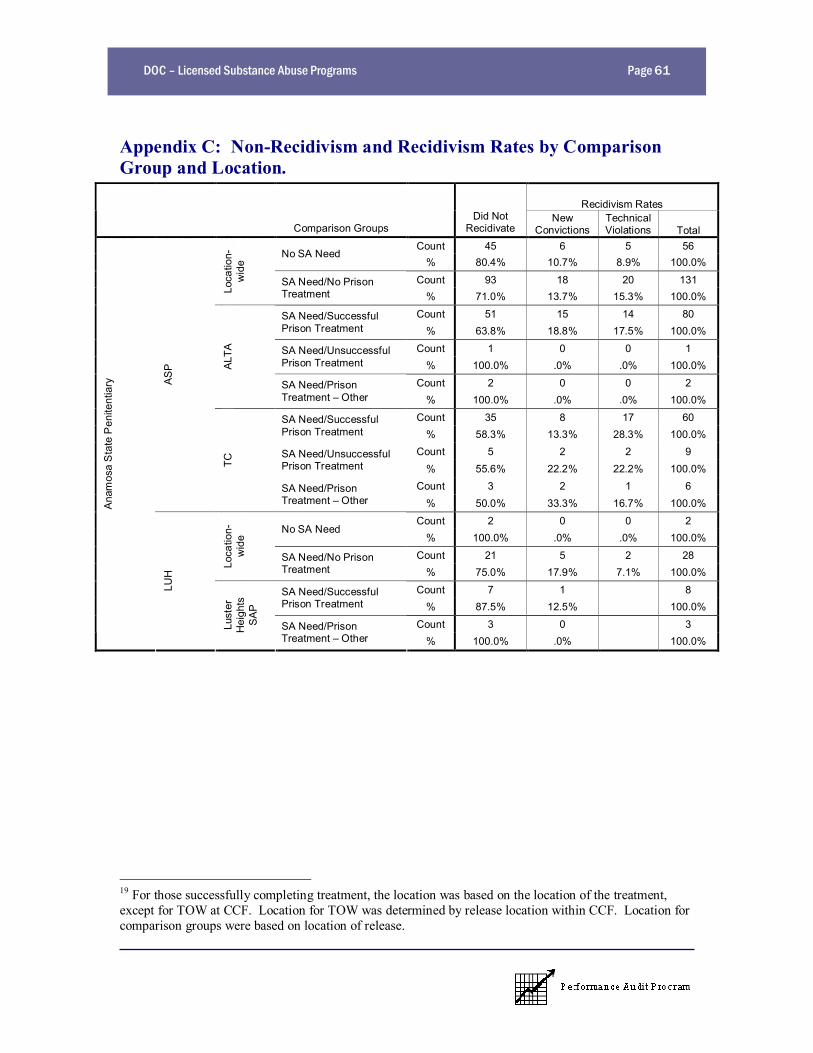
DOC Licensed Substance Abuse Programs Page 61
Appendix C: Non-Recidivism and Recidivism Rates by ComparisonGroup and Location.
Recidivism Rates
Institution Location19
ProgramComparison Groups
Did NotRecidivate
NewConvictions
TechnicalViolations Total
Count 45 6 5 56No SA Need
% 80.4% 10.7% 8.9% 100.0%
Count 93 18 20 131
Loca
tion-
wid
e
SA Need/No PrisonTreatment % 71.0% 13.7% 15.3% 100.0%
Count 51 15 14 80SA Need/SuccessfulPrison Treatment % 63.8% 18.8% 17.5% 100.0%
Count 1 0 0 1SA Need/UnsuccessfulPrison Treatment % 100.0% .0% .0% 100.0%
Count 2 0 0 2
ALTA
SA Need/PrisonTreatment Other % 100.0% .0% .0% 100.0%
Count 35 8 17 60SA Need/SuccessfulPrison Treatment % 58.3% 13.3% 28.3% 100.0%
Count 5 2 2 9SA Need/UnsuccessfulPrison Treatment % 55.6% 22.2% 22.2% 100.0%
Count 3 2 1 6
AS
P
TC
SA Need/PrisonTreatment Other % 50.0% 33.3% 16.7% 100.0%
Count 2 0 0 2No SA Need
% 100.0% .0% .0% 100.0%
Count 21 5 2 28
Loca
tion-
wid
e
SA Need/No PrisonTreatment % 75.0% 17.9% 7.1% 100.0%
Count 7 1 8SA Need/SuccessfulPrison Treatment % 87.5% 12.5% 100.0%
Count 3 0 3
Ana
mos
a S
tate
Pen
itent
iary
LUH
Lust
erH
eigh
tsS
AP
SA Need/PrisonTreatment Other % 100.0% .0% 100.0%
19 For those successfully completing treatment, the location was based on the location of the treatment,except for TOW at CCF. Location for TOW was determined by release location within CCF. Location forcomparison groups were based on location of release.
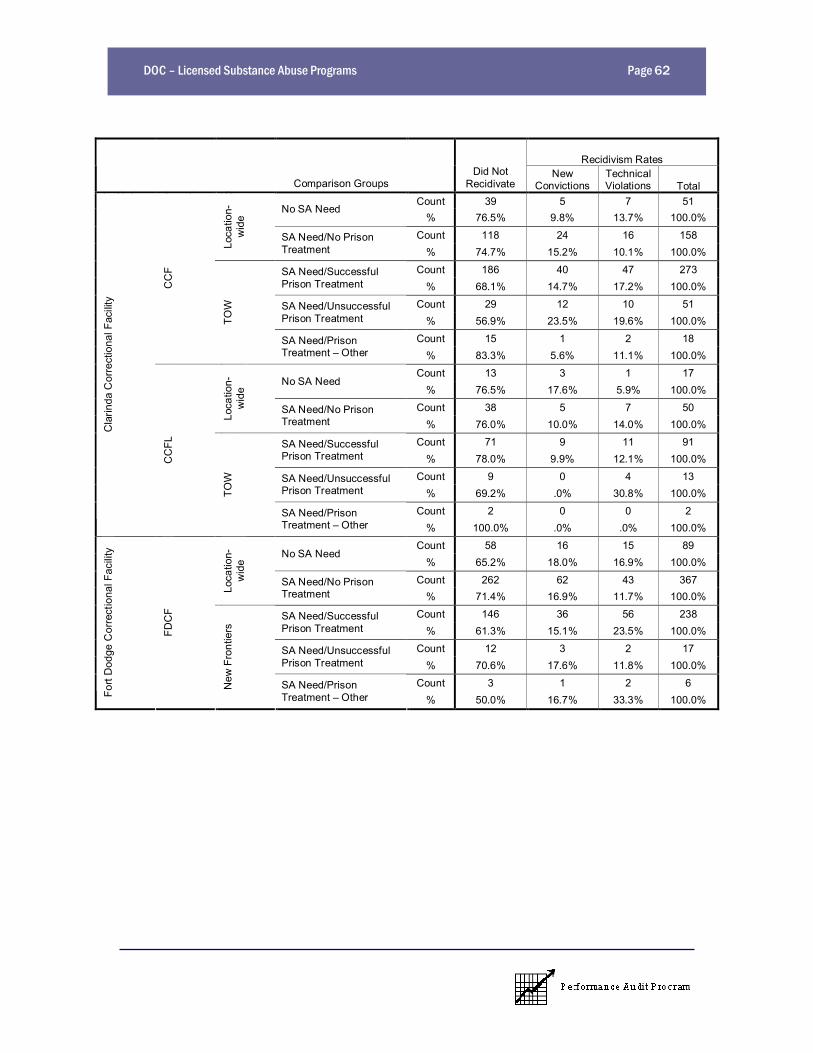
DOC Licensed Substance Abuse Programs Page 62
Recidivism Rates
Institution Location ProgramComparison Groups
Did NotRecidivate
NewConvictions
TechnicalViolations Total
Count 39 5 7 51No SA Need
% 76.5% 9.8% 13.7% 100.0%
Count 118 24 16 158Lo
catio
n-w
ide
SA Need/No PrisonTreatment % 74.7% 15.2% 10.1% 100.0%
Count 186 40 47 273SA Need/SuccessfulPrison Treatment % 68.1% 14.7% 17.2% 100.0%
Count 29 12 10 51SA Need/UnsuccessfulPrison Treatment % 56.9% 23.5% 19.6% 100.0%
Count 15 1 2 18
CC
F
TOW
SA Need/PrisonTreatment Other % 83.3% 5.6% 11.1% 100.0%
Count 13 3 1 17No SA Need
% 76.5% 17.6% 5.9% 100.0%
Count 38 5 7 50
Loca
tion-
wid
e
SA Need/No PrisonTreatment % 76.0% 10.0% 14.0% 100.0%
Count 71 9 11 91SA Need/SuccessfulPrison Treatment % 78.0% 9.9% 12.1% 100.0%
Count 9 0 4 13SA Need/UnsuccessfulPrison Treatment % 69.2% .0% 30.8% 100.0%
Count 2 0 0 2
Cla
rinda
Cor
rect
iona
l Fac
ility
CC
FL
TOW
SA Need/PrisonTreatment Other % 100.0% .0% .0% 100.0%
Count 58 16 15 89No SA Need
% 65.2% 18.0% 16.9% 100.0%
Count 262 62 43 367
Loca
tion-
wid
e
SA Need/No PrisonTreatment % 71.4% 16.9% 11.7% 100.0%
Count 146 36 56 238SA Need/SuccessfulPrison Treatment % 61.3% 15.1% 23.5% 100.0%
Count 12 3 2 17SA Need/UnsuccessfulPrison Treatment % 70.6% 17.6% 11.8% 100.0%
Count 3 1 2 6
Fort
Dod
ge C
orre
ctio
nal F
acili
ty
FDC
F
New
Fro
ntie
rs
SA Need/PrisonTreatment Other % 50.0% 16.7% 33.3% 100.0%
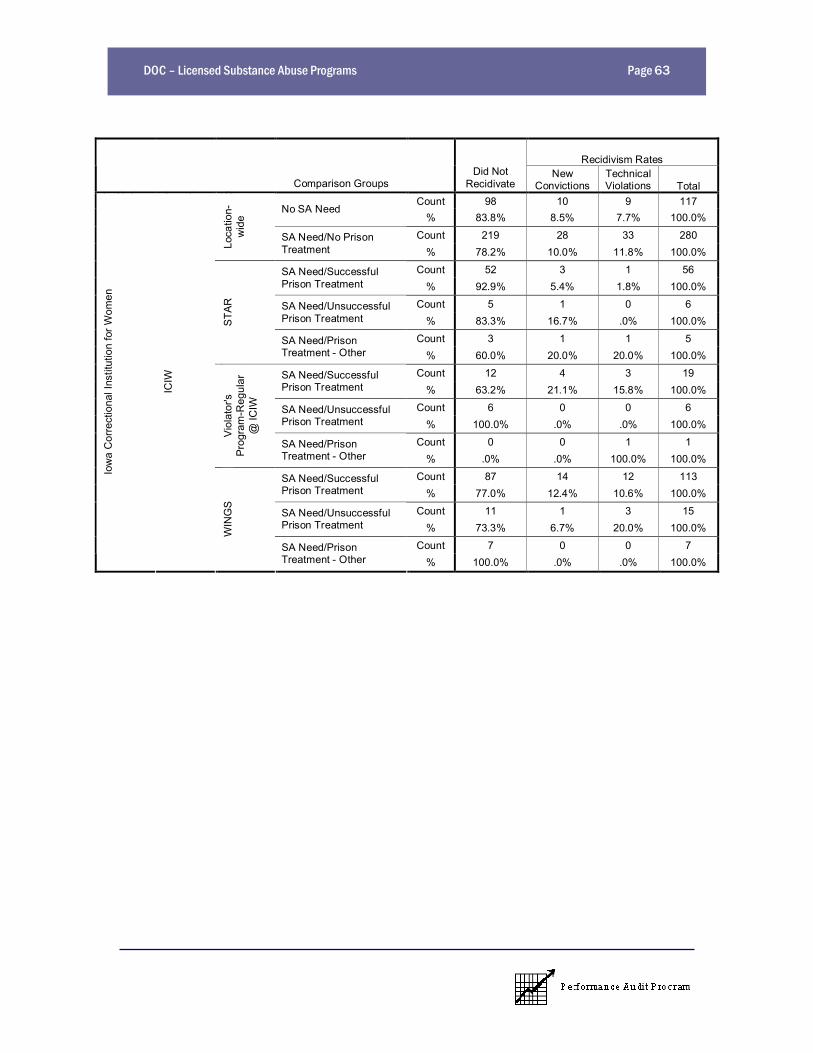
DOC Licensed Substance Abuse Programs Page 63
Recidivism Rates
Institution Location ProgramComparison Groups
Did NotRecidivate
NewConvictions
TechnicalViolations Total
Count 98 10 9 117No SA Need
% 83.8% 8.5% 7.7% 100.0%
Count 219 28 33 280Lo
catio
n-w
ide
SA Need/No PrisonTreatment % 78.2% 10.0% 11.8% 100.0%
Count 52 3 1 56SA Need/SuccessfulPrison Treatment % 92.9% 5.4% 1.8% 100.0%
Count 5 1 0 6SA Need/UnsuccessfulPrison Treatment % 83.3% 16.7% .0% 100.0%
Count 3 1 1 5
STAR
SA Need/PrisonTreatment - Other % 60.0% 20.0% 20.0% 100.0%
Count 12 4 3 19SA Need/SuccessfulPrison Treatment % 63.2% 21.1% 15.8% 100.0%
Count 6 0 0 6SA Need/UnsuccessfulPrison Treatment % 100.0% .0% .0% 100.0%
Count 0 0 1 1
Vio
lato
r'sP
rogr
am-R
egul
ar@
ICIW
SA Need/PrisonTreatment - Other % .0% .0% 100.0% 100.0%
Count 87 14 12 113SA Need/SuccessfulPrison Treatment % 77.0% 12.4% 10.6% 100.0%
Count 11 1 3 15SA Need/UnsuccessfulPrison Treatment % 73.3% 6.7% 20.0% 100.0%
Count 7 0 0 7
Iow
a C
orre
ctio
nal I
nstit
utio
n fo
r Wom
en
ICIW
WIN
GS
SA Need/PrisonTreatment - Other % 100.0% .0% .0% 100.0%
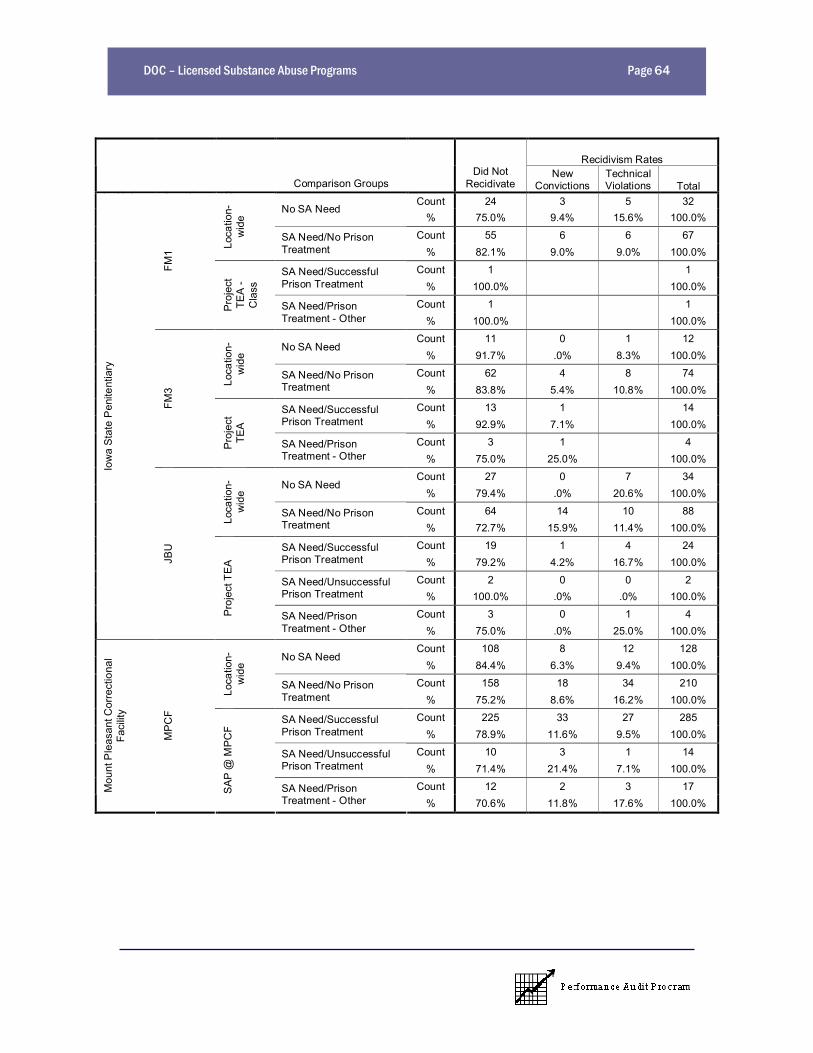
DOC Licensed Substance Abuse Programs Page 64
Recidivism Rates
Institution Location ProgramComparison Groups
Did NotRecidivate
NewConvictions
TechnicalViolations Total
Count 24 3 5 32No SA Need
% 75.0% 9.4% 15.6% 100.0%
Count 55 6 6 67Lo
catio
n-w
ide
SA Need/No PrisonTreatment % 82.1% 9.0% 9.0% 100.0%
Count 1 1SA Need/SuccessfulPrison Treatment % 100.0% 100.0%
Count 1 1
FM1
Pro
ject
TEA
-C
lass
SA Need/PrisonTreatment - Other % 100.0% 100.0%
Count 11 0 1 12No SA Need
% 91.7% .0% 8.3% 100.0%
Count 62 4 8 74
Loca
tion-
wid
e
SA Need/No PrisonTreatment % 83.8% 5.4% 10.8% 100.0%
Count 13 1 14SA Need/SuccessfulPrison Treatment % 92.9% 7.1% 100.0%
Count 3 1 4
FM3
Pro
ject
TEA
SA Need/PrisonTreatment - Other % 75.0% 25.0% 100.0%
Count 27 0 7 34No SA Need
% 79.4% .0% 20.6% 100.0%
Count 64 14 10 88
Loca
tion-
wid
e
SA Need/No PrisonTreatment % 72.7% 15.9% 11.4% 100.0%
Count 19 1 4 24SA Need/SuccessfulPrison Treatment % 79.2% 4.2% 16.7% 100.0%
Count 2 0 0 2SA Need/UnsuccessfulPrison Treatment % 100.0% .0% .0% 100.0%
Count 3 0 1 4
Iow
a S
tate
Pen
itent
iary
JBU
Pro
ject
TE
A
SA Need/PrisonTreatment - Other % 75.0% .0% 25.0% 100.0%
Count 108 8 12 128No SA Need
% 84.4% 6.3% 9.4% 100.0%
Count 158 18 34 210
Loca
tion-
wid
e
SA Need/No PrisonTreatment % 75.2% 8.6% 16.2% 100.0%
Count 225 33 27 285SA Need/SuccessfulPrison Treatment % 78.9% 11.6% 9.5% 100.0%
Count 10 3 1 14SA Need/UnsuccessfulPrison Treatment % 71.4% 21.4% 7.1% 100.0%
Count 12 2 3 17Mou
nt P
leas
ant C
orre
ctio
nal
Faci
lity
MP
CF
SA
P @
MP
CF
SA Need/PrisonTreatment - Other % 70.6% 11.8% 17.6% 100.0%
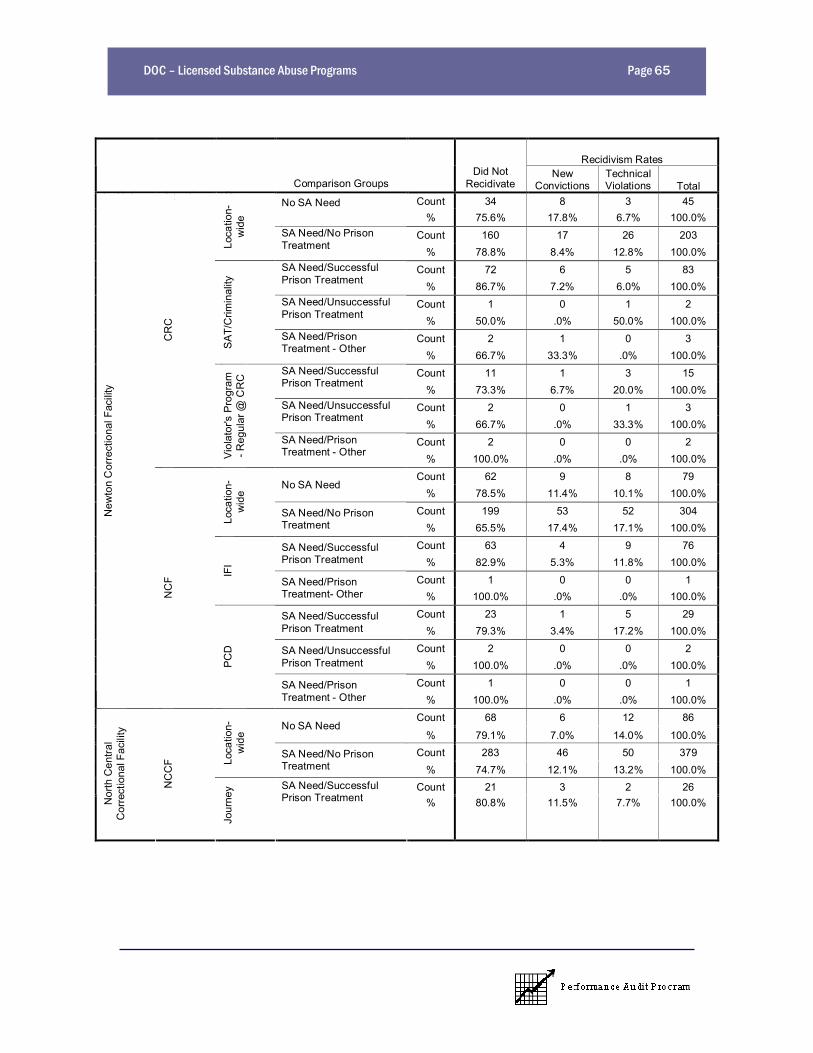
DOC Licensed Substance Abuse Programs Page 65
Recidivism Rates
Institution Location ProgramComparison Groups
Did NotRecidivate
NewConvictions
TechnicalViolations Total
Count 34 8 3 45No SA Need% 75.6% 17.8% 6.7% 100.0%
Count 160 17 26 203Lo
catio
n-w
ide
SA Need/No PrisonTreatment % 78.8% 8.4% 12.8% 100.0%
Count 72 6 5 83SA Need/SuccessfulPrison Treatment % 86.7% 7.2% 6.0% 100.0%
Count 1 0 1 2SA Need/UnsuccessfulPrison Treatment % 50.0% .0% 50.0% 100.0%
Count 2 1 0 3SA
T/C
rimin
ality
SA Need/PrisonTreatment - Other
% 66.7% 33.3% .0% 100.0%
Count 11 1 3 15SA Need/SuccessfulPrison Treatment
% 73.3% 6.7% 20.0% 100.0%
Count 2 0 1 3SA Need/UnsuccessfulPrison Treatment
% 66.7% .0% 33.3% 100.0%
Count 2 0 0 2
CR
C
Vio
lato
r's P
rogr
am- R
egul
ar @
CR
C
SA Need/PrisonTreatment - Other
% 100.0% .0% .0% 100.0%
Count 62 9 8 79No SA Need
% 78.5% 11.4% 10.1% 100.0%
Count 199 53 52 304
Loca
tion-
wid
e
SA Need/No PrisonTreatment % 65.5% 17.4% 17.1% 100.0%
Count 63 4 9 76SA Need/SuccessfulPrison Treatment % 82.9% 5.3% 11.8% 100.0%
Count 1 0 0 1IFI
SA Need/PrisonTreatment- Other % 100.0% .0% .0% 100.0%
Count 23 1 5 29SA Need/SuccessfulPrison Treatment % 79.3% 3.4% 17.2% 100.0%
Count 2 0 0 2SA Need/UnsuccessfulPrison Treatment % 100.0% .0% .0% 100.0%
Count 1 0 0 1
New
ton
Cor
rect
iona
l Fac
ility
NC
F
PC
D
SA Need/PrisonTreatment - Other % 100.0% .0% .0% 100.0%
Count 68 6 12 86No SA Need
% 79.1% 7.0% 14.0% 100.0%Count 283 46 50 379
Loca
tion-
wid
e
SA Need/No PrisonTreatment % 74.7% 12.1% 13.2% 100.0%
Count 21 3 2 26
Nor
th C
entra
lC
orre
ctio
nal F
acili
ty
NC
CF
Jour
ney SA Need/Successful
Prison Treatment % 80.8% 11.5% 7.7% 100.0%
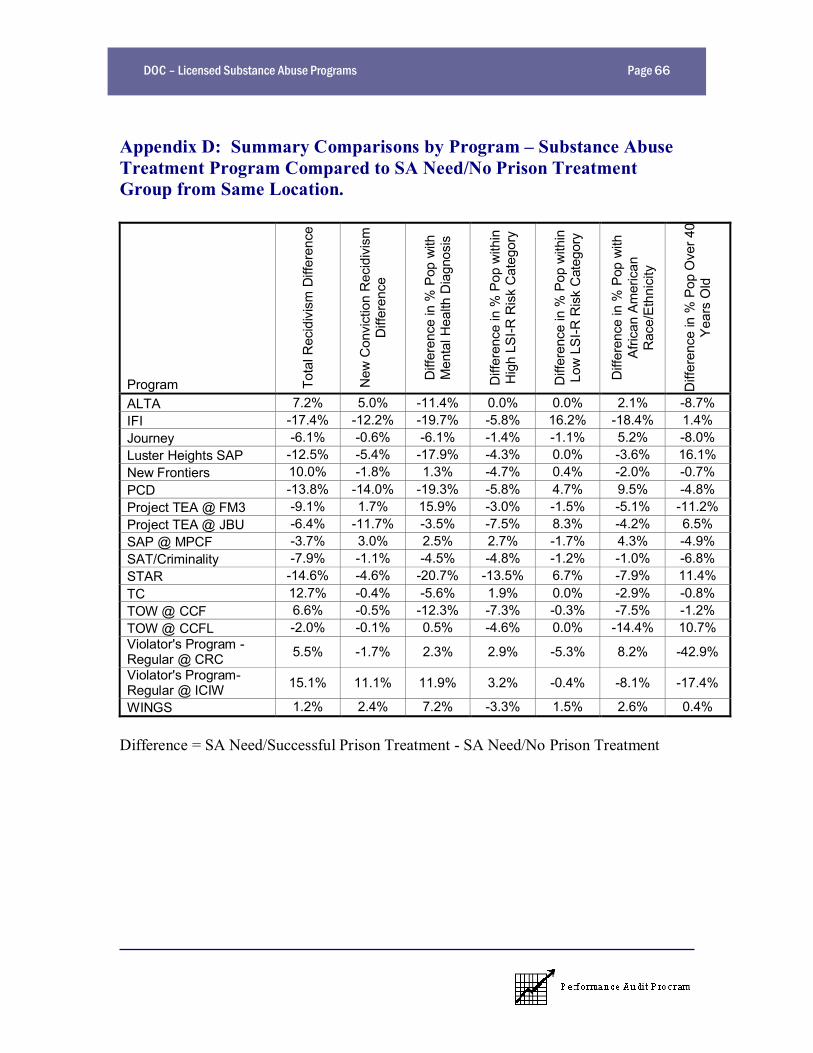
DOC Licensed Substance Abuse Programs Page 66
Appendix D: Summary Comparisons by Program Substance AbuseTreatment Program Compared to SA Need/No Prison TreatmentGroup from Same Location.
Program Tota
l Rec
idiv
ism
Diff
eren
ce
New
Con
vict
ion
Rec
idiv
ism
Diff
eren
ce
Diff
eren
ce in
% P
op w
ithM
enta
l Hea
lth D
iagn
osis
Diff
eren
ce in
% P
op w
ithin
Hig
h LS
I-R R
isk
Cat
egor
y
Diff
eren
ce in
% P
op w
ithin
Low
LSI
-R R
isk
Cat
egor
y
Diff
eren
ce in
% P
op w
ithAf
rican
Am
eric
anR
ace/
Ethn
icity
Diff
eren
ce in
% P
op O
ver 4
0Y
ears
Old
ALTA 7.2% 5.0% -11.4% 0.0% 0.0% 2.1% -8.7%IFI -17.4% -12.2% -19.7% -5.8% 16.2% -18.4% 1.4%Journey -6.1% -0.6% -6.1% -1.4% -1.1% 5.2% -8.0%Luster Heights SAP -12.5% -5.4% -17.9% -4.3% 0.0% -3.6% 16.1%New Frontiers 10.0% -1.8% 1.3% -4.7% 0.4% -2.0% -0.7%PCD -13.8% -14.0% -19.3% -5.8% 4.7% 9.5% -4.8%Project TEA @ FM3 -9.1% 1.7% 15.9% -3.0% -1.5% -5.1% -11.2%Project TEA @ JBU -6.4% -11.7% -3.5% -7.5% 8.3% -4.2% 6.5%SAP @ MPCF -3.7% 3.0% 2.5% 2.7% -1.7% 4.3% -4.9%SAT/Criminality -7.9% -1.1% -4.5% -4.8% -1.2% -1.0% -6.8%STAR -14.6% -4.6% -20.7% -13.5% 6.7% -7.9% 11.4%TC 12.7% -0.4% -5.6% 1.9% 0.0% -2.9% -0.8%TOW @ CCF 6.6% -0.5% -12.3% -7.3% -0.3% -7.5% -1.2%TOW @ CCFL -2.0% -0.1% 0.5% -4.6% 0.0% -14.4% 10.7%Violator's Program -Regular @ CRC 5.5% -1.7% 2.3% 2.9% -5.3% 8.2% -42.9%
Violator's Program-Regular @ ICIW 15.1% 11.1% 11.9% 3.2% -0.4% -8.1% -17.4%
WINGS 1.2% 2.4% 7.2% -3.3% 1.5% 2.6% 0.4%
Difference = SA Need/Successful Prison Treatment - SA Need/No Prison Treatment
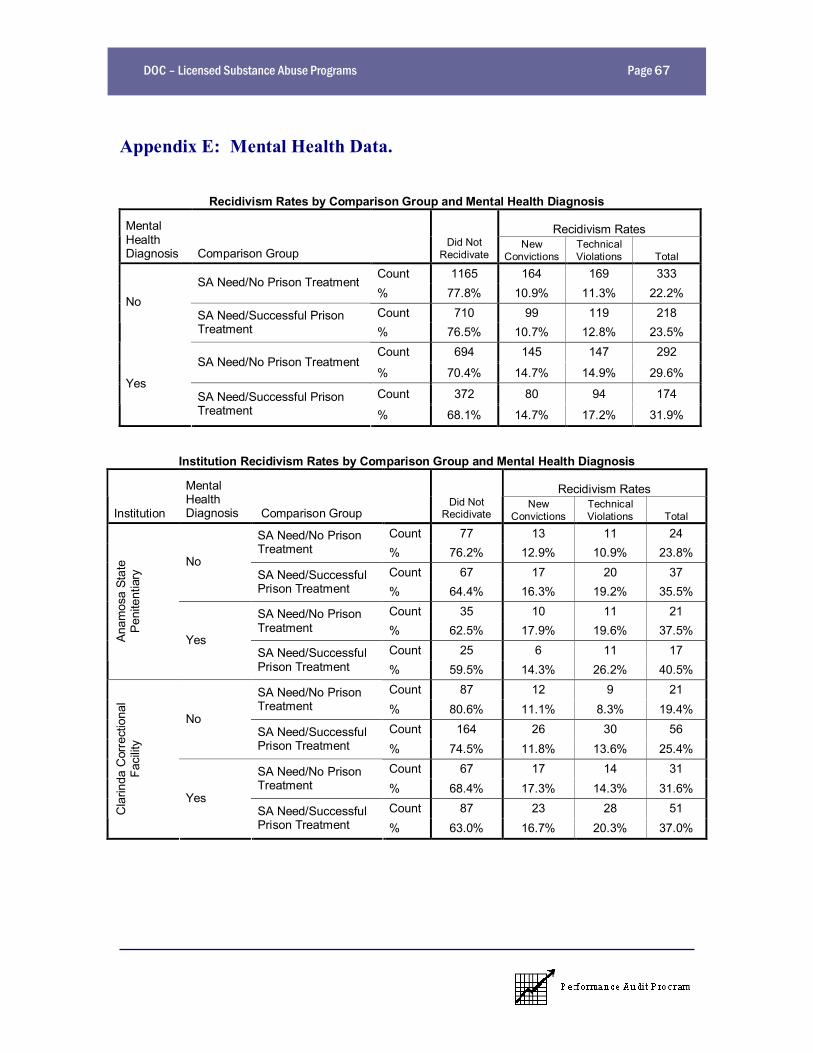
DOC Licensed Substance Abuse Programs Page 67
Appendix E: Mental Health Data.
Recidivism Rates by Comparison Group and Mental Health Diagnosis
Recidivism RatesMentalHealthDiagnosis Comparison Group
Did NotRecidivate
NewConvictions
TechnicalViolations Total
Count 1165 164 169 333SA Need/No Prison Treatment
% 77.8% 10.9% 11.3% 22.2%Count 710 99 119 218
NoSA Need/Successful PrisonTreatment % 76.5% 10.7% 12.8% 23.5%
Count 694 145 147 292SA Need/No Prison Treatment
% 70.4% 14.7% 14.9% 29.6%
Count 372 80 94 174Yes
SA Need/Successful PrisonTreatment % 68.1% 14.7% 17.2% 31.9%
Institution Recidivism Rates by Comparison Group and Mental Health Diagnosis
Recidivism Rates
Institution
MentalHealthDiagnosis Comparison Group
Did NotRecidivate
NewConvictions
TechnicalViolations Total
Count 77 13 11 24SA Need/No PrisonTreatment % 76.2% 12.9% 10.9% 23.8%
Count 67 17 20 37No
SA Need/SuccessfulPrison Treatment % 64.4% 16.3% 19.2% 35.5%
Count 35 10 11 21SA Need/No PrisonTreatment % 62.5% 17.9% 19.6% 37.5%
Count 25 6 11 17
Anam
osa
Stat
ePe
nite
ntia
ry
YesSA Need/SuccessfulPrison Treatment % 59.5% 14.3% 26.2% 40.5%
Count 87 12 9 21SA Need/No PrisonTreatment % 80.6% 11.1% 8.3% 19.4%
Count 164 26 30 56No
SA Need/SuccessfulPrison Treatment % 74.5% 11.8% 13.6% 25.4%
Count 67 17 14 31SA Need/No PrisonTreatment % 68.4% 17.3% 14.3% 31.6%
Count 87 23 28 51Cla
rinda
Cor
rect
iona
lFa
cilit
y
YesSA Need/SuccessfulPrison Treatment % 63.0% 16.7% 20.3% 37.0%
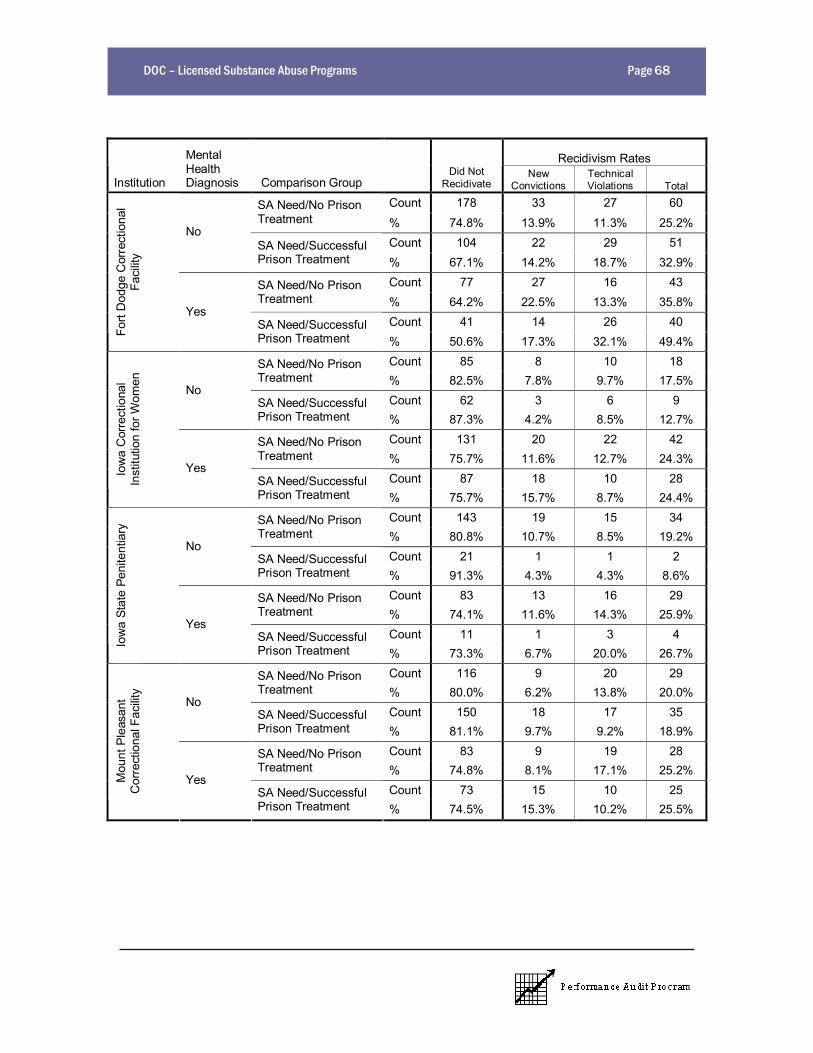
DOC Licensed Substance Abuse Programs Page 68
Recidivism Rates
Institution
MentalHealthDiagnosis Comparison Group
Did NotRecidivate
NewConvictions
TechnicalViolations Total
Count 178 33 27 60SA Need/No PrisonTreatment % 74.8% 13.9% 11.3% 25.2%
Count 104 22 29 51No
SA Need/SuccessfulPrison Treatment % 67.1% 14.2% 18.7% 32.9%
Count 77 27 16 43SA Need/No PrisonTreatment % 64.2% 22.5% 13.3% 35.8%
Count 41 14 26 40
Fort
Dod
ge C
orre
ctio
nal
Faci
lity
YesSA Need/SuccessfulPrison Treatment % 50.6% 17.3% 32.1% 49.4%
Count 85 8 10 18SA Need/No PrisonTreatment % 82.5% 7.8% 9.7% 17.5%
Count 62 3 6 9No
SA Need/SuccessfulPrison Treatment % 87.3% 4.2% 8.5% 12.7%
Count 131 20 22 42SA Need/No PrisonTreatment % 75.7% 11.6% 12.7% 24.3%
Count 87 18 10 28Iow
a C
orre
ctio
nal
Inst
itutio
n fo
r Wom
en
YesSA Need/SuccessfulPrison Treatment % 75.7% 15.7% 8.7% 24.4%
Count 143 19 15 34SA Need/No PrisonTreatment % 80.8% 10.7% 8.5% 19.2%
Count 21 1 1 2No
SA Need/SuccessfulPrison Treatment % 91.3% 4.3% 4.3% 8.6%
Count 83 13 16 29SA Need/No PrisonTreatment % 74.1% 11.6% 14.3% 25.9%
Count 11 1 3 4
Iow
a St
ate
Peni
tent
iary
YesSA Need/SuccessfulPrison Treatment % 73.3% 6.7% 20.0% 26.7%
Count 116 9 20 29SA Need/No PrisonTreatment % 80.0% 6.2% 13.8% 20.0%
Count 150 18 17 35No
SA Need/SuccessfulPrison Treatment % 81.1% 9.7% 9.2% 18.9%
Count 83 9 19 28SA Need/No PrisonTreatment % 74.8% 8.1% 17.1% 25.2%
Count 73 15 10 25
Mou
nt P
leas
ant
Cor
rect
iona
l Fac
ility
YesSA Need/SuccessfulPrison Treatment % 74.5% 15.3% 10.2% 25.5%
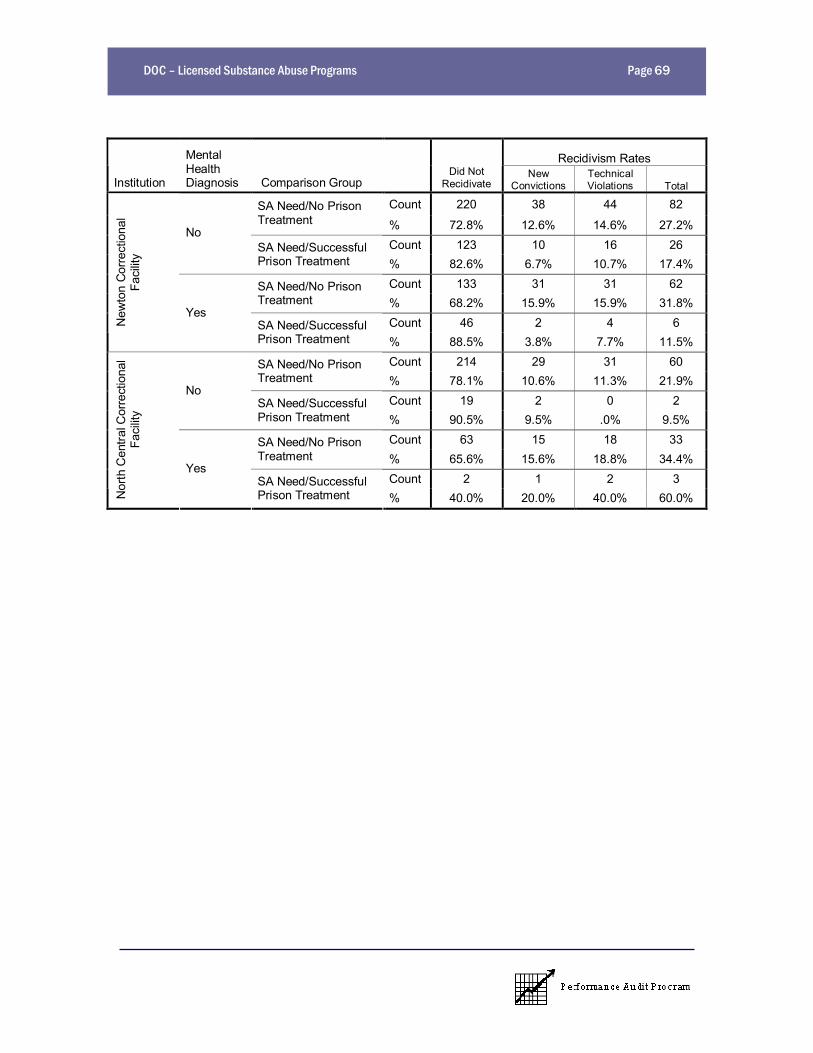
DOC Licensed Substance Abuse Programs Page 69
Recidivism Rates
Institution
MentalHealthDiagnosis Comparison Group
Did NotRecidivate
NewConvictions
TechnicalViolations Total
Count 220 38 44 82SA Need/No PrisonTreatment % 72.8% 12.6% 14.6% 27.2%
Count 123 10 16 26No
SA Need/SuccessfulPrison Treatment % 82.6% 6.7% 10.7% 17.4%
Count 133 31 31 62SA Need/No PrisonTreatment % 68.2% 15.9% 15.9% 31.8%
Count 46 2 4 6New
ton
Cor
rect
iona
lFa
cilit
y
YesSA Need/SuccessfulPrison Treatment % 88.5% 3.8% 7.7% 11.5%
Count 214 29 31 60SA Need/No PrisonTreatment % 78.1% 10.6% 11.3% 21.9%
Count 19 2 0 2No
SA Need/SuccessfulPrison Treatment % 90.5% 9.5% .0% 9.5%
Count 63 15 18 33SA Need/No PrisonTreatment % 65.6% 15.6% 18.8% 34.4%
Count 2 1 2 3
Nor
th C
entra
l Cor
rect
iona
lFa
cilit
y
YesSA Need/SuccessfulPrison Treatment % 40.0% 20.0% 40.0% 60.0%
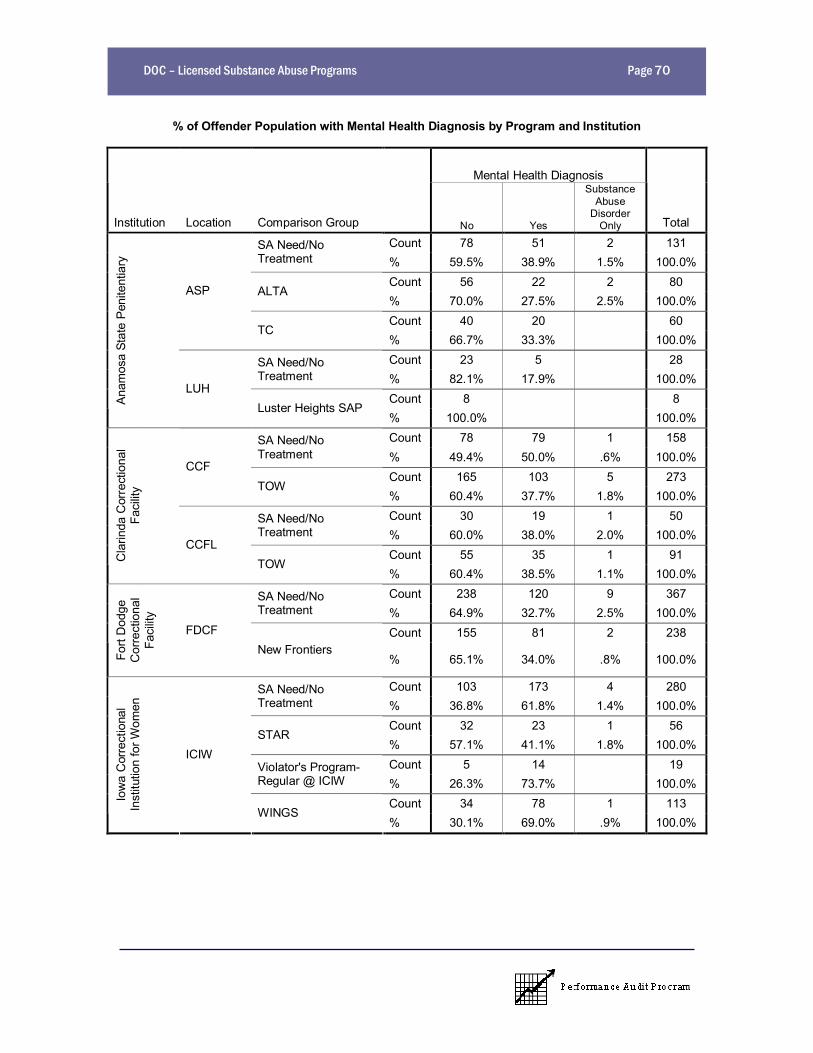
DOC Licensed Substance Abuse Programs Page 70
% of Offender Population with Mental Health Diagnosis by Program and Institution
Mental Health Diagnosis
Institution Location Comparison Group No Yes
SubstanceAbuse
DisorderOnly Total
Count 78 51 2 131SA Need/NoTreatment % 59.5% 38.9% 1.5% 100.0%
Count 56 22 2 80ALTA
% 70.0% 27.5% 2.5% 100.0%Count 40 20 60
ASP
TC% 66.7% 33.3% 100.0%Count 23 5 28SA Need/No
Treatment % 82.1% 17.9% 100.0%Count 8 8An
amos
a St
ate
Peni
tent
iary
LUHLuster Heights SAP
% 100.0% 100.0%Count 78 79 1 158SA Need/No
Treatment % 49.4% 50.0% .6% 100.0%Count 165 103 5 273
CCFTOW
% 60.4% 37.7% 1.8% 100.0%Count 30 19 1 50SA Need/No
Treatment % 60.0% 38.0% 2.0% 100.0%Count 55 35 1 91C
larin
da C
orre
ctio
nal
Faci
lity
CCFLTOW
% 60.4% 38.5% 1.1% 100.0%Count 238 120 9 367SA Need/No
Treatment % 64.9% 32.7% 2.5% 100.0%Count 155 81 2 238
Fort
Dod
geC
orre
ctio
nal
Faci
lity
FDCFNew Frontiers
% 65.1% 34.0% .8% 100.0%
Count 103 173 4 280SA Need/NoTreatment % 36.8% 61.8% 1.4% 100.0%
Count 32 23 1 56STAR
% 57.1% 41.1% 1.8% 100.0%Count 5 14 19Violator's Program-
Regular @ ICIW % 26.3% 73.7% 100.0%Count 34 78 1 113Io
wa
Cor
rect
iona
lIn
stitu
tion
for W
omen
ICIW
WINGS% 30.1% 69.0% .9% 100.0%
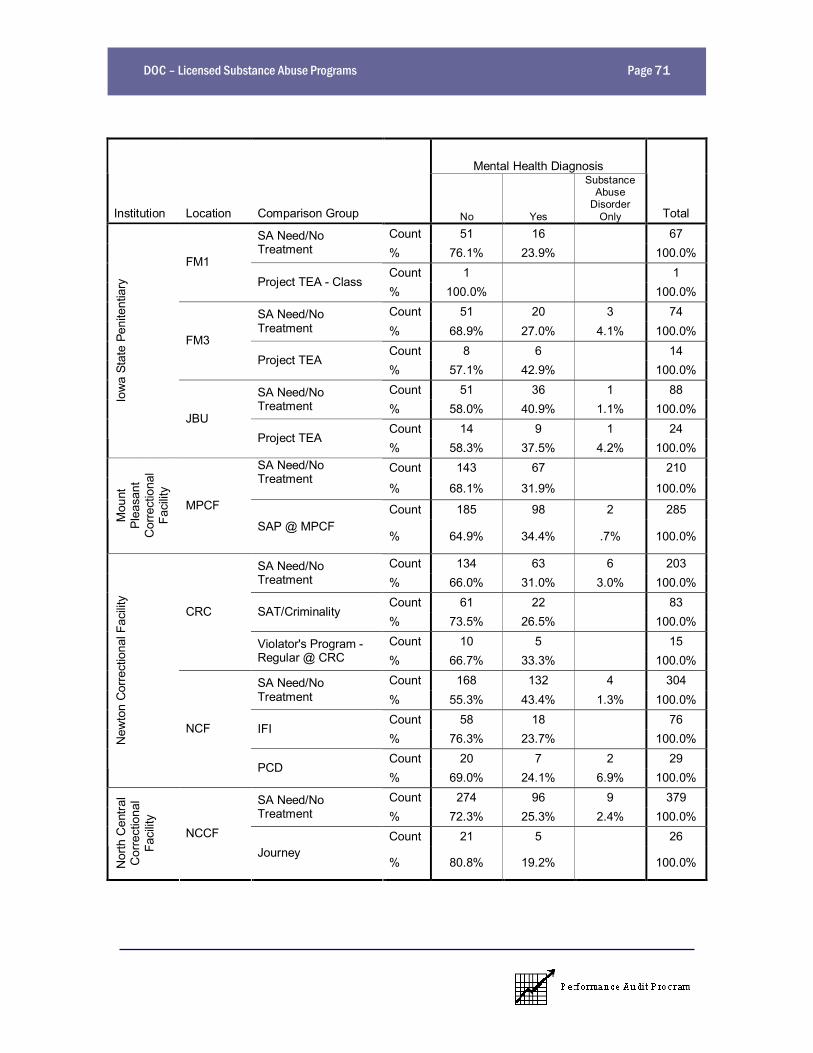
DOC Licensed Substance Abuse Programs Page 71
Mental Health Diagnosis
Institution Location Comparison Group No Yes
SubstanceAbuse
DisorderOnly Total
Count 51 16 67SA Need/NoTreatment % 76.1% 23.9% 100.0%
Count 1 1FM1
Project TEA - Class% 100.0% 100.0%Count 51 20 3 74SA Need/No
Treatment % 68.9% 27.0% 4.1% 100.0%Count 8 6 14
FM3Project TEA
% 57.1% 42.9% 100.0%Count 51 36 1 88SA Need/No
Treatment % 58.0% 40.9% 1.1% 100.0%Count 14 9 1 24
Iow
a St
ate
Peni
tent
iary
JBUProject TEA
% 58.3% 37.5% 4.2% 100.0%Count 143 67 210SA Need/No
Treatment% 68.1% 31.9% 100.0%
Count 185 98 2 285
Mou
ntPl
easa
ntC
orre
ctio
nal
Faci
lity
MPCF
SAP @ MPCF% 64.9% 34.4% .7% 100.0%
Count 134 63 6 203SA Need/NoTreatment % 66.0% 31.0% 3.0% 100.0%
Count 61 22 83SAT/Criminality
% 73.5% 26.5% 100.0%Count 10 5 15
CRC
Violator's Program -Regular @ CRC % 66.7% 33.3% 100.0%
Count 168 132 4 304SA Need/NoTreatment % 55.3% 43.4% 1.3% 100.0%
Count 58 18 76IFI
% 76.3% 23.7% 100.0%Count 20 7 2 29
New
ton
Cor
rect
iona
l Fac
ility
NCF
PCD% 69.0% 24.1% 6.9% 100.0%Count 274 96 9 379SA Need/No
Treatment % 72.3% 25.3% 2.4% 100.0%Count 21 5 26
Nor
th C
entra
lC
orre
ctio
nal
Faci
lity
NCCFJourney
% 80.8% 19.2% 100.0%
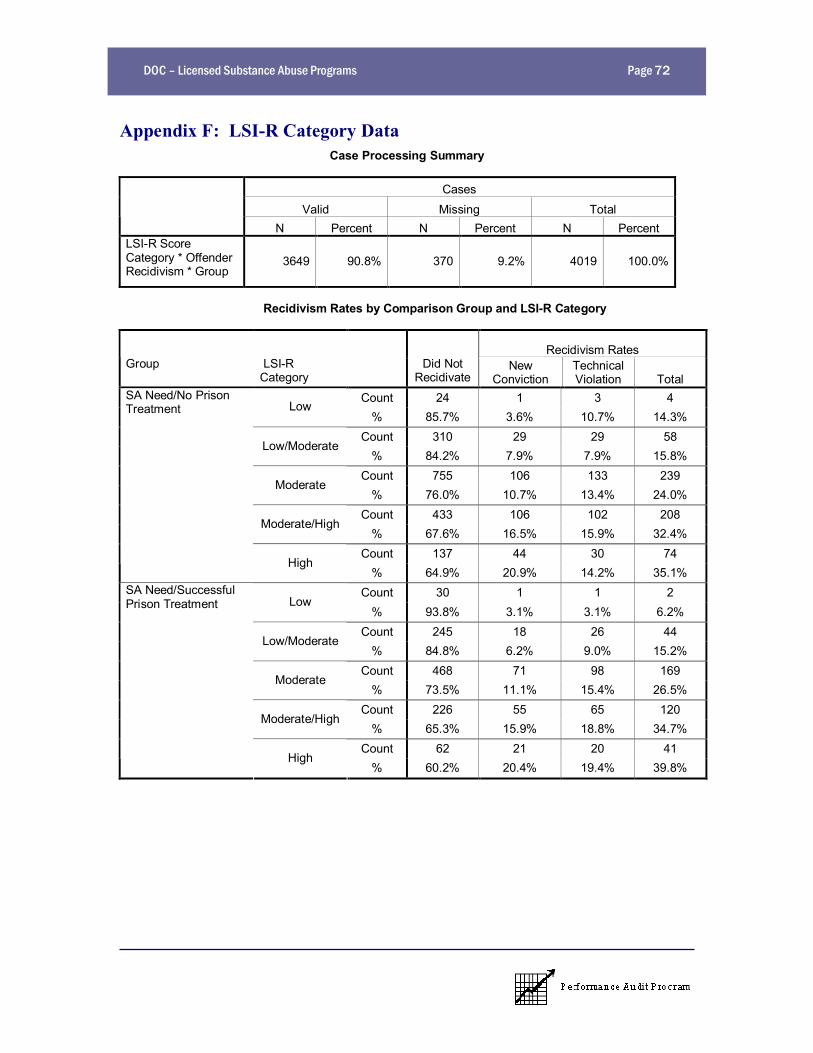
DOC Licensed Substance Abuse Programs Page 72
Appendix F: LSI-R Category DataCase Processing Summary
CasesValid Missing Total
N Percent N Percent N PercentLSI-R ScoreCategory * OffenderRecidivism * Group
3649 90.8% 370 9.2% 4019 100.0%
Recidivism Rates by Comparison Group and LSI-R Category
Recidivism RatesGroup LSI-R
CategoryDid Not
RecidivateNew
ConvictionTechnicalViolation Total
Count 24 1 3 4Low
% 85.7% 3.6% 10.7% 14.3%Count 310 29 29 58
Low/Moderate% 84.2% 7.9% 7.9% 15.8%
Count 755 106 133 239Moderate
% 76.0% 10.7% 13.4% 24.0%Count 433 106 102 208
Moderate/High% 67.6% 16.5% 15.9% 32.4%
Count 137 44 30 74
SA Need/No PrisonTreatment
High% 64.9% 20.9% 14.2% 35.1%
Count 30 1 1 2Low
% 93.8% 3.1% 3.1% 6.2%Count 245 18 26 44
Low/Moderate% 84.8% 6.2% 9.0% 15.2%
Count 468 71 98 169Moderate
% 73.5% 11.1% 15.4% 26.5%Count 226 55 65 120
Moderate/High% 65.3% 15.9% 18.8% 34.7%
Count 62 21 20 41
SA Need/SuccessfulPrison Treatment
High% 60.2% 20.4% 19.4% 39.8%
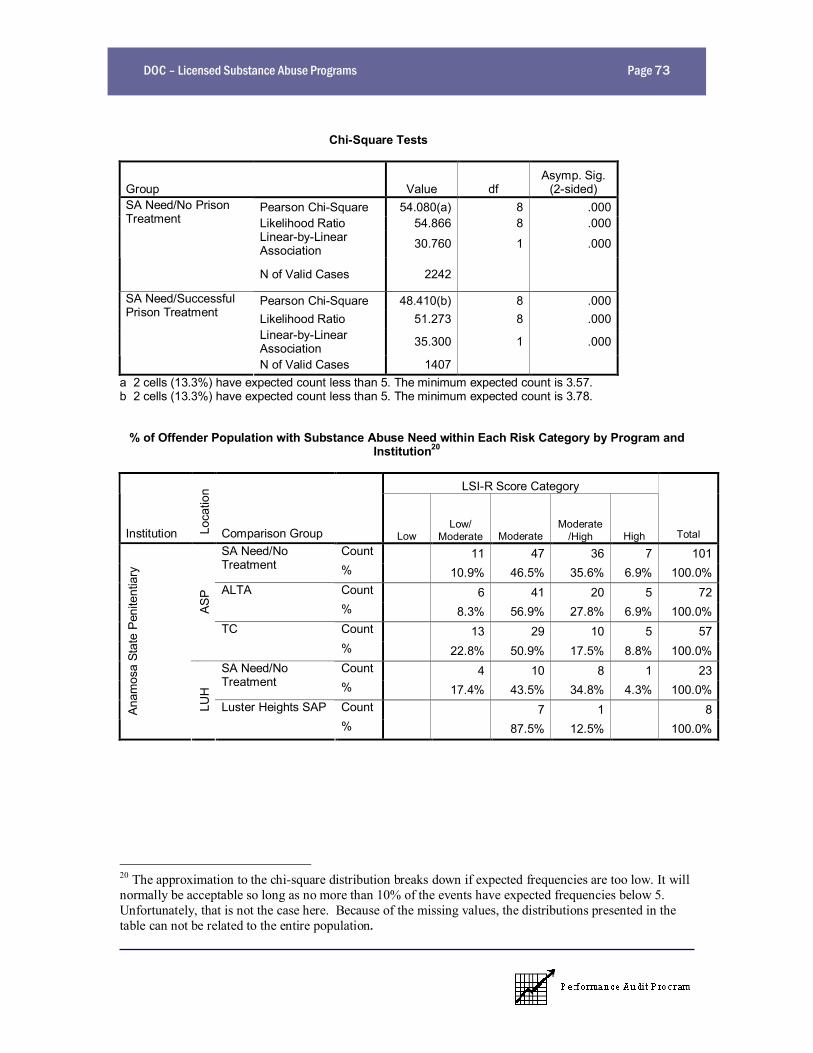
DOC Licensed Substance Abuse Programs Page 73
Chi-Square Tests
Group Value dfAsymp. Sig.
(2-sided)Pearson Chi-Square 54.080(a) 8 .000Likelihood Ratio 54.866 8 .000Linear-by-LinearAssociation 30.760 1 .000
SA Need/No PrisonTreatment
N of Valid Cases 2242
Pearson Chi-Square 48.410(b) 8 .000Likelihood Ratio 51.273 8 .000Linear-by-LinearAssociation 35.300 1 .000
SA Need/SuccessfulPrison Treatment
N of Valid Cases 1407a 2 cells (13.3%) have expected count less than 5. The minimum expected count is 3.57.b 2 cells (13.3%) have expected count less than 5. The minimum expected count is 3.78.
% of Offender Population with Substance Abuse Need within Each Risk Category by Program andInstitution20
LSI-R Score Category
Institution Loca
tion
Comparison Group LowLow/
Moderate ModerateModerate
/High High TotalCount 11 47 36 7 101SA Need/No
Treatment % 10.9% 46.5% 35.6% 6.9% 100.0%Count 6 41 20 5 72ALTA% 8.3% 56.9% 27.8% 6.9% 100.0%Count 13 29 10 5 57
ASP
TC% 22.8% 50.9% 17.5% 8.8% 100.0%Count 4 10 8 1 23SA Need/No
Treatment % 17.4% 43.5% 34.8% 4.3% 100.0%Count 7 1 8An
amos
a St
ate
Peni
tent
iary
LUH
Luster Heights SAP% 87.5% 12.5% 100.0%
20 The approximation to the chi-square distribution breaks down if expected frequencies are too low. It willnormally be acceptable so long as no more than 10% of the events have expected frequencies below 5.Unfortunately, that is not the case here. Because of the missing values, the distributions presented in thetable can not be related to the entire population.

DOC Licensed Substance Abuse Programs Page 74
LSI-R Score Category
Institution Loca
tion
Comparison Group LowLow/
Moderate ModerateModerate
/High High TotalCount 1 20 43 50 27 141SA Need/No
Treatment % .7% 14.2% 30.5% 35.5% 19.1% 100.0%Count 1 33 115 75 30 254C
CF
TOW% .4% 13.0% 45.3% 29.5% 11.8% 100.0%Count 7 25 9 7 48SA Need/No
Treatment % 14.6% 52.1% 18.8% 14.6% 100.0%Count 14 45 22 9 90C
larin
da C
orre
ctio
nal
Faci
lity
CC
FL
TOW% 15.6% 50.0% 24.4% 10.0% 100.0%Count 36 144 106 40 326SA Need/No
Treatment % 11.0% 44.2% 32.5% 12.3% 100.0%Count 1 29 115 63 17 225
Fort
Dod
geC
orre
ctio
nal
Faci
lity
FDC
F
New Frontiers% .4% 12.9% 51.1% 28.0% 7.6% 100.0%
Count 1 40 115 62 34 252SA Need/NoTreatment % .4% 15.9% 45.6% 24.6% 13.5% 100.0%
Count 4 32 17 3 56STAR% 7.1% 57.1% 30.4% 5.4% 100.0%Count 4 4 7 3 18Violator's Program-
Regular @ ICIW % 22.2% 22.2% 38.9% 16.7% 100.0%Count 2 21 48 26 11 108Io
wa
Cor
rect
iona
lIn
stitu
tion
for W
omen
ICIW
WINGS% 1.9% 19.4% 44.4% 24.1% 10.2% 100.0%Count 7 31 24 3 65SA Need/No
Treatment % 10.8% 47.7% 36.9% 4.6% 100.0%Count 1 1FM
1
Project TEA - Class% 100.0% 100.0%Count 1 11 40 13 2 67SA Need/No
Treatment % 1.5% 16.4% 59.7% 19.4% 3.0% 100.0%Count 3 9 1 13FM
3
Project TEA% 23.1% 69.2% 7.7% 100.0%Count 10 41 17 9 77SA Need/No
Treatment % 13.0% 53.2% 22.1% 11.7% 100.0%Count 2 3 14 4 1 24
Iow
a St
ate
Peni
tent
iary
JBU
Project TEA% 8.3% 12.5% 58.3% 16.7% 4.2% 100.0%
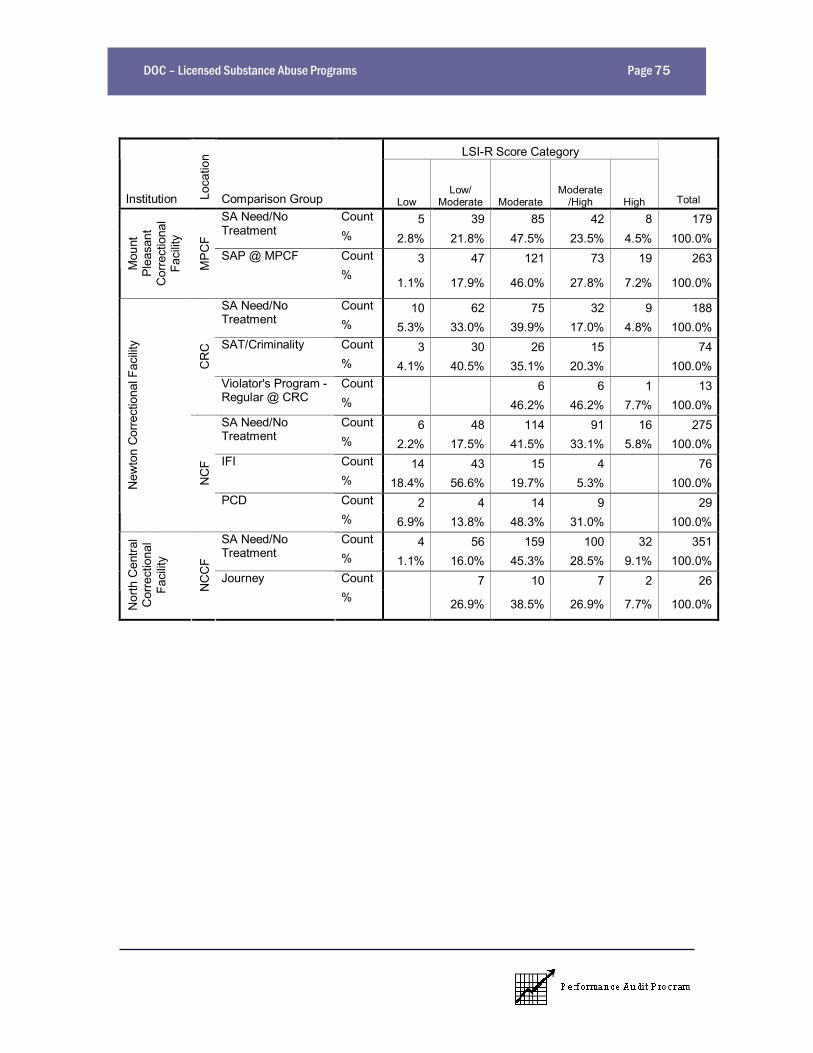
DOC Licensed Substance Abuse Programs Page 75
LSI-R Score Category
Institution Loca
tion
Comparison Group LowLow/
Moderate ModerateModerate
/High High TotalCount 5 39 85 42 8 179SA Need/No
Treatment % 2.8% 21.8% 47.5% 23.5% 4.5% 100.0%Count 3 47 121 73 19 263M
ount
Plea
sant
Cor
rect
iona
lFa
cilit
y
MPC
F
SAP @ MPCF% 1.1% 17.9% 46.0% 27.8% 7.2% 100.0%
Count 10 62 75 32 9 188SA Need/NoTreatment % 5.3% 33.0% 39.9% 17.0% 4.8% 100.0%
Count 3 30 26 15 74SAT/Criminality% 4.1% 40.5% 35.1% 20.3% 100.0%Count 6 6 1 13
CR
C
Violator's Program -Regular @ CRC % 46.2% 46.2% 7.7% 100.0%
Count 6 48 114 91 16 275SA Need/NoTreatment % 2.2% 17.5% 41.5% 33.1% 5.8% 100.0%
Count 14 43 15 4 76IFI% 18.4% 56.6% 19.7% 5.3% 100.0%Count 2 4 14 9 29
New
ton
Cor
rect
iona
l Fac
ility
NC
F
PCD% 6.9% 13.8% 48.3% 31.0% 100.0%Count 4 56 159 100 32 351SA Need/No
Treatment % 1.1% 16.0% 45.3% 28.5% 9.1% 100.0%Count 7 10 7 2 26
Nor
th C
entra
lC
orre
ctio
nal
Faci
lity
NC
CF
Journey% 26.9% 38.5% 26.9% 7.7% 100.0%

DOC Licensed Substance Abuse Programs Page 76
Appendix G: Community Supervision Data.Case Processing Summary
CasesValid Missing Total
N Percent N Percent N PercentCBCIntCategory *Offender Recidivism 1335 89.5% 156 10.5% 1491 100.0%
Recidivism Rates for Offenders Successfully Completing Substance Abuse TreatmentBy Intervention in the Community
Recidivism Rates
CBC Intervention TypeDid Not
RecidivateNew
ConvictionTechnicalViolation Total
Count 757 122 160 282None% 72.9% 11.7% 15.4% 27.1%Count 8 1 3 4
Case Management% 66.7% 8.3% 25.0% 33.3%Count 86 12 34 46
Continuing Care% 65.2% 9.1% 25.8% 34.9%Count 36 5 4 9
Education% 80.0% 11.1% 8.9% 20.0%Count 24 4 6 10Inpatient/Residential
Treatment % 70.6% 11.8% 17.6% 29.4%Count 61 3 9 12
Outpatient Treatment% 83.6% 4.1% 12.3% 16.4%
Chi-Square Tests
Value dfAsymp. Sig.
(2-sided)Pearson Chi-Square 17.472(a) 10 .065Likelihood Ratio 17.602 10 .062Linear-by-LinearAssociation .275 1 .600
N of Valid Cases1335
a 4 cells (22.2%) have expected count less than 5. The minimum expected count is 1.32.

DOC Licensed Substance Abuse Programs Page 77
Recidivism Rates by Comparison Group and Supervision after Release
Recidivism RatesSupervisionAfter Release Group
Did NotRecidivate
NewConviction
TechnicalViolation Total
Count 543 116 3 119SA Need/No PrisonTreatment % 82.0% 17.5% .5% 18.0%
Count 124 33 0 33No
SA Need/SuccessfulPrison Treatment % 79.0% 21.0% .0% 21.0%
Count 1350 198 318 516SA Need/No PrisonTreatment % 72.3% 10.6% 17.0% 27.6%
Count 971 147 216 363Yes
SA Need/SuccessfulPrison Treatment % 72.8% 11.0% 16.2% 27.2%
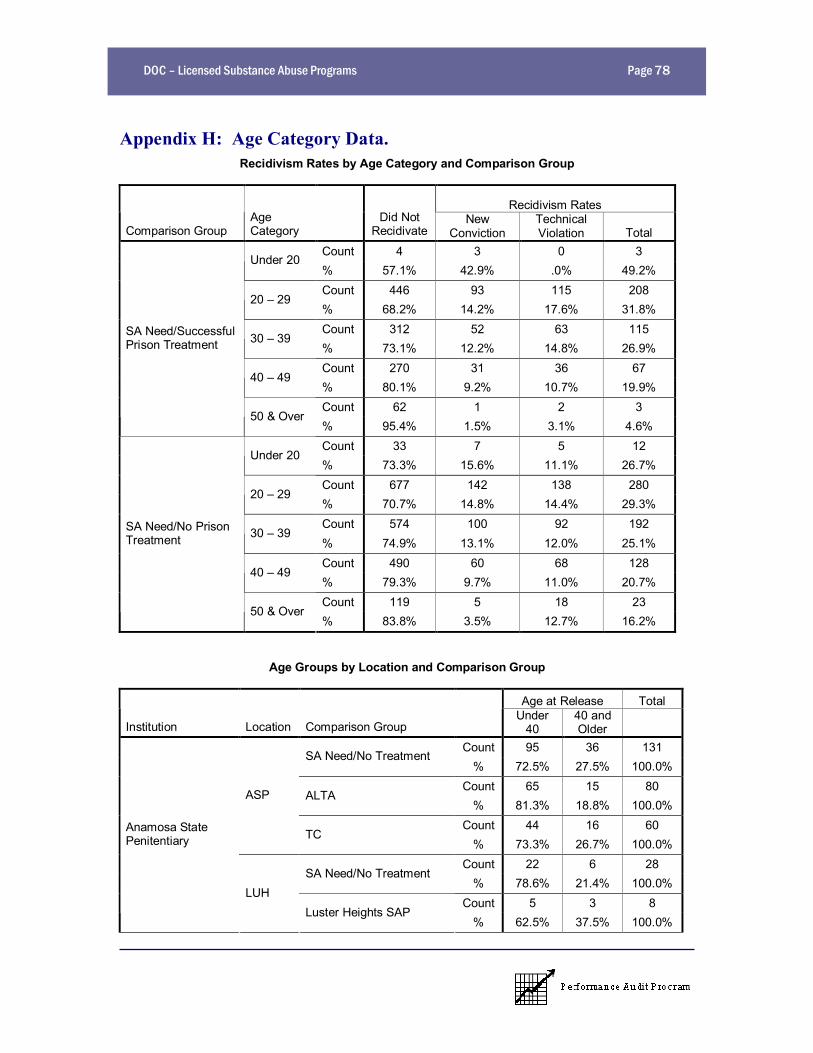
DOC Licensed Substance Abuse Programs Page 78
Appendix H: Age Category Data.Recidivism Rates by Age Category and Comparison Group
Recidivism Rates
Comparison GroupAgeCategory
Did NotRecidivate
NewConviction
TechnicalViolation Total
Count 4 3 0 3Under 20
% 57.1% 42.9% .0% 49.2%Count 446 93 115 208
20 29% 68.2% 14.2% 17.6% 31.8%Count 312 52 63 115
30 39% 73.1% 12.2% 14.8% 26.9%Count 270 31 36 67
40 49% 80.1% 9.2% 10.7% 19.9%Count 62 1 2 3
SA Need/SuccessfulPrison Treatment
50 & Over% 95.4% 1.5% 3.1% 4.6%Count 33 7 5 12
Under 20% 73.3% 15.6% 11.1% 26.7%Count 677 142 138 280
20 29% 70.7% 14.8% 14.4% 29.3%Count 574 100 92 192
30 39% 74.9% 13.1% 12.0% 25.1%Count 490 60 68 128
40 49% 79.3% 9.7% 11.0% 20.7%Count 119 5 18 23
SA Need/No PrisonTreatment
50 & Over% 83.8% 3.5% 12.7% 16.2%
Age Groups by Location and Comparison Group
Age at Release Total
Institution Location Comparison GroupUnder
4040 andOlder
Count 95 36 131SA Need/No Treatment
% 72.5% 27.5% 100.0%Count 65 15 80
ALTA% 81.3% 18.8% 100.0%
Count 44 16 60
ASP
TC% 73.3% 26.7% 100.0%
Count 22 6 28SA Need/No Treatment
% 78.6% 21.4% 100.0%Count 5 3 8
Anamosa StatePenitentiary
LUHLuster Heights SAP
% 62.5% 37.5% 100.0%
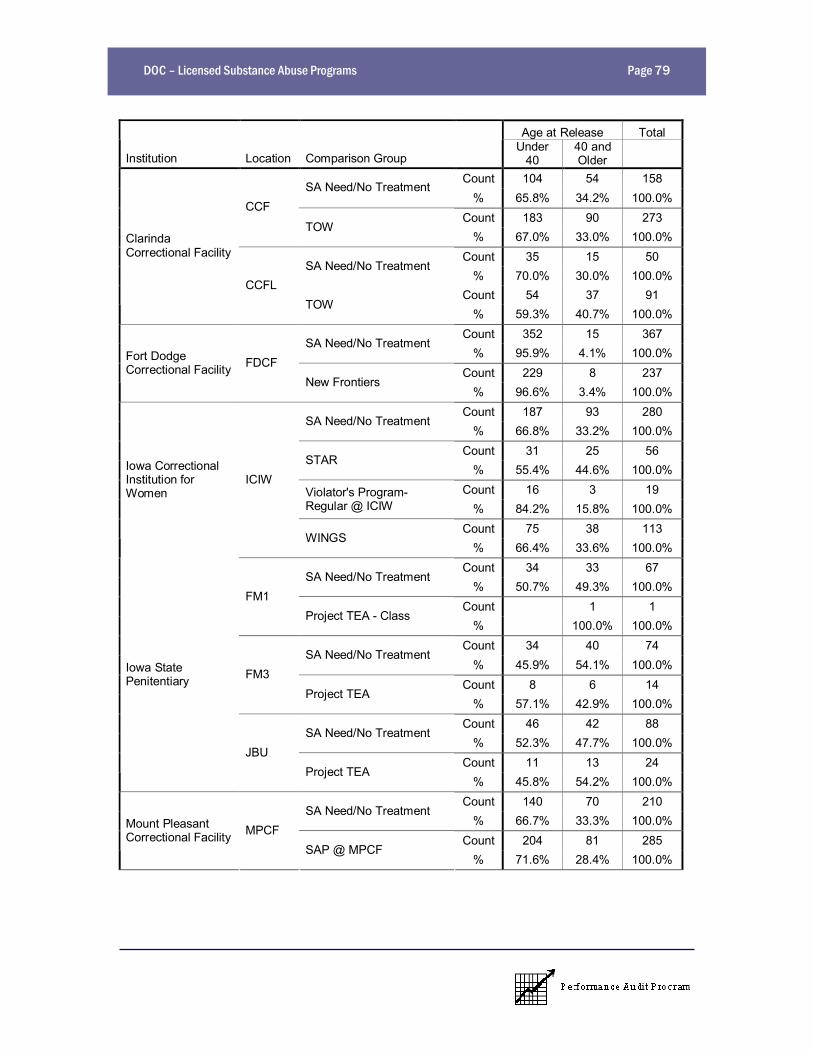
DOC Licensed Substance Abuse Programs Page 79
Age at Release Total
Institution Location Comparison GroupUnder
4040 andOlder
Count 104 54 158SA Need/No Treatment
% 65.8% 34.2% 100.0%Count 183 90 273
CCF
TOW% 67.0% 33.0% 100.0%
Count 35 15 50SA Need/No Treatment
% 70.0% 30.0% 100.0%Count 54 37 91
ClarindaCorrectional Facility
CCFLTOW
% 59.3% 40.7% 100.0%Count 352 15 367
SA Need/No Treatment% 95.9% 4.1% 100.0%
Count 229 8 237Fort DodgeCorrectional Facility FDCF
New Frontiers% 96.6% 3.4% 100.0%
Count 187 93 280SA Need/No Treatment
% 66.8% 33.2% 100.0%Count 31 25 56
STAR% 55.4% 44.6% 100.0%
Count 16 3 19Violator's Program-Regular @ ICIW % 84.2% 15.8% 100.0%
Count 75 38 113
Iowa CorrectionalInstitution forWomen
ICIW
WINGS% 66.4% 33.6% 100.0%
Count 34 33 67SA Need/No Treatment
% 50.7% 49.3% 100.0%Count 1 1
FM1Project TEA - Class
% 100.0% 100.0%Count 34 40 74
SA Need/No Treatment% 45.9% 54.1% 100.0%
Count 8 6 14FM3
Project TEA% 57.1% 42.9% 100.0%
Count 46 42 88SA Need/No Treatment
% 52.3% 47.7% 100.0%Count 11 13 24
Iowa StatePenitentiary
JBUProject TEA
% 45.8% 54.2% 100.0%Count 140 70 210
SA Need/No Treatment% 66.7% 33.3% 100.0%
Count 204 81 285Mount PleasantCorrectional Facility MPCF
SAP @ MPCF% 71.6% 28.4% 100.0%
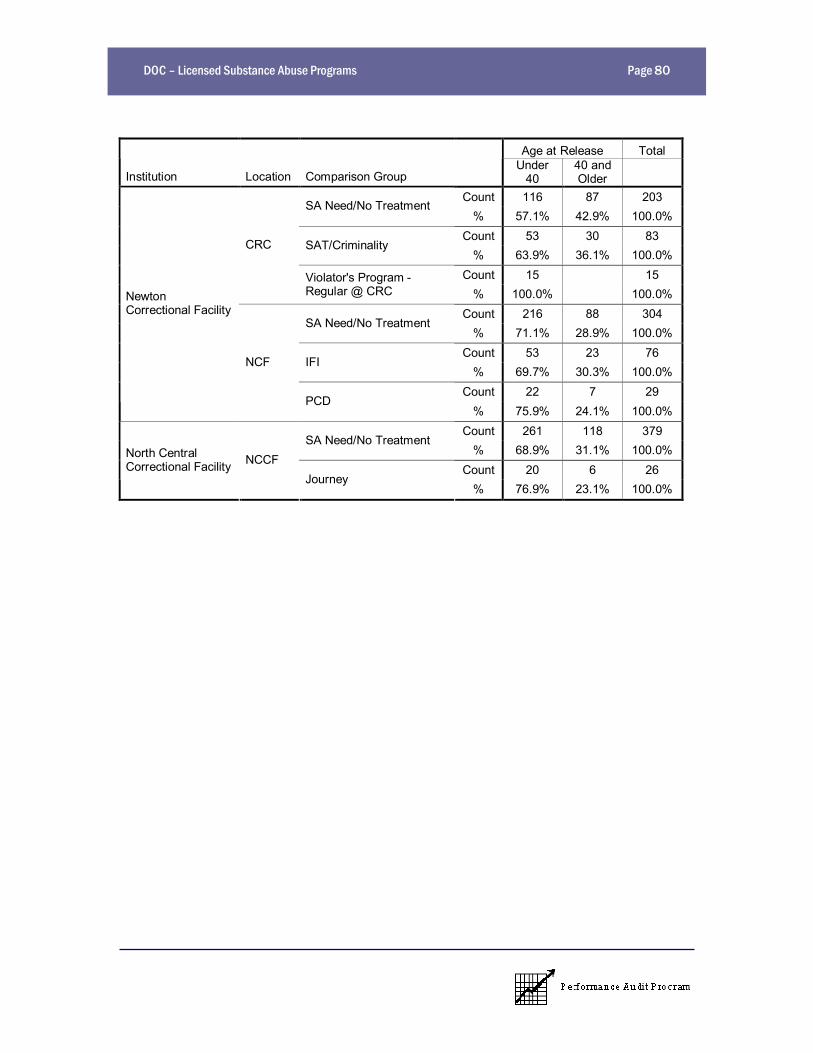
DOC Licensed Substance Abuse Programs Page 80
Age at Release Total
Institution Location Comparison GroupUnder
4040 andOlder
Count 116 87 203SA Need/No Treatment
% 57.1% 42.9% 100.0%Count 53 30 83
SAT/Criminality% 63.9% 36.1% 100.0%
Count 15 15
CRC
Violator's Program -Regular @ CRC % 100.0% 100.0%
Count 216 88 304SA Need/No Treatment
% 71.1% 28.9% 100.0%Count 53 23 76
IFI% 69.7% 30.3% 100.0%
Count 22 7 29
NewtonCorrectional Facility
NCF
PCD% 75.9% 24.1% 100.0%
Count 261 118 379SA Need/No Treatment
% 68.9% 31.1% 100.0%Count 20 6 26
North CentralCorrectional Facility NCCF
Journey% 76.9% 23.1% 100.0%

DOC Licensed Substance Abuse Programs Page 81
Appendix I: Race/Ethnicity Data.
Recidivism Rates by Race/Ethnicity and Comparison Group
Recidivism Rates
Group Race/EthnicityDid Not
RecidivateNew
ConvictionTechnicalViolation Total
Count 350 85 98 533African American
% 65.7% 15.9% 18.4% 100.0%Count 88 19 17 124
Other Minority% 71.0% 15.3% 13.7% 100.0%Count 1455 210 206 1871
SA Need/No PrisonTreatment
Caucasian% 77.8% 11.2% 11.0% 100.0%Count 190 49 67 306
African American% 62.1% 16.0% 21.9% 100.0%Count 60 7 13 80
Other Minority% 75.0% 8.8% 16.3% 100.0%Count 845 124 136 1105
SA Need/SuccessfulPrison Treatment
Caucasian% 76.5% 11.2% 12.3% 100.0%
Race/Ethnicity by Institution and Comparison Group
Institution Location Comparison GroupAfrican
AmericanOther
Minority CaucasianCount 30 5 96SA Need/No Prison
Treatment % 22.9% 3.8% 73.3%Count 20 2 58
ALTA% 25.0% 2.5% 72.5%Count 12 1 47
ASP
TC% 20.0% 1.7% 78.3%Count 1 1 26SA Need/No Prison
Treatment % 3.6% 3.6% 92.9%Count 8
Anamosa StatePenitentiary
LUHLuster Heights SAP
% 100.0%
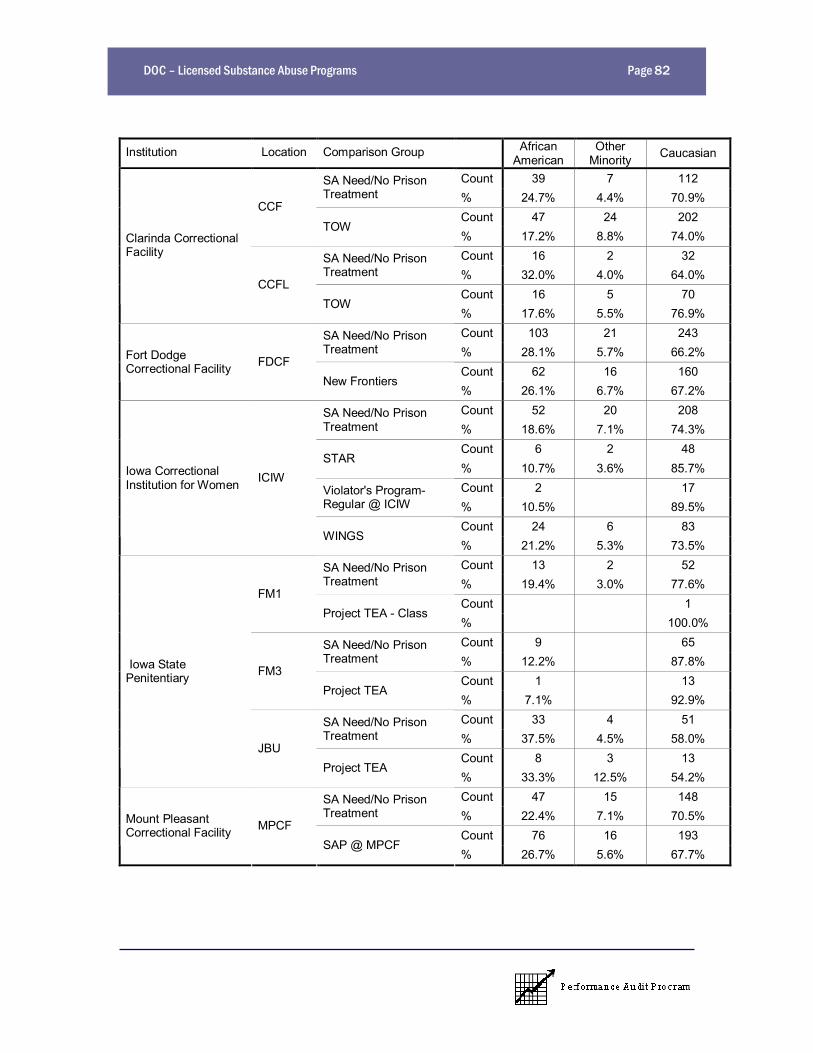
DOC Licensed Substance Abuse Programs Page 82
Institution Location Comparison Group AfricanAmerican
OtherMinority Caucasian
Count 39 7 112SA Need/No PrisonTreatment % 24.7% 4.4% 70.9%
Count 47 24 202CCF
TOW% 17.2% 8.8% 74.0%Count 16 2 32SA Need/No Prison
Treatment % 32.0% 4.0% 64.0%Count 16 5 70
Clarinda CorrectionalFacility
CCFLTOW
% 17.6% 5.5% 76.9%Count 103 21 243SA Need/No Prison
Treatment % 28.1% 5.7% 66.2%Count 62 16 160
Fort DodgeCorrectional Facility FDCF
New Frontiers% 26.1% 6.7% 67.2%Count 52 20 208SA Need/No Prison
Treatment % 18.6% 7.1% 74.3%Count 6 2 48
STAR% 10.7% 3.6% 85.7%Count 2 17Violator's Program-
Regular @ ICIW % 10.5% 89.5%Count 24 6 83
Iowa CorrectionalInstitution for Women ICIW
WINGS% 21.2% 5.3% 73.5%Count 13 2 52SA Need/No Prison
Treatment % 19.4% 3.0% 77.6%Count 1
FM1Project TEA - Class
% 100.0%Count 9 65SA Need/No Prison
Treatment % 12.2% 87.8%Count 1 13
FM3Project TEA
% 7.1% 92.9%Count 33 4 51SA Need/No Prison
Treatment % 37.5% 4.5% 58.0%Count 8 3 13
Iowa StatePenitentiary
JBUProject TEA
% 33.3% 12.5% 54.2%Count 47 15 148SA Need/No Prison
Treatment % 22.4% 7.1% 70.5%Count 76 16 193
Mount PleasantCorrectional Facility MPCF
SAP @ MPCF% 26.7% 5.6% 67.7%
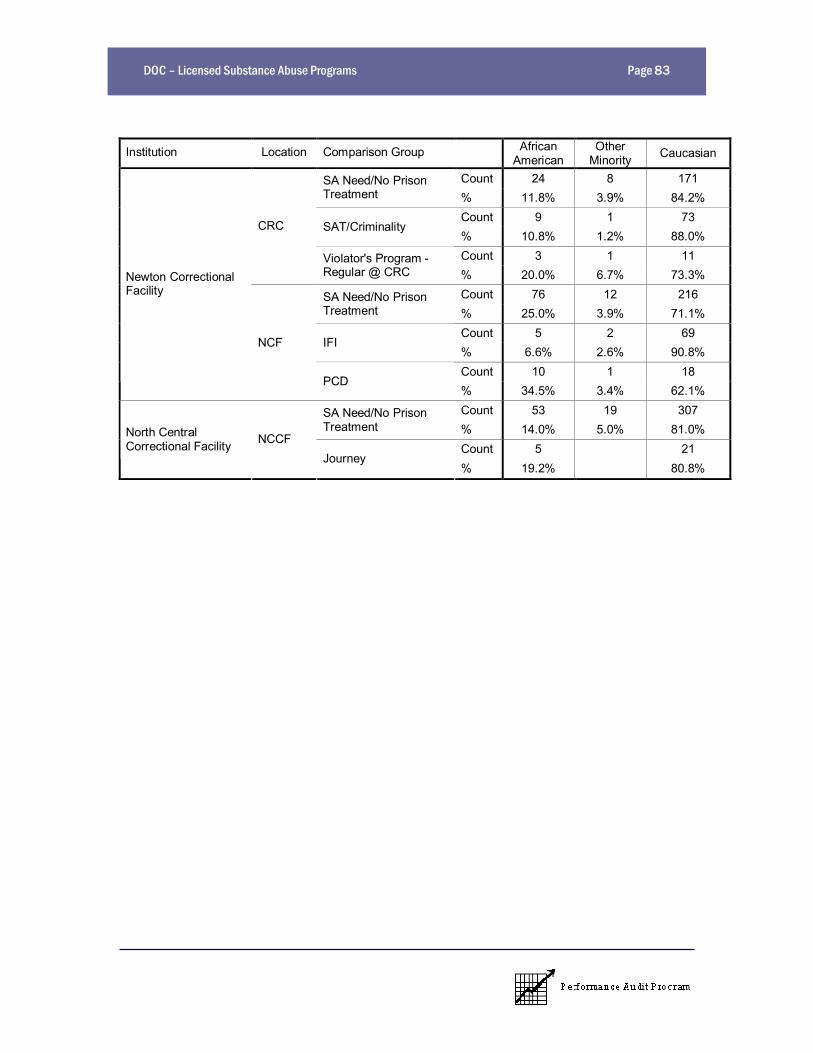
DOC Licensed Substance Abuse Programs Page 83
Institution Location Comparison Group AfricanAmerican
OtherMinority Caucasian
Count 24 8 171SA Need/No PrisonTreatment % 11.8% 3.9% 84.2%
Count 9 1 73SAT/Criminality
% 10.8% 1.2% 88.0%Count 3 1 11
CRC
Violator's Program -Regular @ CRC % 20.0% 6.7% 73.3%
Count 76 12 216SA Need/No PrisonTreatment % 25.0% 3.9% 71.1%
Count 5 2 69IFI
% 6.6% 2.6% 90.8%Count 10 1 18
Newton CorrectionalFacility
NCF
PCD% 34.5% 3.4% 62.1%Count 53 19 307SA Need/No Prison
Treatment % 14.0% 5.0% 81.0%Count 5 21
North CentralCorrectional Facility NCCF
Journey% 19.2% 80.8%
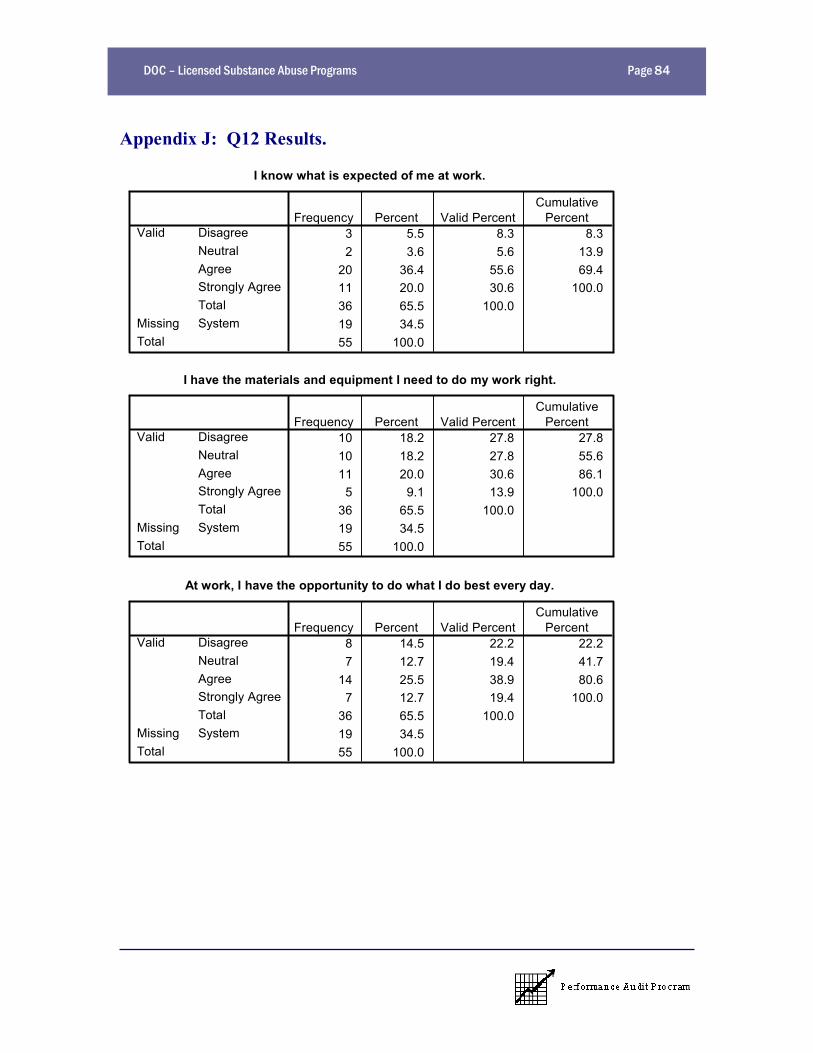
DOC Licensed Substance Abuse Programs Page 84
Appendix J: Q12 Results.
I know what is expected of me at work.
3 5.5 8.3 8.32 3.6 5.6 13.9
20 36.4 55.6 69.411 20.0 30.6 100.036 65.5 100.019 34.555 100.0
DisagreeNeutralAgreeStrongly AgreeTotal
Valid
SystemMissingTotal
Frequency Percent Valid PercentCumulative
Percent
I have the materials and equipment I need to do my work right.
10 18.2 27.8 27.810 18.2 27.8 55.611 20.0 30.6 86.1
5 9.1 13.9 100.036 65.5 100.019 34.555 100.0
DisagreeNeutralAgreeStrongly AgreeTotal
Valid
SystemMissingTotal
Frequency Percent Valid PercentCumulative
Percent
At work, I have the opportunity to do what I do best every day.
8 14.5 22.2 22.27 12.7 19.4 41.7
14 25.5 38.9 80.67 12.7 19.4 100.0
36 65.5 100.019 34.555 100.0
DisagreeNeutralAgreeStrongly AgreeTotal
Valid
SystemMissingTotal
Frequency Percent Valid PercentCumulative
Percent
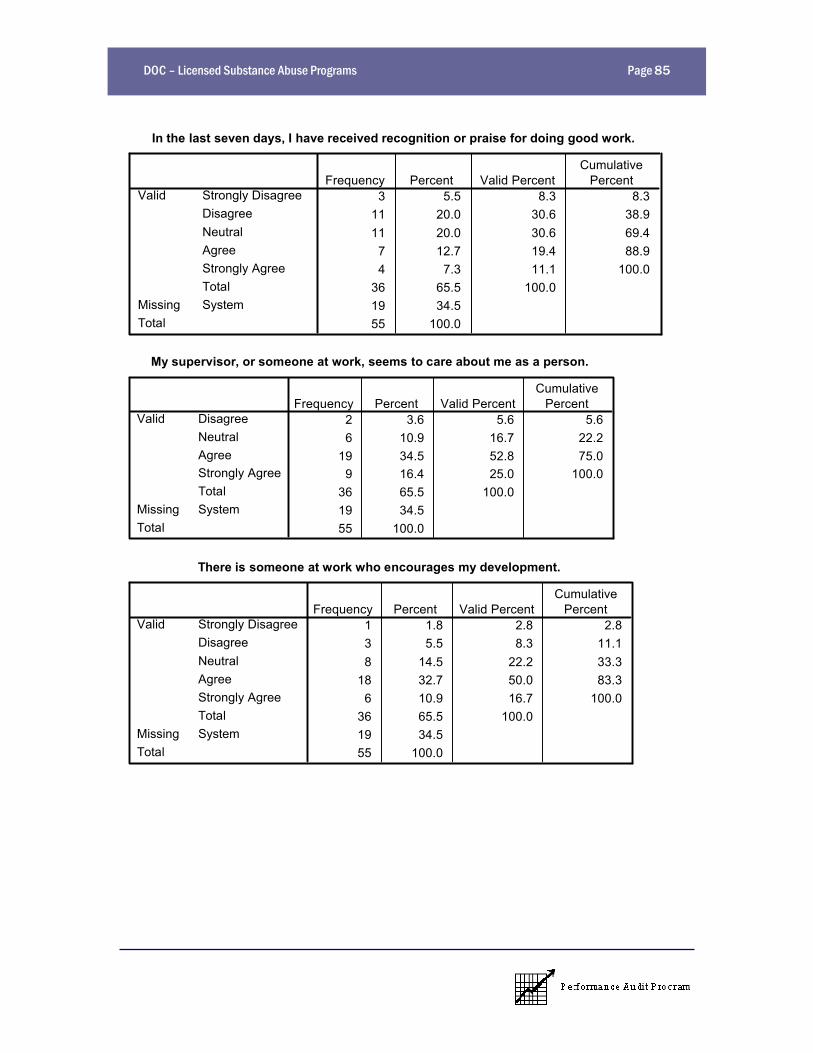
DOC Licensed Substance Abuse Programs Page 85
In the last seven days, I have received recognition or praise for doing good work.
3 5.5 8.3 8.311 20.0 30.6 38.911 20.0 30.6 69.4
7 12.7 19.4 88.94 7.3 11.1 100.0
36 65.5 100.019 34.555 100.0
Strongly DisagreeDisagreeNeutralAgreeStrongly AgreeTotal
Valid
SystemMissingTotal
Frequency Percent Valid PercentCumulative
Percent
My supervisor, or someone at work, seems to care about me as a person.
2 3.6 5.6 5.66 10.9 16.7 22.2
19 34.5 52.8 75.09 16.4 25.0 100.0
36 65.5 100.019 34.555 100.0
DisagreeNeutralAgreeStrongly AgreeTotal
Valid
SystemMissingTotal
Frequency Percent Valid PercentCumulative
Percent
There is someone at work who encourages my development.
1 1.8 2.8 2.83 5.5 8.3 11.18 14.5 22.2 33.3
18 32.7 50.0 83.36 10.9 16.7 100.0
36 65.5 100.019 34.555 100.0
Strongly DisagreeDisagreeNeutralAgreeStrongly AgreeTotal
Valid
SystemMissingTotal
Frequency Percent Valid PercentCumulative
Percent
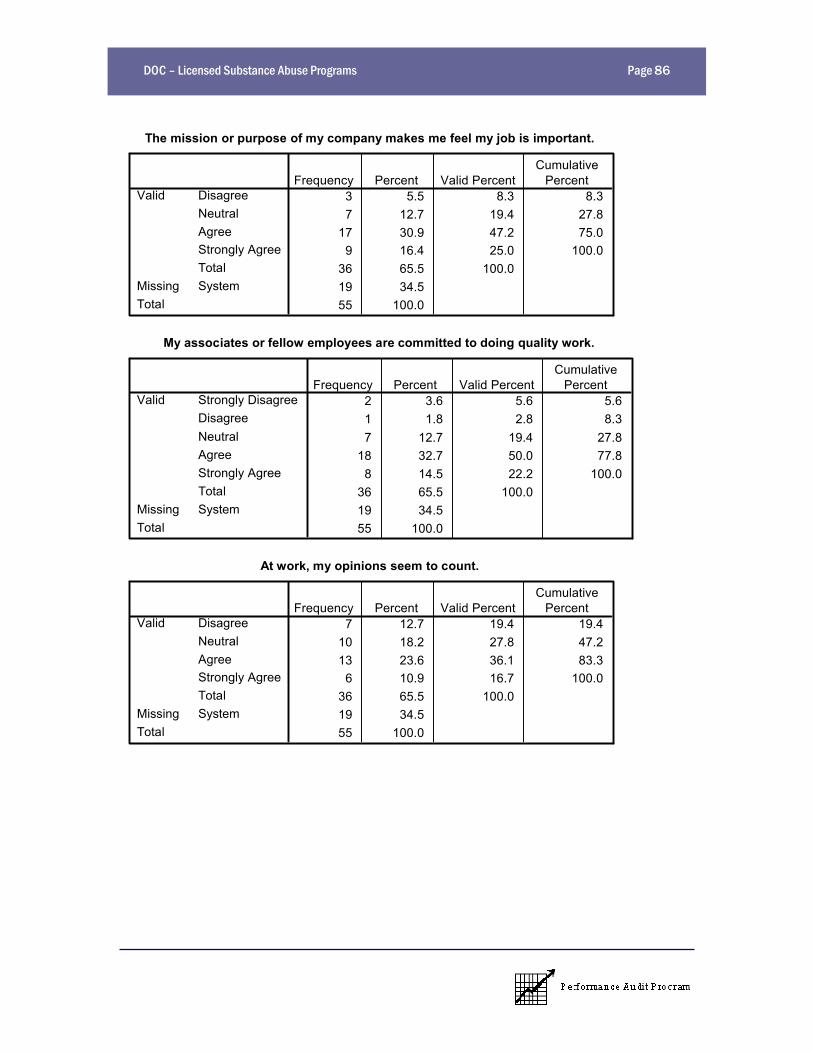
DOC Licensed Substance Abuse Programs Page 86
The mission or purpose of my company makes me feel my job is important.
3 5.5 8.3 8.37 12.7 19.4 27.8
17 30.9 47.2 75.09 16.4 25.0 100.0
36 65.5 100.019 34.555 100.0
DisagreeNeutralAgreeStrongly AgreeTotal
Valid
SystemMissingTotal
Frequency Percent Valid PercentCumulative
Percent
My associates or fellow employees are committed to doing quality work.
2 3.6 5.6 5.61 1.8 2.8 8.37 12.7 19.4 27.8
18 32.7 50.0 77.88 14.5 22.2 100.0
36 65.5 100.019 34.555 100.0
Strongly DisagreeDisagreeNeutralAgreeStrongly AgreeTotal
Valid
SystemMissingTotal
Frequency Percent Valid PercentCumulative
Percent
At work, my opinions seem to count.
7 12.7 19.4 19.410 18.2 27.8 47.213 23.6 36.1 83.3
6 10.9 16.7 100.036 65.5 100.019 34.555 100.0
DisagreeNeutralAgreeStrongly AgreeTotal
Valid
SystemMissingTotal
Frequency Percent Valid PercentCumulative
Percent
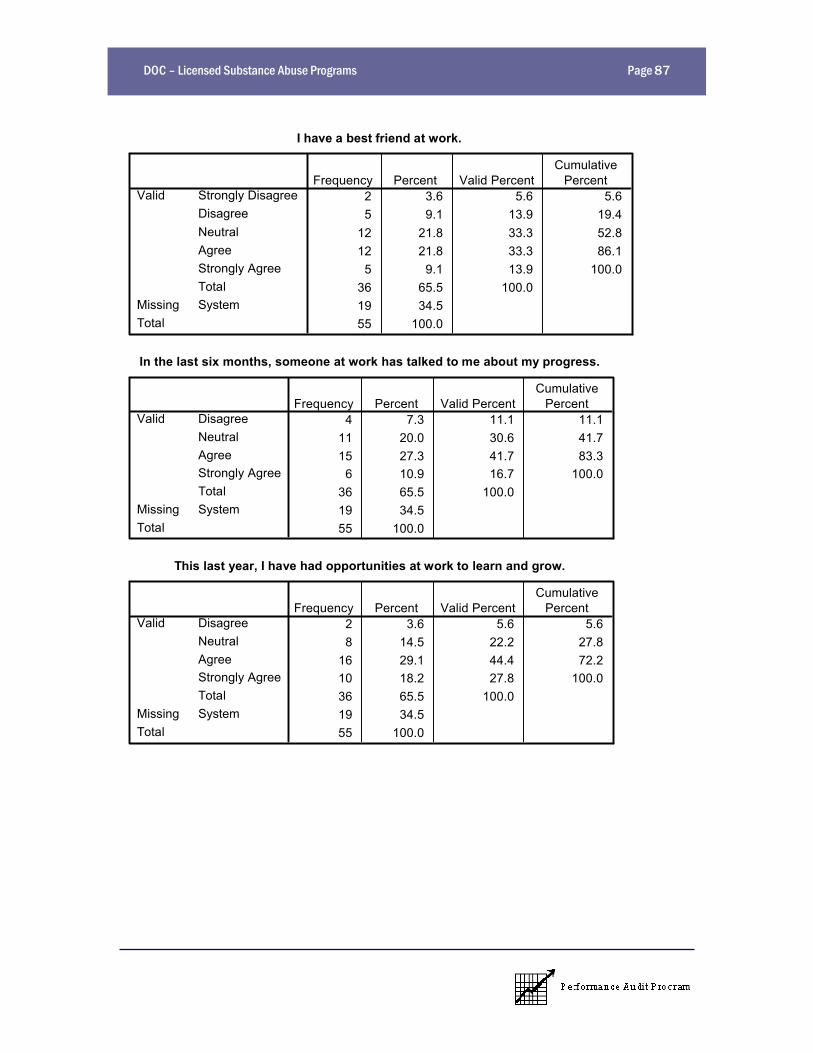
DOC Licensed Substance Abuse Programs Page 87
I have a best friend at work.
2 3.6 5.6 5.65 9.1 13.9 19.4
12 21.8 33.3 52.812 21.8 33.3 86.1
5 9.1 13.9 100.036 65.5 100.019 34.555 100.0
Strongly DisagreeDisagreeNeutralAgreeStrongly AgreeTotal
Valid
SystemMissingTotal
Frequency Percent Valid PercentCumulative
Percent
In the last six months, someone at work has talked to me about my progress.
4 7.3 11.1 11.111 20.0 30.6 41.715 27.3 41.7 83.3
6 10.9 16.7 100.036 65.5 100.019 34.555 100.0
DisagreeNeutralAgreeStrongly AgreeTotal
Valid
SystemMissingTotal
Frequency Percent Valid PercentCumulative
Percent
This last year, I have had opportunities at work to learn and grow.
2 3.6 5.6 5.68 14.5 22.2 27.8
16 29.1 44.4 72.210 18.2 27.8 100.036 65.5 100.019 34.555 100.0
DisagreeNeutralAgreeStrongly AgreeTotal
Valid
SystemMissingTotal
Frequency Percent Valid PercentCumulative
Percent

DOC Licensed Substance Abuse Programs Page 88
This page intentionally left blank.

DOC Licensed Substance Abuse Programs Page 89
This page intentionally left blank.

DOC Licensed Substance Abuse Programs Page 90


![The Effect of Prison Sentence Length on Recidivism ... · The Effect of Prison Sentence Length on Recidivism: Evidence from Random Judicial Assignment [Preliminary not for Circulation]](https://img.pdfslide.us/doc/110x75/5b8855ec7f8b9a46538dae75/the-effect-of-prison-sentence-length-on-recidivism-the-effect-of-prison.jpg)