Embed Size (px)
Citation preview

Does One Law Fit All? Cross-Country Evidence on Okun’s Law
Laurence Ball
Johns Hopkins University
Global Labor Markets Workshop
Paris, September 1-2, 2016
1
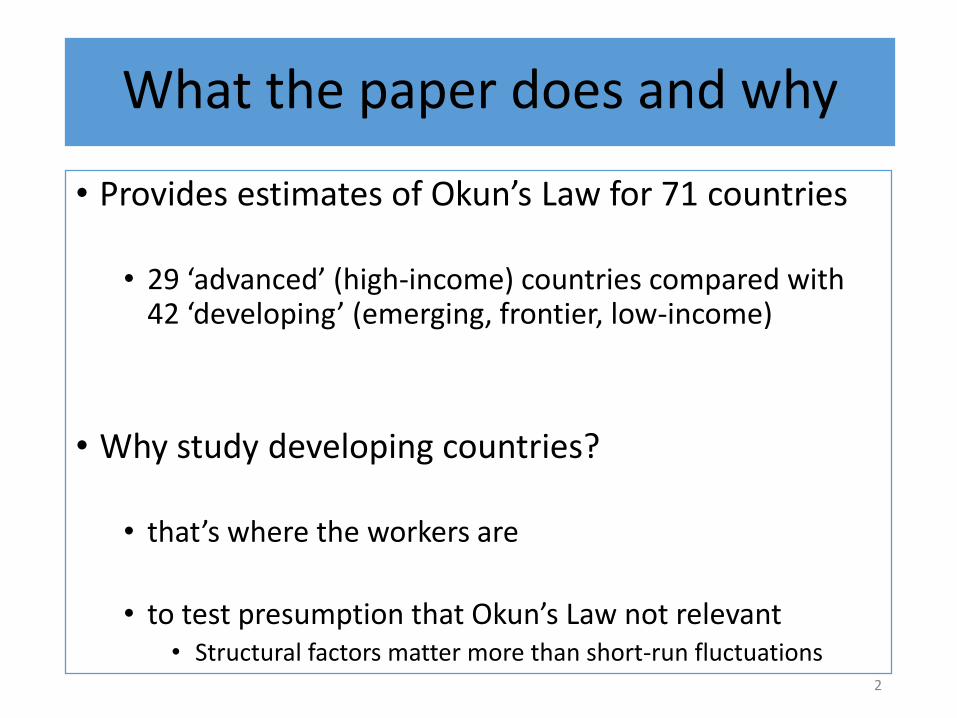
What the paper does and why
• Provides estimates of Okun’s Law for 71 countries
• 29 ‘advanced’ (high-income) countries compared with 42 ‘developing’ (emerging, frontier, low-income)
• Why study developing countries?
• that’s where the workers are
• to test presumption that Okun’s Law not relevant• Structural factors matter more than short-run fluctuations
2
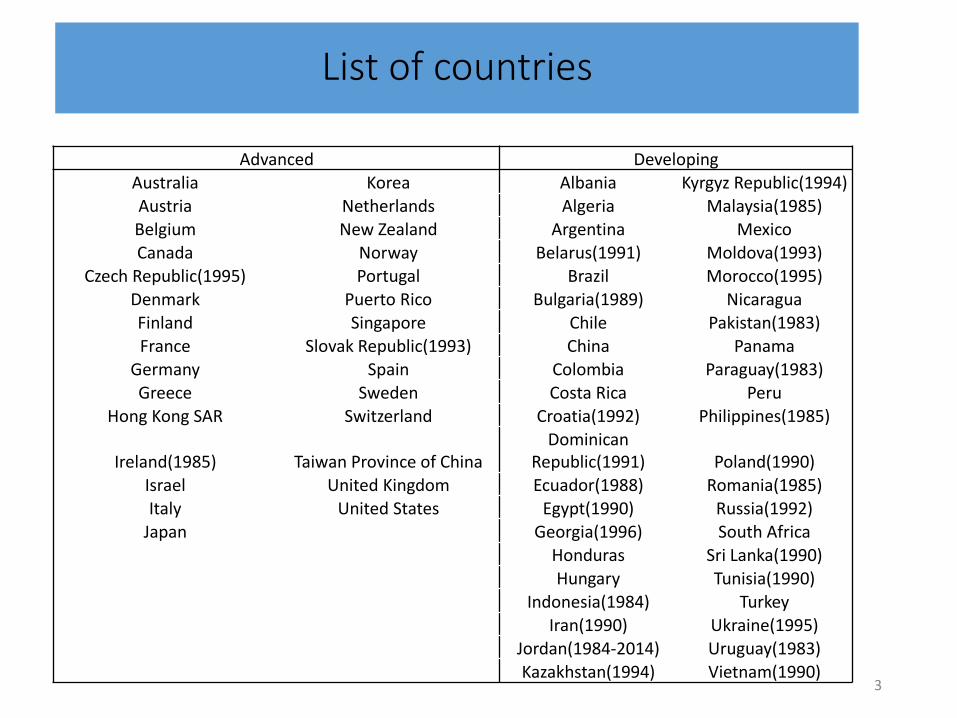
List of countries
Advanced Developing
Australia Korea Albania Kyrgyz Republic(1994)
Austria Netherlands Algeria Malaysia(1985)Belgium New Zealand Argentina Mexico
Canada Norway Belarus(1991) Moldova(1993)Czech Republic(1995) Portugal Brazil Morocco(1995)
Denmark Puerto Rico Bulgaria(1989) Nicaragua
Finland Singapore Chile Pakistan(1983)France Slovak Republic(1993) China Panama
Germany Spain Colombia Paraguay(1983)
Greece Sweden Costa Rica PeruHong Kong SAR Switzerland Croatia(1992) Philippines(1985)
Ireland(1985) Taiwan Province of ChinaDominican
Republic(1991) Poland(1990)
Israel United Kingdom Ecuador(1988) Romania(1985)Italy United States Egypt(1990) Russia(1992)
Japan Georgia(1996) South Africa
Honduras Sri Lanka(1990)Hungary Tunisia(1990)
Indonesia(1984) Turkey
Iran(1990) Ukraine(1995)Jordan(1984-2014) Uruguay(1983)Kazakhstan(1994) Vietnam(1990)
3
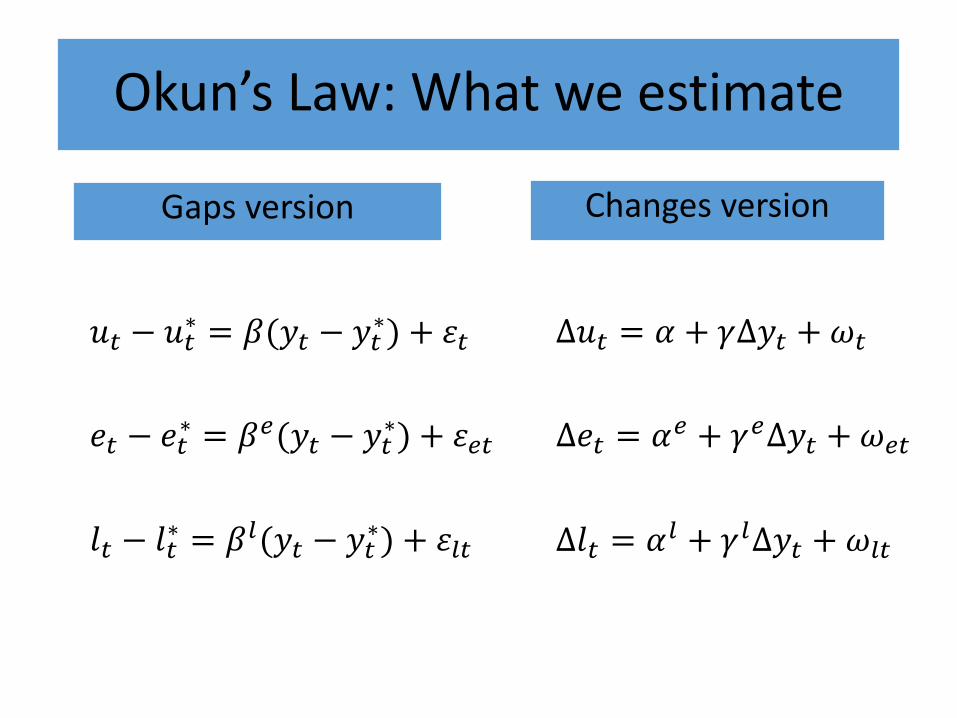
Okun’s Law: What we estimate
Gaps version Changes version
∆𝑢𝑡 = 𝛼 + 𝛾∆𝑦𝑡 + 𝜔𝑡
∆𝑒𝑡 = 𝛼𝑒 + 𝛾𝑒∆𝑦𝑡 +𝜔𝑒𝑡
∆𝑙𝑡 = 𝛼𝑙 + 𝛾𝑙∆𝑦𝑡 + 𝜔𝑙𝑡
𝑢𝑡 − 𝑢𝑡∗ = 𝛽(𝑦𝑡 − 𝑦𝑡
∗) + 𝜀𝑡
𝑒𝑡 − 𝑒𝑡∗ = 𝛽𝑒(𝑦𝑡 − 𝑦𝑡
∗) + 𝜀𝑒𝑡
𝑙𝑡 − 𝑙𝑡∗ = 𝛽𝑙(𝑦𝑡 − 𝑦𝑡
∗) + 𝜀𝑙𝑡
Main resultsDistribution of Okun coefficients across countries
5
05
10
15
-1 -.5 0 -1 -.5 0
Advanced Developing
Fre
quency
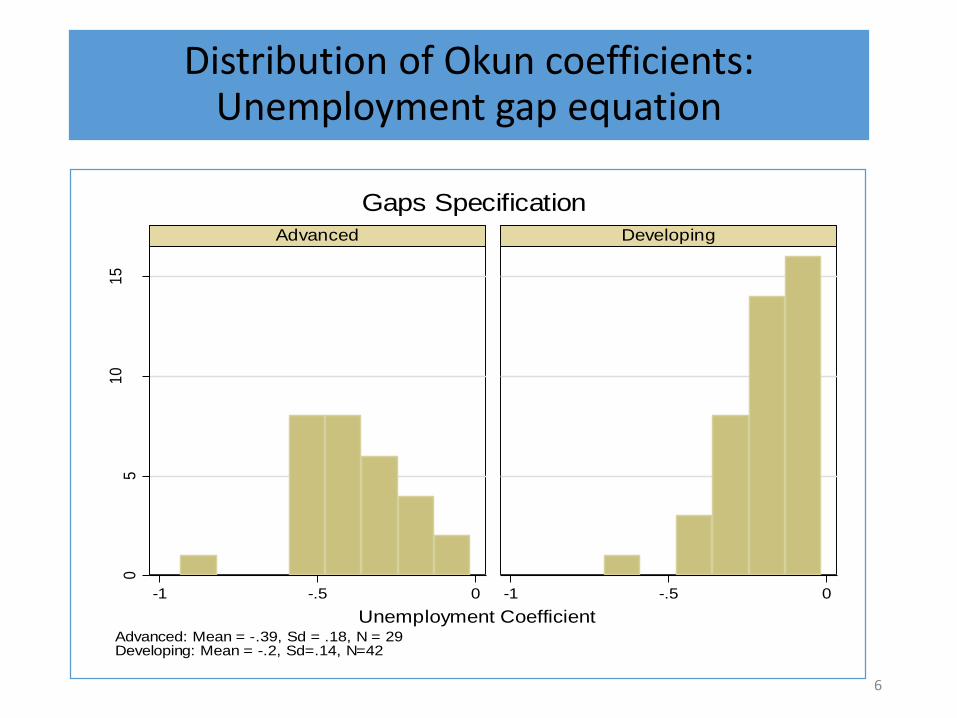
Unemployment CoefficientAdvanced: Mean = -.39, Sd = .18, N = 29Developing: Mean = -.2, Sd=.14, N=42
Gaps Specification
Distribution of Okun coefficients: Unemployment gap equation
6
05
1015
0 .5 1 0 .5 1
Advanced Developing
Freq
uenc
y
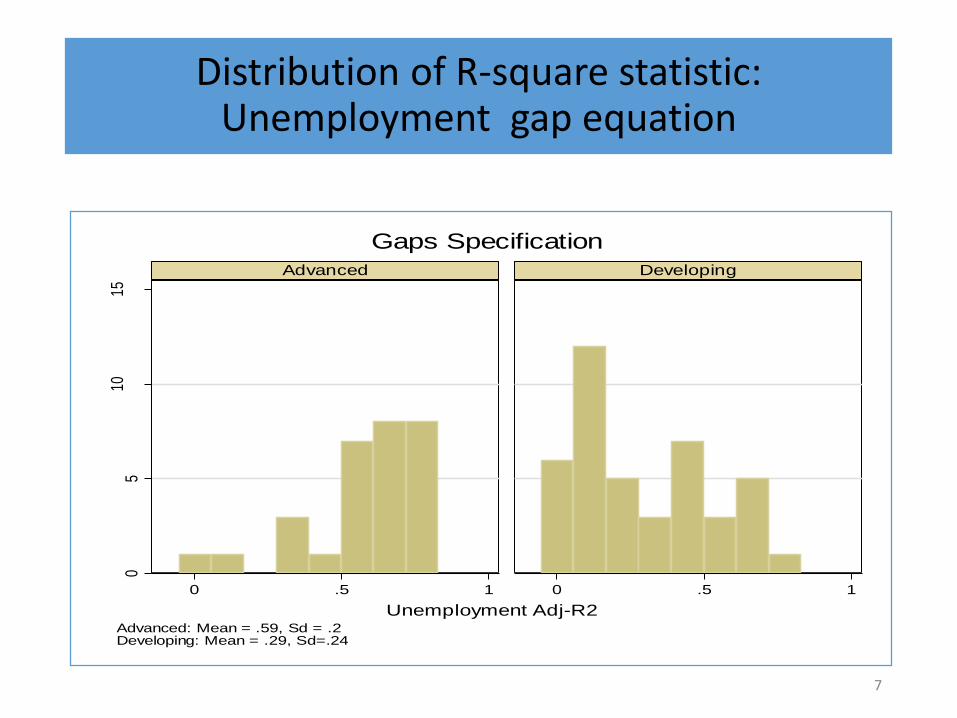
Unemployment Adj-R2Advanced: Mean = .59, Sd = .2Developing: Mean = .29, Sd=.24
Gaps Specification
Distribution of R-square statistic: Unemployment gap equation
7
05
10
15
-.5 0 .5 1 1.5 -.5 0 .5 1 1.5
Advanced Developing
Fre
quen
cy
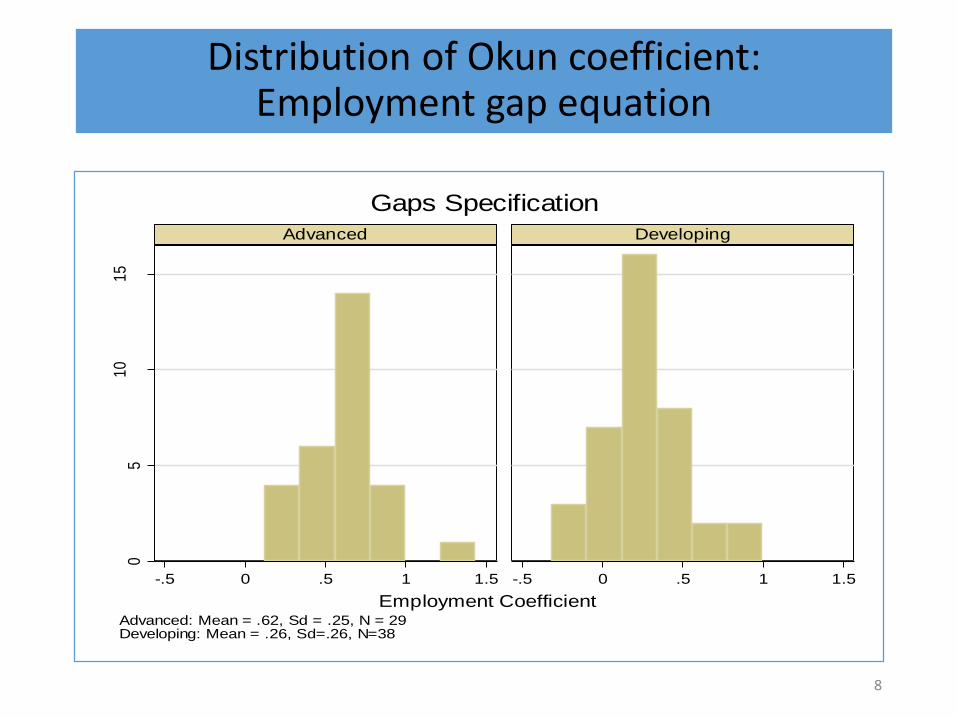
Employment CoefficientAdvanced: Mean = .62, Sd = .25, N = 29Developing: Mean = .26, Sd=.26, N=38
Gaps Specification
Distribution of Okun coefficient: Employment gap equation
8
05
1015
0 .5 1 0 .5 1
Advanced Developing
Fre
quen
cy
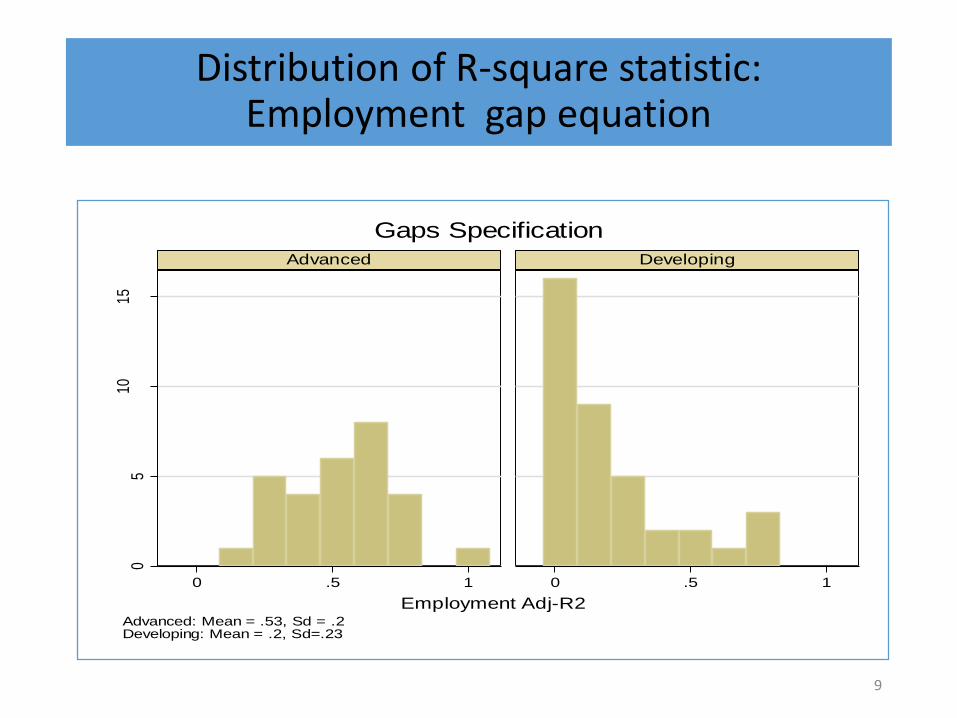
Employment Adj-R2Advanced: Mean = .53, Sd = .2Developing: Mean = .2, Sd=.23
Gaps Specification
Distribution of R-square statistic: Employment gap equation
9
05
10
-.5 0 .5 -.5 0 .5
Advanced Developing
Fre
quen
cy
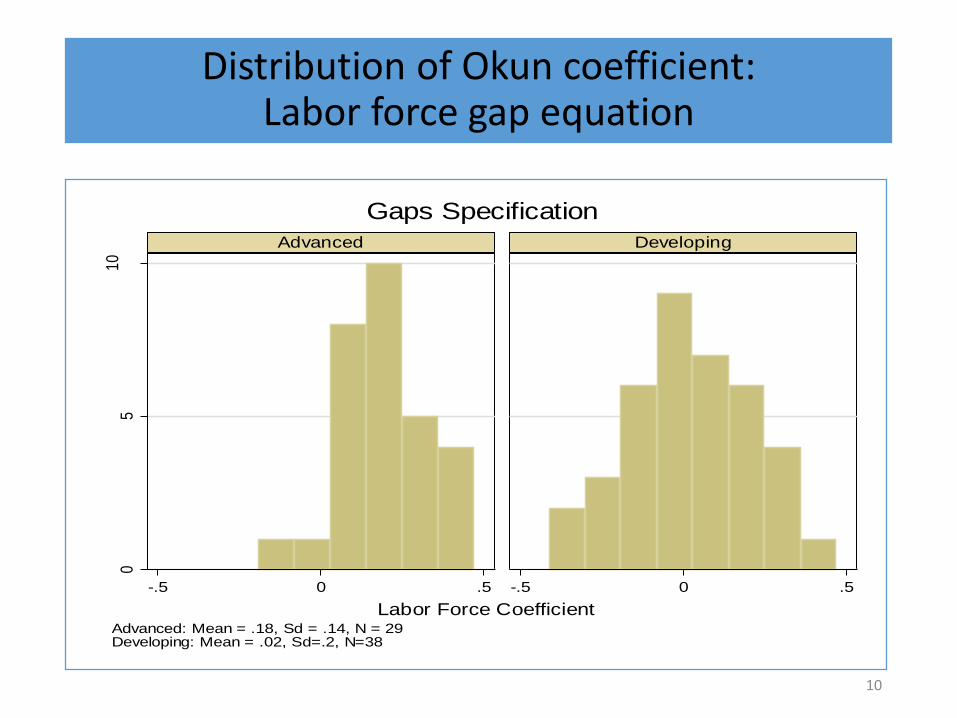
Labor Force CoefficientAdvanced: Mean = .18, Sd = .14, N = 29Developing: Mean = .02, Sd=.2, N=38
Gaps Specification
Distribution of Okun coefficient: Labor force gap equation
10
05
10
15
20
0 .2 .4 .6 0 .2 .4 .6
Advanced Developing
Fre
quen
cy
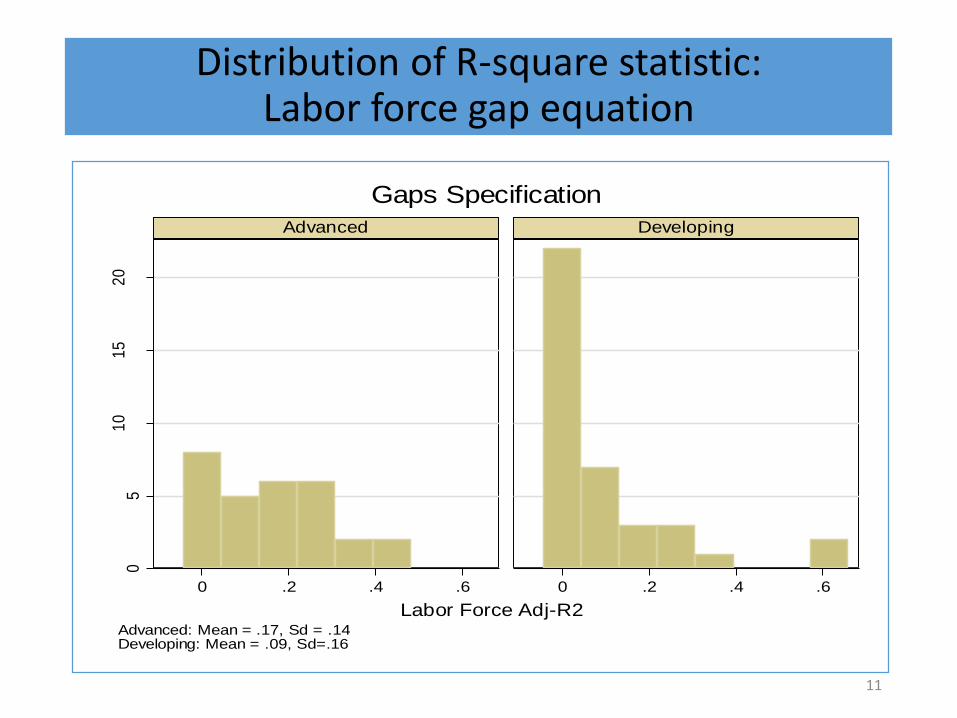
Labor Force Adj-R2Advanced: Mean = .17, Sd = .14Developing: Mean = .09, Sd=.16
Gaps Specification
Distribution of R-square statistic: Labor force gap equation
11
Country cases• Colombia, Egypt, Poland, Russia
• Summary matrix
12
5
10
15
%
1980 1990 2000 2010 2020year
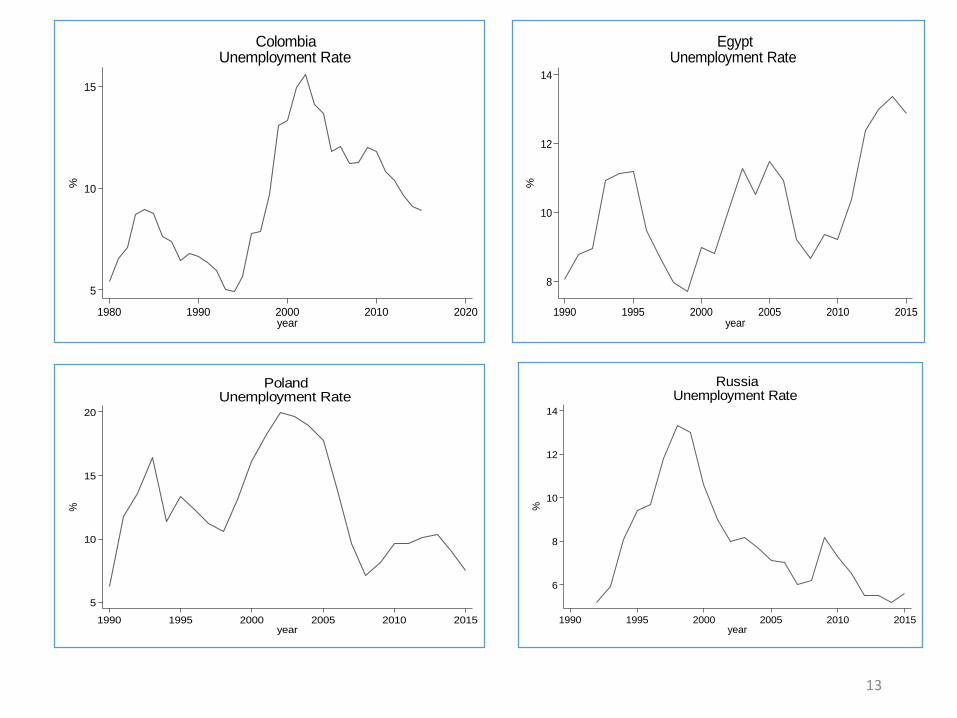
ColombiaUnemployment Rate
8
10
12
14
%
1990 1995 2000 2005 2010 2015year
EgyptUnemployment Rate
5
10
15
20
%
1990 1995 2000 2005 2010 2015year
PolandUnemployment Rate
6
8
10
12
14
%
1990 1995 2000 2005 2010 2015year
RussiaUnemployment Rate
13
-2
-1
0
1
2
3
U G
ap
-5 0 5GDP Gap
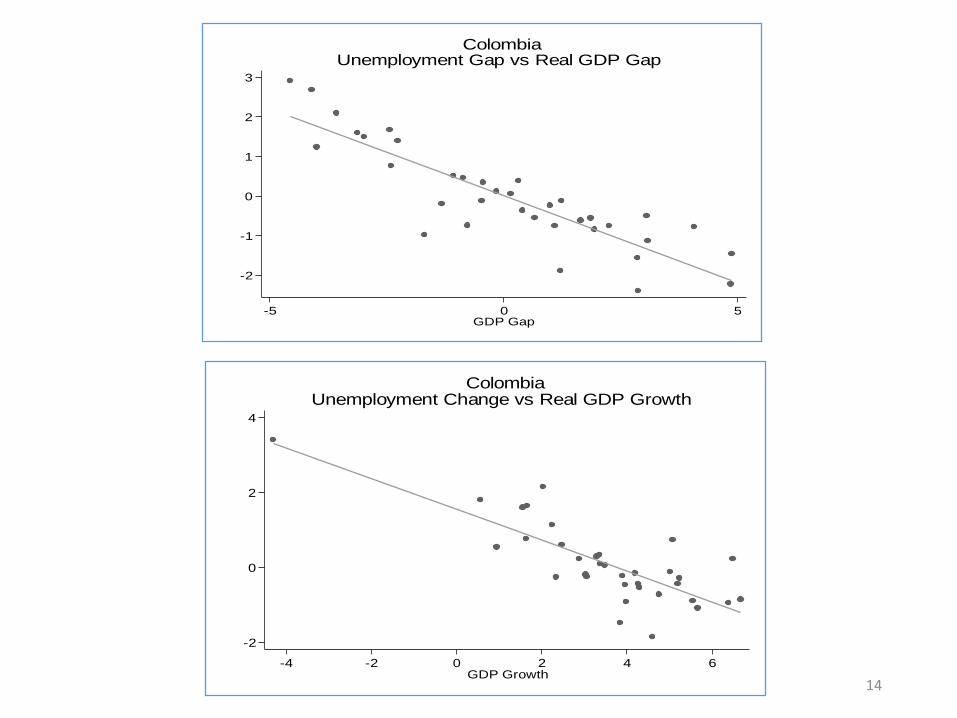
ColombiaUnemployment Gap vs Real GDP Gap
-2
0
2
4
Cha
nge
in U
-4 -2 0 2 4 6GDP Growth
ColombiaUnemployment Change vs Real GDP Growth
14
-2
-1
0
1
2
Cha
nge
in U
0 2 4 6 8GDP Growth
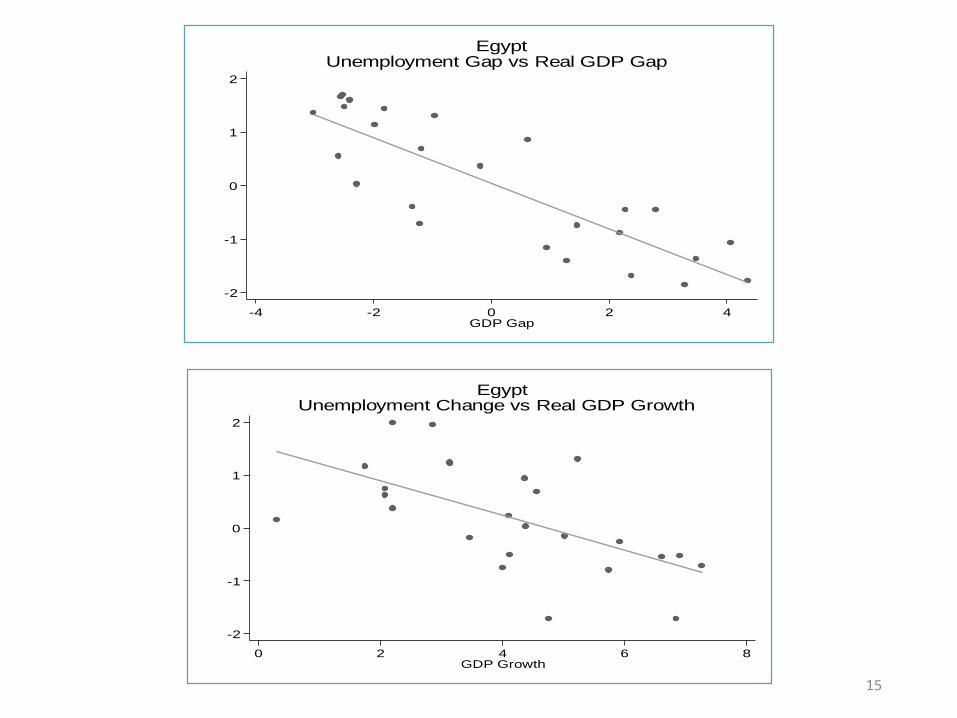
EgyptUnemployment Change vs Real GDP Growth
-2
-1
0
1
2
U G
ap
-4 -2 0 2 4GDP Gap
EgyptUnemployment Gap vs Real GDP Gap
15
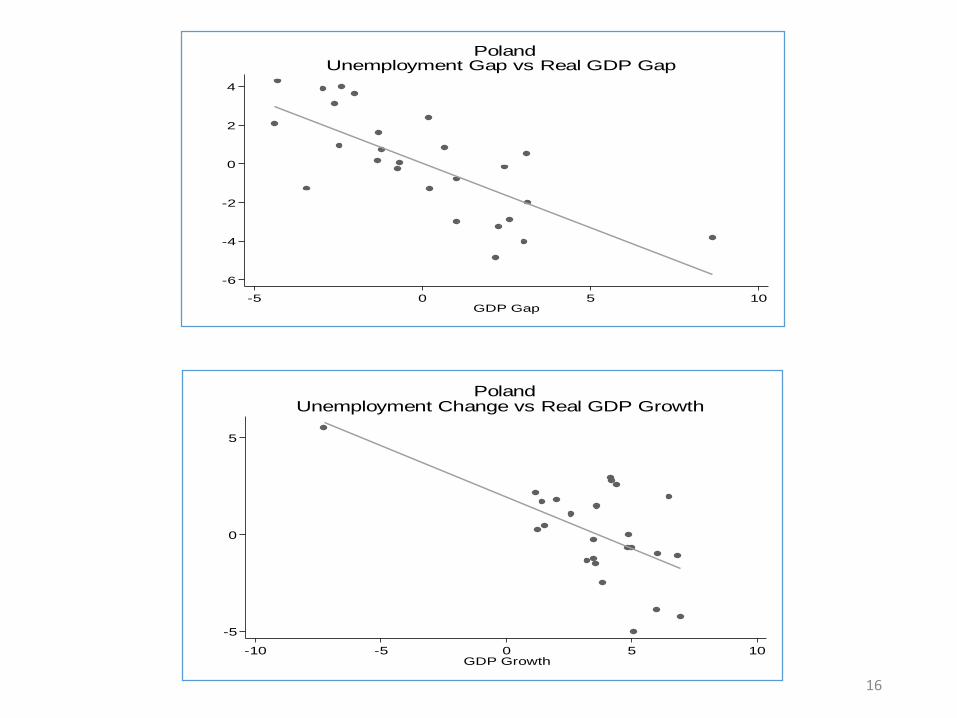
-5
0
5
Cha
nge
in U
-10 -5 0 5 10GDP Growth
PolandUnemployment Change vs Real GDP Growth
-6
-4
-2
0
2
4
U G
ap
-5 0 5 10GDP Gap
PolandUnemployment Gap vs Real GDP Gap
16
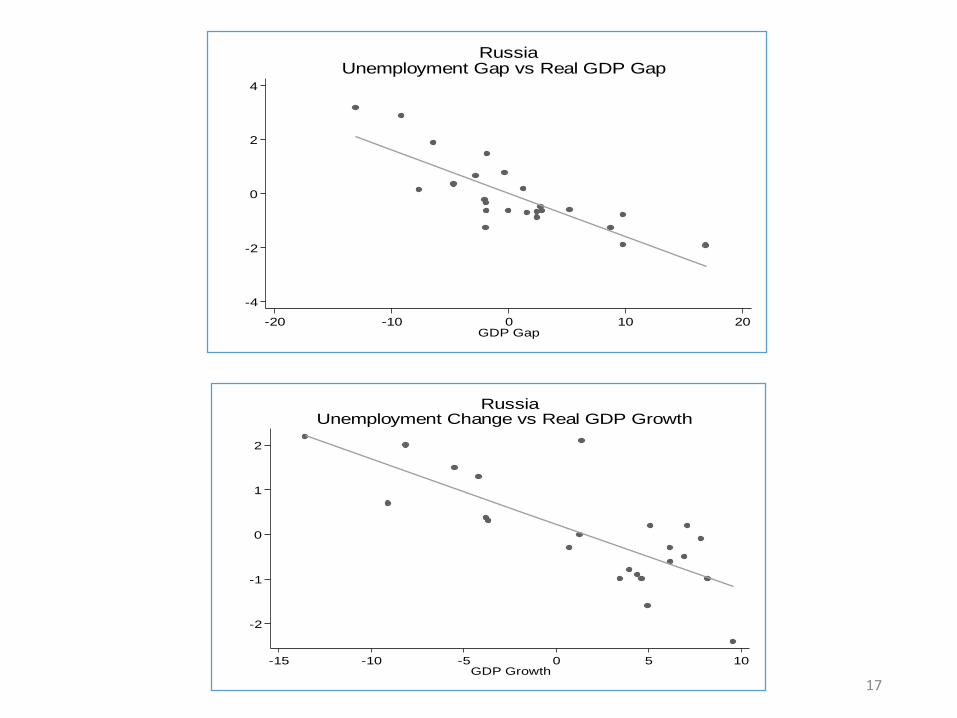
-4
-2
0
2
4
U G
ap
-20 -10 0 10 20GDP Gap
RussiaUnemployment Gap vs Real GDP Gap
-2
-1
0
1
2
Cha
nge
in U
-15 -10 -5 0 5 10GDP Growth
RussiaUnemployment Change vs Real GDP Growth
17
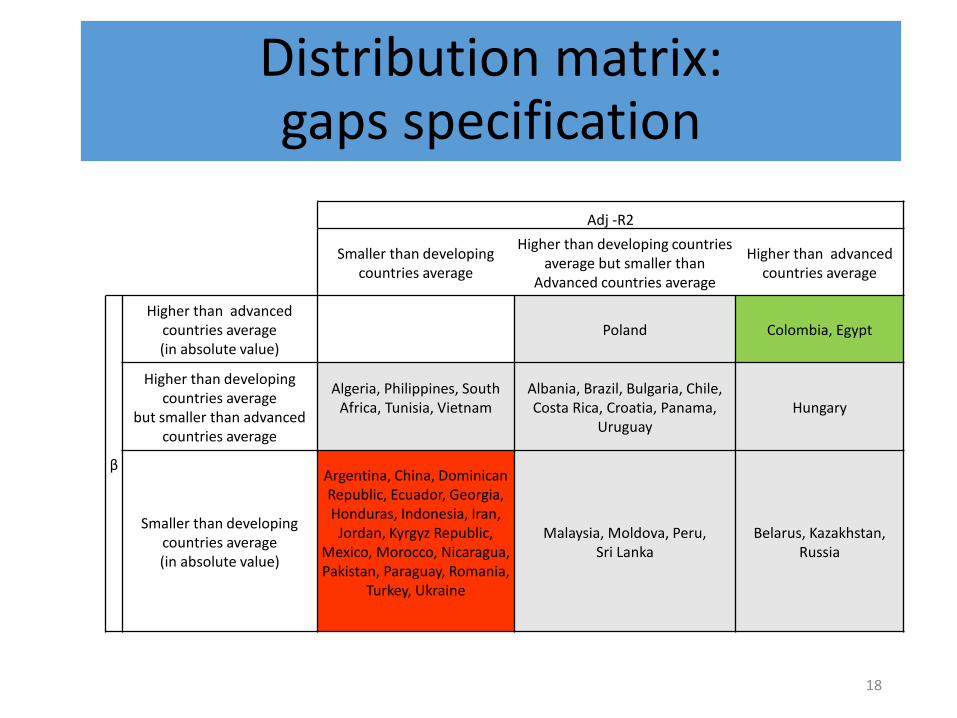
Adj -R2
Smaller than developing countries average
Higher than developing countries average but smaller than
Advanced countries average
Higher than advanced countries average
β
Higher than advanced countries average (in absolute value)
Poland Colombia, Egypt
Higher than developing countries average
but smaller than advanced countries average
Algeria, Philippines, South Africa, Tunisia, Vietnam
Albania, Brazil, Bulgaria, Chile, Costa Rica, Croatia, Panama,
UruguayHungary
Smaller than developing countries average (in absolute value)
Argentina, China, Dominican Republic, Ecuador, Georgia, Honduras, Indonesia, Iran,
Jordan, Kyrgyz Republic, Mexico, Morocco, Nicaragua, Pakistan, Paraguay, Romania,
Turkey, Ukraine
Malaysia, Moldova, Peru, Sri Lanka
Belarus, Kazakhstan, Russia
Distribution matrix: gaps specification
18
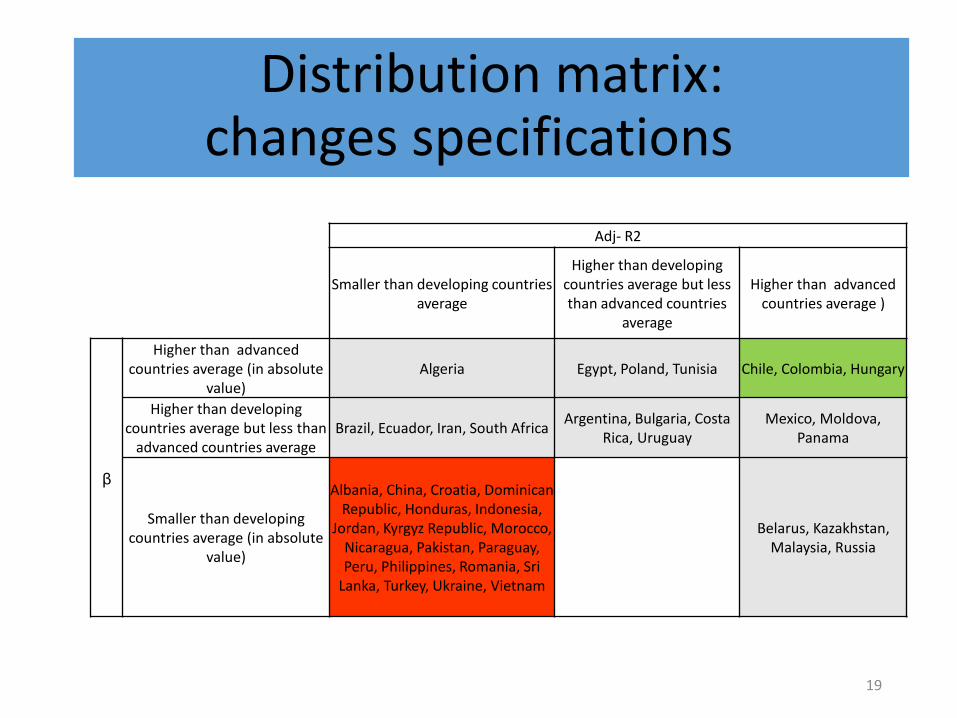
Distribution matrix: changes specifications
Adj- R2
Smaller than developing countries average
Higher than developing countries average but less than advanced countries
average
Higher than advanced countries average )
β
Higher than advanced countries average (in absolute
value)Algeria Egypt, Poland, Tunisia Chile, Colombia, Hungary
Higher than developing countries average but less than
advanced countries averageBrazil, Ecuador, Iran, South Africa
Argentina, Bulgaria, Costa Rica, Uruguay
Mexico, Moldova, Panama
Smaller than developing countries average (in absolute
value)
Albania, China, Croatia, Dominican Republic, Honduras, Indonesia,
Jordan, Kyrgyz Republic, Morocco, Nicaragua, Pakistan, Paraguay, Peru, Philippines, Romania, Sri
Lanka, Turkey, Ukraine, Vietnam
Belarus, Kazakhstan, Malaysia, Russia
19
Probing the cross-country heterogeneity• Bivariate relationships
• Regressions
20
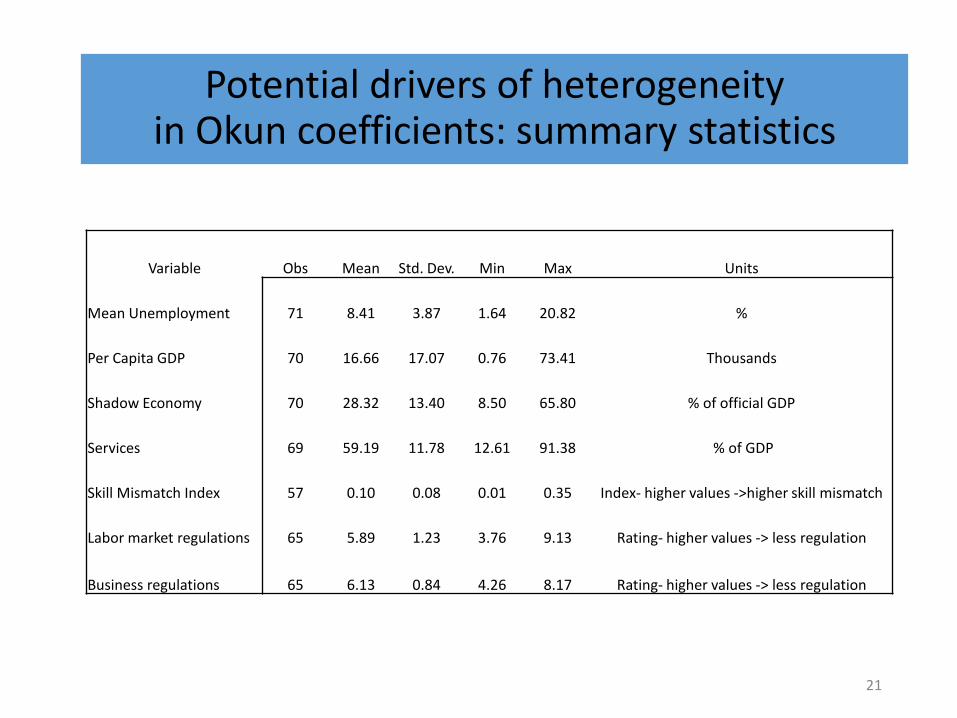
Potential drivers of heterogeneity in Okun coefficients: summary statistics
Variable Obs Mean Std. Dev. Min Max Units
Mean Unemployment 71 8.41 3.87 1.64 20.82 %
Per Capita GDP 70 16.66 17.07 0.76 73.41 Thousands
Shadow Economy 70 28.32 13.40 8.50 65.80 % of official GDP
Services 69 59.19 11.78 12.61 91.38 % of GDP
Skill Mismatch Index 57 0.10 0.08 0.01 0.35 Index- higher values ->higher skill mismatch
Labor market regulations 65 5.89 1.23 3.76 9.13 Rating- higher values -> less regulation
Business regulations 65 6.13 0.84 4.26 8.17 Rating- higher values -> less regulation
21
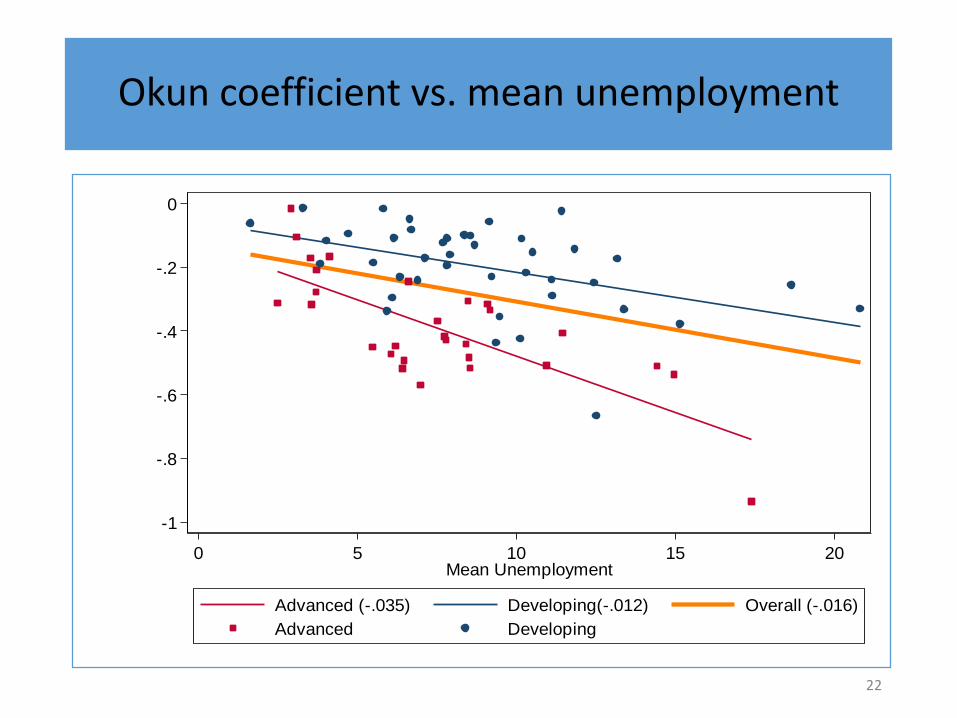
Okun coefficient vs. mean unemployment
-1
-.8
-.6
-.4
-.2
0
0 5 10 15 20Mean Unemployment
Advanced (-.035) Developing(-.012) Overall (-.016)
Advanced Developing
22
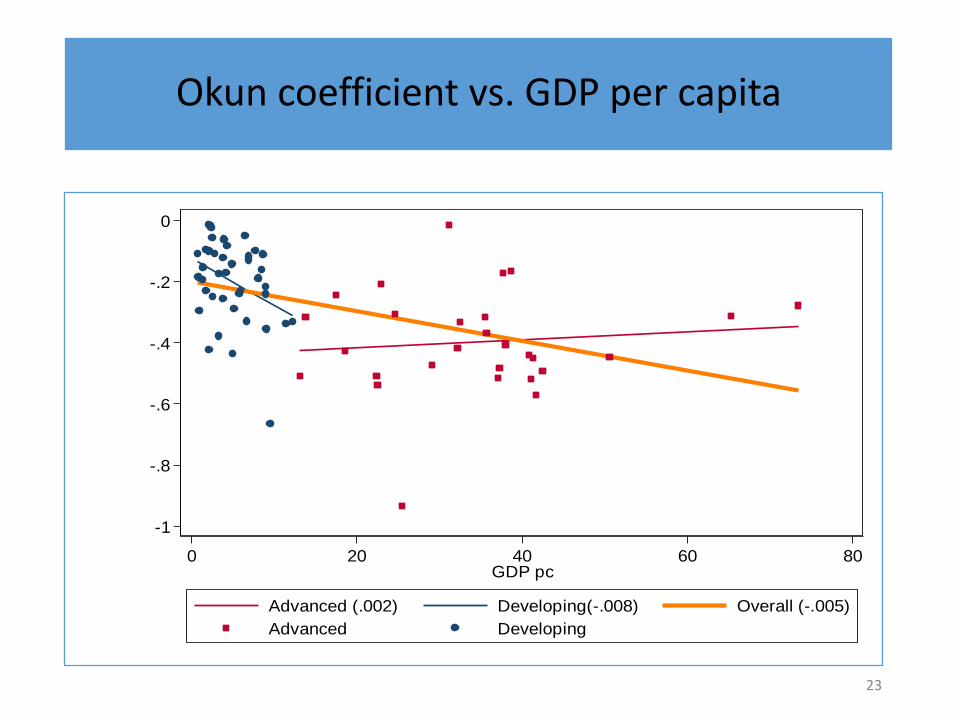
Okun coefficient vs. GDP per capita
-1
-.8
-.6
-.4
-.2
0
0 20 40 60 80GDP pc
Advanced (.002) Developing(-.008) Overall (-.005)
Advanced Developing
23
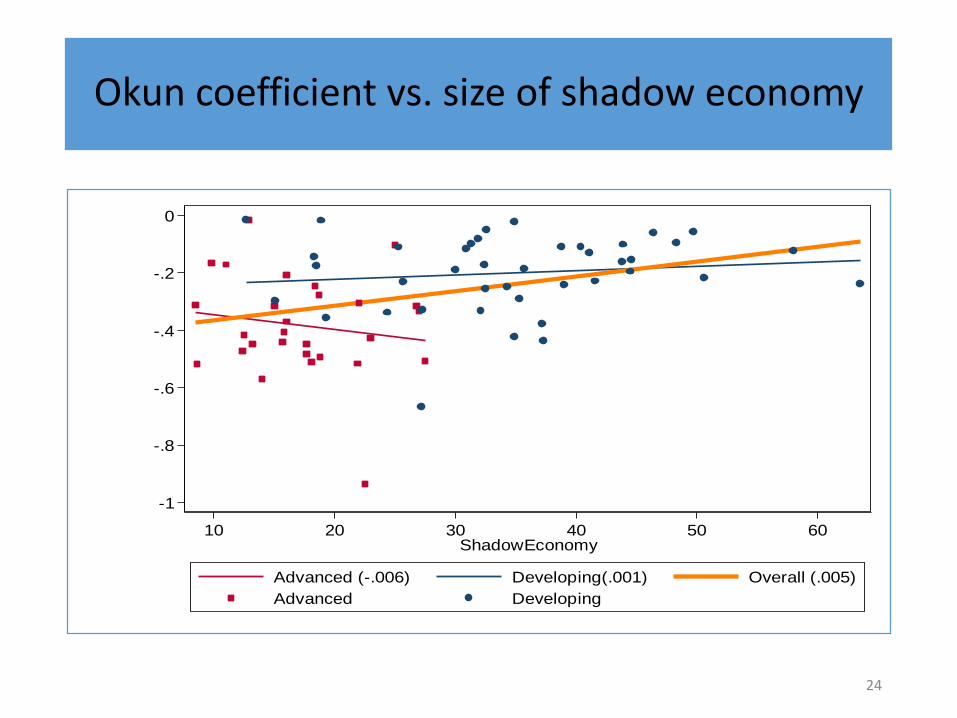
Okun coefficient vs. size of shadow economy
-1
-.8
-.6
-.4
-.2
0
10 20 30 40 50 60ShadowEconomy
Advanced (-.006) Developing(.001) Overall (.005)
Advanced Developing
24
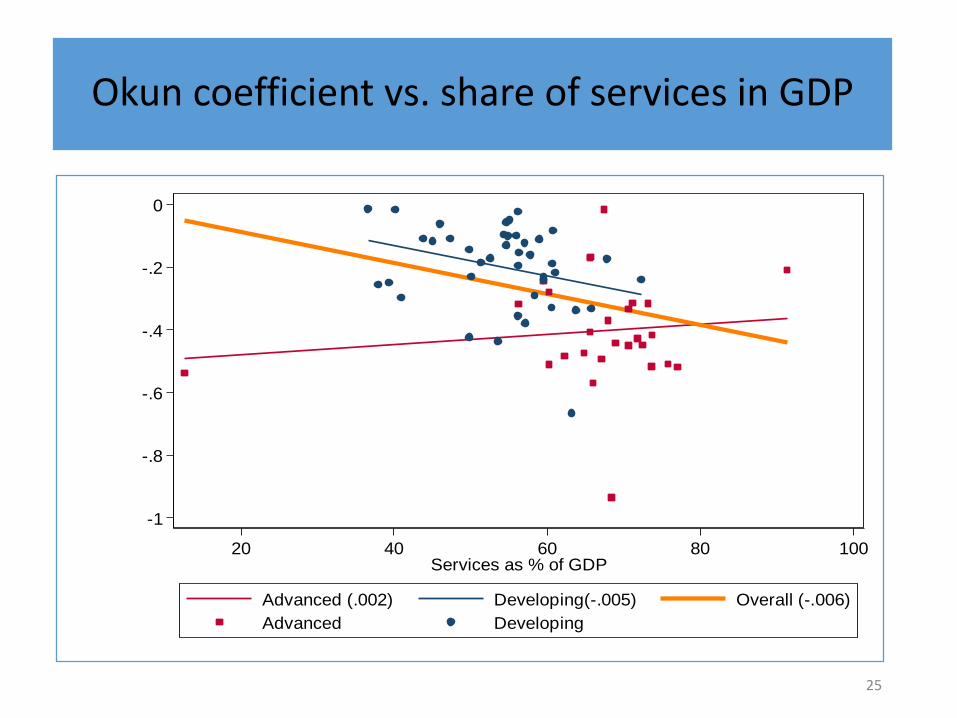
Okun coefficient vs. share of services in GDP
-1
-.8
-.6
-.4
-.2
0
20 40 60 80 100Services as % of GDP
Advanced (.002) Developing(-.005) Overall (-.006)
Advanced Developing
25
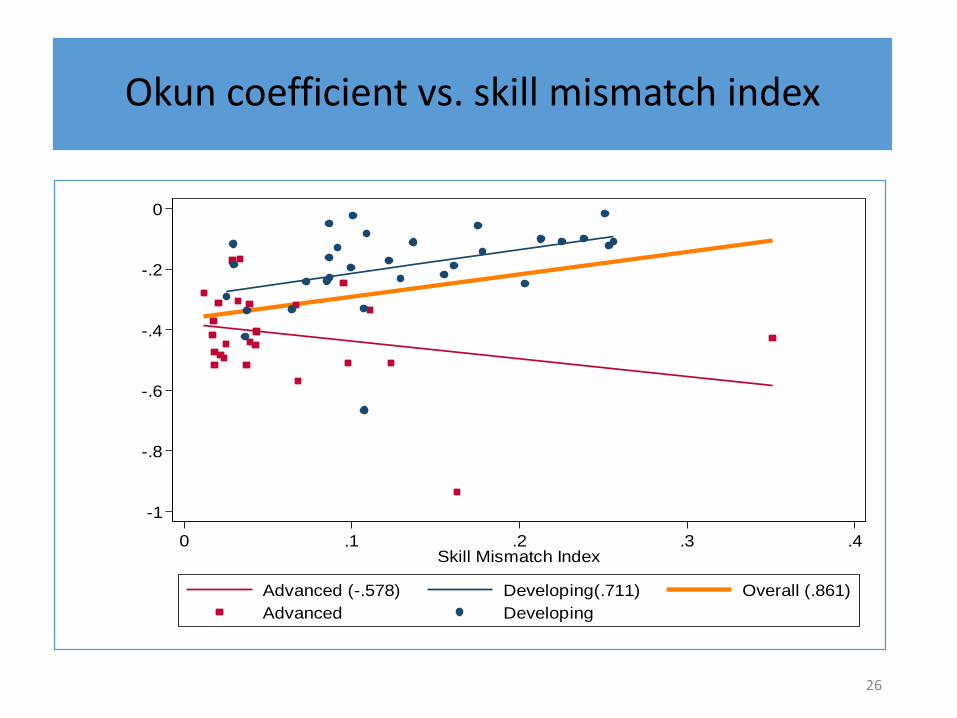
Okun coefficient vs. skill mismatch index
-1
-.8
-.6
-.4
-.2
0
0 .1 .2 .3 .4Skill Mismatch Index
Advanced (-.578) Developing(.711) Overall (.861)
Advanced Developing
26
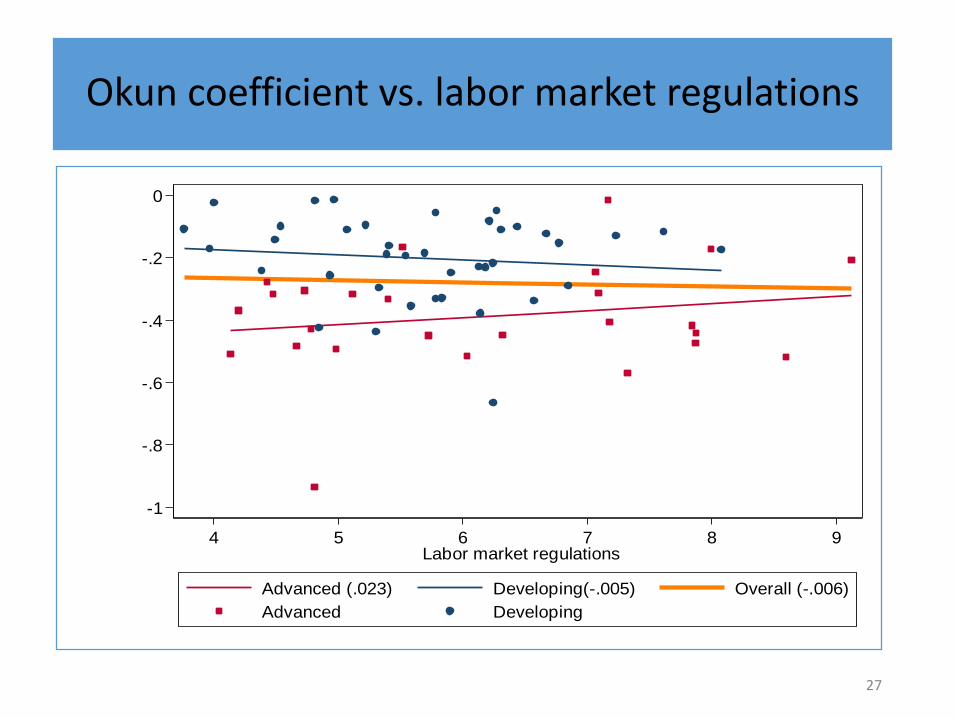
Okun coefficient vs. labor market regulations
-1
-.8
-.6
-.4
-.2
0
4 5 6 7 8 9 Labor market regulations
Advanced (.023) Developing(-.005) Overall (-.006)
Advanced Developing
27
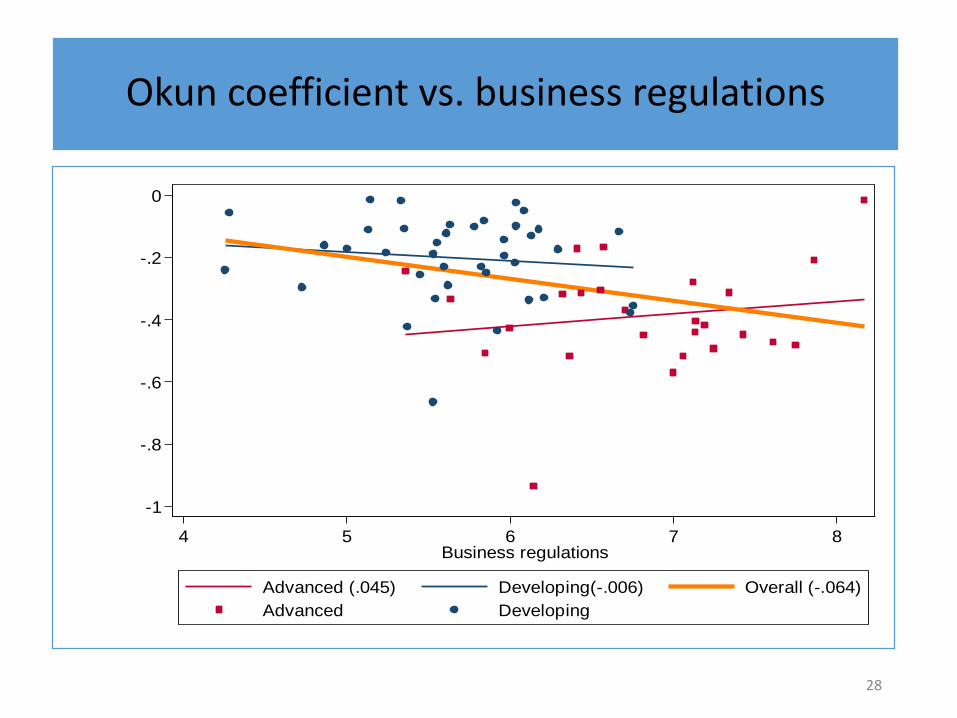
Okun coefficient vs. business regulations
-1
-.8
-.6
-.4
-.2
0
4 5 6 7 8Business regulations
Advanced (.045) Developing(-.006) Overall (-.064)
Advanced Developing
28
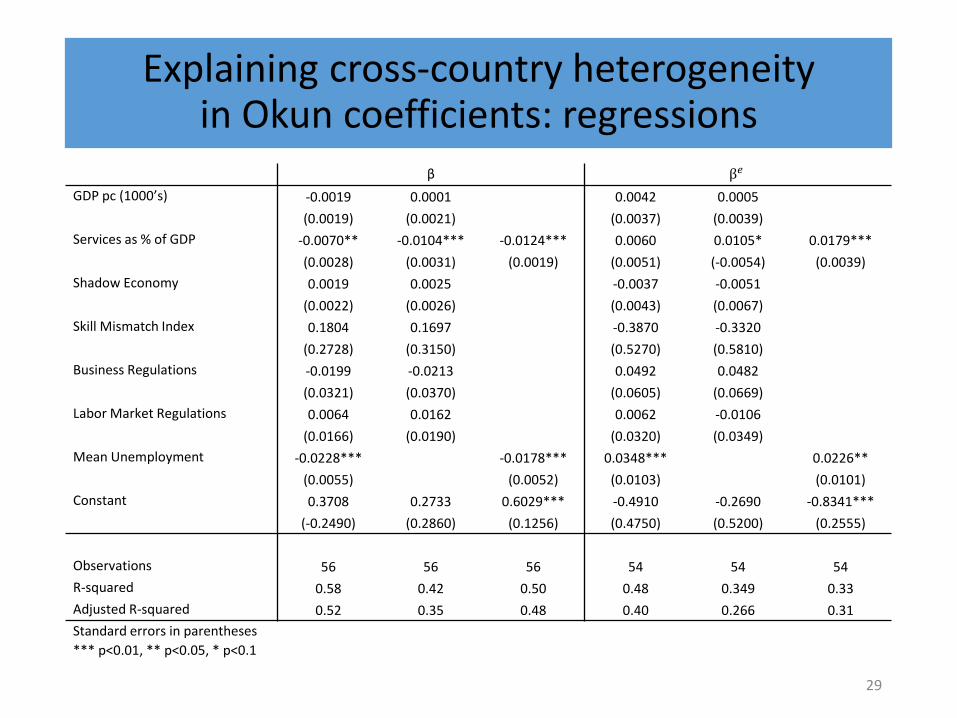
Explaining cross-country heterogeneity in Okun coefficients: regressions
29
β β𝑒
GDP pc (1000’s) -0.0019 0.0001 0.0042 0.0005
(0.0019) (0.0021) (0.0037) (0.0039)
Services as % of GDP -0.0070** -0.0104*** -0.0124*** 0.0060 0.0105* 0.0179***
(0.0028) (0.0031) (0.0019) (0.0051) (-0.0054) (0.0039)
Shadow Economy 0.0019 0.0025 -0.0037 -0.0051
(0.0022) (0.0026) (0.0043) (0.0067)
Skill Mismatch Index 0.1804 0.1697 -0.3870 -0.3320
(0.2728) (0.3150) (0.5270) (0.5810)
Business Regulations -0.0199 -0.0213 0.0492 0.0482
(0.0321) (0.0370) (0.0605) (0.0669)
Labor Market Regulations 0.0064 0.0162 0.0062 -0.0106
(0.0166) (0.0190) (0.0320) (0.0349)
Mean Unemployment -0.0228*** -0.0178*** 0.0348*** 0.0226**
(0.0055) (0.0052) (0.0103) (0.0101)
Constant 0.3708 0.2733 0.6029*** -0.4910 -0.2690 -0.8341***
(-0.2490) (0.2860) (0.1256) (0.4750) (0.5200) (0.2555)
Observations 56 56 56 54 54 54
R-squared 0.58 0.42 0.50 0.48 0.349 0.33
Adjusted R-squared 0.52 0.35 0.48 0.40 0.266 0.31
Standard errors in parentheses
*** p<0.01, ** p<0.05, * p<0.1
Conclusions
• How well does Okun’s Law hold in developing countries?• Results have a ‘half as well’ as in advanced economies
flavor
• Mean unemployment and share of services in GDP help account for half of cross-country variation in Okun coefficients.
• Several directions for future research
30