Embed Size (px)
Citation preview
Does Microfinance Reduce Poverty in Lao PDR?
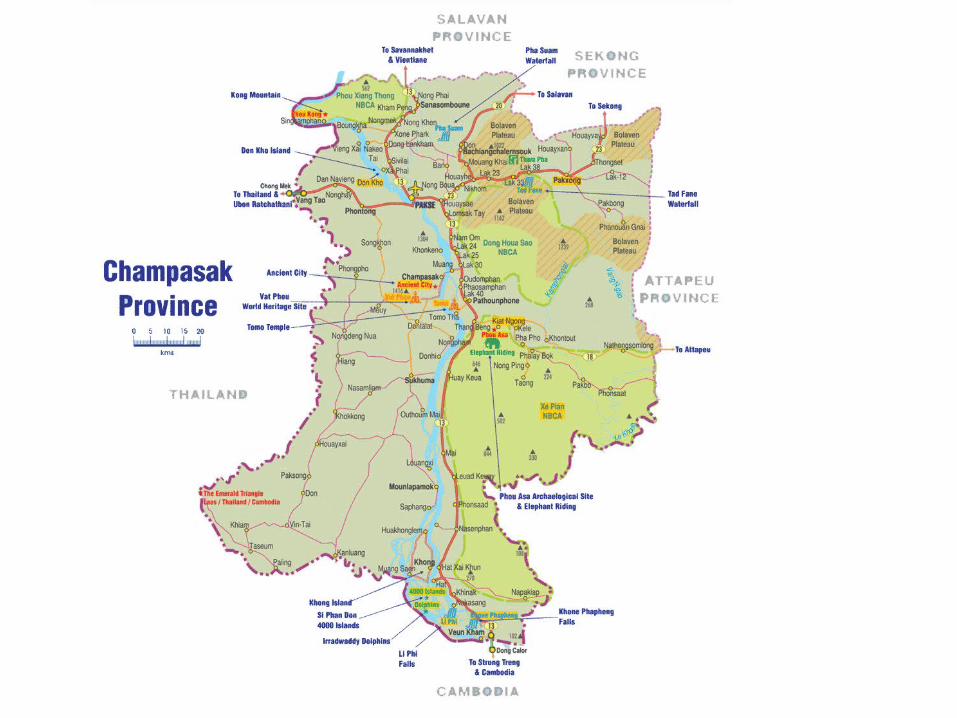
Case study: Sukhuma District Champassak Province, Lao PDR
Mr. Inpaeng SAYVAYA
Faculty of Economics and Business Management,National University of Laos
13 February, 2012
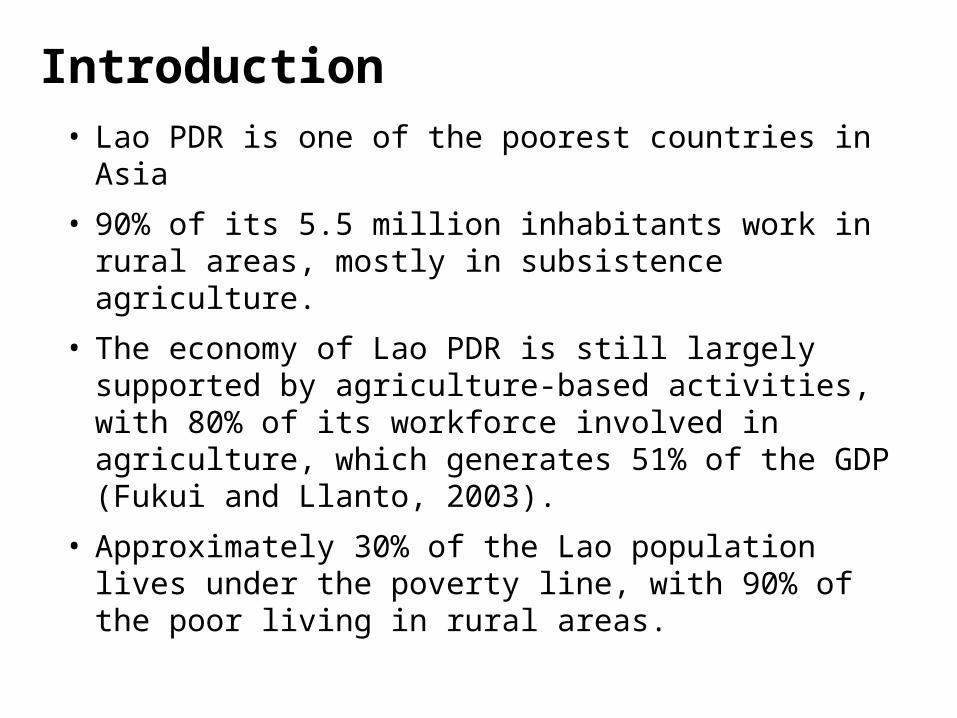
• Lao PDR is one of the poorest countries in Asia
• 90% of its 5.5 million inhabitants work in rural areas, mostly in subsistence agriculture.
• The economy of Lao PDR is still largely supported by agriculture-based activities, with 80% of its workforce involved in agriculture, which generates 51% of the GDP (Fukui and Llanto, 2003).
• Approximately 30% of the Lao population lives under the poverty line, with 90% of the poor living in rural areas.
Introduction
Introduction (Cont.)• There is 11% of the rural population having access to
formal financial institutions, and only 1% making saving deposits (Fukui and Llanto, 2003).
• According to the Bank of Laos (2002), the potential microfinance market is 268,000 borrowers and 560,000 depositors.
• The same report shows that only 25% of this market is currently served by microfinance providers.
• The socio-economy development plan of Champassak province with GDP growth 11.1%, per capita GDP will be USD 1,955 per year and without poor village in 2015
Introduction (Cont.)
• Government and private sectors have to cooperate by supporting to Microfinance Fund for Villages Development (MFVD) for the villages
• The MFVD is used to reduce poverty it has significantly contributed in the livelihoods and socio-economic development
• Soukhoumar District is located in Champassak Province. It is the poorest region among 10 Districts, with 24 poor of 56 villages and 474 poor of 33,245 households (PID of Champassak Province, 2009).
Introduction (Cont.)
• Mostly of its population are farmers and get poor production in every year,
• The government sector tries to solve this problem to graduate poor households from list of poor districts of Lao PDR
• The MFVD has become to be an important tool to reduce poverty.
• So researcher wonder if sustainable rural development and MFVD can be effective tools for poverty reduction. It is important to look for the answers
Research questions
1. Why did the villagers would like to be or not a member
of microfinance?
2. What benefits did members get from the microfinance?
3. How does microfinance effects on income of
microfinance’s members and poverty reduction?
The study will seek to answer the following questions:
Objective of study
1. To assess the benefits of villagers getting from the
microfinance.
2. To compare their livelihoods between members and
non-members of microfinance
3. To examine the impact of microfinance on income of
members and poverty reduction.
Scope of this study Focus on assess the benefits of members as taking loans
from microfinance for productive purposes such as:
• Cultivation, livestock-breeding, • Handicraft,• Trading and services
Analyses the impacts of microfinance on income of microfinance’s members and poverty reduction.
Area is limited to Sukhuma district, Champassak province, covering all 24 poor villages.
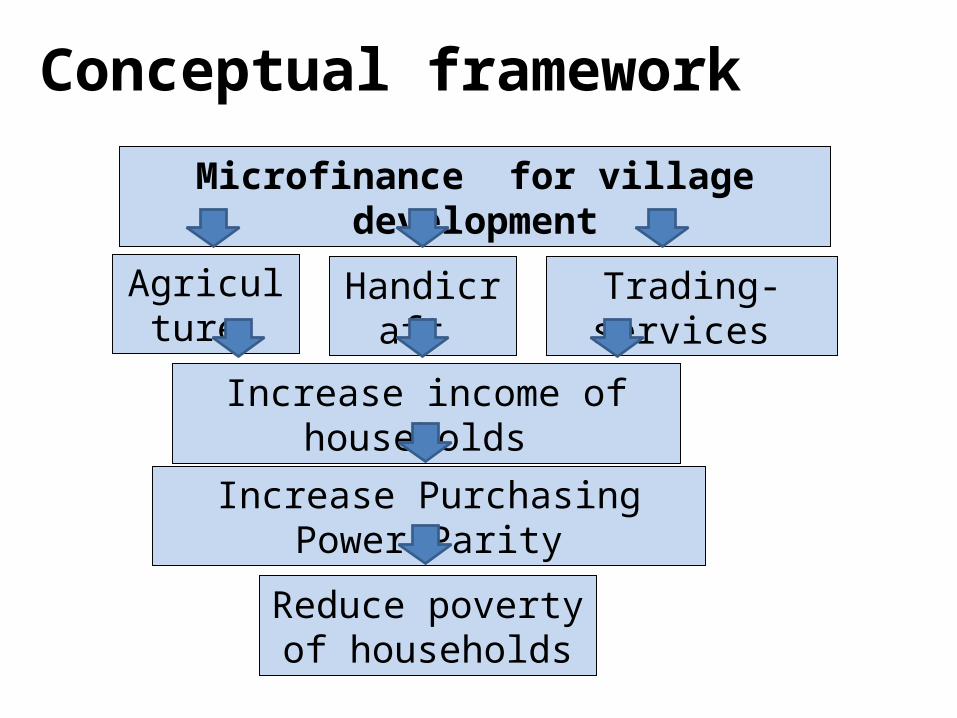
Conceptual framework
Microfinance for village development
Agriculture Handicraft Trading-services
Increase income of households
Increase Purchasing Power Parity
Reduce poverty of households
Hypothesis of study
1) Microfinance increases the level of income among the microfinance’s member of households.
2) Microfinance reduces the level of poverty among the microfinance’s member of households.
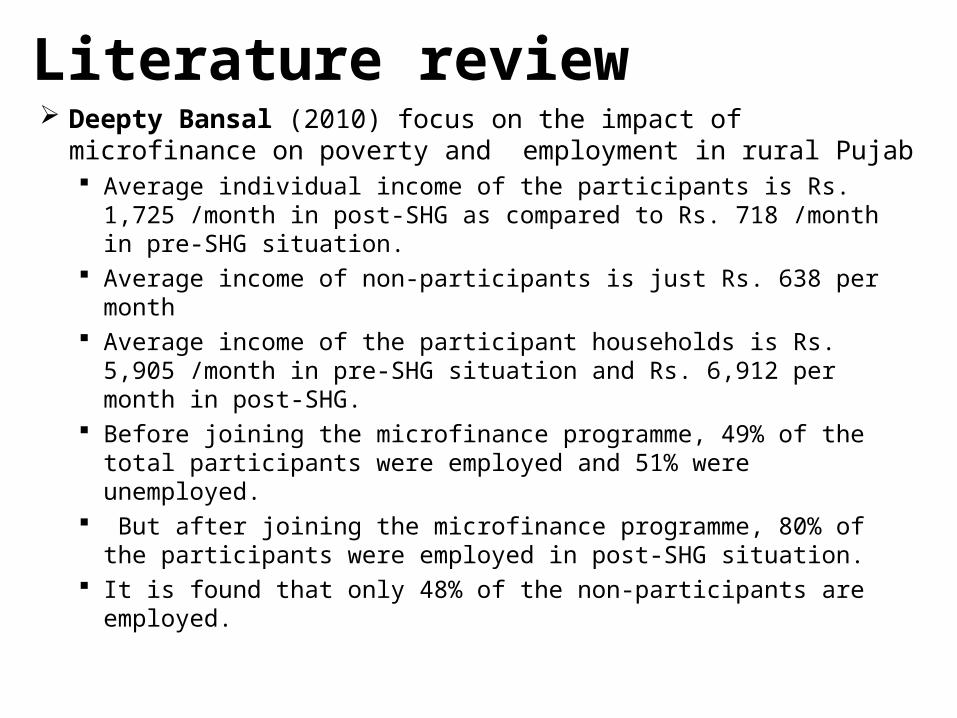
Literature review Deepty Bansal (2010) focus on the impact of microfinance on
poverty and employment in rural Pujab Average individual income of the participants is Rs. 1,725 /month
in post-SHG as compared to Rs. 718 /month in pre-SHG situation. Average income of non-participants is just Rs. 638 per month Average income of the participant households is Rs. 5,905 /month
in pre-SHG situation and Rs. 6,912 per month in post-SHG. Before joining the microfinance programme, 49% of the total
participants were employed and 51% were unemployed. But after joining the microfinance programme, 80% of the
participants were employed in post-SHG situation. It is found that only 48% of the non-participants are employed.
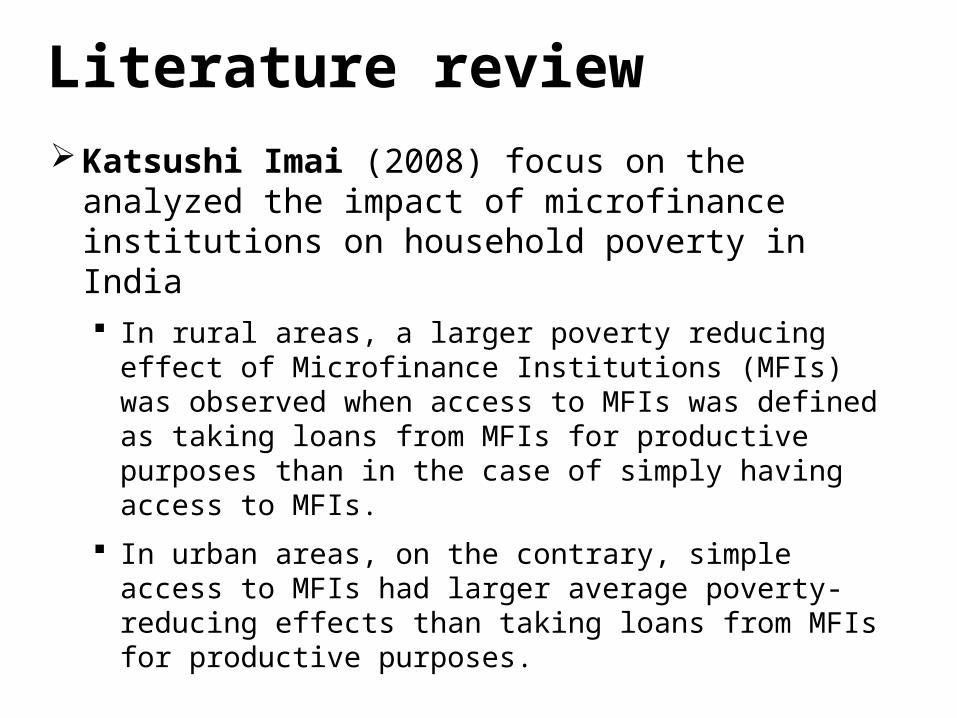
Literature review Katsushi Imai (2008) focus on the analyzed the impact
of microfinance institutions on household poverty in India In rural areas, a larger poverty reducing effect of
Microfinance Institutions (MFIs) was observed when access to MFIs was defined as taking loans from MFIs for productive purposes than in the case of simply having access to MFIs.
In urban areas, on the contrary, simple access to MFIs had larger average poverty-reducing effects than taking loans from MFIs for productive purposes.
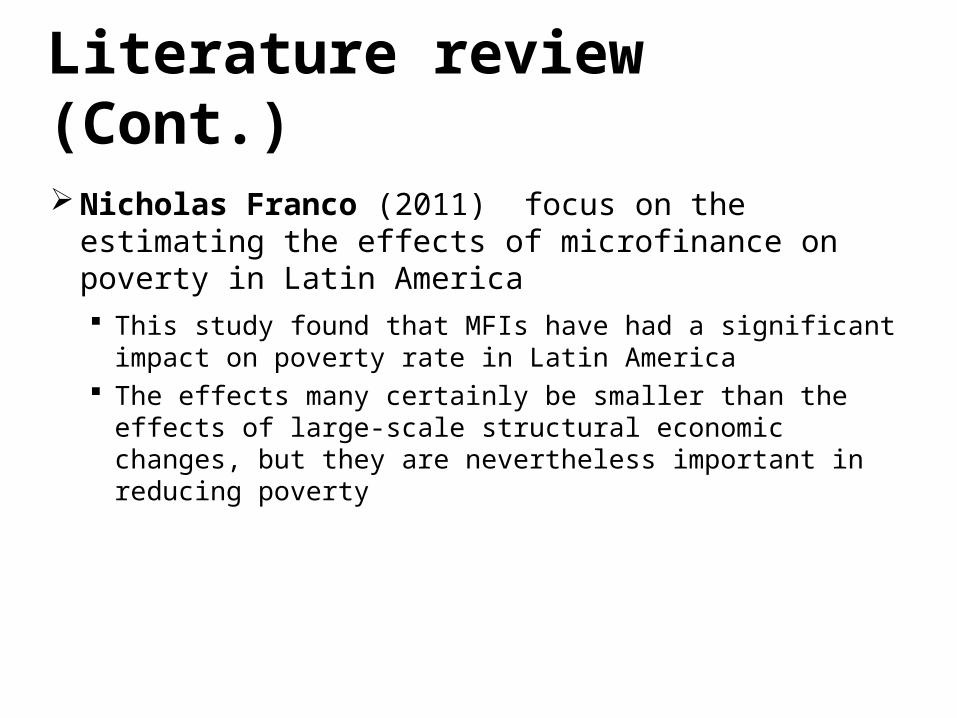
Literature review (Cont.)
Nicholas Franco (2011) focus on the estimating the effects of microfinance on poverty in Latin America This study found that MFIs have had a significant impact on
poverty rate in Latin America The effects many certainly be smaller than the effects of
large-scale structural economic changes, but they are nevertheless important in reducing poverty
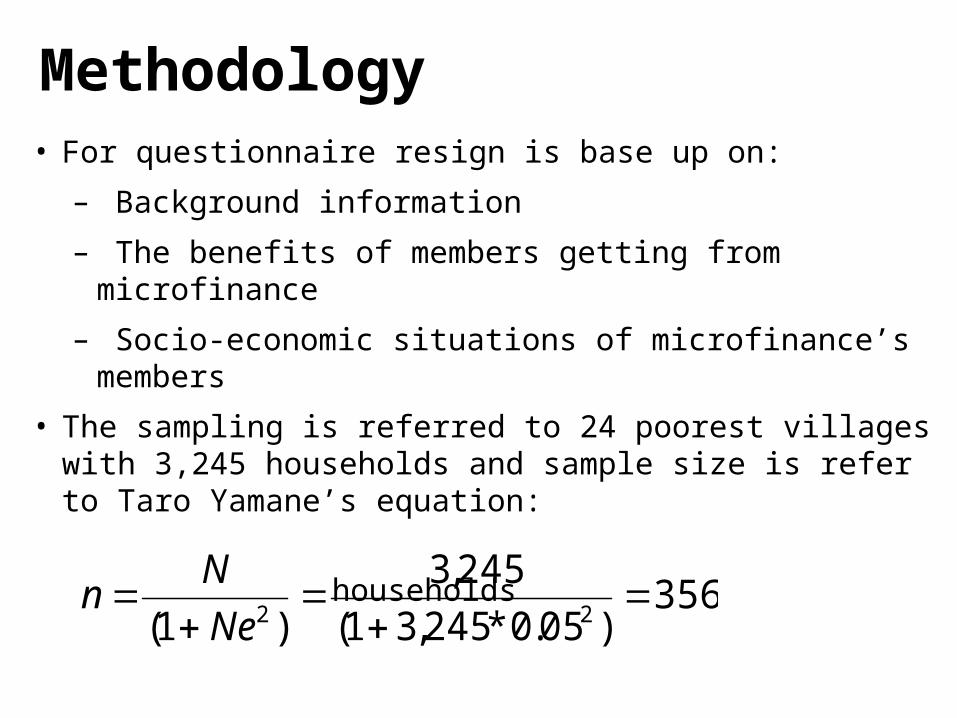
Methodology• For questionnaire resign is base up on:
– Background information
– The benefits of members getting from microfinance
– Socio-economic situations of microfinance’s members
• The sampling is referred to 24 poorest villages with 3,245 households and sample size is refer to Taro Yamane’s equation:
households 356)05.0*245,31(
245,3
)1( 22
Ne
Nn
Methodology (Cont.)
Primary data collection, two target groups of samples are interviewed like: Members and Non members
To random sampling techniques for the selection of 356 households for the household survey from 24 poorest villages located in Sukhuma district.
The questionnaire will be taken to pre-tested in a pilot survey to evaluate its effectiveness.
The feedback from the pre-test will be used to revise the questionnaire.
The questionnaire will be taken to field survey
Data collection and Data analysis
Methodology (Cont.)
Secondary data collection
• Data related Microfinance and poverty will be collected
• Rural Development Office (RDO)
• Planning Investment Department (PID)
• Asia Resource Centre for Microfinance (ARCM)
• Internet..
Methodology (Cont.) Data Analysis• Microsoft-Excel 2007 and SPSS 18 will be used to apply
various statistical techniques.
• A number of statistical techniques, such as: T-test, Chi-square testOrdinary Least Squares (OLS) panel regression
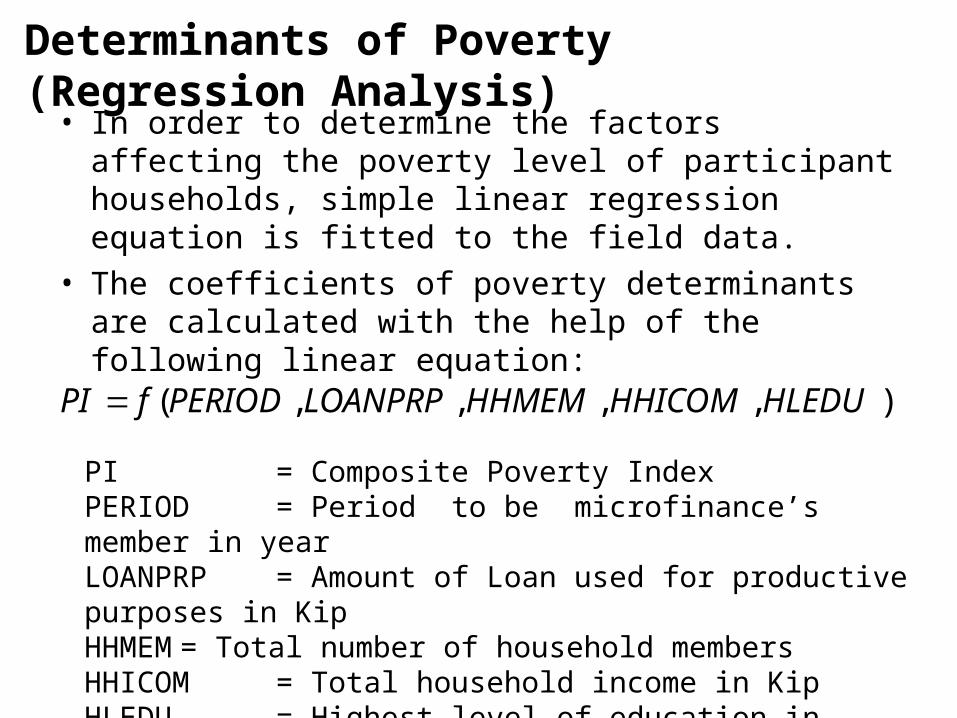
Determinants of Poverty (Regression Analysis)• In order to determine the factors affecting the poverty
level of participant households, simple linear regression equation is fitted to the field data.
• The coefficients of poverty determinants are calculated with the help of the following linear equation:
),,,,( HLEDUHHICOMHHMEMLOANPRPPERIODfPI
PI = Composite Poverty IndexPERIOD = Period to be microfinance’s member in yearLOANPRP = Amount of Loan used for productive purposes in KipHHMEM = Total number of household membersHHICOM = Total household income in KipHLEDU = Highest level of education in family.

THANK YOU FOR YOUR ATTENTION
DISCUSSION AND RECOMMENDED

T-test
The t-test is applied to test the significance of various
results obtained from the analysis of surveyed data in the
following ways:
1. Testing difference between means of two
independent samples
2. Testing difference between means of two
dependent samples.
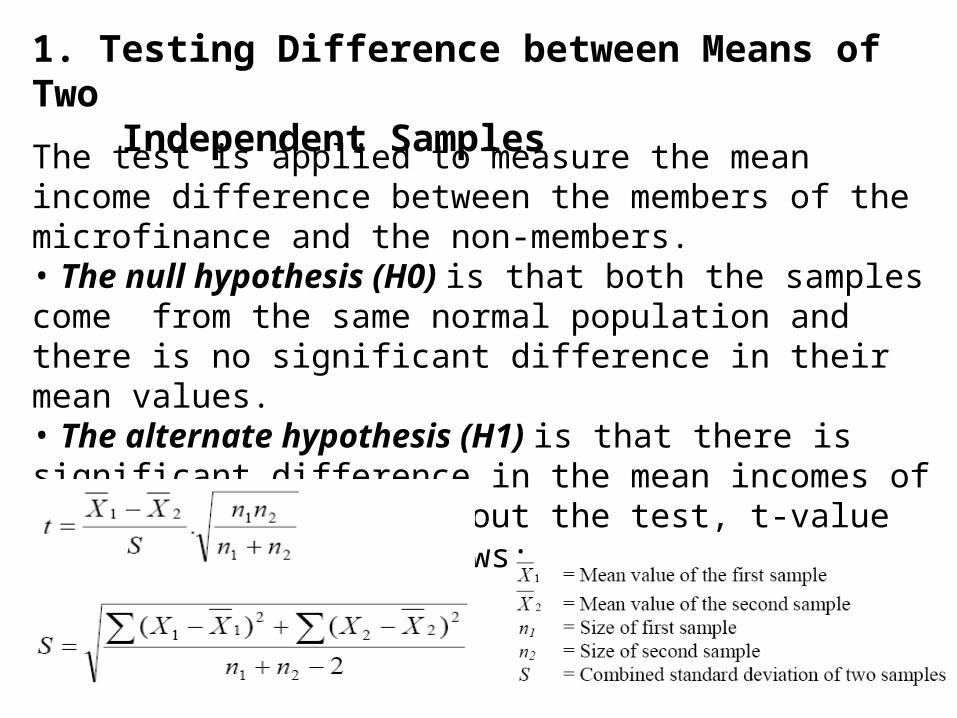
The test is applied to measure the mean income difference between the members of the microfinance and the non-members. • The null hypothesis (H0) is that both the samples come from the same normal population and there is no significant difference in their mean values. • The alternate hypothesis (H1) is that there is significant difference in the mean incomes of two samples. To carry out the test, t-value is calculated as follows:
1. Testing Difference between Means of Two Independent Samples
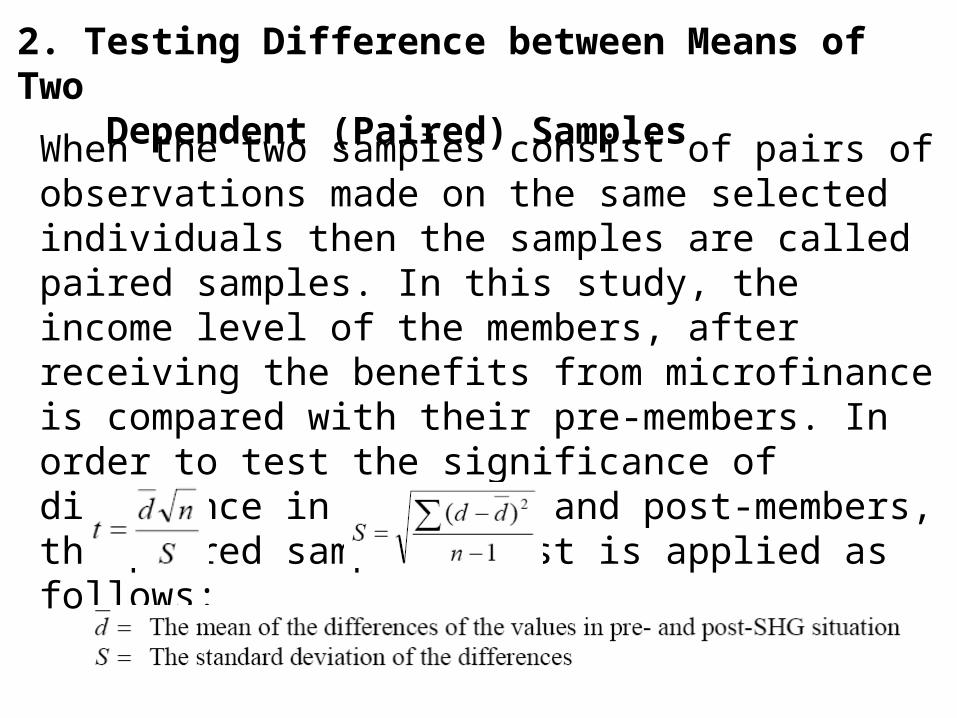
When the two samples consist of pairs of observations made on the same selected individuals then the samples are called paired samples. In this study, the income level of the members, after receiving the benefits from microfinance is compared with their pre-members. In order to test the significance of difference in the pre- and post-members, the paired sample t-test is applied as follows:
2. Testing Difference between Means of Two Dependent (Paired) Samples

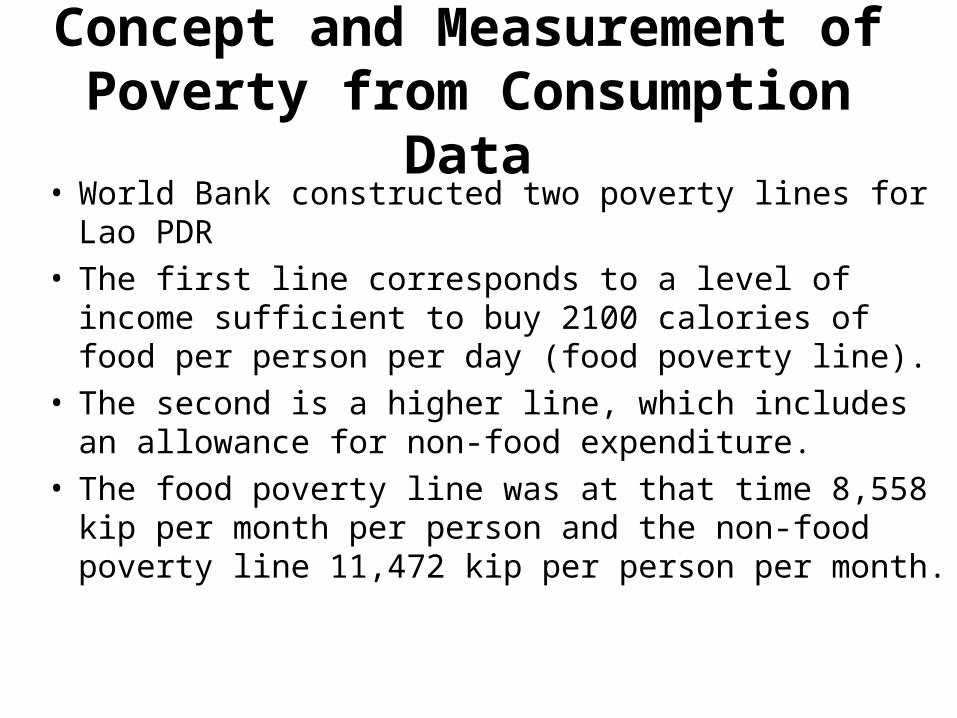
Concept and Measurement of Poverty from Consumption Data
• World Bank constructed two poverty lines for Lao PDR• The first line corresponds to a level of income sufficient
to buy 2100 calories of food per person per day (food poverty line).
• The second is a higher line, which includes an allowance for non-food expenditure.
• The food poverty line was at that time 8,558 kip per month per person and the non-food poverty line 11,472 kip per person per month.
Construction of New Poverty Lines
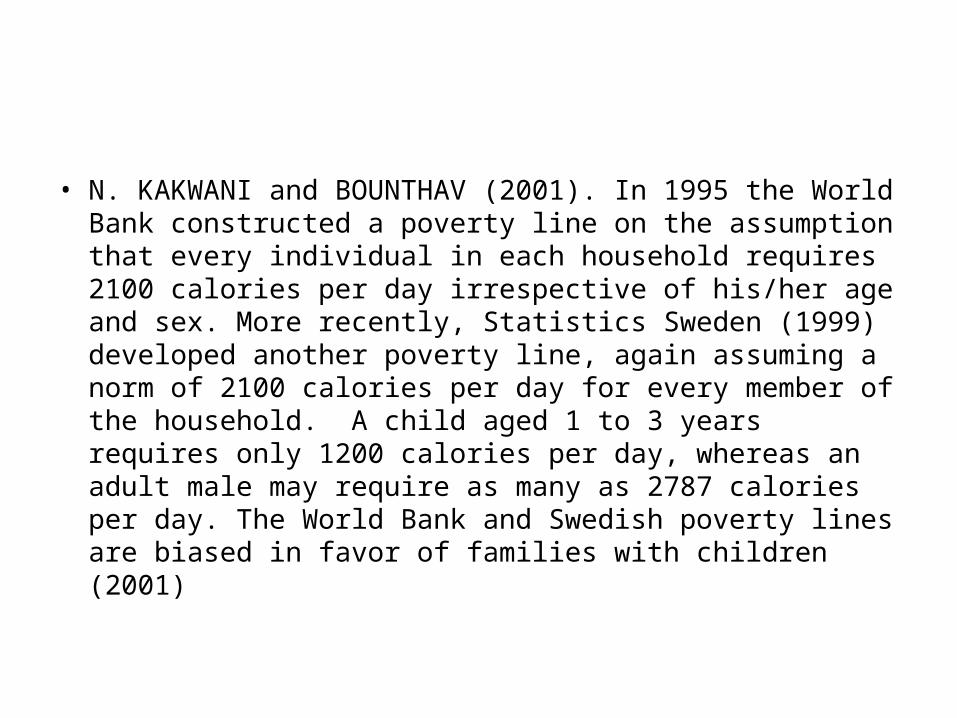
• N. KAKWANI and BOUNTHAV (2001). In 1995 the World Bank constructed a poverty line on the assumption that every individual in each household requires 2100 calories per day irrespective of his/her age and sex. More recently, Statistics Sweden (1999) developed another poverty line, again assuming a norm of 2100 calories per day for every member of the household. A child aged 1 to 3 years requires only 1200 calories per day, whereas an adult male may require as many as 2787 calories per day. The World Bank and Swedish poverty lines are biased in favor of families with children (2001)
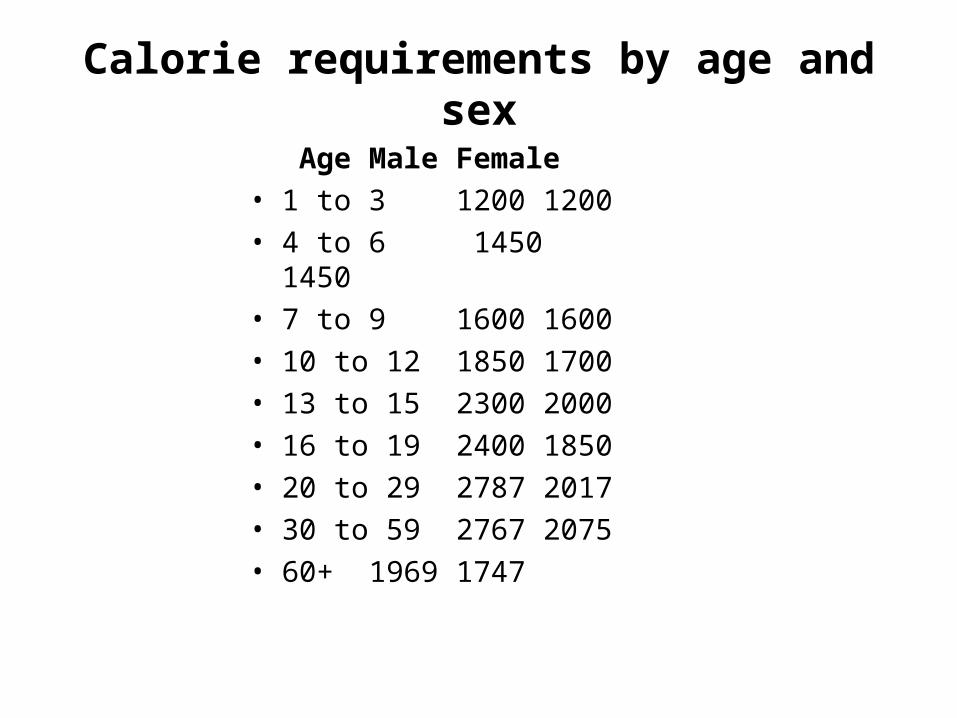
Calorie requirements by age and sex
Age Male Female• 1 to 3 1200 1200• 4 to 6 1450 1450• 7 to 9 1600 1600• 10 to 12 1850 1700• 13 to 15 2300 2000• 16 to 19 2400 1850• 20 to 29 2787 2017• 30 to 59 2767 2075• 60+ 1969 1747
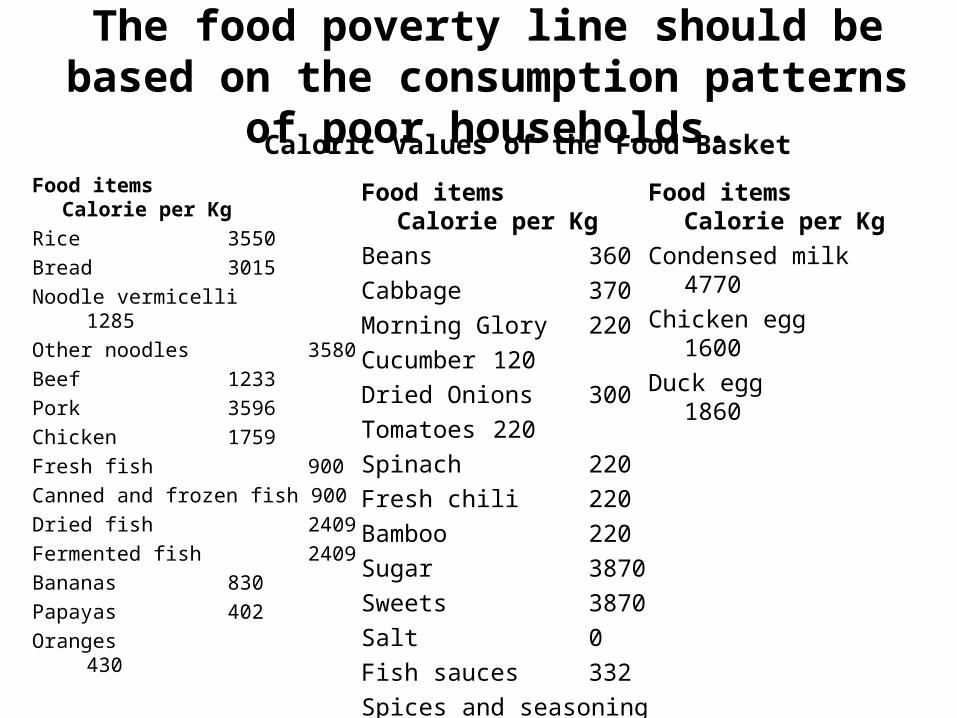
The food poverty line should be based on the consumption patterns of poor households.
Food items Calorie per KgRice 3550Bread 3015Noodle vermicelli 1285Other noodles 3580Beef 1233Pork 3596Chicken 1759Fresh fish 900Canned and frozen fish 900Dried fish 2409Fermented fish 2409Bananas 830Papayas 402Oranges 430
Food items Calorie per KgBeans 360Cabbage 370Morning Glory 220Cucumber 120Dried Onions 300Tomatoes 220Spinach 220Fresh chili 220Bamboo 220Sugar 3870Sweets 3870Salt 0Fish sauces 332Spices and seasoning 0
Caloric Values of the Food Basket
Food items Calorie per KgCondensed milk
4770Chicken egg 1600Duck egg
1860
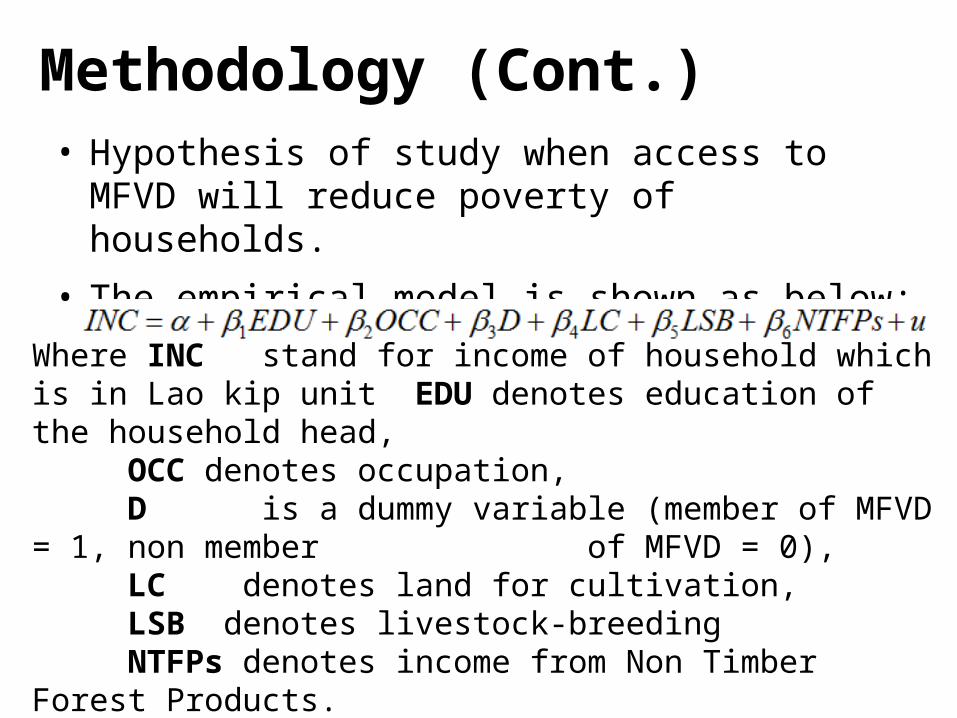
• Hypothesis of study when access to MFVD will reduce poverty of households.
• The empirical model is shown as below:
Methodology (Cont.)
Where INC stand for income of household which is in Lao kip unit EDU denotes education of the household head,
OCC denotes occupation, D is a dummy variable (member of MFVD = 1, non member of MFVD = 0), LC denotes land for cultivation, LSB denotes livestock-breedingNTFPs denotes income from Non Timber Forest Products.
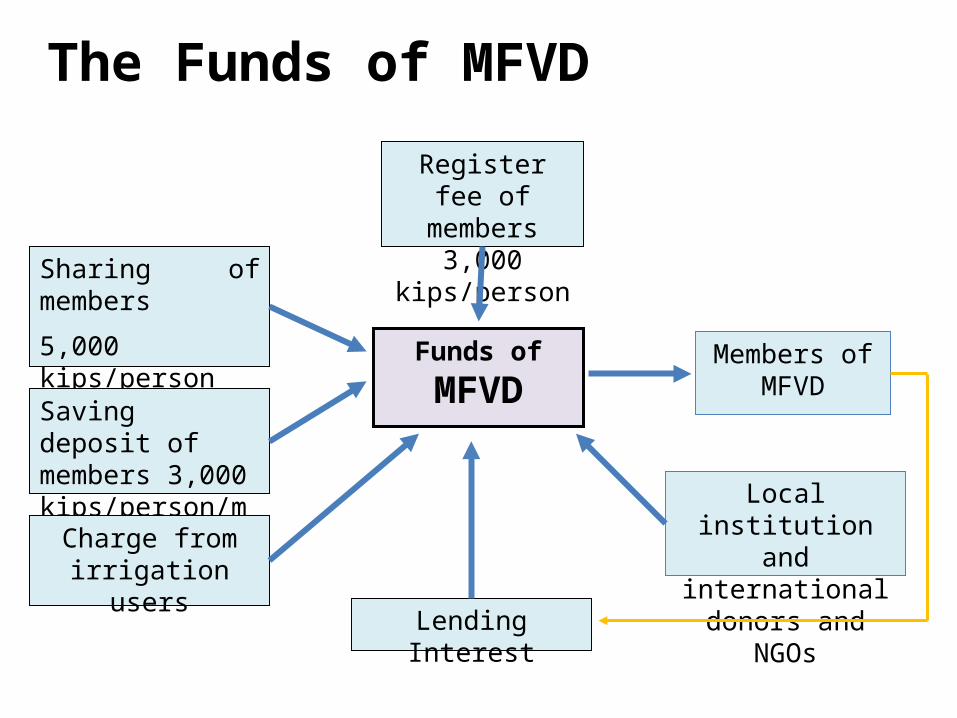
Register fee of members 3,000
kips/person
Sharing of members
5,000 kips/person per month Funds of
MFVDSaving deposit of members 3,000 kips/person/month
Charge from irrigation users
Lending Interest
Local institution and international donors and NGOs
Members of MFVD
The Funds of MFVD
• MFVD’s organized by people in the villages, which has
called “Microfinance” it provides cash investment to
low income households, which including business owner
Microfinance Fund for Villages Development (MFVD)