Embed Size (px)
Citation preview
Does Market Structure Affect the Immediacy of Stock Price
Responses to News?*
Ronald W. Masulis
Owen Graduate School of Management
Vanderbilt University
Nashville, TN 37203
Lakshmanan Shivakumar
London Business School
London, NW1 4SA
United Kingdom
August 31, 2001
* We are grateful to Tarun Chordia, Bill Christie, Shane Corwin, Dean Furbush, Roger Huang, Debra Jeter, Craig Lewis, Paul Malatesta, Tim McCormick, Paul Schultz, C. Sinha, George Sofianos, Hans Stoll, an anonymous referee and finance workshop participants at the Universities of Colorado and Connecticut, Dartmouth College and Rutgers, Tulane and Vanderbilt Universities, the European Financial Management Association meetings, 1997 and the NASDAQ-Notre Dame University Microstructure Conference, 1999 for useful discussions and to Christoph Schenzler for expert programming assistance. Financial support from the Financial Markets Research Center at Vanderbilt University is gratefully acknowledged.
2
ABSTRACT
This study uses transactions data to compare the speed of price adjustments to seasoned equity
offering announcements by NYSE/AMEX and NASDAQ stocks. We find that price adjustments
following offering announcements are significantly faster on NASDAQ than on the NYSE/AMEX and
that the difference in reaction times can be as much as one hour. This result is not due to differences
in issuer characteristics or the size of announcement effects across the markets. On average offers
are smaller, equity capitalization is lower and trading is less frequent for NASDAQ firms, all of which
should slow their price reaction speed relative to NYSE/AMEX firms. Further analysis suggests that
the faster price reaction of NASDAQ stocks is due to several differences in market structure. We find
evidence that greater risk-taking by NASDAQ dealers, more rapid electronic order execution on
NASDAQ, a more potent information trading threat (SOES bandits) on NASDAQ, stale limit orders on
the NYSE/AMEX and a less efficient price discovery mechanism at the open of the NYSE/AMEX, all
contribute to more rapid NASDAQ stock price adjustments.
3
1. Introduction
This study examines how different stock markets affect the speed with which new information
is incorporated into prices. Using transactions data, we compare the price reaction speeds on
NASDAQ with those on the New York Stock Exchange (NYSE) and American Stock Exchange
(AMEX). These markets are governed by separate rules and employ distinctly different organizational
structures. Thus, they offer us the opportunity to explore how these structural differences affect the
speed of price reaction to news.
A number of prior studies examine the impact of alternative market structures on stock return
volatility (e.g., Amihud and Mendelson (1987), Stoll and Whaley (1990), Masulis and Ng (1995)). We
extend this comparative analysis by examining price adjustment speeds across markets to a common
type of information event, an announcement of seasoned equity offering (SEO).1 This comparison is
also interesting because all the markets are in the U.S., which holds constant the underlying
economic, legal and regulatory environment. We document evidence pointing to several causes for
differences in price reaction speeds across these markets, furthering our understanding of how
various trading mechanisms affect price discovery.
The speed of price reaction to news is of interest not only to investors and market
microstructure researchers, but is very relevant to stock exchanges facing increased competition from
foreign markets expanding their trading hours and from the creation of new electronic communication
networks (ECNs). The competitive positions of stock markets can be significantly changed, not only
by the cost of trading, but also by the timeliness of trades and the accuracy and transparency of
prices. Thus, understanding how various market mechanisms and rules affect the price discovery
process can be very important to the ultimate success of competing stock markets. These issues are
also relevant to market regulators, who are continually confronted with the need to enact regulations in
response to technological change in trading environments so as to enhance accuracy of prices without
favoring some markets over others.
1 Lease, Masulis and Page (1991) examine microstructure effects on SEO offering date returns.

4
To preview our results, we find stock price reactions are significantly faster on NASDAQ
compared to the NYSE/AMEX and that difference can be as much as one hour. Since stock
characteristics and the information conveyed by SEO announcements can differ across the exchange
samples, we examine their role in explaining the faster price reactions on NASDAQ. We show that the
faster price changes on NASDAQ cannot be attributed to differences in (1) magnitudes of two-day
announcement returns, (2) frequencies of trading halts, (3) frequencies of overnight and daytime
announcements, or (4) equity capitalization, trading frequencies or bid-ask spreads. This suggests
that the average difference in price reaction speeds across these markets is not due to cross-
exchange differences in issuer or offering characteristics. In fact, the evidence is more striking when
these differences in characteristics are accounted for.
When we examine market microstructure features, we find that NASDAQ’s faster electronic
execution system, greater quote depth and dealer risk-bearing, along with the threat of SOES bandits
and stale NYSE/AMEX limit orders, all contribute to NASDAQ’s faster price reaction. For overnight
announcements, the opening mechanism on NASDAQ appears to disseminate price information more
efficiently, consistent with several recent studies. Overall, we find market microstructure features are
more important than stock or offer characteristics in explaining differences in price reaction speeds to
news.
The remainder of the paper is organized as follows. In section 2 we review institutional details
and discuss possible causes for differences in price reaction speeds across the exchanges. Section 3
discusses our methodology and data and the following section presents the empirical results. In
section 5, we examine the out-of-sample validity of our findings using more recent data and in section
6, conclude.
2. Institutional Details
The NYSE and AMEX are order-driven continuous auction markets, with individual market
makers called specialists assigned to each stock. Specialists facilitate continuous trading by posting
quotes for their own account or by reflecting the best quotes on their limit order book. Limit orders

5
play a major role in providing immediacy and liquidity on the NYSE/AMEX as seen by the fact that
over 80% (88%) of the volume on NYSE (AMEX) arise from trades in which the specialists do not
participate for their own account.2 In contrast, the NASDAQ market is based on a competing dealer
system in which each dealer continually posts firm bid and ask quotes on an electronic screen.
Further, there is no central limit order book on NASDAQ, although limit orders may be left with
individual broker-dealers. However, unlike the NYSE/AMEX, limit orders on NASDAQ do not drive the
posted quotes since dealers are not required to set quotes equal to or better than the inside limit
orders.3 Also, dealer competition is diminished by rules allowing directed order flow to preferred
dealers, who agree to trade at the best posted quotes.
Other institutional differences between the NYSE/AMEX and NASDAQ markets can affect
price adjustment speeds. Limit orders on the NYSE/AMEX cannot be updated instantaneously, nor
can they be conditioned on public information such as the stock’s last transaction price. Thus, limit
prices can be temporarily stale following price relevant news releases. This slow updating of limit
orders can delay revisions in the specialist’s bid and ask quotes. Elimination of stale limit orders
following negative news can be delayed by the uptick rule because it prevents arbitrageurs from short
selling the stock on a price down tick or a zero tick following a down tick. Alexander-Peterson (1999)
documents that the uptick rule significantly delays and often precludes execution of NYSE short sales.
NASDAQ dealers must post firm bid and ask quotes for at least 1000 shares and can not rely
on investor limit orders to substitute for their quote obligations. Neither NASDAQ dealers nor
investors are constrained in our observation period from short selling by an uptick rule.4 Thus, if
dealers do not immediately adjust their quotes to new information, they are vulnerable to other traders
selectively hitting their stale quotes, causing them trading losses. Hence, NASDAQ dealers have
strong financial incentives to immediately revise their quotes following public announcements, even in
the absence of trades. In contrast, NYSE/AMEX specialists are less vulnerable to information traders
2 1992 NYSE and AMEX fact books respectively. Stoll (1985) estimates that in approximately half of trades in which specialists participate, they act as brokers in executing limit orders. 3 Since January 1997, NASDAQ dealers are required to either execute or display customer limit orders. However, NASDAQ continues not to have a centralized book of limit orders. 4 As of September 6, 1994, NASDAQ adopted a rule similar to the NYSE uptick rule.
6
for several reasons. First, specialists frequently quote the best limit orders on their books, rather than
quote for their own account. Since the execution of posted quotes often has no impact on specialists’
inventory positions or wealth, their incentives to immediately adjust quotes to new information are
reduced. Second, the specialists’ required quote depth is one round lot of 100 shares. Third, when
quoting for their own accounts specialists benefit from manual execution of SuperDot electronic
orders, which allows them to step away from incoming market orders just prior to execution.5 In
addition, specialists also have affirmative obligation to stabilize prices, which creates incentives for
them to buy some stock when prices are falling, especially in the face of temporary order imbalances.
This behavior can slow the price adjustment process on the NYSE/AMEX as Madhavan and Sofianos
(1998) and Madhavan and Panchapagesan (2000) document. In addition, the specialist’s obligation to
provide price continuity can reinforce this effect since it requires them to go tick by tick through the
limit order book.6 In summary, these considerations suggest NASDAQ quotes should react faster to
public announcements than NYSE/AMEX quotes.
The market reaction speeds may also differ due to cross-exchange differences in the trade
execution systems. Incoming market orders on the NYSE/AMEX are manually executed on the
exchange floor to expose them to potential new market orders from specialists and floor brokers that
can better the currently posted quotes. Smaller NYSE orders routed through the Super DOT
execution system can substantially reduce this execution time. In contrast, during the period
examined in this study, the best price quotes of NASDAQ stocks were electronically disseminated.
For orders of 1000 shares or less, electronic execution on the small order execution system(SOES)
was available. Thus, NASDAQ investors could often execute trades more expeditiously, but with little
opportunity for price enhancement. These differences in trading mechanisms may also facilitate faster
order execution on NASDAQ than on the NYSE/AMEX.
For overnight news, the opening price setting mechanism has a potentially important impact on
price adjustment speed. Opening prices on NYSE/AMEX are generally set in a process resembling a
5 Madhavan and Sofianos (1998) and Kavajecz (1999) report evidence consistent with these patterns. 6 NYSE staff members indicate this is unlikely to explain delays as long as even 15 minutes, since the price stabilization obligation can be met by quickly trading down the price in 100 share orders.
7
call auction. Each specialist examines overnight orders and the limit order book before choosing an
opening price. Order imbalances can be offset by a specialists trading for their own accounts or by
delaying the opening to allow for offsetting order flow. Stoll and Whaley (1990) demonstrate that the
reduced competition enjoyed by specialists at the open increases the noise in NYSE/AMEX opening
prices. Price stabilization obligations of specialists can compound this problem by encouraging them
to buy stock when the opening price is far away from the prior close. Finally, NYSE/AMEX limit order
investors cannot observe the limit order book, thereby allowing more disparate opinions, which can
further slow price adjustments.
In contrast to the NYSE/AMEX, trading on NASDAQ opens with competing dealers posting firm
quotes. However, the dealers can post indicative quotes over the two hours prior to the official open.
Cao, Ghysels and Hathaway (2000) report that this pre-opening process conveys significant
information to other dealers, thereby aiding price discovery. So the NASDAQ pre-opening process
can also increase the price reaction speed to news.
The above discussions point to several differences in institutional features, such as trading
rules, dealer obligations, order execution systems, treatment of limit orders, and the opening price
setting mechanism, that could cause the price adjustment process to differ between NASDAQ and
NYSE/AMEX listed stocks. We investigate the importance of these features in affecting a stock’s
average price reaction speed to news.
3. Methodology and Data Description
To assess the empirical relevance of cross-exchange differences in price adjustment speeds,
we analyze returns in fifteen-minute trading intervals around SEO announcements. We focus on SEO
announcements since they tend to be unanticipated, have statistically and economically significant
stock price impacts whose average size is comparable to many typical corporate announcements.
Further, a high fraction of these announcements have price effects of the same sign, with a
reasonably concentrated distribution that is well documented in the literature. Finally, by focusing on

8
one particular type of news announcement, we gain the benefit of analyzing a relatively homogenous
information event.
Our analyses focus on the announcement interval, the 12 subsequent fifteen-minute intervals
(3 hours) and the 2 prior fifteen-minute intervals.7 Event interval 0 is defined as the fifteen-minute
trading interval containing a daytime SEO announcement or the first fifteen-minute trading interval
following an overnight SEO announcement. All other event intervals are identified relative to interval
0. Since NYSE, AMEX and NASDAQ markets are open from 9:30 a.m. to 4:00 p.m. EST, there are 26
fifteen-minute intervals in a normal trading day. The first interval of each trading day ends at 9:45 a.m.
and begins at 4:00 p.m. on previous trading day, so it includes the overnight return as well as the
return over the first 15 minutes of trading. Returns are treated as missing for all intervals prior to the
interval containing the day’s first quote.8
Since the probability distribution of fifteen-minute returns is unknown, we use a bootstrap
resampling technique to test the null hypothesis that the mean return in an event interval is zero.
Under the bootstrapping procedure, for each event interval, we randomly select from the benchmark
period a return for the same 15-minutes of the trading day. The benchmark period covers event days
–30 to -5 relative to the SEO announcement date. The randomly selected returns are then averaged
across the sample firms and the procedure is repeated 500 times to generate an empirical distribution.
The event interval mean returns are then compared with the empirical distributions to determine their
statistical significance.
The sample consists of initial announcements of SEOs completed between January 1990 and
December 1992 by NYSE, AMEX and NASDAQ listed firms. The announcement times are obtained
from the Dow Jones Text and the LEXIS on-line services. We exclude offerings contaminated by
other major firm news releases, such as earnings, dividends, splits, investment or financing decisions,
7 Twelve 15-minute pre-announcement intervals are examined, but since they are generally insignificant before interval –2, they are not reported. 8 When quotes are unavailable for the opening 15 minute interval, we expand the event interval to include the first half of the next interval. When no quotes are then available, the last quote for the first interval with trades or quotes is used and the overnight interval is expanded to include the intervening intervals. Alternatively, when we treat such overnight returns as missing, our basic results remain

9
occurring in the announcement period, days 0 and +1. SEO announcements occurring within a month
of a listing change from NASDAQ to NYSE/AMEX are excluded to avoid contamination from listing
effects.9 SEO characteristics come from Securities Data Corporation’s ‘New Issues’ database. We
exclude non-underwritten offerings, rights offerings, standby offerings, shelf offerings, non-U.S. issues,
offers by non-U.S. issuers, pure secondary offerings and simultaneous offerings of other securities.
After these exclusions, the sample consists of 458 NASDAQ offerings and 408 NYSE/AMEX offerings.
Stock transaction prices, quotes and trade information are taken from the Institute for Studies
of Security Markets (ISSM) database.10 The limited coverage of NASDAQ stocks in the ISSM
database, restricts our sample period to January 1990 to December 1992. We require stocks to have
transaction data for event days -1 and 0 and for at least 10 days in the benchmark period (i.e., in the
25 trading day period between event days -30 and -5). Our final sample consists of 320 NASDAQ
stocks and 253 NYSE/AMEX stocks.
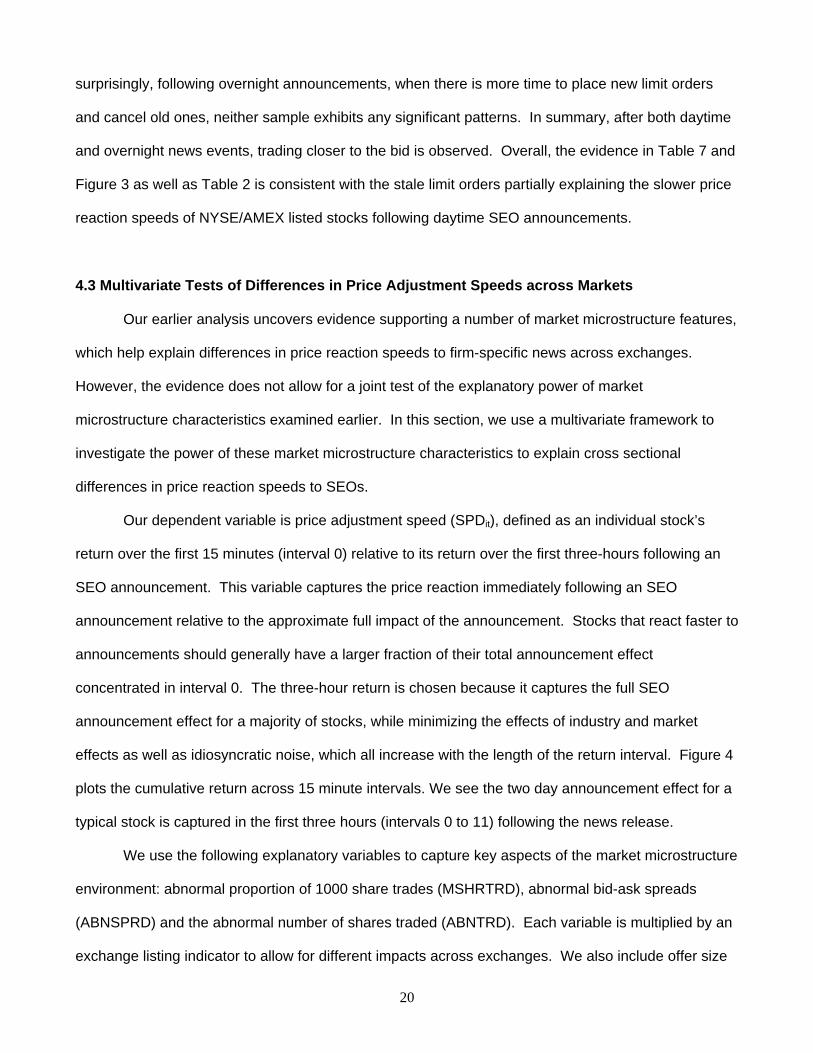
Figure 1 presents the intraday frequency distribution of SEO announcements in each half-hour
interval between 7 a.m. and 7 p.m. The frequency of announcements across the business day
exhibits a bimodal pattern in both samples. Most firms announce SEOs between 9 a.m. and 11 a.m.
or between 4 p.m. and 6 p.m. (after the market close). These findings suggest that firms often
purposefully select the timing of their announcements relative to the stock’s trading period.
4. Empirical Results
4.1 Univariate analysis of price reaction speeds and sample characteristics
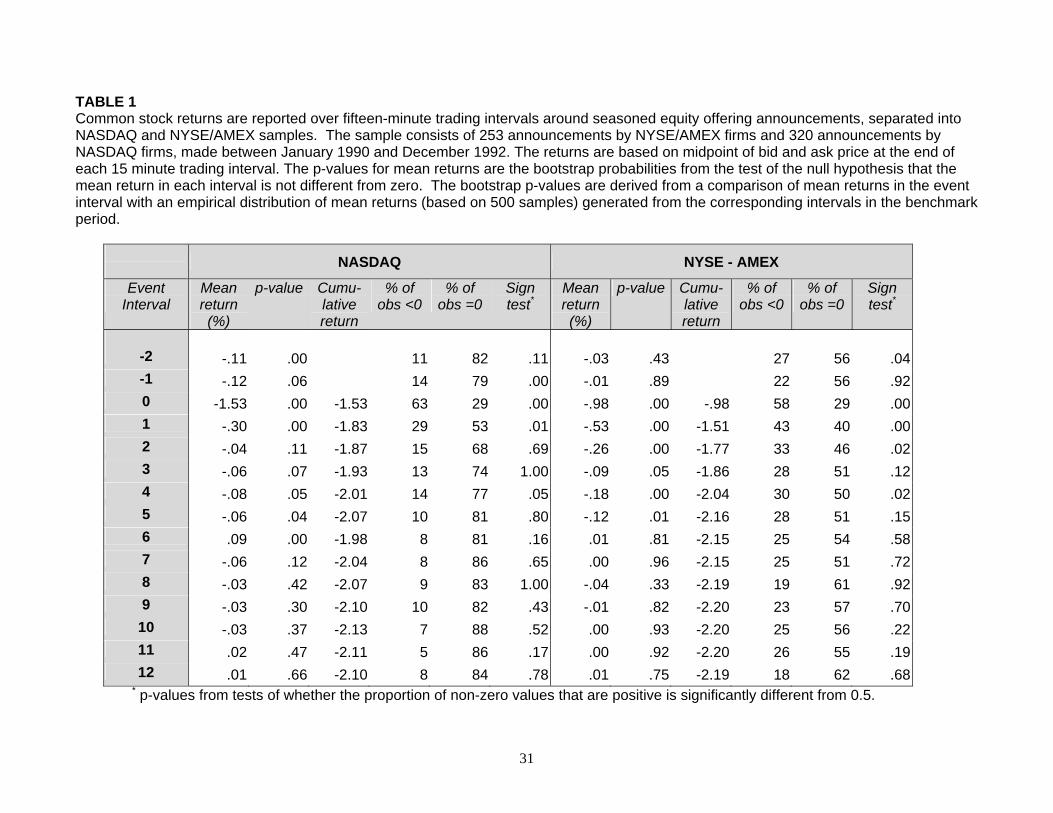
Table 1 reports the mean returns in the fifteen-minute intervals around SEO announcements.
On NASDAQ, mean returns in intervals 0 and +1 are significantly negative, with the absolute return in
interval 0 being larger. On the NYSE/AMEX, the mean returns in intervals 0 through 5 are negative
and significant, with the means in intervals 0 and 1 being most negative. Comparing returns across
unchanged. NASDAQ stocks almost always have quotes or prices available in the first interval following the official open. This is not the case for NYSE/AMEX stocks. 9 Christie and Huang (1994) find the bid-ask spreads of stocks that switch from NASDAQ to NYSE/AMEX decrease substantially. 10 We exclude trades reported out-of-sequence and non-BBO eligible quotes.
10
exchanges, the NYSE/AMEX has a less negative interval 0 mean than does NASDAQ. Beyond
interval 0, negative returns in excess of 0.1% are observed only in interval +1 for NASDAQ stocks,
while they are observed in most of the intervals +1 through +5 for NYSE/AMEX stocks. In fact, the
negative returns on the NYSE/AMEX tend to be twice as large as those on NASDAQ over intervals +1
through +5. While not reported, the median return indicates that NASDAQ’s large negative return in
interval 0 is not driven by a small number of outliers.11 Overall, the evidence indicates faster price
adjustments on NASDAQ.
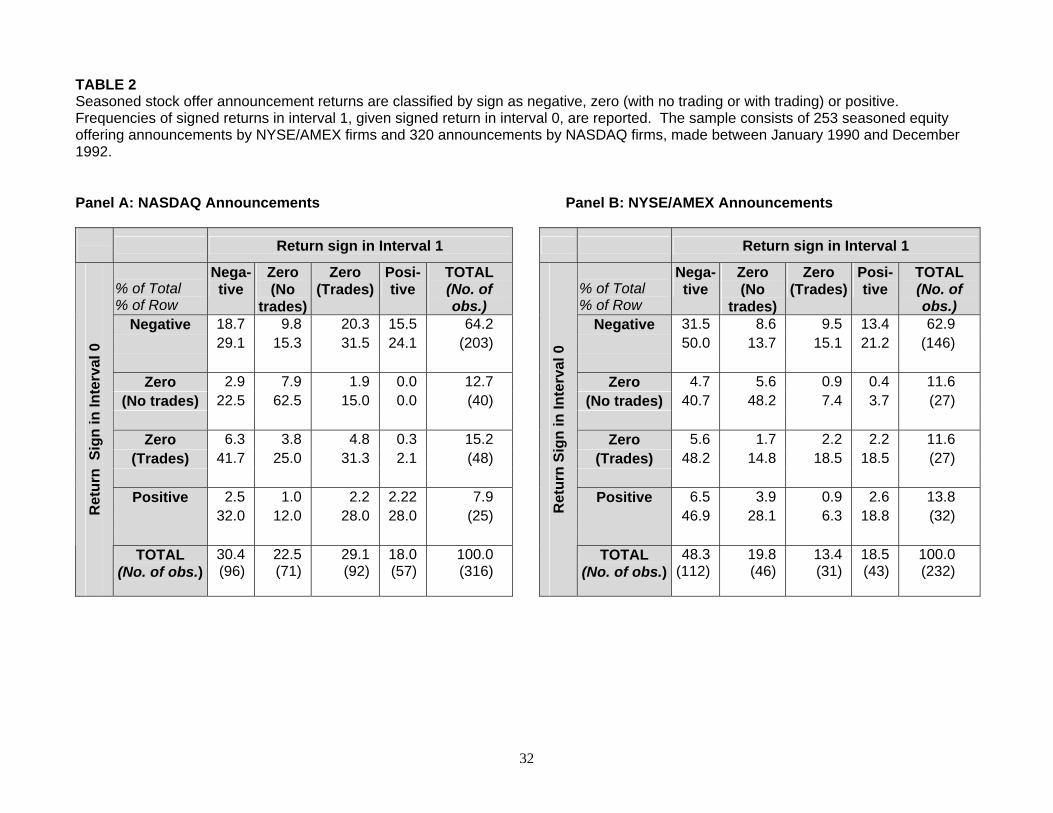
To further investigate why NYSE/AMEX stock prices react more slowly to news, we categorize
interval 0 and 1 returns into three states: negative, zero (with or without trading) or positive and then
examine how individual stock price changes in interval 1 are related to changes in interval 0. Table 2
shows several interesting patterns. First, if the interval 0 return is negative, then the conditional
probability of a negative interval 1 return is nearly twice as large for the NYSE/AMEX relative to the
NASDAQ sample. Second, following a positive interval 0 return, the conditional probability of
observing a non-positive interval 1 return is more than twice as large for the NYSE/AMEX sample.
These patterns are consistent with faster price reactions on NASDAQ.
One straightforward explanation for the faster price reaction observed on NASDAQ is the
existence of significant differences in sample characteristics across exchange samples. Several prior
studies report a lead-lag relation in stocks of different equity capitalization levels. Lo and Mackinlay
(1990) find that returns of larger firms tend to lead those of smaller firms based on weekly data. Chan
(1994) interprets this as evidence that larger firms react faster to economy-wide information due to
greater media coverage and more timely information reporting. Table 3 shows larger equity
capitalization for the NYSE/AMEX sample, which suggests that NYSE/AMEX stocks should actually
exhibit faster price adjustments to SEO announcements, ceteris paribus.
11 As a robustness check, we measure the price reaction speed by the number of post-announcement intervals needed to realize at least 75% of the 3-hour cumulative return following the SEO announcement. This measure also shows a significantly faster price reaction on NASDAQ. These results are qualitatively unchanged when alternatives to the 75% threshold level are used.
11
Chordia and Swaminathan (2000) show that, even after controlling for firm size, price reaction
speed is positively related to trading activity level. Further, stocks with lower bid-ask spreads offer
greater incentives for arbitrage and informed trading, which would raise their average price adjustment
speed. Table 3 presents summary statistics for several trading activity and stock liquidity measures
(number of trades, quoted bid-ask spreads, effective spreads and relative spreads) in the benchmark
period. Average relative spreads and effective spreads are both lower on the NYSE/AMEX, which is
consistent with the findings of Christie and Schultz (1994) and Huang and Stoll (1996). The average
daily number of trades on NASDAQ is lower, even though trades on NASDAQ are typically double
counted by separately reporting executions of buy and offsetting sell orders.12 In contrast, on the
NYSE/AMEX most buy and sell orders are directly crossed and reported as single trades. Everything
else the same, we expect the lower spreads and greater trading activity of NYSE/AMEX stocks to lead
to faster price reactions in this market relative to NASDAQ.
Studies by Jennings and Stark (1985) and Woodruff and Senchak (1988) document a positive
correlation between price reaction speed to earnings announcements and the size of the price
reaction. Mech (1993) reports that larger announcement effects are more rapidly incorporated into
stock returns. We compare conventional two-day announcement returns (event days 0 and 1) across
our exchange samples. These raw returns are taken from the CRSP daily NYSE/AMEX/NASDAQ
master files. NASDAQ has a significant –1.75% mean raw return, while the NYSE/AMEX has a
significantly larger mean of -2.70%. Analysis of market adjusted returns yields similar conclusions.
Combining the prior arguments with the observed announcement effects suggests faster price
reactions for NYSE/AMEX stocks.
Since overnight announcements provide more time for investors to evaluate its information
content, overnight news should be incorporated into prices more quickly. Thus, the exchange sample
with a larger proportion of overnight announcements is likely to show a faster reaction speed. We find
12 Atkins-Dyl (1997) documents the trade reporting differences between the NYSE and NASDAQ.
12
that overnight announcements represent 35% of the NASDAQ sample and 43% of the NYSE/AMEX
sample, which again suggests a faster price reaction on NYSE/AMEX.13
Although all the above issuer and announcement characteristics suggest a faster price reaction
on the NYSE/AMEX, our results show just the opposite. To better understand what is causing this
result, we sort our sample into overnight and daytime announcements and repeat the earlier analysis.
Issuer and announcement characteristics are statistically indistinguishable across daytime and
overnight samples for either exchange. Further, differences in two day mean returns found in the full
sample are observed in both the overnight and daytime announcement samples. Specifically, the
mean daytime and overnight announcement returns are –1.71% and –1.80% for NASDAQ and –
2.77% and –2.61% for the NYSE/AMEX.
Table 4 separately presents mean returns over 15-minute intervals for overnight and daytime
announcements. Table 4, Panel A shows NASDAQ daytime announcement returns are significantly
negative in intervals 0 and +1, with interval 0 representing 87% of the two-day announcement return.
NYSE/AMEX daytime returns are significantly negative in intervals 0 through +2. The interval 0 mean
(median) return is -1.01% (-.27%), and accounts for only 36% of the two-day announcement return.
The interval 0 mean return for the NYSE/AMEX is also substantially smaller in size than that for
NASDAQ. This result is reversed in interval +1, where the NYSE/AMEX return is larger in size than
that on NASDAQ. Over intervals +2 through +5, the NYSE/AMEX mean returns are significantly
negative in all but one interval, while they are approximately zero for NASDAQ. This suggests that
stock prices on the NYSE/AMEX take as much as an hour longer to fully reflect SEO announcements.
There is also some evidence in this panel suggesting inside information leaks or broadcast
delays of corporate press releases. Mean returns in interval -1 and –2 are negative for both
NYSE/AMEX and NASDAQ stocks, though much smaller in magnitude than in interval 0 or +1. The
interval –2 mean return is statistically significant for NASDAQ. To investigate whether the information
leakage or broadcast delay can explain the differences in speed of price adjustment in the two
samples, we study the mean returns for the 2 hours prior to event interval 0. We find very similar
13 Announcements occurring after 9:30 a.m. but before the actual opening of trading are treated as overnight
13
mean returns across the two samples, suggesting that a pre-announcement leakage effect or a
broadcast delay are unlikely explanations for the NYSE/AMEX’s slower price reaction.
Table 4, Panel B presents overnight SEO announcements returns. For NASDAQ stocks, the
mean return in interval 0 is -1.60%, but positive in interval +1. The mean returns in intervals +2
through +5 are all negative, with intervals +4 and +5 being statistically significant. This suggests some
delay in the price adjustment process on NASDAQ to overnight news. For the NYSE/AMEX, the mean
return in interval 0 is a significant -0.92%. Mean returns are also negative in intervals +1 through +6
and statistically significant in half of these intervals. So NASDAQ has faster price reactions to
overnight announcements as well.
The prior evidence indicates that NASDAQ stocks react faster to both daytime and overnight
SEO announcements. The apparently slower NYSE/AMEX price reaction is somewhat surprising
since the differences in stock characteristics predict the opposite. Moreover, our procedures are
biased against finding a faster price reaction for NASDAQ stocks. When daytime announcements
occur after the official open, but before the actual start of trading, we treat them as having occurred
overnight. This effect is caused by a trading delay, which occurs almost exclusively on the
NYSE/AMEX. Thus, our procedure causes the NYSE/AMEX interval 0 return to appear to capture
more of the overall two-day return than it actually does. Also, Porter and Weaver (1998) find that over
our time period large price movements on NASDAQ are not always reported in a timely manner, while
Schultz (2000) documents that in very active periods, NASDAQ trade reporting is delayed by several
minutes. These two reporting problems can also slow the observed price reaction speed of NASDAQ
stocks. In the following sub-section, we examine the role of market structure in explaining the faster
price reaction of NASDAQ stocks.
4.2 Market Microstructure Influences on the Price Adjustment Process
One potential explanation for the slower NYSE/AMEX price adjustment to overnight
announcements is a less efficient opening price setting mechanism. Consistent with this hypothesis,
announcements.
14
Francis, Pagach and Stephan (1991) find that overnight earnings announcements by NYSE listed
stocks are not fully reflected in their opening prices. Madhavan and Panchapagesan (2000) document
that the opening prices on NYSE/AMEX are often set close to the prior closing prices as a result of the
specialist’s price continuity obligation. Amihud and Mendelson (1987) and Stoll and Whaley (1990)
find that NYSE opening prices exhibit much greater volatility than closing prices. In contrast, Chan,
Christie and Schultz (1995) report that opening price discovery on NASDAQ appears to occur within
the first 5 minutes. These studies indicate that the opening price setting mechanism allows NASDAQ
stocks to capitalize overnight SEO announcements faster.
To further assess the efficiency of opening price setting mechanisms, we calculate overnight
stock returns measured from the close of day –1 to the opening price on day 0. However, this does
not tell the full story since NASDAQ dealers are allowed to post quotes before the official open, which
allows competing dealers to communicate information on overnight order flow with each other before
trading starts. To examine this last issue, we split each NASDAQ overnight return into a return from
the close of day –1 to the first quote on day 0 and a pre-opening return measured from the first quote
to the official open on day 0.
From Table 5, we see that NYSE/AMEX prices react to overnight SEO announcements
primarily during the trading day rather than at the open. In marked contrast, the price reaction to
NASDAQ overnight announcements is concentrated between the first quote and the official open of
day 0, with an insignificant return over the remainder of the trading day. This suggests that one
explanation for the faster price adjustment speed on NASDAQ is its more efficient opening price
setting mechanism. However, this is not the full explanation since NYSE/AMEX daytime
announcements also exhibit slower price adjustments.
Trading halts can affect price adjustment speeds across exchanges when the frequency or
duration of trading halts in the two samples is dissimilar. This is a distinct possibility since exchange
rules sanctioning trading halts are different. Specifically, NYSE/AMEX rules allow a specialist to
request a trading halt when an unusually large order flow imbalance occurs or when pending or actual
15
news releases are likely to have a substantial price impact. In contrast, trading halts on NASDAQ are
allowed only for pending or actual news announcements and not for order imbalances.
We investigate the importance of trading halts by first calculating the fraction of
stocks with halts on event day 0 across our samples. Then, we examine the effects on event interval
returns of eliminating trading halt delays to assess the importance of these rule variations.
NYSE/AMEX trading halts occur in 21% of daytime SEO announcements and in 3% of overnight
announcements. In contrast, NASDAQ trading halts occur in only 2.4% of daytime SEO
announcements and in 1.8% of overnight announcements.14 On average, SEO related trading halts
last just over one hour.
To eliminate trading halt effects, we redefine interval 0 to be the first 15 minute interval with
trading following an SEO announcement.15 Reexamining daytime announcements, we find interval 0
returns change negligibly for both markets. More specifically, the trading halt adjustment lowers
interval 0 return from -1.49% to –1.58% for NASDAQ and from –1.01% to –1.06% for the
NYSE/AMEX. Thus, trading delays do slow the NYSE/AMEX price reaction speed to news, but this
does not cause NASDAQ to capitalize news into stock prices faster.
We next investigate whether the stock return patterns uncovered previously are related to
structural differences across the markets. Requiring the routing of NYSE/AMEX orders to the
specialist’s post for manual execution and possible price improvement by floor traders, introduces a
potential delay in order execution and thus, in price adjustment. The uptick rule can also slow price
response on the NYSE/AMEX to corporate news releases, especially negative news by preventing
information traders from short selling stock to hit overpriced (stale) limit orders (to buy) following an
SEO announcement. In contrast, traders on NASDAQ can rapidly execute trades of 1000 shares or
less on SOES and are not constrained by an uptick rule over this period. Since order execution speed
and opportunities for informed trading can affect price adjustment speeds, we start by examining
14 ISSM codes indicate that no trading halts occur around SEO announcements for NASDAQ stocks. Seven NASDAQ stocks exhibit sequences of bid and ask quotes with zero values around SEO announcements. Conversations with NASDAQ officials indicate that these are almost certainly trading halts and we treat them as such.
16
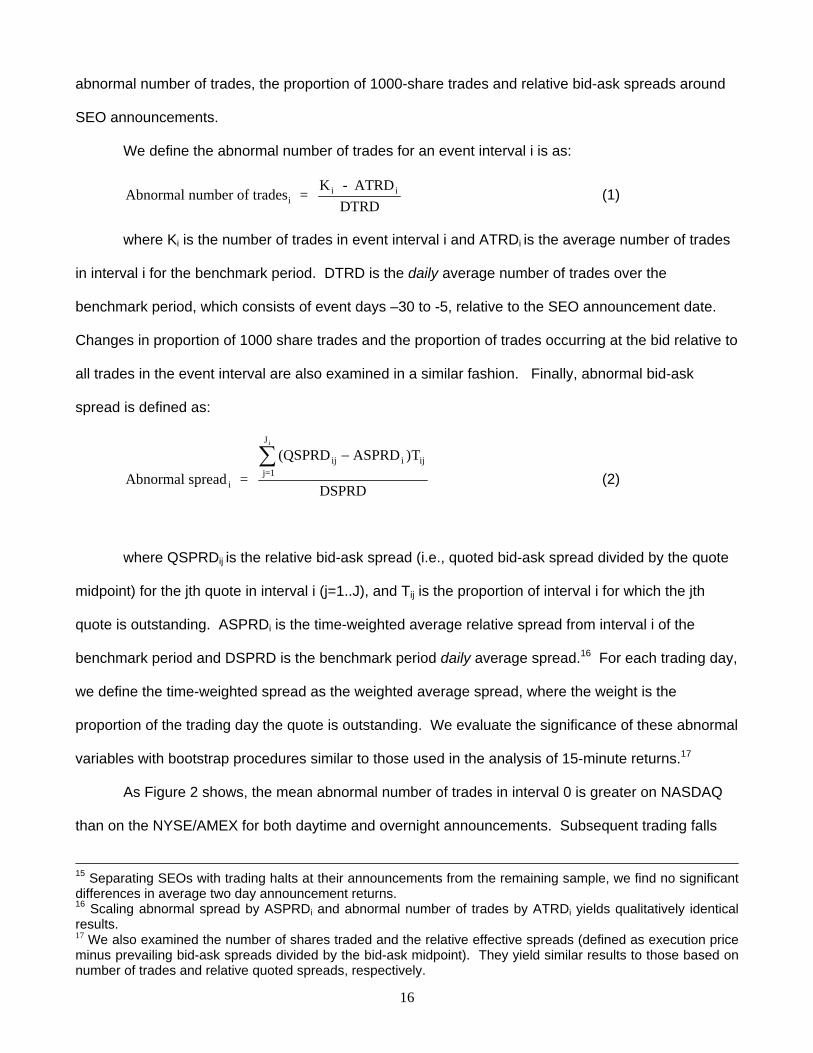
abnormal number of trades, the proportion of 1000-share trades and relative bid-ask spreads around
SEO announcements.
We define the abnormal number of trades for an event interval i is as:
Abnormal number of trades = K - ATRD
DTRDii i (1)
where Ki is the number of trades in event interval i and ATRDi is the average number of trades
in interval i for the benchmark period. DTRD is the daily average number of trades over the
benchmark period, which consists of event days –30 to -5, relative to the SEO announcement date.
Changes in proportion of 1000 share trades and the proportion of trades occurring at the bid relative to
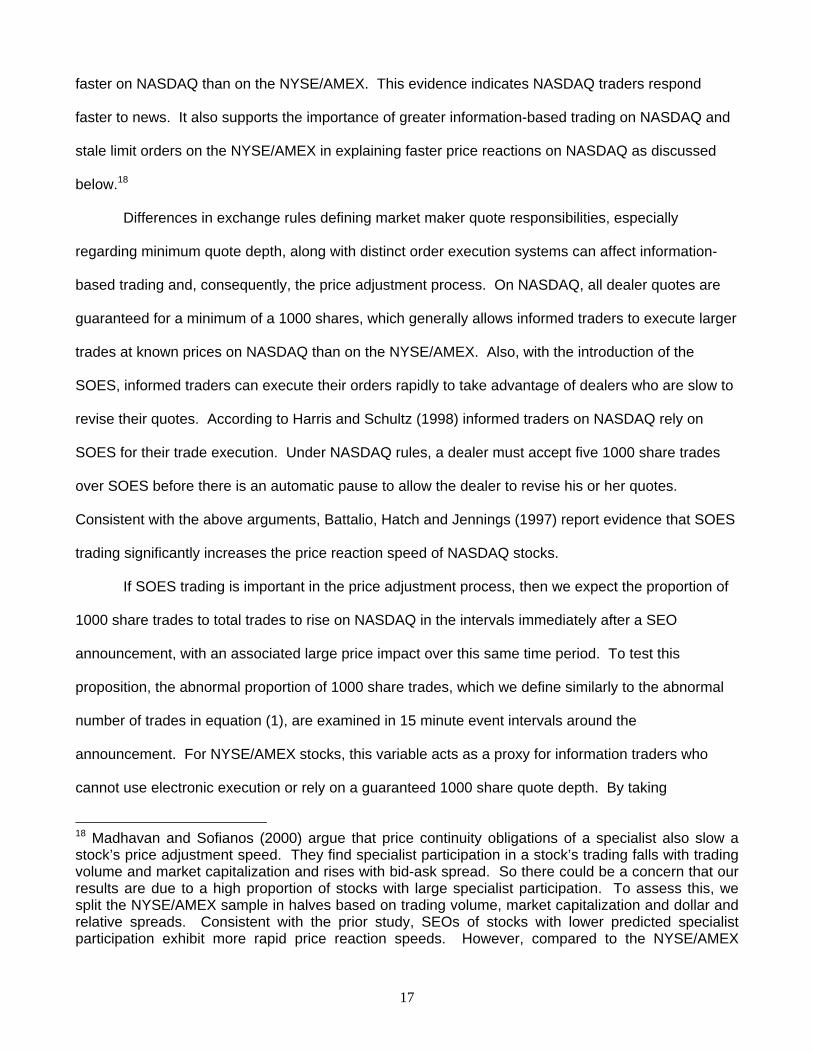
all trades in the event interval are also examined in a similar fashion. Finally, abnormal bid-ask
spread is defined as:
Abnormal spread =
(QSPRD ASPRD T
DSPRDi
ij i ijj=1
J i
−∑ )
(2)
where QSPRDij is the relative bid-ask spread (i.e., quoted bid-ask spread divided by the quote
midpoint) for the jth quote in interval i (j=1..J), and Tij is the proportion of interval i for which the jth
quote is outstanding. ASPRDi is the time-weighted average relative spread from interval i of the
benchmark period and DSPRD is the benchmark period daily average spread.16 For each trading day,
we define the time-weighted spread as the weighted average spread, where the weight is the
proportion of the trading day the quote is outstanding. We evaluate the significance of these abnormal
variables with bootstrap procedures similar to those used in the analysis of 15-minute returns.17
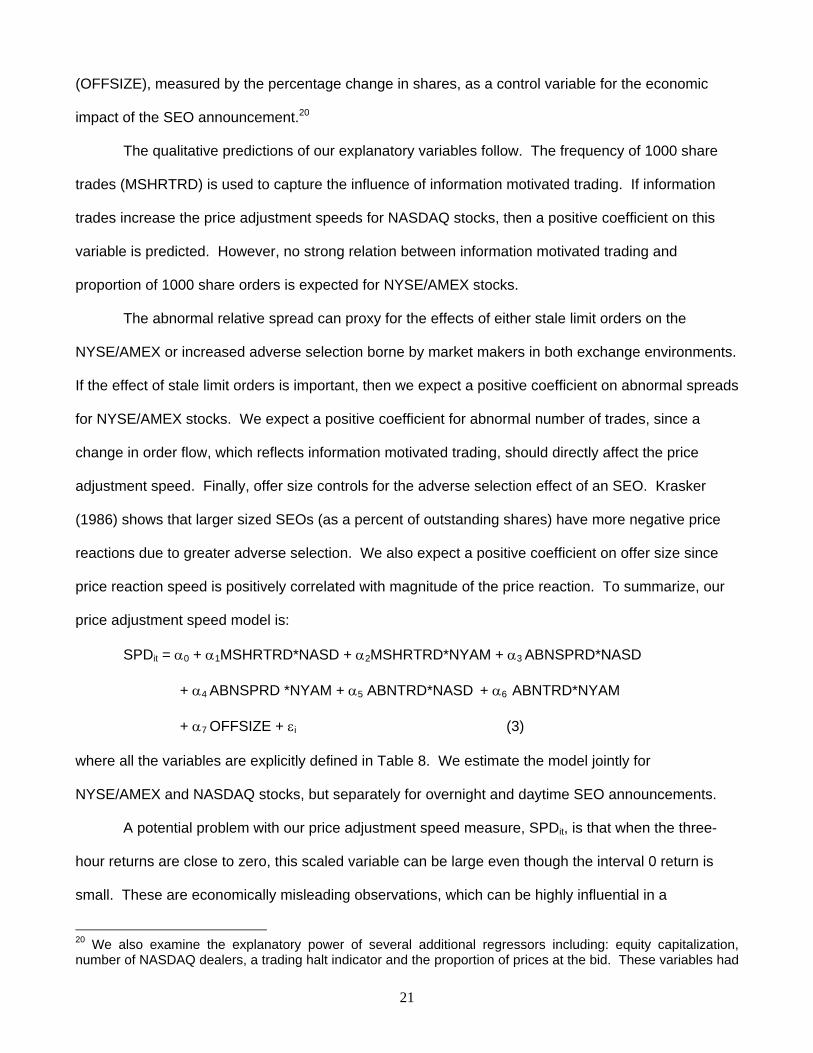
As Figure 2 shows, the mean abnormal number of trades in interval 0 is greater on NASDAQ
than on the NYSE/AMEX for both daytime and overnight announcements. Subsequent trading falls
15 Separating SEOs with trading halts at their announcements from the remaining sample, we find no significant differences in average two day announcement returns. 16 Scaling abnormal spread by ASPRDi and abnormal number of trades by ATRDi yields qualitatively identical results.
17 We also examined the number of shares traded and the relative effective spreads (defined as execution price minus prevailing bid-ask spreads divided by the bid-ask midpoint). They yield similar results to those based on number of trades and relative quoted spreads, respectively.
17
faster on NASDAQ than on the NYSE/AMEX. This evidence indicates NASDAQ traders respond
faster to news. It also supports the importance of greater information-based trading on NASDAQ and
stale limit orders on the NYSE/AMEX in explaining faster price reactions on NASDAQ as discussed
below.18
Differences in exchange rules defining market maker quote responsibilities, especially
regarding minimum quote depth, along with distinct order execution systems can affect information-
based trading and, consequently, the price adjustment process. On NASDAQ, all dealer quotes are
guaranteed for a minimum of a 1000 shares, which generally allows informed traders to execute larger
trades at known prices on NASDAQ than on the NYSE/AMEX. Also, with the introduction of the
SOES, informed traders can execute their orders rapidly to take advantage of dealers who are slow to
revise their quotes. According to Harris and Schultz (1998) informed traders on NASDAQ rely on
SOES for their trade execution. Under NASDAQ rules, a dealer must accept five 1000 share trades
over SOES before there is an automatic pause to allow the dealer to revise his or her quotes.
Consistent with the above arguments, Battalio, Hatch and Jennings (1997) report evidence that SOES
trading significantly increases the price reaction speed of NASDAQ stocks.
If SOES trading is important in the price adjustment process, then we expect the proportion of
1000 share trades to total trades to rise on NASDAQ in the intervals immediately after a SEO
announcement, with an associated large price impact over this same time period. To test this
proposition, the abnormal proportion of 1000 share trades, which we define similarly to the abnormal
number of trades in equation (1), are examined in 15 minute event intervals around the
announcement. For NYSE/AMEX stocks, this variable acts as a proxy for information traders who
cannot use electronic execution or rely on a guaranteed 1000 share quote depth. By taking
18 Madhavan and Sofianos (2000) argue that price continuity obligations of a specialist also slow a stock’s price adjustment speed. They find specialist participation in a stock’s trading falls with trading volume and market capitalization and rises with bid-ask spread. So there could be a concern that our results are due to a high proportion of stocks with large specialist participation. To assess this, we split the NYSE/AMEX sample in halves based on trading volume, market capitalization and dollar and relative spreads. Consistent with the prior study, SEOs of stocks with lower predicted specialist participation exhibit more rapid price reaction speeds. However, compared to the NYSE/AMEX
18
proportions, we control for a positive correlation between equity capitalization, which is higher on the
NYSE/AMEX, and the number of trades.
Table 6 shows a significant rise in the proportion of 1000 share trades on NASDAQ in interval
0. For daytime announcements, the first four 15 minute intervals following SEO announcements are
significantly positive. The largest rise in 1000 share trades is in interval 0 and it slowly diminishes
thereafter. The NYSE/AMEX also has a significant rise in 1000 share trades in intervals 0 and 1. For
overnight announcements, the pattern is similar for NASDAQ, but the size is smaller and only intervals
0 and 1 are significant. There is no significant rise in NYSE/AMEX 1000 share trades, except in
interval –1. This evidence is consistent with overnight news giving investors more time to learn about
and assess the import of SEO announcements. This trading pattern appears to bear out the
importance of SOES bandits and the more rapid information-based trading on NASDAQ.
Another possible reason for a slower response in NYSE/AMEX prices is slow updating of the
limit order book following major news releases. Once an SEO is announced, with its typical negative
price reaction, investors have incentives to cancel their old limit orders to buy stock (i.e., bids).
Likewise, information traders have incentives to hit these limit orders if they own the stock or can short
sell it quickly and cheaply. No such incentives exist with respect to limit orders to sell (ask). Until new
limit orders arrive, the asymmetric response of limit order investors and information traders implies a
widening bid-ask spread. However, the SEO can temporarily raise adverse selection for liquidity
providers, which can inhibit the arrival of new limit orders and discourage specialists from stepping in
front of limit orders with more aggressive quotes. Thus, stale limit orders immediately after SEO
announcements can result in: (1) prices exhibiting a slow decline as the highest limit orders to buy are
sequentially hit or replaced, (2) widening bid-ask spreads and (3) an increasing proportion of trades
occurring at the bid.
We saw several strands of evidence earlier in Table 2, where we examine the frequency of
return signs in interval 1 conditional on their signs in interval 0, which support the importance of stale
samples with lower predicted specialist participation, NASDAQ stocks on average continue to have more rapid price reactions.
19
limit orders. First, the frequency of negative returns in both intervals 0 and 1 is twice as large for the
NYSE/AMEX sample. Second, the frequency of a positive return in interval 0 followed by a negative
return or no trade in interval 1 is more than twice as large for the NYSE/AMEX compared to NASDAQ.
This evidence suggests that NYSE/AMEX stock prices do not immediately reflect the full import of
SEO announcements.
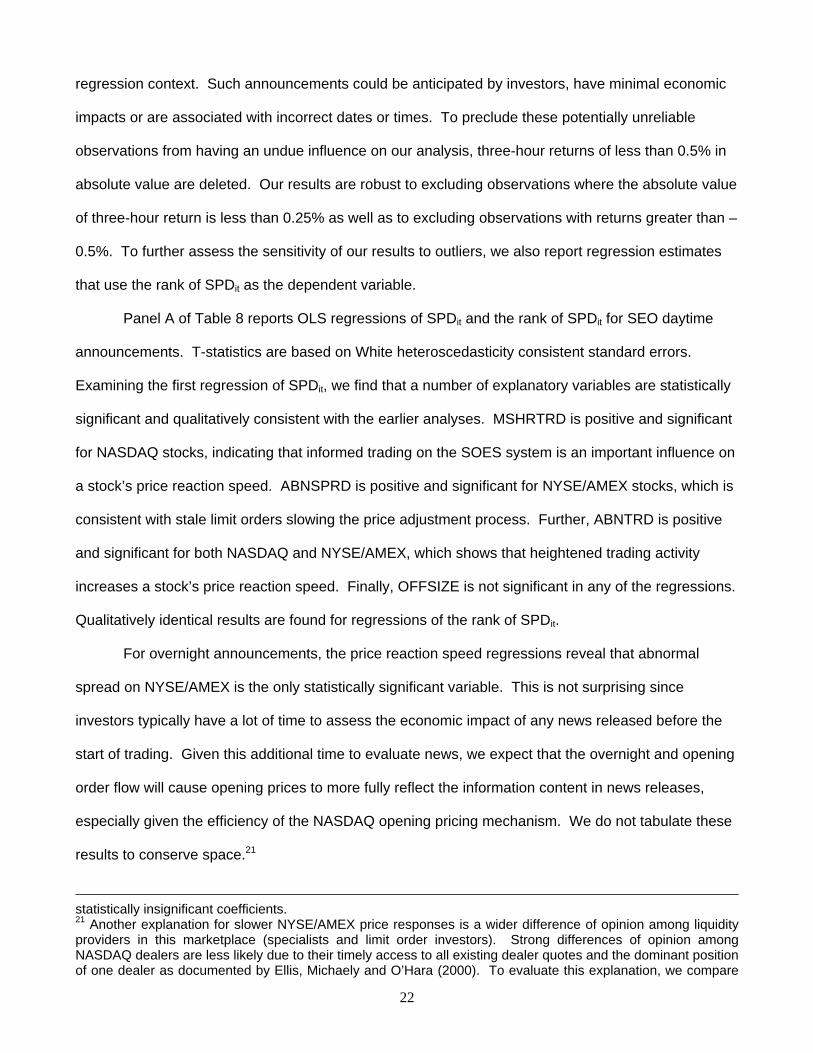
Figure 3 presents mean abnormal spreads for 25 fifteen-minute intervals centered on a SEO
news release. This figure shows that abnormal spreads following SEO announcements are
significantly greater for the NYSE/AMEX than for NASDAQ. For overnight news events, NASDAQ
exhibits a small positive, though not statistically significant, abnormal spread that persists out to
interval 12, while the NYSE/AMEX exhibits a significantly positive abnormal spread in intervals 0 to +7,
based on bootstrap procedures and drops quickly thereafter. These findings are consistent with the
existence of stale limit orders or an inefficient opening mechanism on NYSE/AMEX and suggest that it
takes an average of two hours following an overnight announcement for the limit order book to be fully
updated. Likewise for NYSE/AMEX daytime announcements, abnormal spreads are significantly
positive for intervals 0 through +3, which suggests that it takes about an hour for the limit order book
to be fully updated. In sharp contrast, the mean abnormal spread following daytime announcements is
negligible for NASDAQ stocks.19
If NYSE/AMEX limit orders are stale immediately after SEO announcements, then we should
observe stocks trading more frequently at the bid (buy) for several subsequent 15 minute intervals.
Table 7 presents mean abnormal trades at the bid, which are defined similarly to the abnormal number
of trades. For daytime announcements, trades at the bid rise significantly on the NYSE/AMEX over
intervals 0 through 5. In contrast, daytime announcements on NASDAQ show a much smaller rise in
abnormal trades at the bid and only after a delay of 45 minutes. This is consistent with stale limit
orders being a factor in the slow NYSE/AMEX price response to daytime announcements. Not
19 To ensure that our results are not driven by cross-exchange differences in the scaling variable (DSPRD), we placed all firms (both NASDAQ and NYSE/AMEX) into two groups based on the median level of DSPRD. We find that the abnormal spreads following an announcement are lower for the NASDAQ stocks relative to both groups of NYSE/AMEX stocks, indicating that cross-exchange differences in DSPRD do not drive the results. We also reach similar conclusion for the abnormal number of trades presented in figure 2.
20
surprisingly, following overnight announcements, when there is more time to place new limit orders
and cancel old ones, neither sample exhibits any significant patterns. In summary, after both daytime
and overnight news events, trading closer to the bid is observed. Overall, the evidence in Table 7 and
Figure 3 as well as Table 2 is consistent with the stale limit orders partially explaining the slower price
reaction speeds of NYSE/AMEX listed stocks following daytime SEO announcements.
4.3 Multivariate Tests of Differences in Price Adjustment Speeds across Markets
Our earlier analysis uncovers evidence supporting a number of market microstructure features,
which help explain differences in price reaction speeds to firm-specific news across exchanges.
However, the evidence does not allow for a joint test of the explanatory power of market
microstructure characteristics examined earlier. In this section, we use a multivariate framework to
investigate the power of these market microstructure characteristics to explain cross sectional
differences in price reaction speeds to SEOs.
Our dependent variable is price adjustment speed (SPDit), defined as an individual stock’s
return over the first 15 minutes (interval 0) relative to its return over the first three-hours following an
SEO announcement. This variable captures the price reaction immediately following an SEO
announcement relative to the approximate full impact of the announcement. Stocks that react faster to
announcements should generally have a larger fraction of their total announcement effect
concentrated in interval 0. The three-hour return is chosen because it captures the full SEO
announcement effect for a majority of stocks, while minimizing the effects of industry and market
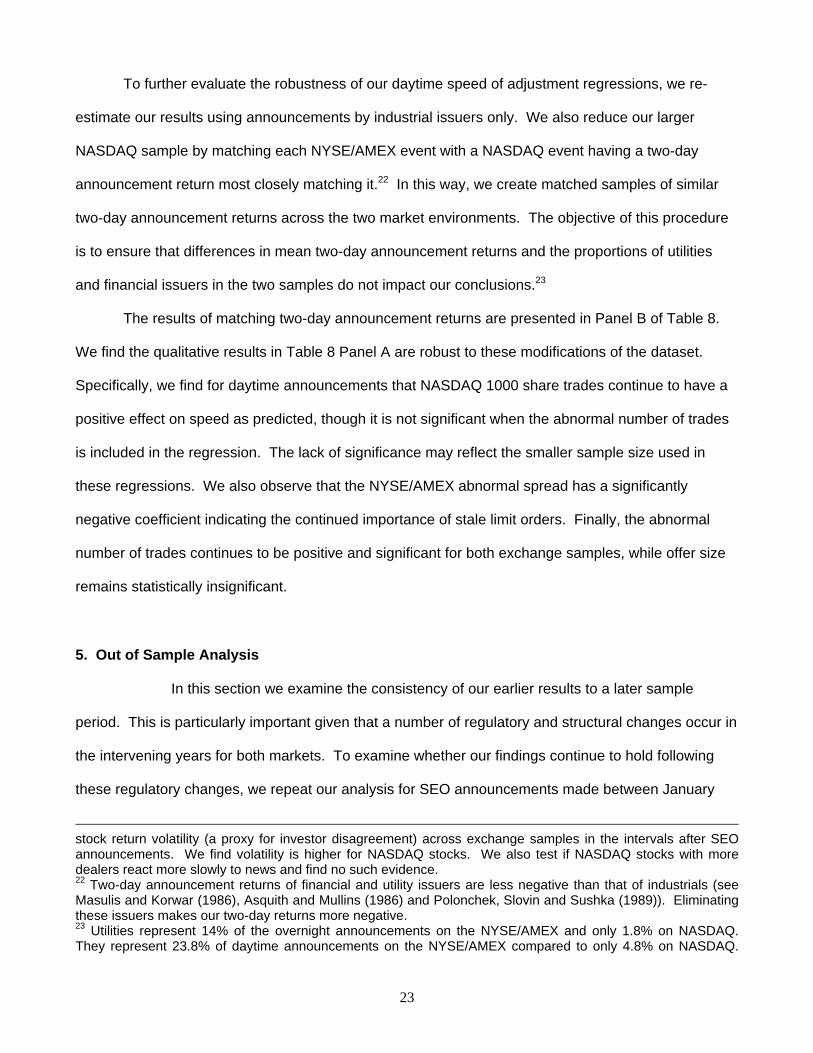
effects as well as idiosyncratic noise, which all increase with the length of the return interval. Figure 4
plots the cumulative return across 15 minute intervals. We see the two day announcement effect for a
typical stock is captured in the first three hours (intervals 0 to 11) following the news release.
We use the following explanatory variables to capture key aspects of the market microstructure
environment: abnormal proportion of 1000 share trades (MSHRTRD), abnormal bid-ask spreads
(ABNSPRD) and the abnormal number of shares traded (ABNTRD). Each variable is multiplied by an
exchange listing indicator to allow for different impacts across exchanges. We also include offer size
21
(OFFSIZE), measured by the percentage change in shares, as a control variable for the economic
impact of the SEO announcement.20
The qualitative predictions of our explanatory variables follow. The frequency of 1000 share
trades (MSHRTRD) is used to capture the influence of information motivated trading. If information
trades increase the price adjustment speeds for NASDAQ stocks, then a positive coefficient on this
variable is predicted. However, no strong relation between information motivated trading and
proportion of 1000 share orders is expected for NYSE/AMEX stocks.
The abnormal relative spread can proxy for the effects of either stale limit orders on the
NYSE/AMEX or increased adverse selection borne by market makers in both exchange environments.
If the effect of stale limit orders is important, then we expect a positive coefficient on abnormal spreads
for NYSE/AMEX stocks. We expect a positive coefficient for abnormal number of trades, since a
change in order flow, which reflects information motivated trading, should directly affect the price
adjustment speed. Finally, offer size controls for the adverse selection effect of an SEO. Krasker
(1986) shows that larger sized SEOs (as a percent of outstanding shares) have more negative price
reactions due to greater adverse selection. We also expect a positive coefficient on offer size since
price reaction speed is positively correlated with magnitude of the price reaction. To summarize, our
price adjustment speed model is:
SPDit = α0 + α1MSHRTRD*NASD + α2MSHRTRD*NYAM + α3 ABNSPRD*NASD
+ α4 ABNSPRD *NYAM + α5 ABNTRD*NASD + α6 ABNTRD*NYAM
+ α7 OFFSIZE + εi (3)
where all the variables are explicitly defined in Table 8. We estimate the model jointly for
NYSE/AMEX and NASDAQ stocks, but separately for overnight and daytime SEO announcements.
A potential problem with our price adjustment speed measure, SPDit, is that when the three-
hour returns are close to zero, this scaled variable can be large even though the interval 0 return is
small. These are economically misleading observations, which can be highly influential in a
20 We also examine the explanatory power of several additional regressors including: equity capitalization, number of NASDAQ dealers, a trading halt indicator and the proportion of prices at the bid. These variables had
22
regression context. Such announcements could be anticipated by investors, have minimal economic
impacts or are associated with incorrect dates or times. To preclude these potentially unreliable
observations from having an undue influence on our analysis, three-hour returns of less than 0.5% in
absolute value are deleted. Our results are robust to excluding observations where the absolute value
of three-hour return is less than 0.25% as well as to excluding observations with returns greater than –
0.5%. To further assess the sensitivity of our results to outliers, we also report regression estimates
that use the rank of SPDit as the dependent variable.
Panel A of Table 8 reports OLS regressions of SPDit and the rank of SPDit for SEO daytime
announcements. T-statistics are based on White heteroscedasticity consistent standard errors.
Examining the first regression of SPDit, we find that a number of explanatory variables are statistically
significant and qualitatively consistent with the earlier analyses. MSHRTRD is positive and significant
for NASDAQ stocks, indicating that informed trading on the SOES system is an important influence on
a stock’s price reaction speed. ABNSPRD is positive and significant for NYSE/AMEX stocks, which is
consistent with stale limit orders slowing the price adjustment process. Further, ABNTRD is positive
and significant for both NASDAQ and NYSE/AMEX, which shows that heightened trading activity
increases a stock’s price reaction speed. Finally, OFFSIZE is not significant in any of the regressions.
Qualitatively identical results are found for regressions of the rank of SPDit.
For overnight announcements, the price reaction speed regressions reveal that abnormal
spread on NYSE/AMEX is the only statistically significant variable. This is not surprising since
investors typically have a lot of time to assess the economic impact of any news released before the
start of trading. Given this additional time to evaluate news, we expect that the overnight and opening
order flow will cause opening prices to more fully reflect the information content in news releases,
especially given the efficiency of the NASDAQ opening pricing mechanism. We do not tabulate these
results to conserve space.21
statistically insignificant coefficients. 21 Another explanation for slower NYSE/AMEX price responses is a wider difference of opinion among liquidity providers in this marketplace (specialists and limit order investors). Strong differences of opinion among NASDAQ dealers are less likely due to their timely access to all existing dealer quotes and the dominant position of one dealer as documented by Ellis, Michaely and O’Hara (2000). To evaluate this explanation, we compare
23
To further evaluate the robustness of our daytime speed of adjustment regressions, we re-
estimate our results using announcements by industrial issuers only. We also reduce our larger
NASDAQ sample by matching each NYSE/AMEX event with a NASDAQ event having a two-day
announcement return most closely matching it.22 In this way, we create matched samples of similar
two-day announcement returns across the two market environments. The objective of this procedure
is to ensure that differences in mean two-day announcement returns and the proportions of utilities
and financial issuers in the two samples do not impact our conclusions.23
The results of matching two-day announcement returns are presented in Panel B of Table 8.
We find the qualitative results in Table 8 Panel A are robust to these modifications of the dataset.
Specifically, we find for daytime announcements that NASDAQ 1000 share trades continue to have a
positive effect on speed as predicted, though it is not significant when the abnormal number of trades
is included in the regression. The lack of significance may reflect the smaller sample size used in
these regressions. We also observe that the NYSE/AMEX abnormal spread has a significantly
negative coefficient indicating the continued importance of stale limit orders. Finally, the abnormal
number of trades continues to be positive and significant for both exchange samples, while offer size
remains statistically insignificant.
5. Out of Sample Analysis
In this section we examine the consistency of our earlier results to a later sample
period. This is particularly important given that a number of regulatory and structural changes occur in
the intervening years for both markets. To examine whether our findings continue to hold following
these regulatory changes, we repeat our analysis for SEO announcements made between January
stock return volatility (a proxy for investor disagreement) across exchange samples in the intervals after SEO announcements. We find volatility is higher for NASDAQ stocks. We also test if NASDAQ stocks with more dealers react more slowly to news and find no such evidence. 22 Two-day announcement returns of financial and utility issuers are less negative than that of industrials (see Masulis and Korwar (1986), Asquith and Mullins (1986) and Polonchek, Slovin and Sushka (1989)). Eliminating these issuers makes our two-day returns more negative. 23 Utilities represent 14% of the overnight announcements on the NYSE/AMEX and only 1.8% on NASDAQ. They represent 23.8% of daytime announcements on the NYSE/AMEX compared to only 4.8% on NASDAQ.
24
1998 and December 2000. Since there are only 45 NYSE/AMEX daytime announcements made in
this period, we extend the NYSE/AMEX sample period back to January 1995. This increases the
NYSE/AMEX daytime announcements by 30 observations.24 This longer sample period encompasses
the July 1997 drop in the NYSE minimum tick size from 1/8th to 1/16th, which could influence our
results. However, when we restrict the NYSE/AMEX sample to January 1998 to December 2000, our
results are qualitatively unchanged. Our final sample consists of 115 (461) NASDAQ daytime
(overnight) announcements from 1998-2000 and 75 (215) NYSE/AMEX daytime (overnight)
announcements. The limited number of NYSE/AMEX daytime announcements in the sample
precludes us from fully replicating the earlier analysis due to power considerations.
We begin the 1995-2000 analysis by examining SEO two-day announcement returns.
Daytime and overnight mean returns are –1.45 and –2.59 for NASDAQ and –1.70 and –1.45 for
NYSE/AMEX stocks respectively. Our primary focus is again on daytime announcements. As in the
prior sample period, the daytime returns on NASDAQ are lower than on the NYSE/AMEX. Thus,
everything else the same, large announcement effects should be more rapidly incorporated into
prices. Again the other stock characteristics of the NASDAQ and NYSE/AMEX samples are similar to
the prior observation period. These differences in offer and firm characteristics should again a give
the NYSE/AMEX a price reaction speed advantage.
Table 9 replicates the earlier analysis presented in Table 4 for the more recent sample period.
We see that NASDAQ price reactions are concentrated in the first 15-minute event interval following
an SEO announcement, while the NYSE/AMEX price reaction is stronger in the second 15-minute
interval. The percentage of negative returns in these event intervals mirrors the mean returns
evidence, and indicates that outliers are not driving the differences in mean returns.25 Thus, we find
consistency with our earlier conclusions that NASDAQ more rapidly processes information into stock
The fraction of financial firms in the daytime and overnight samples and the two exchange samples are comparable and vary between 6.3% and 9.9%. 24 The actual number of observations in a given event interval for abnormal proportion of 1000-share trades and proportion of trades occurring at bid are even less, as these require at least one trade in the event interval. 25 Over 90% of the 3-hour return following the SEO announcement occurs in interval 0 for NASDAQ stocks, while the corresponding figure for NYSE/AMEX stocks is only about 57%.

25
prices. However, the timing advantage of NASDAQ appears to have lessened in 1995-2000 period.
Both samples also show some evidence of a broadcast delay or information leakage prior to the SEO
announcement, with NASDAQ showing a stronger effect. One might worry that a large leakage effect
could give NASDAQ an apparent speed advantage. However, when we examine the mean returns
over the 2 hours prior to event interval 0, we find very similar means in the two exchange samples.
This evidence suggests that pre-announcement news leakages and broadcast delays are unlikely
explanations for the NYSE/AMEX’s slower price reaction.
For overnight announcements, we need to take into account NASDAQ’s larger two day
announcement effect. However, if we compare the relative portion of the two day effect that is
captured in event intervals 0 and 1, we again see that a larger proportion of the announcement effect
is in interval 0 for NASDAQ and interval 1 for he NYSE/AMEX. This result is reinforced by the
NYSE/AMEX’s lower percentage of negative returns in interval 0. This is particularly noteworthy since
there is no evidence of an information leakage effect in either overnight sample. Overall, the two
observation periods produce consistent evidence of an information processing advantage for
NASDAQ, which has persisted for over 10 years, although NASDAQ’s speed advantage appears to
have narrowed.
Examining the abnormal proportion of 1000 share trades following daytime announcements,
we see from Table 10 that intervals 0 and 1 are positive and significant (i.e. .57 and .66 respectively)
for NASDAQ stocks, but are insignificant for the NYSE/AMEX sample. This reinforces our earlier
evidence that SOES trading improves price reaction speed on NASDAQ. Since overnight
announcements do not offer information traders a similar level of expected profits as daytime
announcements, it isn’t surprising that there is little evidence on NASDAQ of a rise in 1000 share
trades in this sample. However, the NYSE/AMEX reveals evidence of a rise in these trades over
intervals 1 through 3. Examining the overall number of abnormal trades shown in Figure 5 for the two
samples, we again see a much more dramatic rise in NASDAQ trading and a much more rapid rate of
decay afterwards. This is also consistent with NASDAQ traders more rapidly reacting to information.
26
Figure 6 presents abnormal changes in bid-ask spreads. It shows that NASDAQ market
makers more quickly raise spreads after daytime announcements and maintain them for longer than
do NYSE/AMEX specialists. There is also evidence that some NASDAQ spreads begin rising 15
minutes ahead of the announcement. For overnight announcements, the pattern is very different.
Both samples exhibit an immediate increase in event interval 0, but the NYSE/AMEX sample has a
larger reaction and maintains higher spreads for two hours, while NASDAQ maintains higher spreads
for only 30 minutes.
Examining the frequency of trades exactly at the bid, we find some evidence that these trades
rise on the NYSE/AMEX in the first two 15 minute intervals following a SEO daytime announcement.
However, there is also evidence of a rise on NASDAQ in intervals –1, 1 and 2, but not interval 0.
Thus, the evidence of a stale limit order effect is weaker over the 1995-2000 period. Given the
relatively small number of daytime SEO announcements in the NYSE/AMEX sample, it is not
unexpected that significance of the estimates is illusive, though the signs of the marginal effects are
consistent with the regression estimates for the earlier period. Overall, we find that the qualitative
results we document in the 1990-92 period remain observable in the 1995-2000 period.
The significant mean return of –0.66% in interval +1 on NYSE/AMEX, raises the question of
whether this represents arbitrage opportunities. This is however, unlikely, for at least two reasons.
First, the slower price response on NYSE/AMEX at least partly reflects the institutional features, such
as uptick rule, that prevents traders from taking advantage of stale limit orders. Secondly, commission
fees to a broker together with implicit trading costs (relating to bid-ask spreads, price impacts and
opportunity costs) range from 0.4% to over 2% for a one-way transaction (see Keim and Madhavan
(1996) and Stoll (1995)), which would make trading strategies that take advantage of the slower price
response, unprofitable after transactions costs.
6. Summary and Conclusions
This study compares the speed of NASDAQ and NYSE/AMEX price adjustments to seasoned
equity offering announcements. Our analysis uncovers several interesting findings. First, NASDAQ
27
stock prices react faster to seasoned stock offering announcements than do NYSE/AMEX stocks.
Second, NYSE/AMEX stocks have higher equity capitalization, lower spreads, greater trading activity
and larger mean two day announcement returns which existing market microstructure theories predict
would favor faster price reactions by NYSE/AMEX stocks. Controlling for these sample differences
strengthens the evidence of a NASDAQ speed advantage. Our results also suggest that differences
in market structures can significantly accelerate or retard the incorporation of news into market prices,
while stock characteristics are relatively less important in determining price reaction speed.
Further analysis indicates that several structural differences across the markets have important
impacts on the price adjustment process. NASDAQ’s faster price reaction speed is related to its
dealers bearing greater risk under the SOES electronic order system and the existence of stale limit
orders on the NYSE/AMEX after major news events, which is reinforced by its price continuity and up-
tick rules. In addition, we find that the NYSE/AMEX call auction process used to set opening prices is
less efficient in processing overnight news than is NASDAQ opening price discovery mechanism,
where competing dealers display indicative quotes prior to the market’s opening. Evidence that the
opening price mechanism on the NYSE/AMEX is less efficient is based on the findings that, following
overnight announcements of seasoned equity offers, NYSE/AMEX stock prices on average fall at the
open and continue to fall over the next one to two hours. In contrast, NASDAQ stock prices fall more
dramatically at the open, and then show little tendency to fall further over the trading day. When
extend our analysis to the 1995-2000 period, we find that our qualitative conclusions continue to hold.
It is noteworthy that all the causes we uncover for NASDAQ’s superior price adjustment speed
are due to differences in market structure, not to differences in stock characteristics over the samples.
Since our analyses focus on SEO announcements, it would be useful for future researchers to explore
the generality of these results to other news events.

28
REFERENCES
Alexander, G. and M. Peterson, “Short Selling on the New York Stock Exchange and the
Effects of the Uptick Rule,” Journal of Financial Intermediation, (January/April 1999) 8, 90-116.
Amihud, Y., and H. Mendelson, “Trading Mechanisms and Stock Returns: An Empirical
Investigation,” Journal of Finance, (July 1987) 42, 533-553.
Asquith, P. and D. Mullins, Jr., “Equity Issues and Offering Dilution,” Journal of Financial
Economics, (January/February 1986) 15, 61-89.
Atkins, A. and E. Dyl, “Market Structure and Reported Trading Volume: NASDAQ versus the
NYSE,” Journal of Financial Research, (Fall 1997) 20, 291-304.
Barclay, M. and R.Litzenberger, “Announcement Effects of New Equity Issues and the Use of
Intraday Price Data,” Journal of Financial Economics, (May 1988) 21, 71-99.
Battalio, R., B. Hatch and R. Jennings, “SOES Trading and Market Volatility,” Journal of
Financial and Quantitative Analysis, (June 1997) 32, 225-238.
Cao, C., E. Ghysels and F. Hathaway, “Price Discovery without Trading: Evidence from the
NASDAQ Pre-opening,” Journal of Finance, (June 2000) 55, 1339-1365.
Chan, K. “Imperfect Information and Cross-autocorrelation Among Stock Prices,” Journal of
Finance, (September 1993) 48, 1211-1230.
Chan, K.C., W. Christie and P. Schultz, “Market Structure and the Intraday Pattern of Bid-ask
Spreads for NASDAQ Securities,” Journal of Business, (January 1995) 68, 35-60.
Chordia, T. and B. Swaminathan, “Trading Volume and Cross-Autocorrelations in Stock
Returns,” Journal of Finance, (April 2000) 55, 913-935.
Christie, W. and P. Schultz, “Why Do NASDAQ Market Makers Avoid Odd-eight Quotes?,”
Journal of Finance, (December 1994) 49, 1813-1840.
Christie, W., J.Harris and P.Schultz, “Why Do NASDAQ Market Makers Stop Avoiding Odd-
eight Quotes?” Journal of Finance, (December 1994) 49, 1841-1860.
Christie, W. and R. Huang, “Market Structures and Liquidity: A Transactions Data Study of
Exchange Listings,” Journal of Financial Intermediation, (June 1994) 3, 300-326.
Copeland, T. and D. Galai, “Information Effects of the Bid-ask Spread,” Journal of Finance,
(December 1983) 38, 1457-1469.
Ellis, K., R. Michaely and M. O’Hara, “When the Underwrite Is the Market Maker: An
Examination of Trading in the IPO After-Market,” Journal of Finance (June 2000) 55.
Francis, J., D. Pagach and J. Stephan, “The Stock Market Response to Earnings
Announcements During Trading Versus Non-trading Periods,” Journal of Accounting Research, 30(2),
(Autumn 1992) 165-184.

29
Glosten, L. and P. Milgrom, “Bid, Ask and Transaction Prices in a Specialist Market with
Heterogeneously Informed Traders,” Journal of Financial Economics, (March 1985) 14, 71-100.
Green, J. and S. Watts, “Price Discovery on the NYSE and the NASDAQ: The Case of
Overnight and Daytime News Releases,” Financial Management, (Spring 1996) 25(1), 19-42.
Harris, J. and P. Schultz, “The Importance of Firm Quotes and Rapid Executions: Evidence
from the January 1994 SOES Rule Change,” Journal of Financial Economics, (July 1997) 45, 135-166.
Huang, R. and H. Stoll, “Dealer Versus Auction Markets: A Paired Comparison of Execution
Costs on NASDAQ and the NYSE,” Journal of Financial Economics, (July 1996) 41, 313-357.
Jennings, R. and L. Starks, “Information Content and the Speed of the Stock Price
Adjustment,” Journal of Accounting Research, (Spring 1985) 336-350.
Kavajecz, K., “A Specialist’s Quoted Depth and the Limit Order Book,’ Journal of Finance,
(April 1999) 54, 747-771.
Kim, O. and R. Verrecchia, “Market Liquidity and Volume Around Earnings Announcements,”
Journal of Accounting and Economics, (January 1994) 17, 41-67.
Krasker, W., “Stock Price Movements in Response to Stock Issues Under Asymmetric
Information,” Journal of Finance, (March 1986) 41, 93-106.
Lease, R., R. Masulis and J. Page, “An Investigation of Market Microstructure Impacts on
Event Study Returns,” Journal of Finance, (September 1991) 46 (4), 1523-1536.
Lee, C. B. Mucklow and M. Ready, “Spreads, Depths, and the Impact of Earnings Information:
An Intraday Analysis,” Review of Financial Studies (1993) 6 (4), 345-374.
Lee, C., and M. Ready, “Inferring Trade Direction from Intraday Data,” Journal of Finance,
(June 1991) 46, 733-746.
Lo, A. and C. Mackinlay, “When are Contrarian Profits Due to Stock Market Overreaction?”
Review of Financial Studies, (Summer 1990) 3, 175-205.
Madhavan, A. and G. Sofianos, “An Empirical Analysis of NYSE Specialist Trading,” Journal of
Financial Economics, (May 1998) 48, 189-210.
Madhavan, A. and V. Panchapagesan, “Price Discovery in Auction Markets: A Look Inside the
Black Box,” Review of Financial Studies, (Fall 2000) 13, 627-658.
Masulis, R. and A. Korwar, “Seasoned Equity Offerings: An Empirical Investigation,” Journal of
Financial Economics, (January/February 1986) 15, 91-118
Masulis, R. and V. Ng, “Overnight and Daytime Stock-return Dynamics on the London Stock
Exchanges: The Impacts of ‘Big Bang” and the 1987 Stock-market Crash,” Journal of Business
Economics and Statistics, (October 1995) 13, 365-378.
Mech, T., “Portfolio Return Autocorrelation,” Journal of Financial Economics, (December 1993)
34, 307-344.
30
Polonchek, J., M.B. Slovin and M.E. Sushka, “Valuation Effects of Commercial Bank Securities
Offerings: A Test of the Information Hypothesis,” Journal of Banking and Finance, (July 1989) 13, 443-
461.
Porter, D. and D. Weaver, “Post-Trade Transparency on NASDAQ’s National Market System,”
Journal of Financial Economics (November 1998) 50, 231-252.
Schultz, P., “Regulatory and Legal Pressures and the Costs of NASDAQ Trading,” Review of
Financial Studies, (Winter 2000) 13, 917-957.
Stoll, H., “The Stock Exchange Specialists System: An Economic Analysis,” Monograph Series
in Finance and Economics, (1985) New York University
Stoll, H. and R. Whaley, “Stock Market Structure and Volatility,” Review of Financial Studies,
(Spring 1990) 3, No. 1, 37-71
31
TABLE 1 Common stock returns are reported over fifteen-minute trading intervals around seasoned equity offering announcements, separated into NASDAQ and NYSE/AMEX samples. The sample consists of 253 announcements by NYSE/AMEX firms and 320 announcements by NASDAQ firms, made between January 1990 and December 1992. The returns are based on midpoint of bid and ask price at the end of each 15 minute trading interval. The p-values for mean returns are the bootstrap probabilities from the test of the null hypothesis that the mean return in each interval is not different from zero. The bootstrap p-values are derived from a comparison of mean returns in the event interval with an empirical distribution of mean returns (based on 500 samples) generated from the corresponding intervals in the benchmark period.
NASDAQ NYSE - AMEX
Event Interval
Mean return (%)
p-value Cumu-lative return
% of obs <0
% of obs =0
Sign test*
Mean return (%)
p-value Cumu-lative return
% of obs <0
% of obs =0
Sign test*
-2 -.11 .00 11 82 .11 -.03 .43 27 56 .04-1 -.12 .06 14 79 .00 -.01 .89 22 56 .920 -1.53 .00 -1.53 63 29 .00 -.98 .00 -.98 58 29 .001 -.30 .00 -1.83 29 53 .01 -.53 .00 -1.51 43 40 .002 -.04 .11 -1.87 15 68 .69 -.26 .00 -1.77 33 46 .023 -.06 .07 -1.93 13 74 1.00 -.09 .05 -1.86 28 51 .124 -.08 .05 -2.01 14 77 .05 -.18 .00 -2.04 30 50 .025 -.06 .04 -2.07 10 81 .80 -.12 .01 -2.16 28 51 .156 .09 .00 -1.98 8 81 .16 .01 .81 -2.15 25 54 .587 -.06 .12 -2.04 8 86 .65 .00 .96 -2.15 25 51 .728 -.03 .42 -2.07 9 83 1.00 -.04 .33 -2.19 19 61 .929 -.03 .30 -2.10 10 82 .43 -.01 .82 -2.20 23 57 .70
10 -.03 .37 -2.13 7 88 .52 .00 .93 -2.20 25 56 .2211 .02 .47 -2.11 5 86 .17 .00 .92 -2.20 26 55 .1912 .01 .66 -2.10 8 84 .78 .01 .75 -2.19 18 62 .68
* p-values from tests of whether the proportion of non-zero values that are positive is significantly different from 0.5.
32
TABLE 2 Seasoned stock offer announcement returns are classified by sign as negative, zero (with no trading or with trading) or positive. Frequencies of signed returns in interval 1, given signed return in interval 0, are reported. The sample consists of 253 seasoned equity offering announcements by NYSE/AMEX firms and 320 announcements by NASDAQ firms, made between January 1990 and December 1992. Panel A: NASDAQ Announcements Panel B: NYSE/AMEX Announcements
Return sign in Interval 1 Return sign in Interval 1
% of Total % of Row
Nega-tive
Zero (No
trades)
Zero (Trades)
Posi-tive
TOTAL (No. of obs.)
% of Total % of Row
Nega-tive
Zero (No
trades)
Zero (Trades)
Posi-tive
TOTAL (No. of obs.)
Negative 18.7 9.8 20.3 15.5 64.2 Negative 31.5 8.6 9.5 13.4 62.9 29.1 15.3 31.5 24.1 (203) 50.0 13.7 15.1 21.2 (146)
Zero 2.9 7.9 1.9 0.0 12.7 Zero 4.7 5.6 0.9 0.4 11.6 (No trades) 22.5 62.5 15.0 0.0 (40) (No trades) 40.7 48.2 7.4 3.7 (27)
Zero 6.3 3.8 4.8 0.3 15.2 Zero 5.6 1.7 2.2 2.2 11.6
(Trades) 41.7 25.0 31.3 2.1 (48) (Trades) 48.2 14.8 18.5 18.5 (27)
Positive 2.5 1.0 2.2 2.22 7.9 Positive 6.5 3.9 0.9 2.6 13.8 32.0 12.0 28.0 28.0 (25) 46.9 28.1 6.3 18.8 (32)
Ret
urn
Sig
n in
Inte
rval
0
TOTAL (No. of obs.)
30.4 (96)
22.5 (71)
29.1 (92)
18.0 (57)
100.0 (316)
Ret
urn
Sign
in In
terv
al 0
TOTAL
(No. of obs.)48.3
(112) 19.8 (46)
13.4 (31)
18.5 (43)
100.0 (232)
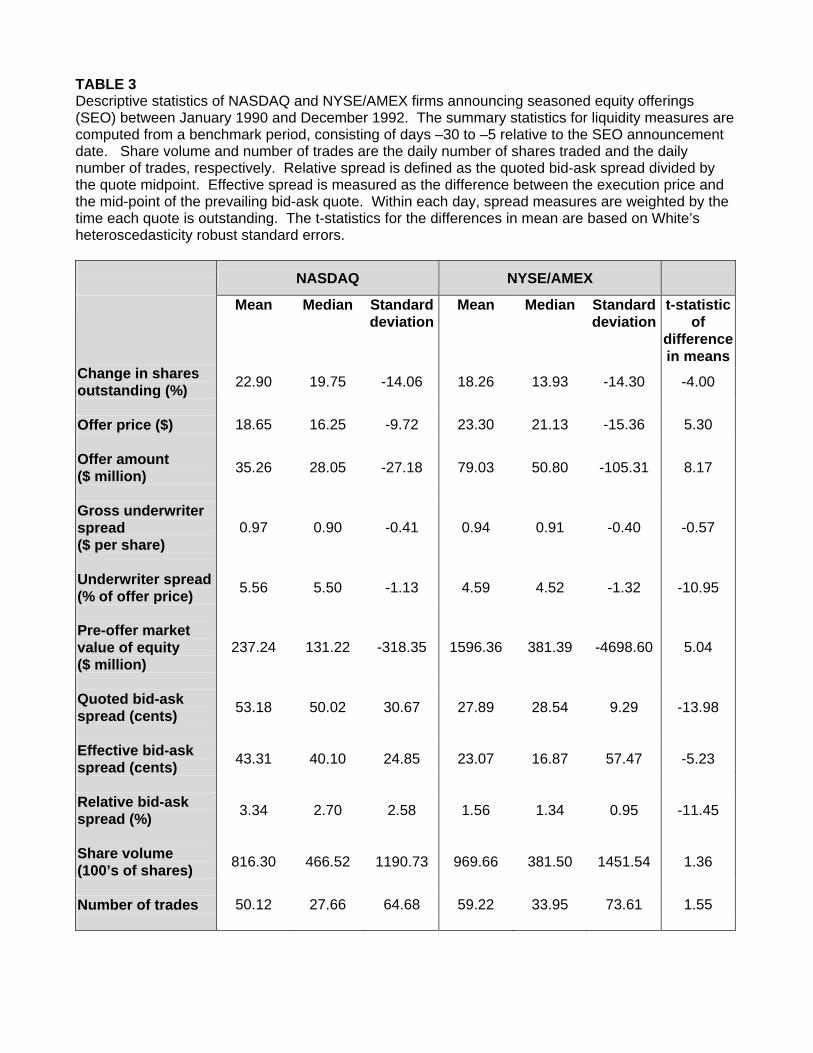
TABLE 3 Descriptive statistics of NASDAQ and NYSE/AMEX firms announcing seasoned equity offerings (SEO) between January 1990 and December 1992. The summary statistics for liquidity measures are computed from a benchmark period, consisting of days –30 to –5 relative to the SEO announcement date. Share volume and number of trades are the daily number of shares traded and the daily number of trades, respectively. Relative spread is defined as the quoted bid-ask spread divided by the quote midpoint. Effective spread is measured as the difference between the execution price and the mid-point of the prevailing bid-ask quote. Within each day, spread measures are weighted by the time each quote is outstanding. The t-statistics for the differences in mean are based on White’s heteroscedasticity robust standard errors. NASDAQ NYSE/AMEX
Mean Median Standard deviation
Mean Median Standard deviation
t-statistic of
difference in means
Change in shares outstanding (%) 22.90 19.75 -14.06 18.26 13.93 -14.30 -4.00
Offer price ($) 18.65 16.25 -9.72 23.30 21.13 -15.36 5.30 Offer amount ($ million) 35.26 28.05 -27.18 79.03 50.80 -105.31 8.17
Gross underwriter spread ($ per share)
0.97 0.90 -0.41 0.94 0.91 -0.40 -0.57
Underwriter spread (% of offer price) 5.56 5.50 -1.13 4.59 4.52 -1.32 -10.95
Pre-offer market value of equity ($ million)
237.24 131.22 -318.35 1596.36 381.39 -4698.60 5.04
Quoted bid-ask spread (cents) 53.18 50.02 30.67 27.89 28.54 9.29 -13.98
Effective bid-ask spread (cents) 43.31 40.10 24.85 23.07 16.87 57.47 -5.23
Relative bid-ask spread (%) 3.34 2.70 2.58 1.56 1.34 0.95 -11.45
Share volume (100’s of shares) 816.30 466.52 1190.73 969.66 381.50 1451.54 1.36
Number of trades 50.12 27.66 64.68 59.22 33.95 73.61 1.55
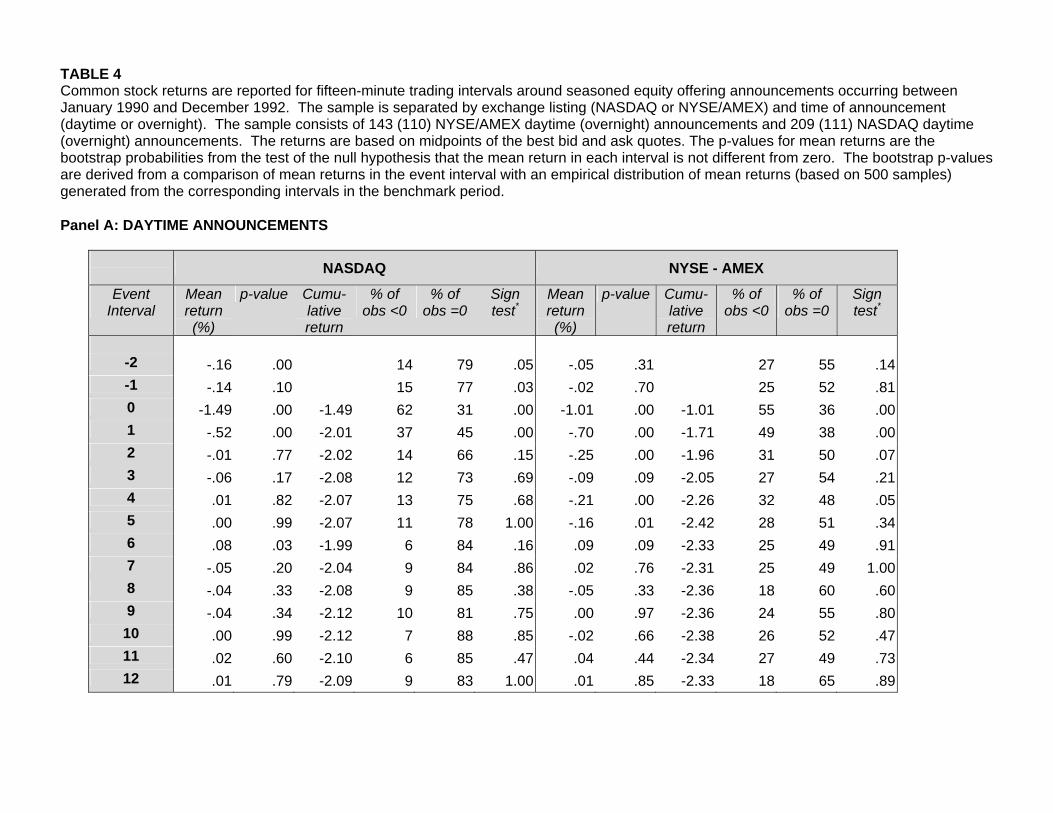
TABLE 4 Common stock returns are reported for fifteen-minute trading intervals around seasoned equity offering announcements occurring between January 1990 and December 1992. The sample is separated by exchange listing (NASDAQ or NYSE/AMEX) and time of announcement (daytime or overnight). The sample consists of 143 (110) NYSE/AMEX daytime (overnight) announcements and 209 (111) NASDAQ daytime (overnight) announcements. The returns are based on midpoints of the best bid and ask quotes. The p-values for mean returns are the bootstrap probabilities from the test of the null hypothesis that the mean return in each interval is not different from zero. The bootstrap p-values are derived from a comparison of mean returns in the event interval with an empirical distribution of mean returns (based on 500 samples) generated from the corresponding intervals in the benchmark period. Panel A: DAYTIME ANNOUNCEMENTS
NASDAQ NYSE - AMEX
Event Interval
Mean return (%)
p-value Cumu-lative return
% of obs <0
% of obs =0
Sign test*
Mean return (%)
p-value Cumu-lative return
% of obs <0
% of obs =0
Sign test*
-2 -.16 .00 14 79 .05 -.05 .31 27 55 .14-1 -.14 .10 15 77 .03 -.02 .70 25 52 .810 -1.49 .00 -1.49 62 31 .00 -1.01 .00 -1.01 55 36 .001 -.52 .00 -2.01 37 45 .00 -.70 .00 -1.71 49 38 .002 -.01 .77 -2.02 14 66 .15 -.25 .00 -1.96 31 50 .073 -.06 .17 -2.08 12 73 .69 -.09 .09 -2.05 27 54 .214 .01 .82 -2.07 13 75 .68 -.21 .00 -2.26 32 48 .055 .00 .99 -2.07 11 78 1.00 -.16 .01 -2.42 28 51 .346 .08 .03 -1.99 6 84 .16 .09 .09 -2.33 25 49 .917 -.05 .20 -2.04 9 84 .86 .02 .76 -2.31 25 49 1.008 -.04 .33 -2.08 9 85 .38 -.05 .33 -2.36 18 60 .609 -.04 .34 -2.12 10 81 .75 .00 .97 -2.36 24 55 .80
10 .00 .99 -2.12 7 88 .85 -.02 .66 -2.38 26 52 .4711 .02 .60 -2.10 6 85 .47 .04 .44 -2.34 27 49 .7312 .01 .79 -2.09 9 83 1.00 .01 .85 -2.33 18 65 .89
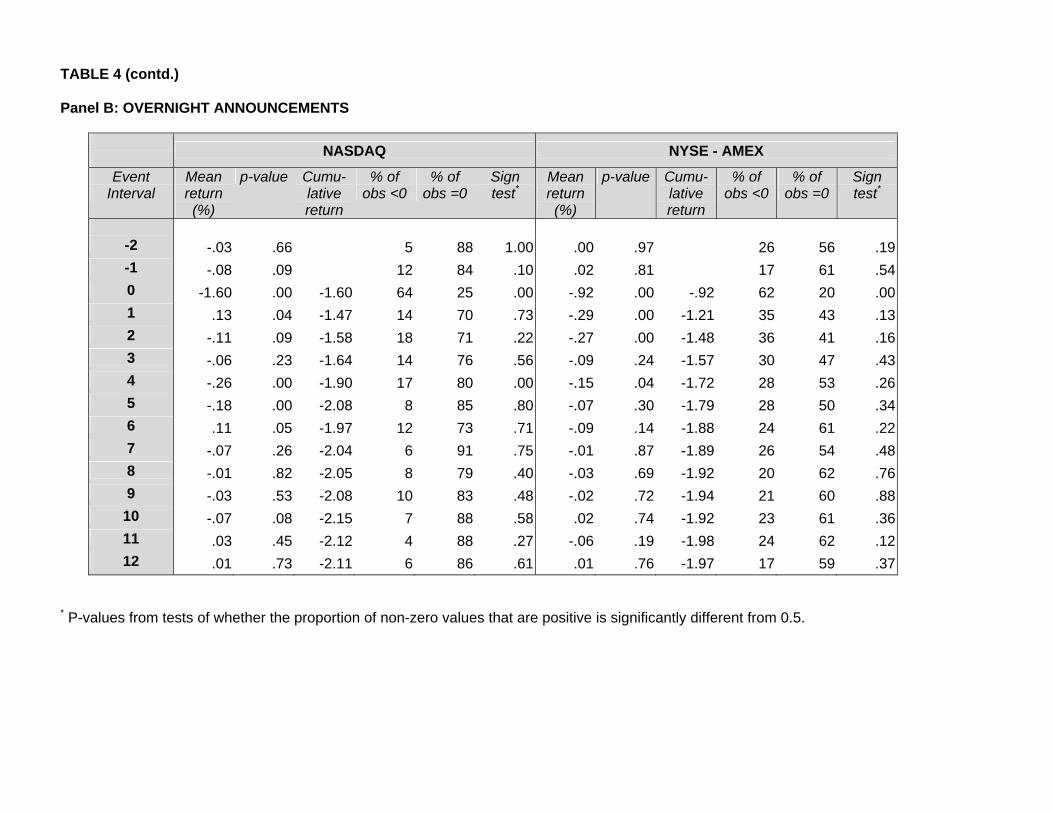
TABLE 4 (contd.) Panel B: OVERNIGHT ANNOUNCEMENTS
NASDAQ NYSE - AMEX
Event Interval
Mean return (%)
p-value Cumu-lative return
% of obs <0
% of obs =0
Sign test*
Mean return (%)
p-value Cumu-lative return
% of obs <0
% of obs =0
Sign test*
-2 -.03 .66 5 88 1.00 .00 .97 26 56 .19-1 -.08 .09 12 84 .10 .02 .81 17 61 .540 -1.60 .00 -1.60 64 25 .00 -.92 .00 -.92 62 20 .001 .13 .04 -1.47 14 70 .73 -.29 .00 -1.21 35 43 .132 -.11 .09 -1.58 18 71 .22 -.27 .00 -1.48 36 41 .163 -.06 .23 -1.64 14 76 .56 -.09 .24 -1.57 30 47 .434 -.26 .00 -1.90 17 80 .00 -.15 .04 -1.72 28 53 .265 -.18 .00 -2.08 8 85 .80 -.07 .30 -1.79 28 50 .346 .11 .05 -1.97 12 73 .71 -.09 .14 -1.88 24 61 .227 -.07 .26 -2.04 6 91 .75 -.01 .87 -1.89 26 54 .488 -.01 .82 -2.05 8 79 .40 -.03 .69 -1.92 20 62 .769 -.03 .53 -2.08 10 83 .48 -.02 .72 -1.94 21 60 .88
10 -.07 .08 -2.15 7 88 .58 .02 .74 -1.92 23 61 .3611 .03 .45 -2.12 4 88 .27 -.06 .19 -1.98 24 62 .1212 .01 .73 -2.11 6 86 .61 .01 .76 -1.97 17 59 .37
* P-values from tests of whether the proportion of non-zero values that are positive is significantly different from 0.5.
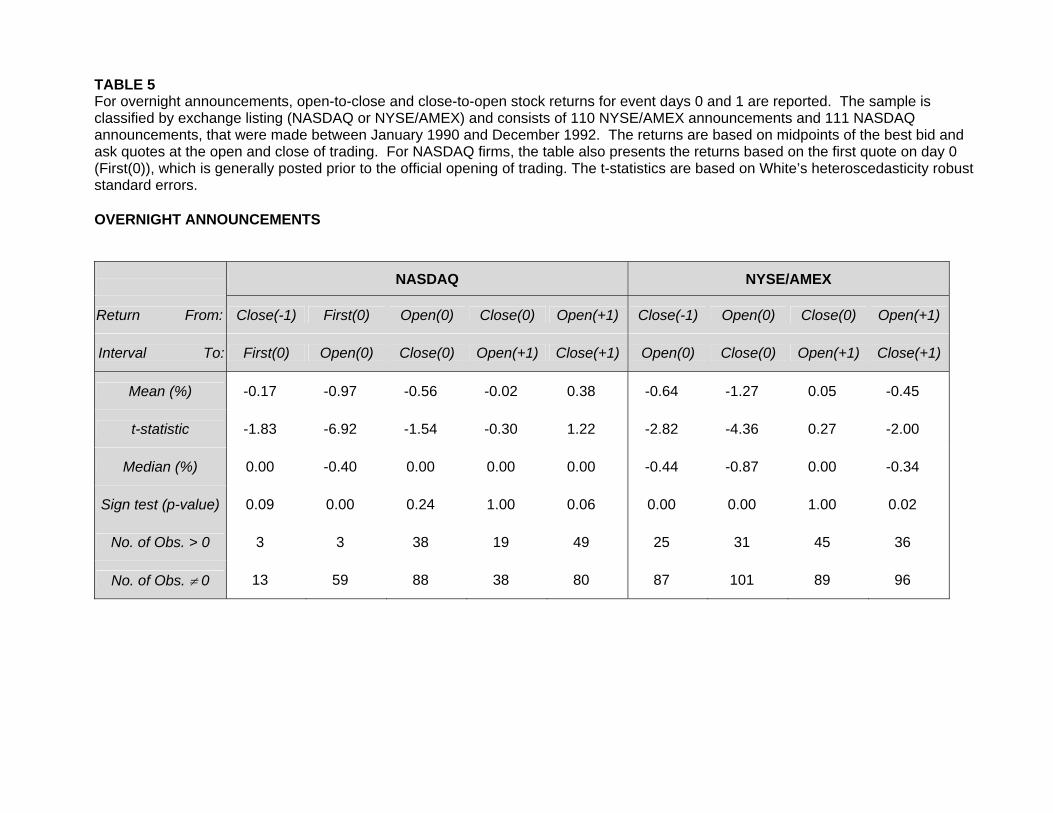
TABLE 5 For overnight announcements, open-to-close and close-to-open stock returns for event days 0 and 1 are reported. The sample is classified by exchange listing (NASDAQ or NYSE/AMEX) and consists of 110 NYSE/AMEX announcements and 111 NASDAQ announcements, that were made between January 1990 and December 1992. The returns are based on midpoints of the best bid and ask quotes at the open and close of trading. For NASDAQ firms, the table also presents the returns based on the first quote on day 0 (First(0)), which is generally posted prior to the official opening of trading. The t-statistics are based on White’s heteroscedasticity robust standard errors. OVERNIGHT ANNOUNCEMENTS
NASDAQ NYSE/AMEX
Return From: Close(-1) First(0) Open(0) Close(0) Open(+1) Close(-1) Open(0) Close(0) Open(+1)
Interval To: First(0) Open(0) Close(0) Open(+1) Close(+1) Open(0) Close(0) Open(+1) Close(+1)
Mean (%) -0.17 -0.97 -0.56 -0.02 0.38 -0.64 -1.27 0.05 -0.45
t-statistic -1.83 -6.92 -1.54 -0.30 1.22 -2.82 -4.36 0.27 -2.00
Median (%) 0.00 -0.40 0.00 0.00 0.00 -0.44 -0.87 0.00 -0.34
Sign test (p-value) 0.09 0.00 0.24 1.00 0.06 0.00 0.00 1.00 0.02
No. of Obs. > 0 3 3 38 19 49 25 31 45 36
No. of Obs. ≠ 0 13 59 88 38 80 87 101 89 96
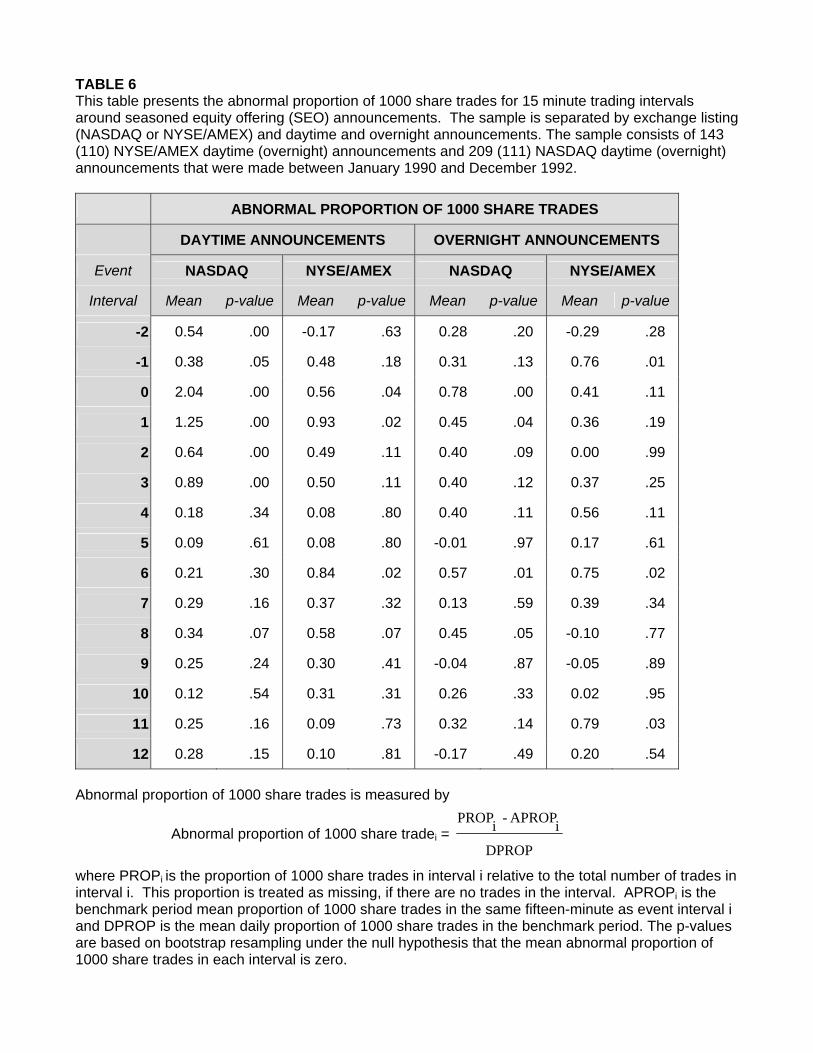
TABLE 6 This table presents the abnormal proportion of 1000 share trades for 15 minute trading intervals around seasoned equity offering (SEO) announcements. The sample is separated by exchange listing (NASDAQ or NYSE/AMEX) and daytime and overnight announcements. The sample consists of 143 (110) NYSE/AMEX daytime (overnight) announcements and 209 (111) NASDAQ daytime (overnight) announcements that were made between January 1990 and December 1992.
ABNORMAL PROPORTION OF 1000 SHARE TRADES
DAYTIME ANNOUNCEMENTS OVERNIGHT ANNOUNCEMENTS
Event NASDAQ NYSE/AMEX NASDAQ NYSE/AMEX
Interval Mean p-value Mean p-value Mean p-value Mean p-value
-2 0.54 .00 -0.17 .63 0.28 .20 -0.29 .28
-1 0.38 .05 0.48 .18 0.31 .13 0.76 .01
0 2.04 .00 0.56 .04 0.78 .00 0.41 .11
1 1.25 .00 0.93 .02 0.45 .04 0.36 .19
2 0.64 .00 0.49 .11 0.40 .09 0.00 .99
3 0.89 .00 0.50 .11 0.40 .12 0.37 .25
4 0.18 .34 0.08 .80 0.40 .11 0.56 .11
5 0.09 .61 0.08 .80 -0.01 .97 0.17 .61
6 0.21 .30 0.84 .02 0.57 .01 0.75 .02
7 0.29 .16 0.37 .32 0.13 .59 0.39 .34
8 0.34 .07 0.58 .07 0.45 .05 -0.10 .77
9 0.25 .24 0.30 .41 -0.04 .87 -0.05 .89
10 0.12 .54 0.31 .31 0.26 .33 0.02 .95
11 0.25 .16 0.09 .73 0.32 .14 0.79 .03
12 0.28 .15 0.10 .81 -0.17 .49 0.20 .54 Abnormal proportion of 1000 share trades is measured by
Abnormal proportion of 1000 share tradei = DPROP
iAPROP -iPROP
where PROPi is the proportion of 1000 share trades in interval i relative to the total number of trades in interval i. This proportion is treated as missing, if there are no trades in the interval. APROPi is the benchmark period mean proportion of 1000 share trades in the same fifteen-minute as event interval i and DPROP is the mean daily proportion of 1000 share trades in the benchmark period. The p-values are based on bootstrap resampling under the null hypothesis that the mean abnormal proportion of 1000 share trades in each interval is zero.
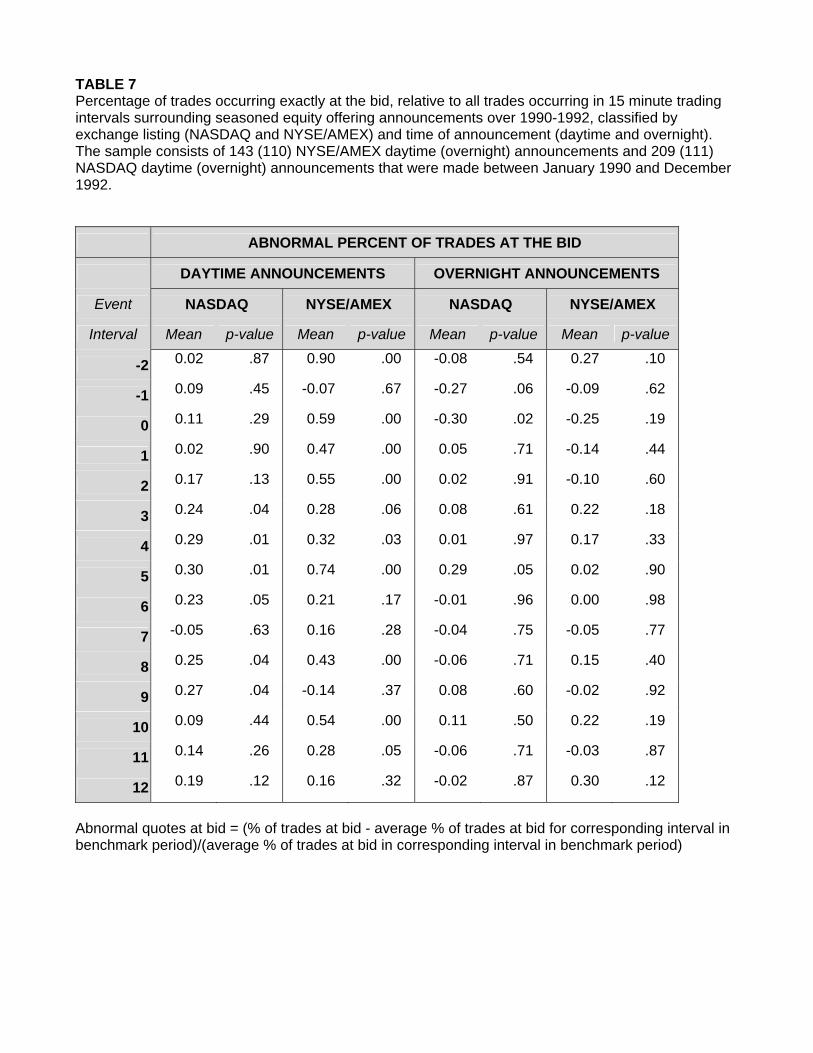
TABLE 7 Percentage of trades occurring exactly at the bid, relative to all trades occurring in 15 minute trading intervals surrounding seasoned equity offering announcements over 1990-1992, classified by exchange listing (NASDAQ and NYSE/AMEX) and time of announcement (daytime and overnight). The sample consists of 143 (110) NYSE/AMEX daytime (overnight) announcements and 209 (111) NASDAQ daytime (overnight) announcements that were made between January 1990 and December 1992.
ABNORMAL PERCENT OF TRADES AT THE BID
DAYTIME ANNOUNCEMENTS OVERNIGHT ANNOUNCEMENTS
Event NASDAQ NYSE/AMEX NASDAQ NYSE/AMEX
Interval Mean p-value Mean p-value Mean p-value Mean p-value
-2 0.02 .87 0.90 .00 -0.08 .54 0.27 .10
-1 0.09 .45 -0.07 .67 -0.27 .06 -0.09 .62
0 0.11 .29 0.59 .00 -0.30 .02 -0.25 .19
1 0.02 .90 0.47 .00 0.05 .71 -0.14 .44
2 0.17 .13 0.55 .00 0.02 .91 -0.10 .60
3 0.24 .04 0.28 .06 0.08 .61 0.22 .18
4 0.29 .01 0.32 .03 0.01 .97 0.17 .33
5 0.30 .01 0.74 .00 0.29 .05 0.02 .90
6 0.23 .05 0.21 .17 -0.01 .96 0.00 .98
7 -0.05 .63 0.16 .28 -0.04 .75 -0.05 .77
8 0.25 .04 0.43 .00 -0.06 .71 0.15 .40
9 0.27 .04 -0.14 .37 0.08 .60 -0.02 .92
10 0.09 .44 0.54 .00 0.11 .50 0.22 .19
11 0.14 .26 0.28 .05 -0.06 .71 -0.03 .87
12 0.19 .12 0.16 .32 -0.02 .87 0.30 .12
Abnormal quotes at bid = (% of trades at bid - average % of trades at bid for corresponding interval in benchmark period)/(average % of trades at bid in corresponding interval in benchmark period)
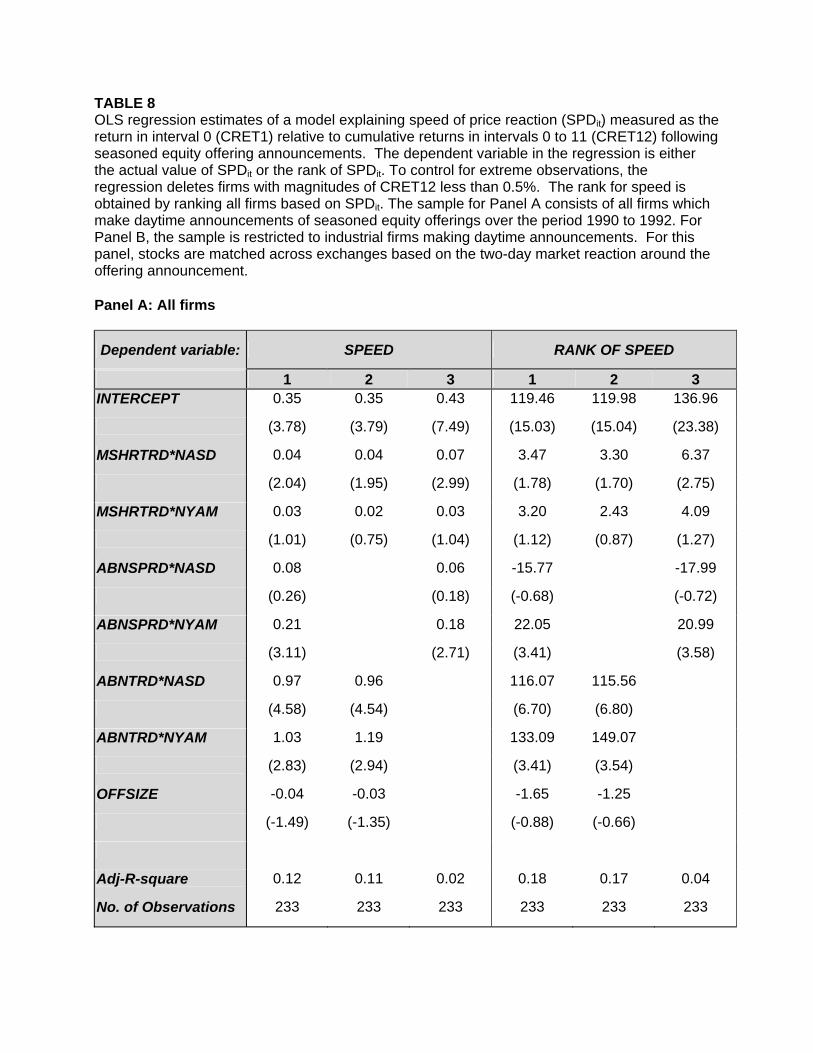
TABLE 8 OLS regression estimates of a model explaining speed of price reaction (SPDit) measured as the return in interval 0 (CRET1) relative to cumulative returns in intervals 0 to 11 (CRET12) following seasoned equity offering announcements. The dependent variable in the regression is either the actual value of SPDit or the rank of SPDit. To control for extreme observations, the regression deletes firms with magnitudes of CRET12 less than 0.5%. The rank for speed is obtained by ranking all firms based on SPDit. The sample for Panel A consists of all firms which make daytime announcements of seasoned equity offerings over the period 1990 to 1992. For Panel B, the sample is restricted to industrial firms making daytime announcements. For this panel, stocks are matched across exchanges based on the two-day market reaction around the offering announcement. Panel A: All firms
Dependent variable: SPEED RANK OF SPEED
1 2 3 1 2 3 INTERCEPT 0.35 0.35 0.43 119.46 119.98 136.96
(3.78) (3.79) (7.49) (15.03) (15.04) (23.38)
MSHRTRD*NASD 0.04 0.04 0.07 3.47 3.30 6.37
(2.04) (1.95) (2.99) (1.78) (1.70) (2.75)
MSHRTRD*NYAM 0.03 0.02 0.03 3.20 2.43 4.09
(1.01) (0.75) (1.04) (1.12) (0.87) (1.27)
ABNSPRD*NASD 0.08 0.06 -15.77 -17.99
(0.26) (0.18) (-0.68) (-0.72)
ABNSPRD*NYAM 0.21 0.18 22.05 20.99
(3.11) (2.71) (3.41) (3.58)
ABNTRD*NASD 0.97 0.96 116.07 115.56
(4.58) (4.54) (6.70) (6.80)
ABNTRD*NYAM 1.03 1.19 133.09 149.07
(2.83) (2.94) (3.41) (3.54)
OFFSIZE -0.04 -0.03 -1.65 -1.25
(-1.49) (-1.35) (-0.88) (-0.66)
Adj-R-square 0.12 0.11 0.02 0.18 0.17 0.04
No. of Observations 233 233 233 233 233 233
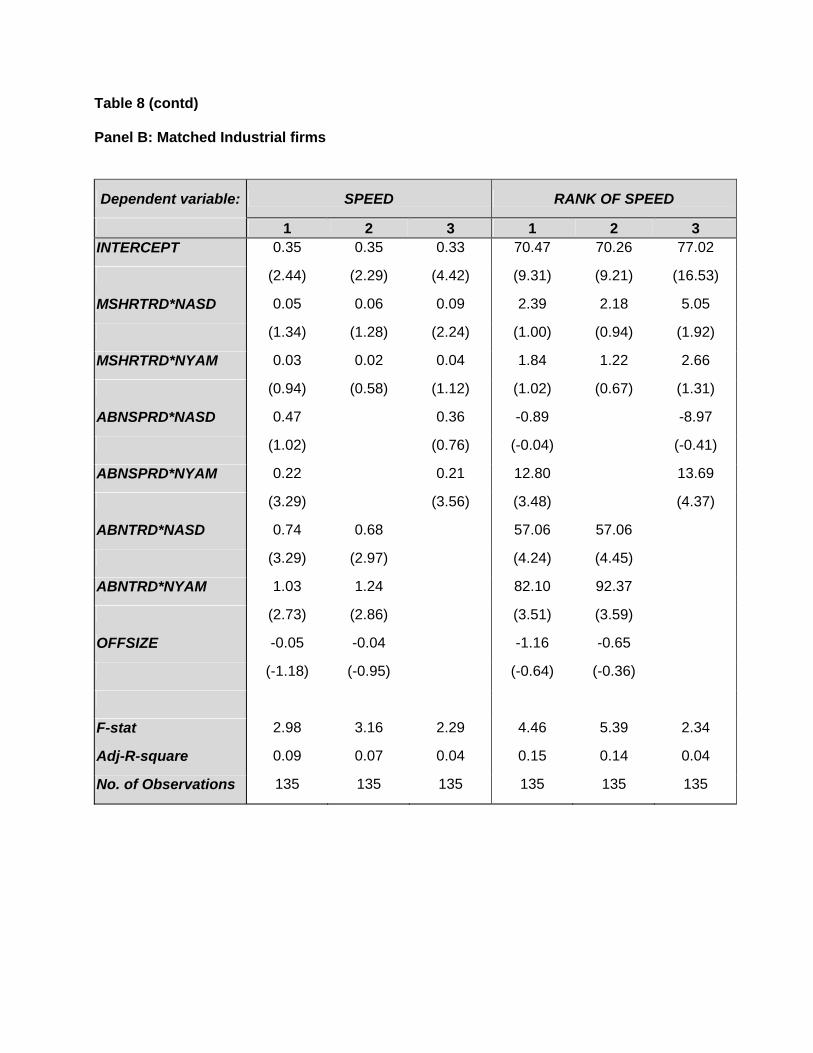
Table 8 (contd) Panel B: Matched Industrial firms
Dependent variable: SPEED RANK OF SPEED
1 2 3 1 2 3 INTERCEPT 0.35 0.35 0.33 70.47 70.26 77.02
(2.44) (2.29) (4.42) (9.31) (9.21) (16.53)
MSHRTRD*NASD 0.05 0.06 0.09 2.39 2.18 5.05
(1.34) (1.28) (2.24) (1.00) (0.94) (1.92)
MSHRTRD*NYAM 0.03 0.02 0.04 1.84 1.22 2.66
(0.94) (0.58) (1.12) (1.02) (0.67) (1.31)
ABNSPRD*NASD 0.47 0.36 -0.89 -8.97
(1.02) (0.76) (-0.04) (-0.41)
ABNSPRD*NYAM 0.22 0.21 12.80 13.69
(3.29) (3.56) (3.48) (4.37)
ABNTRD*NASD 0.74 0.68 57.06 57.06
(3.29) (2.97) (4.24) (4.45)
ABNTRD*NYAM 1.03 1.24 82.10 92.37
(2.73) (2.86) (3.51) (3.59)
OFFSIZE -0.05 -0.04 -1.16 -0.65
(-1.18) (-0.95) (-0.64) (-0.36)
F-stat 2.98 3.16 2.29 4.46 5.39 2.34
Adj-R-square 0.09 0.07 0.04 0.15 0.14 0.04
No. of Observations 135 135 135 135 135 135

Table 8 (contd) The t-statistics are based on White’s heteroscedasticity robust standard errors and are in parenthesis. Variable Definitions: MSHRTRD: Abnormal proportion of 1000 share trades in event interval 0, measured as the proportion of 1000 share trades in that event interval relative to all trades in that interval minus the average proportion of 1000 share trades in interval 0 for the benchmark period, scaled by the mean daily proportion of 1000 share trades in the benchmark period. ABNSPRD: Abnormal relative bid-ask spread is measured by the time weighted average relative bid-ask spread in event interval i minus the average time weighted relative bid-ask spread in interval i for the benchmark period, all divided by the mean daily time weighted relative spread in the benchmark period. ABNTRD: Abnormal number of trades measured by the number of trades in event interval i, less average number of trades in corresponding interval in benchmark period, standardized by the mean daily number of trades from the benchmark period. OFFSIZE: logarithm of the offering’s gross proceeds. NYAM: 1 for NYSE/AMEX stocks, 0 otherwise. NASD: 1 for NASDAQ stocks, 0 otherwise. The benchmark period is defined as event days -30 to -5, where event day 0 is defined as the SEO announcement date, if the announcement occurs before 4pm. If the announcement occurs after 4pm, then day 0 is defined as the following trading day.
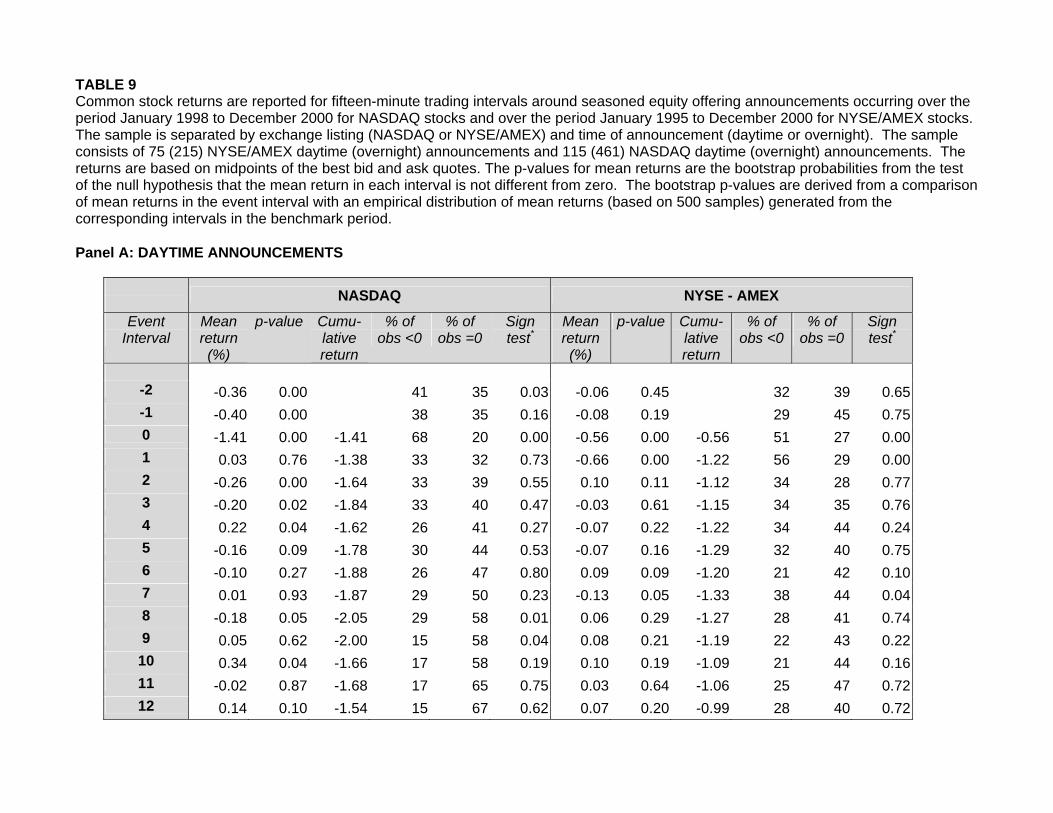
TABLE 9 Common stock returns are reported for fifteen-minute trading intervals around seasoned equity offering announcements occurring over the period January 1998 to December 2000 for NASDAQ stocks and over the period January 1995 to December 2000 for NYSE/AMEX stocks. The sample is separated by exchange listing (NASDAQ or NYSE/AMEX) and time of announcement (daytime or overnight). The sample consists of 75 (215) NYSE/AMEX daytime (overnight) announcements and 115 (461) NASDAQ daytime (overnight) announcements. The returns are based on midpoints of the best bid and ask quotes. The p-values for mean returns are the bootstrap probabilities from the test of the null hypothesis that the mean return in each interval is not different from zero. The bootstrap p-values are derived from a comparison of mean returns in the event interval with an empirical distribution of mean returns (based on 500 samples) generated from the corresponding intervals in the benchmark period. Panel A: DAYTIME ANNOUNCEMENTS
NASDAQ NYSE - AMEX
Event Interval
Mean return (%)
p-value Cumu-lative return
% of obs <0
% of obs =0
Sign test*
Mean return (%)
p-value Cumu-lative return
% of obs <0
% of obs =0
Sign test*
-2 -0.36 0.00 41 35 0.03 -0.06 0.45 32 39 0.65-1 -0.40 0.00 38 35 0.16 -0.08 0.19 29 45 0.750 -1.41 0.00 -1.41 68 20 0.00 -0.56 0.00 -0.56 51 27 0.001 0.03 0.76 -1.38 33 32 0.73 -0.66 0.00 -1.22 56 29 0.002 -0.26 0.00 -1.64 33 39 0.55 0.10 0.11 -1.12 34 28 0.773 -0.20 0.02 -1.84 33 40 0.47 -0.03 0.61 -1.15 34 35 0.764 0.22 0.04 -1.62 26 41 0.27 -0.07 0.22 -1.22 34 44 0.245 -0.16 0.09 -1.78 30 44 0.53 -0.07 0.16 -1.29 32 40 0.756 -0.10 0.27 -1.88 26 47 0.80 0.09 0.09 -1.20 21 42 0.107 0.01 0.93 -1.87 29 50 0.23 -0.13 0.05 -1.33 38 44 0.048 -0.18 0.05 -2.05 29 58 0.01 0.06 0.29 -1.27 28 41 0.749 0.05 0.62 -2.00 15 58 0.04 0.08 0.21 -1.19 22 43 0.22
10 0.34 0.04 -1.66 17 58 0.19 0.10 0.19 -1.09 21 44 0.1611 -0.02 0.87 -1.68 17 65 0.75 0.03 0.64 -1.06 25 47 0.7212 0.14 0.10 -1.54 15 67 0.62 0.07 0.20 -0.99 28 40 0.72
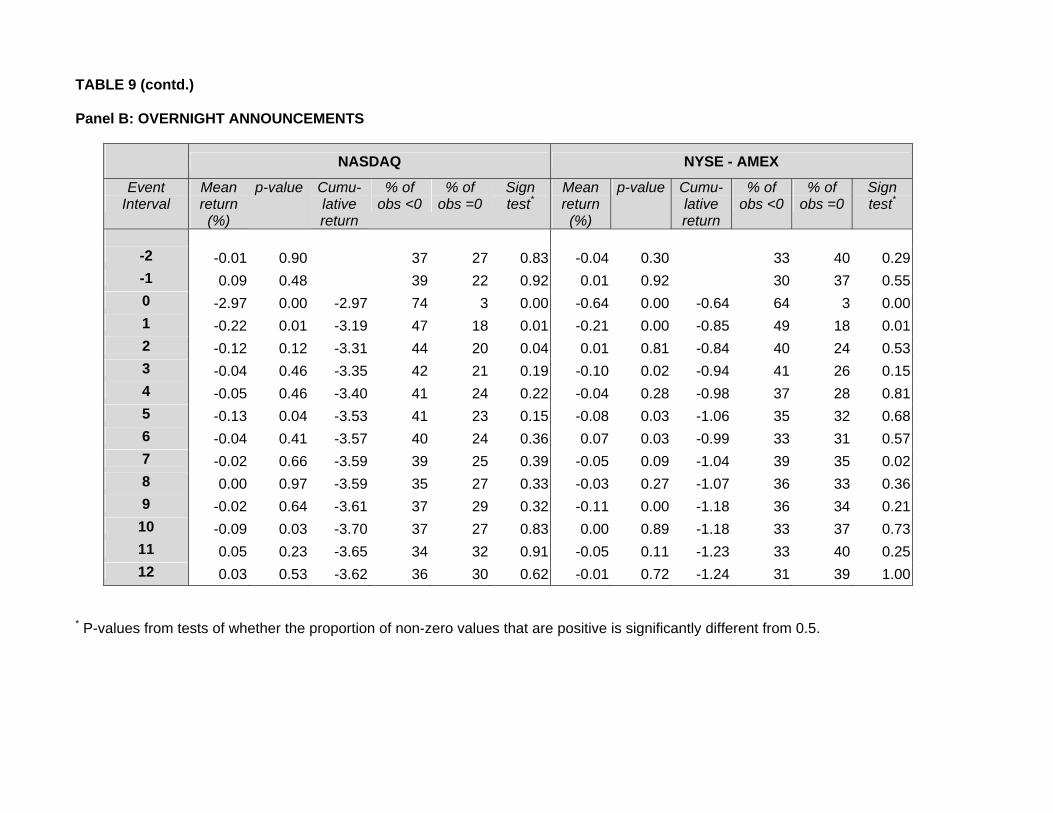
TABLE 9 (contd.) Panel B: OVERNIGHT ANNOUNCEMENTS
NASDAQ NYSE - AMEX
Event Interval
Mean return (%)
p-value Cumu-lative return
% of obs <0
% of obs =0
Sign test*
Mean return (%)
p-value Cumu-lative return
% of obs <0
% of obs =0
Sign test*
-2 -0.01 0.90 37 27 0.83 -0.04 0.30 33 40 0.29-1 0.09 0.48 39 22 0.92 0.01 0.92 30 37 0.550 -2.97 0.00 -2.97 74 3 0.00 -0.64 0.00 -0.64 64 3 0.001 -0.22 0.01 -3.19 47 18 0.01 -0.21 0.00 -0.85 49 18 0.012 -0.12 0.12 -3.31 44 20 0.04 0.01 0.81 -0.84 40 24 0.533 -0.04 0.46 -3.35 42 21 0.19 -0.10 0.02 -0.94 41 26 0.154 -0.05 0.46 -3.40 41 24 0.22 -0.04 0.28 -0.98 37 28 0.815 -0.13 0.04 -3.53 41 23 0.15 -0.08 0.03 -1.06 35 32 0.686 -0.04 0.41 -3.57 40 24 0.36 0.07 0.03 -0.99 33 31 0.577 -0.02 0.66 -3.59 39 25 0.39 -0.05 0.09 -1.04 39 35 0.028 0.00 0.97 -3.59 35 27 0.33 -0.03 0.27 -1.07 36 33 0.369 -0.02 0.64 -3.61 37 29 0.32 -0.11 0.00 -1.18 36 34 0.21
10 -0.09 0.03 -3.70 37 27 0.83 0.00 0.89 -1.18 33 37 0.7311 0.05 0.23 -3.65 34 32 0.91 -0.05 0.11 -1.23 33 40 0.2512 0.03 0.53 -3.62 36 30 0.62 -0.01 0.72 -1.24 31 39 1.00
* P-values from tests of whether the proportion of non-zero values that are positive is significantly different from 0.5.
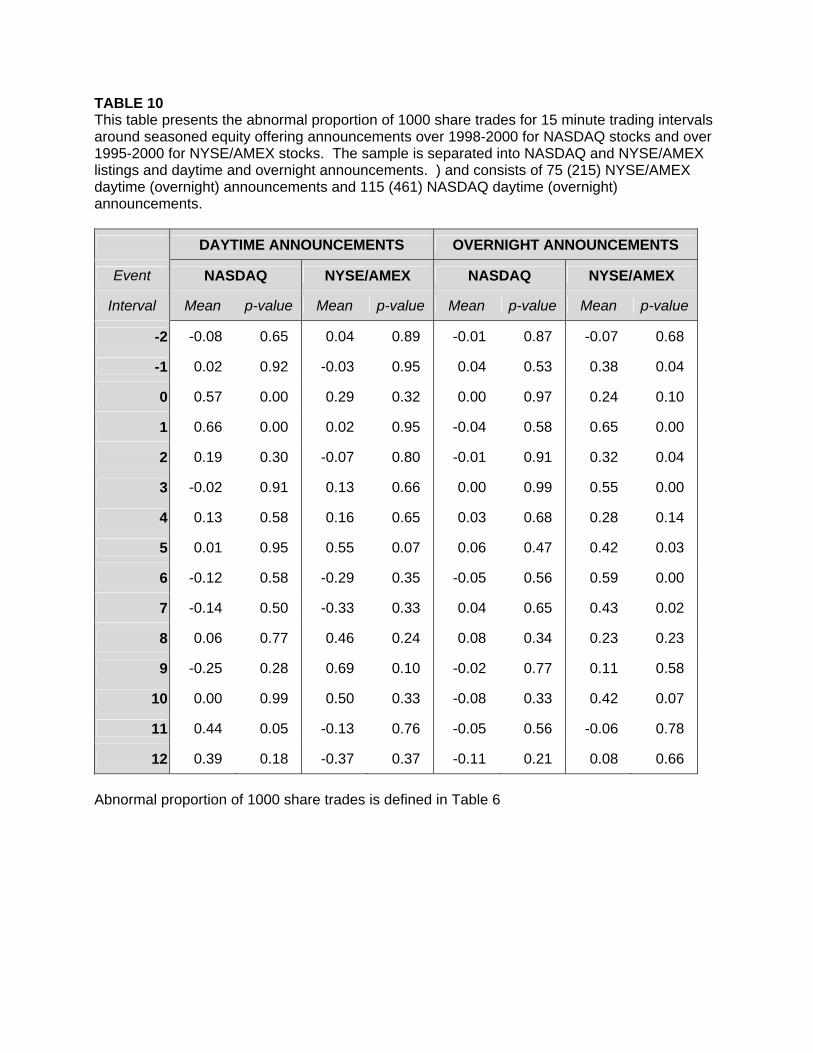
TABLE 10 This table presents the abnormal proportion of 1000 share trades for 15 minute trading intervals around seasoned equity offering announcements over 1998-2000 for NASDAQ stocks and over 1995-2000 for NYSE/AMEX stocks. The sample is separated into NASDAQ and NYSE/AMEX listings and daytime and overnight announcements. ) and consists of 75 (215) NYSE/AMEX daytime (overnight) announcements and 115 (461) NASDAQ daytime (overnight) announcements.
DAYTIME ANNOUNCEMENTS OVERNIGHT ANNOUNCEMENTS
Event NASDAQ NYSE/AMEX NASDAQ NYSE/AMEX
Interval Mean p-value Mean p-value Mean p-value Mean p-value
-2 -0.08 0.65 0.04 0.89 -0.01 0.87 -0.07 0.68
-1 0.02 0.92 -0.03 0.95 0.04 0.53 0.38 0.04
0 0.57 0.00 0.29 0.32 0.00 0.97 0.24 0.10
1 0.66 0.00 0.02 0.95 -0.04 0.58 0.65 0.00
2 0.19 0.30 -0.07 0.80 -0.01 0.91 0.32 0.04
3 -0.02 0.91 0.13 0.66 0.00 0.99 0.55 0.00
4 0.13 0.58 0.16 0.65 0.03 0.68 0.28 0.14
5 0.01 0.95 0.55 0.07 0.06 0.47 0.42 0.03
6 -0.12 0.58 -0.29 0.35 -0.05 0.56 0.59 0.00
7 -0.14 0.50 -0.33 0.33 0.04 0.65 0.43 0.02
8 0.06 0.77 0.46 0.24 0.08 0.34 0.23 0.23
9 -0.25 0.28 0.69 0.10 -0.02 0.77 0.11 0.58
10 0.00 0.99 0.50 0.33 -0.08 0.33 0.42 0.07
11 0.44 0.05 -0.13 0.76 -0.05 0.56 -0.06 0.78
12 0.39 0.18 -0.37 0.37 -0.11 0.21 0.08 0.66 Abnormal proportion of 1000 share trades is defined in Table 6
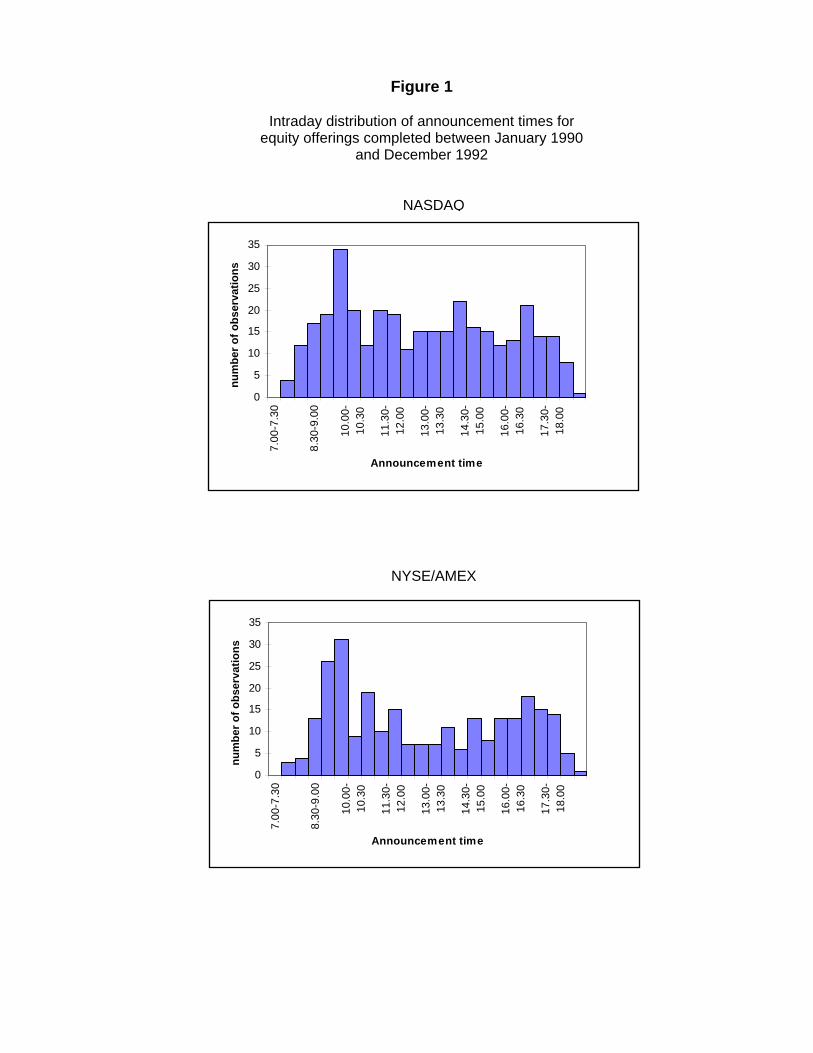
0
5
10
15
20
25
30
35
7.00
-7.3
0
8.30
-9.0
0
10.0
0-10
.30
11.3
0-12
.00
13.0
0-13
.30
14.3
0-15
.00
16.0
0-16
.30
17.3
0-18
.00
Announcement time
num
ber o
f obs
erva
tions
0
5
10
15
20
25
30
35
7.00
-7.3
0
8.30
-9.0
0
10.0
0-10
.30
11.3
0-12
.00
13.0
0-13
.30
14.3
0-15
.00
16.0
0-16
.30
17.3
0-18
.00
Announcement time
num
ber o
f obs
erva
tions
Figure 1
Intraday distribution of announcement times for equity offerings completed between January 1990
and December 1992
NASDAQ
NYSE/AMEX
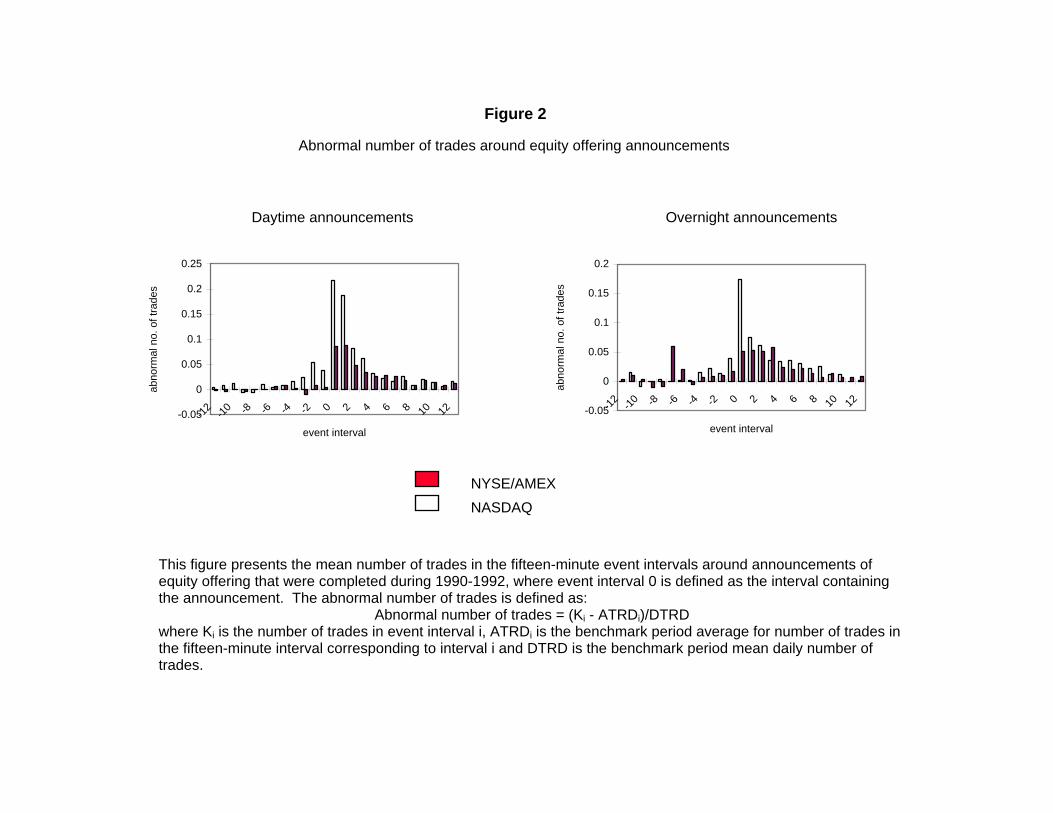
Figure 2
Overnight announcements Daytime announcements
-0.05
0
0.05
0.1
0.15
0.2
-12 -10 -8 -6 -4 -2 0 2 4 6 8 10 12
event interval
abno
rmal
no.
of t
rade
s
-0.05
0
0.05
0.1
0.15
0.2
0.25
-12 -10 -8 -6 -4 -2 0 2 4 6 8 10 12
event interval
abno
rmal
no.
of t
rade
s
This figure presents the mean number of trades in the fifteen-minute event intervals around announcements of equity offering that were completed during 1990-1992, where event interval 0 is defined as the interval containing the announcement. The abnormal number of trades is defined as:
Abnormal number of trades = (Ki - ATRDi)/DTRD where Ki is the number of trades in event interval i, ATRDi is the benchmark period average for number of trades in the fifteen-minute interval corresponding to interval i and DTRD is the benchmark period mean daily number of trades.
NYSE/AMEXNASDAQ
Abnormal number of trades around equity offering announcements
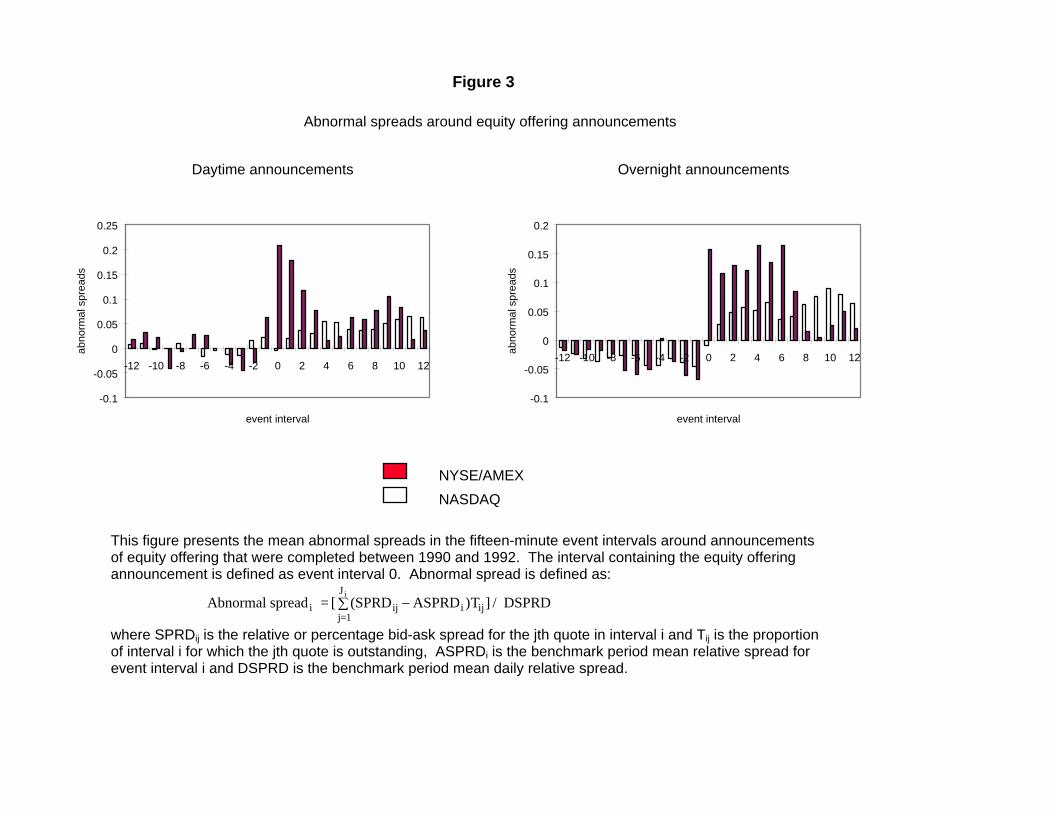
Figure 3
NYSE/AMEXNASDAQ
Overnight announcements Daytime announcements
-0.1
-0.05
0
0.05
0.1
0.15
0.2
0.25
-12 -10 -8 -6 -4 -2 0 2 4 6 8 10 12
event interval
abno
rmal
spr
eads
-0.1
-0.05
0
0.05
0.1
0.15
0.2
-12 -10 -8 -6 -4 -2 0 2 4 6 8 10 12
event interval
abno
rmal
spr
eads
This figure presents the mean abnormal spreads in the fifteen-minute event intervals around announcements of equity offering that were completed between 1990 and 1992. The interval containing the equity offering announcement is defined as event interval 0. Abnormal spread is defined as:
Abnormal spread = [ (SPRD ASPRD T ] / DSPRDi ij i ijj=1
Ji−∑ )
where SPRDij is the relative or percentage bid-ask spread for the jth quote in interval i and Tij is the proportion of interval i for which the jth quote is outstanding, ASPRDi is the benchmark period mean relative spread for event interval i and DSPRD is the benchmark period mean daily relative spread.
Abnormal spreads around equity offering announcements
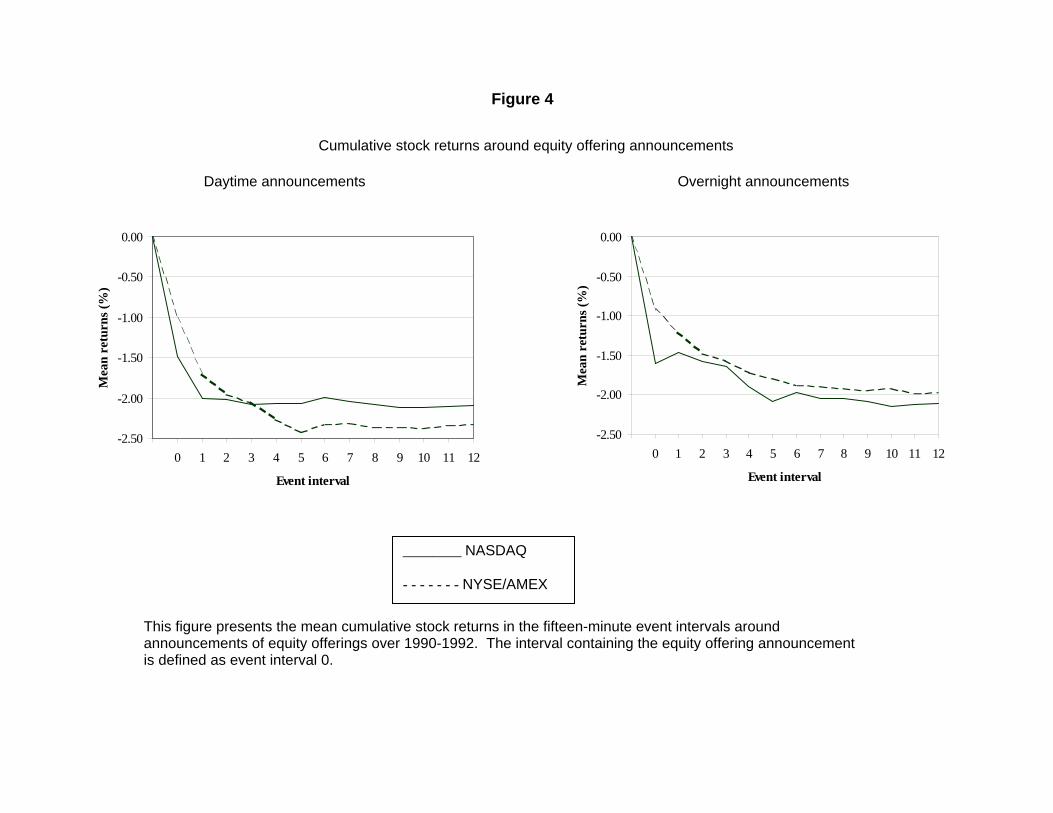
Figure 4
Overnight announcements Daytime announcements
This figure presents the mean cumulative stock returns in the fifteen-minute event intervals around announcements of equity offerings over 1990-1992. The interval containing the equity offering announcement is defined as event interval 0.
________ NASDAQ - - - - - - - NYSE/AMEX
-2.50
-2.00
-1.50
-1.00
-0.50
0.00
0 1 2 3 4 5 6 7 8 9 10 11 12
Event interval
Mea
n re
turn
s (%
)
-2.50
-2.00
-1.50
-1.00
-0.50
0.00
0 1 2 3 4 5 6 7 8 9 10 11 12
Event interval
Mea
n re
turn
s (%
)
Cumulative stock returns around equity offering announcements
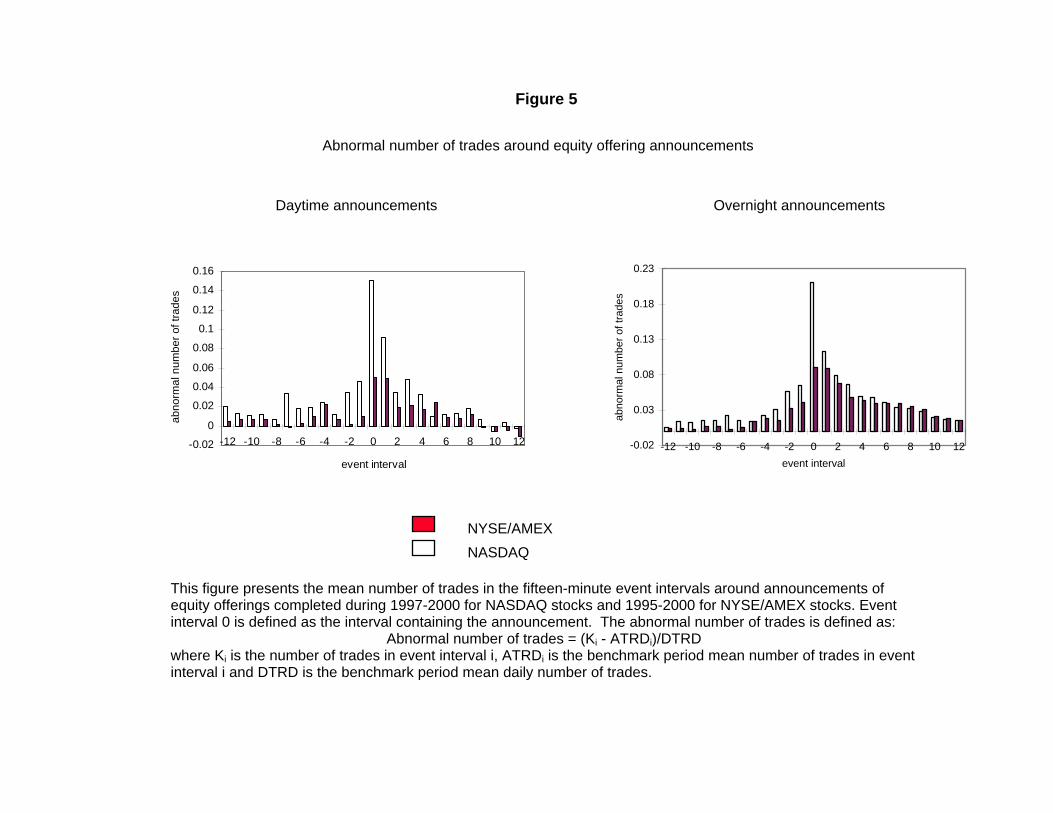
-0.02
0
0.02
0.04
0.06
0.08
0.1
0.12
0.14
0.16
-12 -10 -8 -6 -4 -2 0 2 4 6 8 10 12
event interval
abno
rmal
num
ber o
f tra
des
-0.02
0.03
0.08
0.13
0.18
0.23
-12 -10 -8 -6 -4 -2 0 2 4 6 8 10 12event interval
abno
rmal
num
ber o
f tra
des
Figure 5
Overnight announcements Daytime announcements
This figure presents the mean number of trades in the fifteen-minute event intervals around announcements of equity offerings completed during 1997-2000 for NASDAQ stocks and 1995-2000 for NYSE/AMEX stocks. Event interval 0 is defined as the interval containing the announcement. The abnormal number of trades is defined as:
Abnormal number of trades = (Ki - ATRDi)/DTRD where Ki is the number of trades in event interval i, ATRDi is the benchmark period mean number of trades in event interval i and DTRD is the benchmark period mean daily number of trades.
NYSE/AMEXNASDAQ
Abnormal number of trades around equity offering announcements
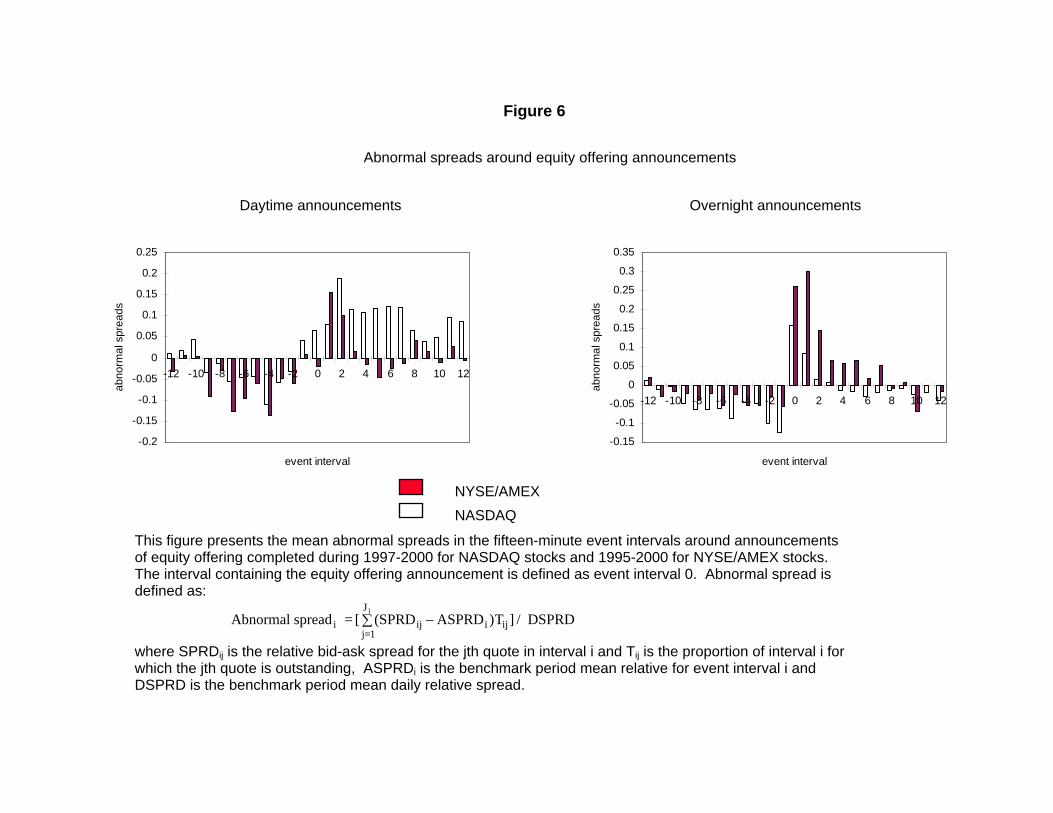
-0.2
-0.15
-0.1
-0.05
0
0.05
0.1
0.15
0.2
0.25
-12 -10 -8 -6 -4 -2 0 2 4 6 8 10 12
event interval
abno
rmal
spr
eads
-0.15
-0.1
-0.05
0
0.05
0.1
0.15
0.2
0.25
0.3
0.35
-12 -10 -8 -6 -4 -2 0 2 4 6 8 10 12
event interval
abno
rmal
spr
eads
Figure 6
Overnight announcements Daytime announcements
NYSE/AMEXNASDAQ
This figure presents the mean abnormal spreads in the fifteen-minute event intervals around announcements of equity offering completed during 1997-2000 for NASDAQ stocks and 1995-2000 for NYSE/AMEX stocks. The interval containing the equity offering announcement is defined as event interval 0. Abnormal spread is defined as:
Abnormal spread = [ (SPRD ASPRD T ] / DSPRDi ij i ijj=1
Ji−∑ )
where SPRDij is the relative bid-ask spread for the jth quote in interval i and Tij is the proportion of interval i for which the jth quote is outstanding, ASPRDi is the benchmark period mean relative for event interval i and DSPRD is the benchmark period mean daily relative spread.
Abnormal spreads around equity offering announcements