Embed Size (px)
Citation preview
RESEARCH ARTICLE
Does market segmentation necessarily
discourage energy efficiency?
Yanjun Yang1, Rui Xue2, Dong YangID1*
1 School of Economics and Business Administration, Chongqing University, Chongqing, China, 2 Macquarie
Business School, Macquarie University, Macquarie Park, Austrialia
Abstract
Prior research tends to propose and examine the negative relationship between market seg-
mentation and energy efficiency. Does market segmentation necessarily impair energy effi-
ciency? Considering the critical role that Chinaese government play in managing erergy
efficiency, we propose a non-linear relationship between market segmentation and energy
efficiency. Using data of 30 provinces in Mainland China during 2000 to 2017, we find an
inverse U-shaped relationship between market segmentation and energy efficiency. Our
findings remain robust after controlling endogeneity issues. Therefore, a moderate level of
market segmentation is acceptable and beneficial for long-term improvement of energy effi-
ciency in emerging economies.
Introduction
With the rapid economic growth, the aggregate energy consumption of China has increased
dramatically during last decades [1, 2]. In 2018, China remains the largest energy consumer
worldwide, accounting for 23.6% of the global energy consumption [3]. Therefore, China plays
an important role in mitigating world energy consumption [4]. Huge energy consumption
increases the risk of national energy security. To control energy consumption, Chinese govern-
ment added energy conservation into the long-term strategic planning. As listed in the 11th,
12th, and 13th five-year plans, China aims to reduce energy consumption per unit GDP by
20%, 17%, and 15%, respectively. However, it is hard to balance the tradeoff between energy
conservation and rapid economic growth [5, 6]. Under this circumstance, improving energy
efficiency is widely accpeted as an effective approach to achieve the balance [7, 8, 9].
As the largest transition economy of the world, China has adopted an export-oriented eco-
nomic development mode. In order to increase local GDP and tax revenue, local governments
use their administrative powers on important issues such as trade and credit to implement var-
ious forms of protection for local enterprises, especially large state-owned enterprises (SOEs).
Specific measures include setting up trade barriers for external enterprises, providing preferen-
tial policies and financial support to local enterprises, and preventing the outflow of local pro-
duction factors and inflow of products from other places, which impedes the formation of
market integration [10, 11]. As a result, energy efficiency demonstrates a dysfunctional pattern
PLOS ONE
PLOS ONE | https://doi.org/10.1371/journal.pone.0233061 May 21, 2020 1 / 19
a1111111111
a1111111111
a1111111111
a1111111111
a1111111111
OPEN ACCESS
Citation: Yang Y, Xue R, Yang D (2020) Does
market segmentation necessarily discourage
energy efficiency? PLoS ONE 15(5): e0233061.
https://doi.org/10.1371/journal.pone.0233061
Editor: Stefan Cristian Gherghina, The Bucharest
University of Economic Studies, ROMANIA
Received: January 23, 2020
Accepted: April 27, 2020
Published: May 21, 2020
Copyright: © 2020 Yang et al. This is an open
access article distributed under the terms of the
Creative Commons Attribution License, which
permits unrestricted use, distribution, and
reproduction in any medium, provided the original
author and source are credited.
Data Availability Statement: All relevant data are
within the manuscript and Supporting Information
files.
Funding: This research is funded by the
Humanities and Social Science Youth Foundation
of Ministry of Education of China, grant number
20YJC790160. The funders had no role in study
design, data collection and analysis, decision to
publish, or preparation of the manuscript.
Competing interests: NO authors have competing
interests.
[7]. Specifically, local governments ignore the limitations of its own resource endowments and
prioritise establishing high energy-consuming industries, which not only cause serious pro-
duction overcapacity and energy waste, but also generate serious environmental pollutions
[12]. Wei and Zhang [13] argue that market segmentation has a negative impact on the
improvement of energy efficiency, manifest in reducing scale effect, restricting competition
and technology diffusion. Nie and Zhang [14] provide empircial evidence that factor market
distortion, enterprises R&D investment, and industrial agglomeration are three mediation
mechanisms through which market segmentation inhibits energy efficiency. Although prior
studies have analysed driving factors of energy efficiency, a consideration for the positive role
that local governments play in energy efficiency improvement receives little attention and
awaits empirical testing.
The mechanism of how market segmentation restrains energy efficiency is based on the
premise that perfect market mechanism (price mechanism) guides resource flow. In a market
where the market mechanism works well, the price mechanism can ensure the producers who
value production factors most are most likely to obtain the factors, thereby maximizing the the
production efficiency; However, perfect price mechanism is not fully applicable in China’s
energy market because of the long-term undervaluation of energy price [15]. Therefore, local
government, as a supplement to the intangible hand of market, does not necessarily inhibit the
improvement of energy efficiency; instead, in some cases, it could improve the energy effi-
ciency. For example, in 2006, the central government increased the weight of energy conserva-
tion and emission reduction in the performance assessment system of local officials, and
prioritised promotion of officials with outstanding performance in energy conservation and
emission reduction work. As a result, local governments were highly incentivated to make con-
tributions to energy conservation and carbon emission reduction [16]. The local governments
assist local enterprises in upgrading production technology through financial support and pol-
icy preferences [17, 18], In 2010, Chinese local governments’ total financial subsidy to support
energy conservation and emission reduction reached CN¥29.7 billion (about US$4.39 billion
at 2010 exchange rate). Support for local entreprises is likely to not only improve local energy
efficiency, but also shape a healthy competition environment through mutual learning [19].
In addition, within the context of open-up economic development mode, foreign markets
have a substitute for domestic markets, local entreprises compete with foreign products and
services which requires higher standard for technology and operation of local firms. To guar-
antee local firms’ survival within the competitive environment, local governments tend to
lower credit requirements and support local enterprises to carry out technical transformation
and upgrading [20]. With advanced production technology and sound strategic management,
local firms are more likely to manufacture and operate in a more energy-friendly way.
Taken together, the impact of market segmentation on energy efficiency is unclear and
awaits empirical investigation. We propose an inverse U-shaped relationship between market
segmentation and energy efficiency. Specifically, the impact of market segmentation on energy
efficiency is positive when market segmentation level is relatively low; the positive impact
turns negative when market segmentation exceeds a certain level. Recent research provids
some evidence to support our proposition. Jin and Zhao [21] and Sun et al. [22] both find that
market segmentation has two-sided effects on factor productivity. On the one hand, market
segmentation restrains the improvement of factor productivity by reducing the scale effect of
resources, the effectiveness of resources allocation, and technology sharing [23]. On the other
hand, market segmentation improves the competitiveness of local enterprises by setting up
barriers to external firms, which improves local factor productivity [18]. Specifically, when the
level of market segmentation is low, market segmentation wields positive influences on factor
PLOS ONE Does market segmentation necessarily discourage energy efficiency?
PLOS ONE | https://doi.org/10.1371/journal.pone.0233061 May 21, 2020 2 / 19
productivity and improves overall factor productivity. However, when market segmentation
exceeds a certain level, further degree of market segmentation impairs factor productivity [19].
In this paper, we use panel data of 30 provinces from Mainland China during 2000 to 2017
to investigate the effects of market segmentation on energy efficiency. We further implement
the generalized method of moments (GMM) of dynamic panel and threshold regression model
to check the robustness of the baseline model. The results document an inverse U-shaped rela-
tionship between market segmentation and energy efficiency. The robustness checks provide
evidence that our results are robust and reliable. Compared to the negative relationship sug-
gested in existing researches, we provide a more nuanced and complete understanding of mar-
ket segmentation and energy efficiency. The findings are important for policy makers as
moderate market segmentation is indeed advantageous for improving energy efficiency. Either
too low or too high levels of market segmentation is detrimental for energy efficiency.
This paper makes contributions to exisiting literature in two main fronts. First, different from
existing studies [8, 9, 20], we take into account the role that local government plays in resource
allocation as a supplement to the market mechanism based on the premise of the characteristics
of China’s economic transition. We propose an inverted U-shaped relationship between market
segmentation and energy efficiency. Our analysis shows that in emerging market like China,
market segmentation is not expected as low as possible; in effect, moderate market segmentation
is conducive to the improvement of energy efficiency. Second, in contrast to previous studies
using data envelopment analysis (DEA) method or traditional stochastic frontier analysis (SFA)
method, this study applies the newly developed SFA approach to calculate energy efficiency. It
takes into account large differences and heterogeneities between provinces of China. Therefore,
it can not only capture the unobserved heterogeneity, but also reduce measurement errors of
energy efficiency by separating invalid elements from data error and statistical noise.
The rest of this paper is structured as follows. Section 2 reviews prior research and summa-
rises research gaps. Section 3 describes the data, variables, and introduces the econometric
model. The baseline results and robustness checkes are implemented in section 4. Section 5
concludes and proposes policy recommendations.
Literature review
Research on China’s energy efficiency includes two strands. One strand of the literature focuses
on the measures of energy efficiency. Patterson (1996) is the seminal research contributor in
energy efficiency measurement area which used energy intensity (the ratio of energy consump-
tion to GDP) to measure energy efficiency [24]. However, Nagata (1997) argues that energy
intensity is not a good measure of energy efficiency as it is largely affected by economic struc-
ture [25]. Hu and Wang (2006) propose the concept of total factor energy efficiency (TFEE)
within the framework of total factor productivity, and utilise data envelopment analysis (DEA)
method to measure the TFEE [26]. Specifically, TFEE is a ratio of target energy input to actual
energy input. Subsequent research builds on and expands DEA models, and develops various
DEA variants, taking into account differenct components of energy efficiency. These models
are all non-parametric method as no specific function form is specified. Compared to non-
parametirc models such as DEA and its variants, the stochastic frontier analysis (SFA) model is
a parametric model with specifications of efficiency function, which outperforms non-
parametric models in some cases but also increases measurement errors due to inappropriate
model specifications. Compared to traditional SFA, the recently developed parametric SFA
model, proposed by Kumbhakar et al. [27], improves measurement accuracy by specifing dif-
ferent errors which could capture information on individual heterogeneity, time-variant ineffi-
ciency, time-invarient inefficiency, and random shocks, respectively [28, 29].
PLOS ONE Does market segmentation necessarily discourage energy efficiency?
PLOS ONE | https://doi.org/10.1371/journal.pone.0233061 May 21, 2020 3 / 19
The second strand of existing research concentrates on identifing driving factors of energy
efficiency at national, regional or industrial level [7, 12, 30, 31, 32, 33, 34]. However, piror
researches emphasise the impact of economic factors on energy efficiency, and fail to take into
account the impact of market segmentation on energy efficiency [8, 9]. In China, market seg-
mentation has a strong impact on the economy because local governments dominate local eco-
nomic development mode, policies and regulations [8]. In China. political connections and
embeddedness play an important role in economic development and affect firms’ credit sup-
port and resource distribution [35]. To protect local firms, local governments control the pro-
duction of raw materials and set up barriors to purchase goods produced by other provinces,
which results in serious market segmentation [12, 13]. Market segmentation has been consid-
ered as the “stumbling block” for China’s long-term sustainable economic development [36].
This is because it affects the efficiency of resource utilisation through the following two ways.
Firstly, market segmentation reduces the scale effect of resource allocations [12]. In a segment
market, the allocation of resources determined by price mechanism only exists in small mar-
kets but not in large markets. As a result, effective energy consumers are not allocated with
enough resource supplies whereas inefficient consumers obtain surplus resources, resulting in
a decline in the effectiveness of overall resource use [37]. Moreover, local governments tend to
protect local enterprises through administrative intervention to prevent more competitive
external enterprises from entering the local market, which is clearly detrimental for the effi-
ciency of resource allocation [38]. The efficiency of resource is also negatively affected by the
limited spillover effects of inactive interregioanl cooperations [39, 40]. Secondly, market seg-
mentation reduces technology advancement. In the segment market, compared to foreign and
external entreprises, local enterprises, especially local state-owned entreprises, are more likely
to obtain funding at lower costs through potilical connections, and so they have less motiva-
tions to invest in technology research and development [41]. This significantly and negatively
affects technology development [42, 43]. Through the above two ways, energy utilisation is
thus likely to be affected by market segmentation because market segmentation has a negati-
veeffect on scale effect and technology diffusion [13] In addition, Nie and Zhang [14] find that
market segmentation has a significant and negative impact on energy efficiency, but such neg-
ative impact disappears in regions with low levels of market segmentation.
To sum up, from different perspectives, prior literatures tend to support a negative relation-
ship between market segmentation and energy efficiency [8, 9, 13, 14, 19, 35]. Moreover, vari-
ous DEA models and traditional SFA models are utilised in prior researches to measure
energy efficiency; however, these models are not likely to split individual heterogeneity, time-
varying, and time-invarient chareteristics, as well as random shocks.
In this paper, the newly developed SFA method is used to measure provincial energy effi-
ciency in China, which takes into account more information and improves measurement accu-
racy. More importantly, building on the two opposite views on the influences of market
segmentation on factor production [8, 9], we propose an inverse U-shaped relationship
between market segmentation and energy efficiency. Considering the critical role that China
local governments plays in managing energy consumption, we illustrate a more nuanced and
complete picture concerning the non-linear relationship between market segmentation and
energy efficiency.
Method
Data
This study collects sample data from 30 provinces in Mainland China from 2000 to 2017. Tibet
was not incluced due to data availability. Key variable and control variables are collected from
PLOS ONE Does market segmentation necessarily discourage energy efficiency?
PLOS ONE | https://doi.org/10.1371/journal.pone.0233061 May 21, 2020 4 / 19
China Energy Statistical Yearbook, China Statistical Yearbook, China Statistical Yearbook of
Environment, National Bureau of Statistics, and National Intellectual Property Administra-
tion. We replace missing data through interpolating with time-series mean value.
Variables
Measurement of energy efficiency. Mainstream methods utilised of measuring energy
efficiency include non-parametric and parametric models. Non-parametric methods, such as
DEA and its variants, have no explicit function form and are widely used in the case of small
sample size. Parameter methods, such as SFA and its varients, manifest in a consideration for
unobservable heterogeneity by setting a specific form of frontier function. In other words,
compared to non-parametric method, the main advantage of parametric method is to separate
invalid components from statistical noises caused by data error and missing information. This
is important as individual heterogeneity is the main part for panel data and the core of statisti-
cal analysis. Among SFA varients, the recently developed SFA model by Kumbhakar et al. [24]
spilts errors into four fronts, enabling the estimates to capture information on individual het-
erogeneity, time-variant inefficiency, time-invarient inefficiency, and random shocks, respec-
tively [25, 26]. Therefore, due to the specific national condition and economic transition mode
of China, we apply Kumbhakar et al.’s [24] SFA model to measure provincial energy efficiency.
Following Kumbhakar et al. [24] and Filippini and Hunt [25], we construct the following
model to measure energy efficiency:
eit ¼ a0 þ b0xit þ mi þ nit � Zi þ uit ð1Þ
where eit is the natural logarithm of aggregate energy consumption of province i at year t. xit is
a set of inputs and outputs covariates. Following Filippini and Hunt [25], we include the natu-
ral logarithm of real GDP, the natural logarithm of total population, the natural logarithm of
population density, the natural logarithm of constant energy price index, the share of added
value of industrial sector to GDP. All of these variables are price deflated by 2000 price level.
The error term is split into four components. Specifically, uit and ηi are time-varying and time-
invarient inefficiency; μi and vit are province fixed effect and noise, respectively. As mentioned
before, these four factors cannot be captured by other energy efficiency models at the same
time. Therefore, the use of Kumbhakar et al.’s [24] measure includes more information and
improves the measurement accuracy.
Estimation of the formula (1) is implemented using a single stage maximum likelihood
(ML) method basedon distributional assumptions on the four components [44]. To facilitate
the estimation, the model can be rewritten as follows:
eit ¼ a�
0þ b
0xit þ ai þ εit ð2Þ
Where a�0¼ a0 � EðZiÞ � EðmitÞ; αi = μi − ηi + E(ηi); εit = vit − uit + E(uit). With this specifica-
tion αi and εit have zero mean and constant variance, Specifically, there are three steps to esti-
mate the model.
Step 1: We apply panel data model to obtain estimate b0, and make predictions of αi and εit,
denoted as a i and ε it.
Step 2: Estimate the time-varying inefficiency uit.
εit ¼ nit � uit þ EðuitÞ ð3Þ
Where εit is the predicted value obtained in step 1, vit follows Nð0; s2nÞ, and uit follows
Nþð0; s2uÞ. We can estimate Eq (3) using standard SFA technique to get the prediction of
PLOS ONE Does market segmentation necessarily discourage energy efficiency?
PLOS ONE | https://doi.org/10.1371/journal.pone.0233061 May 21, 2020 5 / 19
the time-varying inefficiency uit. Using the predicted time-vary inefficiency, we calculated
the residual of the time-varying inefficiency (RTE), RTE ¼ expð� m itÞ.
Step 3: Estimate ηi using a similar process with step 2. We replace αi in the following equation
with a i obtained from step 1.
ai ¼ mi � Zi þ EðZiÞ ð4Þ
Similarly, μi and ηi follow Nð0; s2mÞ and Nð0; s2
ZÞ, respectively. Applying Jondrow et al.’s
[45] method to Eq (4), we can obtain the prediction of persistent time-invarient inefficiency
(PTE), which is PTE ¼ expð� Z iÞ. Lastly, energy efficiency (EE) is obtained by the product of
PTE and RTE, namely EE = PTE�RTE.
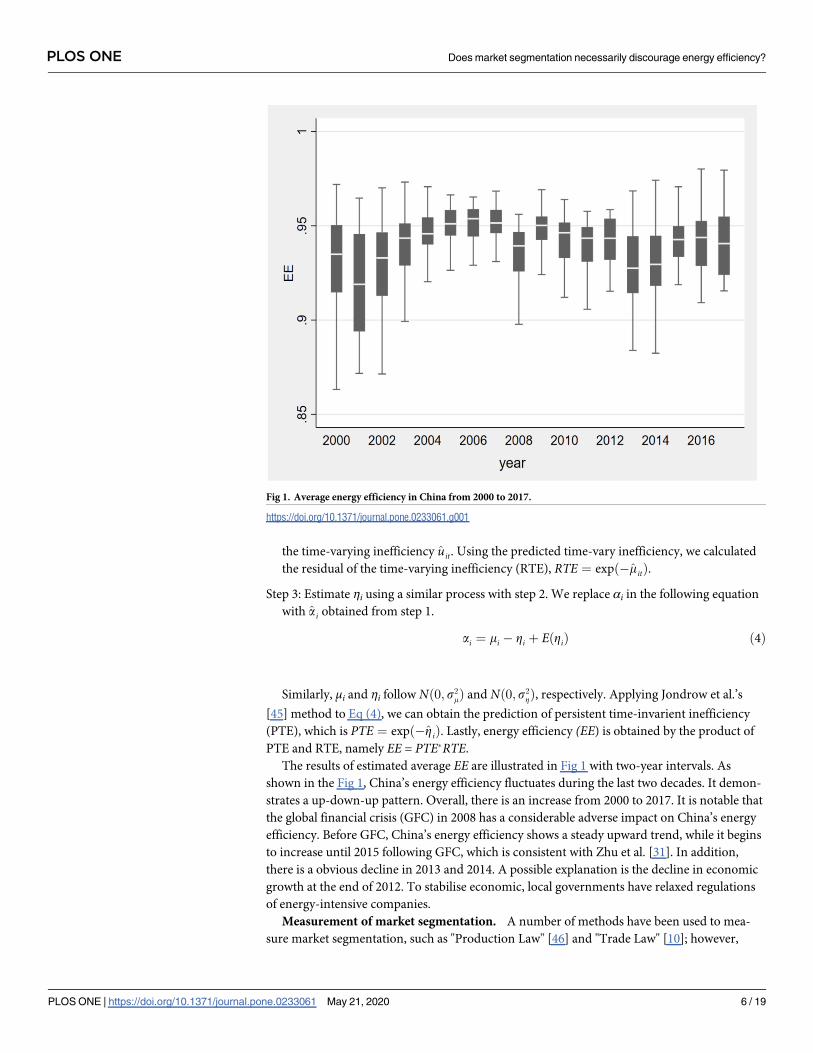
The results of estimated average EE are illustrated in Fig 1 with two-year intervals. As
shown in the Fig 1, China’s energy efficiency fluctuates during the last two decades. It demon-
strates a up-down-up pattern. Overall, there is an increase from 2000 to 2017. It is notable that
the global financial crisis (GFC) in 2008 has a considerable adverse impact on China’s energy
efficiency. Before GFC, China’s energy efficiency shows a steady upward trend, while it begins
to increase until 2015 following GFC, which is consistent with Zhu et al. [31]. In addition,
there is a obvious decline in 2013 and 2014. A possible explanation is the decline in economic
growth at the end of 2012. To stabilise economic, local governments have relaxed regulations
of energy-intensive companies.
Measurement of market segmentation. A number of methods have been used to mea-
sure market segmentation, such as "Production Law" [46] and "Trade Law" [10]; however,
Fig 1. Average energy efficiency in China from 2000 to 2017.
https://doi.org/10.1371/journal.pone.0233061.g001
PLOS ONE Does market segmentation necessarily discourage energy efficiency?
PLOS ONE | https://doi.org/10.1371/journal.pone.0233061 May 21, 2020 6 / 19
these methods have certain shortcomings on information loss that cannot measure market seg-
mentation well [16, 47]. Another strand of studies use commodity price to evaluate market
segmentation. It is build on Glacier Cost Model [48] and further developed by Parsley and
Wei [49]. They argue that the degree of market segmentation is increasing when the price dif-
ference between regions increases, and vice versa. Recent studies utilise this method to investi-
gate market segmentation in China, such as Li and Lin [8], and Wei and Zheng [9].
Following Li and Lin [8], we choose the retail price indices of food, beverages, clothing &
shoes, commodity, medical & healthcare supplies, books & magazines, fuels, and building
materials & hardware to construct the market segmentation (MS) index. The MS index can be
constructed as follows.
First, we define pkit as the price of product k in province i at year t, k 2 {k1, k2, � � �, k8}; so the
price difference between province i and j for a given product k at year t is:
DQkijt ¼ ln
pki;t
pkj;t
!
� lnpk
i;t� 1
pkj;t� 1
!
¼ lnpk
i;t
pki;t� 1
!
� lnpk
j;t
pkj;t� 1
!
ð5Þ
Next, as the DQkijt suffers from the measurement bias from heterogeneity of products, which
is irrelevant to market segmentation, we have to exclude the non-additive effect caused by the
heterogeneity in DQkijt. Following Parsley and Wei [47] and Qin et al. [35], we adopts the
demean method to control for cross-sectional dependencies and substracts the mean price dif-
fernce from the DQkijt . Hence, the relative price change is re-calculated as below:
qkijt ¼ jDQk
ijtj � jDQkt j ð6Þ
Lastly, we aggregate the relative price change of all eight products and calculate its variance
of 66 pairwise combinations of adjacent provincial units. Therefore, the MS index can be
obtained using following equations:
VarðqijtÞ ¼ Varðqk1ijt ; q
k2ijt ; q
k3ijt ;q
k4ijt ; q
k5ijt ; q
k6ijt ;q
k7ijt ; q
k8ijt Þ ð7Þ
segit ¼X
i6¼j
VarðqijtÞ=N ð8Þ
where Var(qijt) represents the price disperse which is the variance of aggregate price changes
between province i and j at year t; segit denotes the MS index of province i at year t, N is the
number of pairs of adjacent provinces. Compared to prior research including one or only a
few products, the MS index constructed in this paper contains more types of products, which
can reflect more information concerning the segmentation of the whole market. Additionally,
to avoid a large or small regression coefficient and make interpretations more straightforward,
we enlarge the value of MS by 100 times.
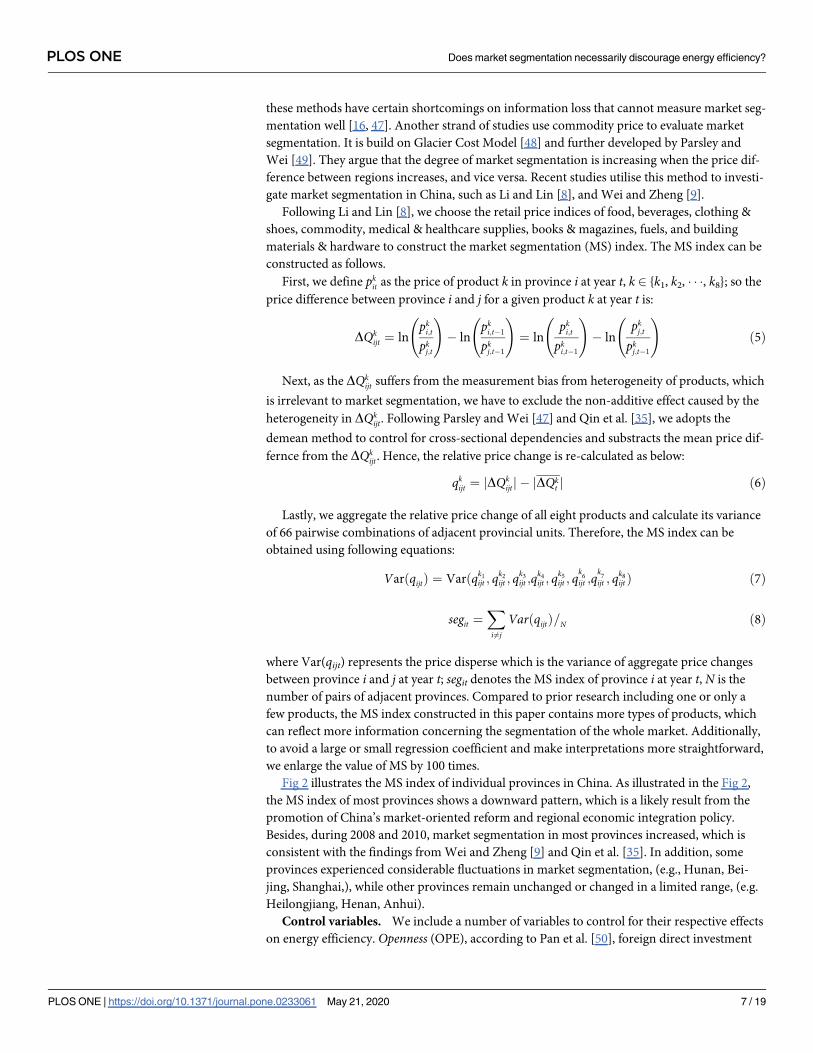
Fig 2 illustrates the MS index of individual provinces in China. As illustrated in the Fig 2,
the MS index of most provinces shows a downward pattern, which is a likely result from the
promotion of China’s market-oriented reform and regional economic integration policy.
Besides, during 2008 and 2010, market segmentation in most provinces increased, which is
consistent with the findings from Wei and Zheng [9] and Qin et al. [35]. In addition, some
provinces experienced considerable fluctuations in market segmentation, (e.g., Hunan, Bei-
jing, Shanghai,), while other provinces remain unchanged or changed in a limited range, (e.g.
Heilongjiang, Henan, Anhui).
Control variables. We include a number of variables to control for their respective effects
on energy efficiency. Openness (OPE), according to Pan et al. [50], foreign direct investment
PLOS ONE Does market segmentation necessarily discourage energy efficiency?
PLOS ONE | https://doi.org/10.1371/journal.pone.0233061 May 21, 2020 7 / 19
(FDI) has narrowed the gap between capital and foreign exchange, bring about advanced man-
agement approaches and technology, which has an important impact on the improvement of
China’s energy efficiency. We use the ratio of FDI to GDP to measure Openness. Energy price(PI), energy price is an important external factor influencing the energy efficiency in China
[7]. Higher energy price increases costs on firms’ operation budget, which further affects the
energy efficiency. We use the energy price index to reflect changes in energy prices. Govern-ment environmental regulation (GOV), in China, local governments have a direct and consid-
erable impact on the corporate production activities. Given the fact that environmental
regulations issued by local governments affect energy efficiency through industrial structure
and technological progress, we use the ratio of investment in pollution control to GDP to mea-
sure government environmental regulation consistent with Nie and Zhang [14]. Industry struc-ture (INDU), industry structure is a reflection of productivity, which determines the quality of
energy consumption. We use the share of added value of industrial sector to GDP to measure
industry structure. Economic development (ES), economic development is highly correlated
with energy efficiency. We use real GDP per capita to measure the economic development.
Technology advancement (TEC), technology plays a dominant role in improving energy effi-
ciency [34, 51]. We apply the number of patents granted to represent technology advancement.
Table 1 describes key and control variables and their measures.
Model specification
We examine the relationship between market segmentation and energy efficiency by estimat-
ing the following regression modelling method:
lnEEit ¼ g0 þ g1lnMSþ g2ðlnMSÞ2 þ g3Xitþlt þ mi þ εit ð9Þ
Fig 2. MS index of 30 individual provinces in China.
https://doi.org/10.1371/journal.pone.0233061.g002
PLOS ONE Does market segmentation necessarily discourage energy efficiency?
PLOS ONE | https://doi.org/10.1371/journal.pone.0233061 May 21, 2020 8 / 19
Where lnEEit stands for the natural logarithm of energy efficiency of province i at year t; lnMSrepresents the natural logarithm of market segmentation; X is the control variables matrix
described above, including Openness, Energy price, Government environmental regulation, Eco-nomic development, Industry structure, and Technology advancement. λt is the fixed effect used
to control the heterogeneity over time and μi is the fixed effect used to control the province
heterogeneity. εit is the random error term, γ0 − γ3 are the parameters to be estimated.
Results
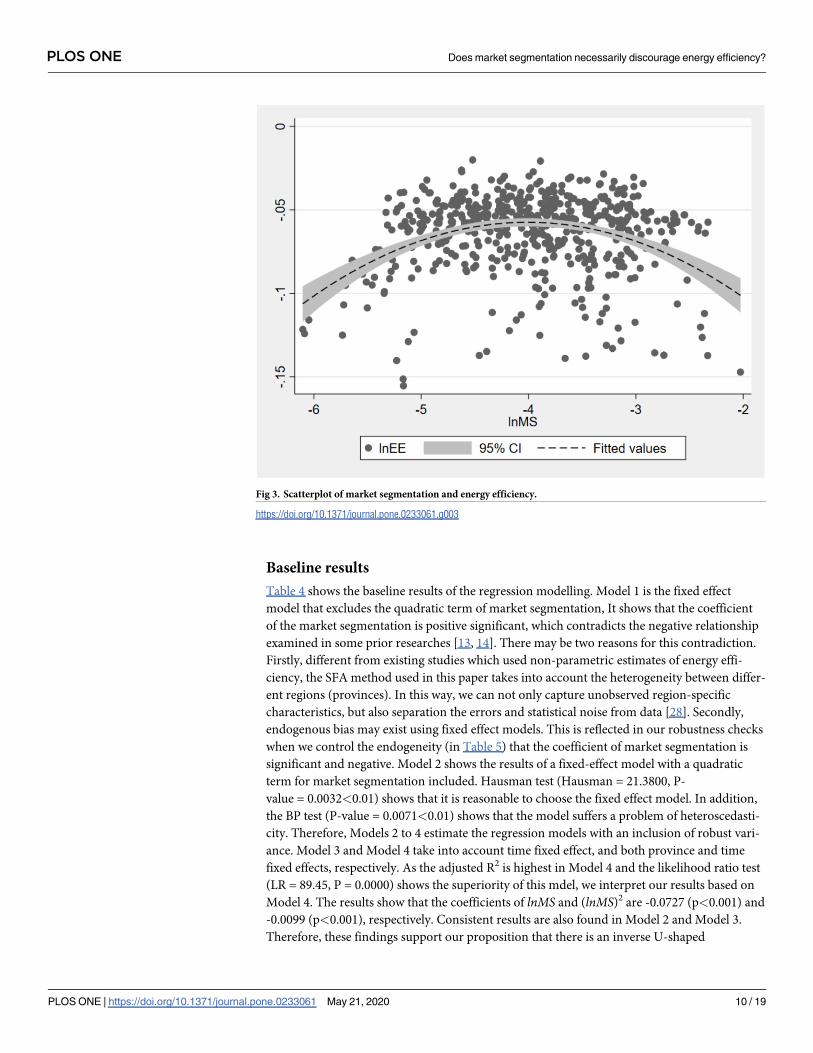
Scatterplot
Fig 3 illustrates the scatterplot of market segmentation and energy efficiency. It provides pre-
liminary information of the segmentation-efficiency nexus. As shown in Fig 3, there is an
inverse U-shaped relationship between market segmentation and energy efficiency. Whether
this non-linear relationship is statistically significant is examined by the regression modelling
and the robustness checks.
Panel unit root and cointegartion test
Since panel data is likely to fall into the pseudo-regression trap caused by serious time trends,
the unit root needs to be checked before implementing regression modelling. To make the
results more reliable, this study uses four methods to test the unit root, including LLC test, HT
test, ADF-fisher test, and IPS test. The results are shown in Table 2.
As can be seen from Table 2, the P-values of some horizontal variables in the four methods
are greater than the 10% significance level, suggesting the existance of a unit root. Therefore,
we continue to test the first-order difference of the variables. The results show that all the first-
order difference variables are stationary at the 1% level.
The unit root tests show that both the dependent variable and independent variable satisfy
the conditions of first-order cointegration. Therefore, we apply the panel cointegration test
proposed by Pedroni [52] to test the cointegration relationship. The results of the cointegra-
tion test are reported in Table 3. It is clear that all statistics are significant at the 1% significance
level, which reject the null hypothesis that there is no cointegration relationship. In other
words, all variables included in the regression modelling have a long-term cointegration rela-
tionship. Therefore, we can apply these variables directly to the regression modelling.
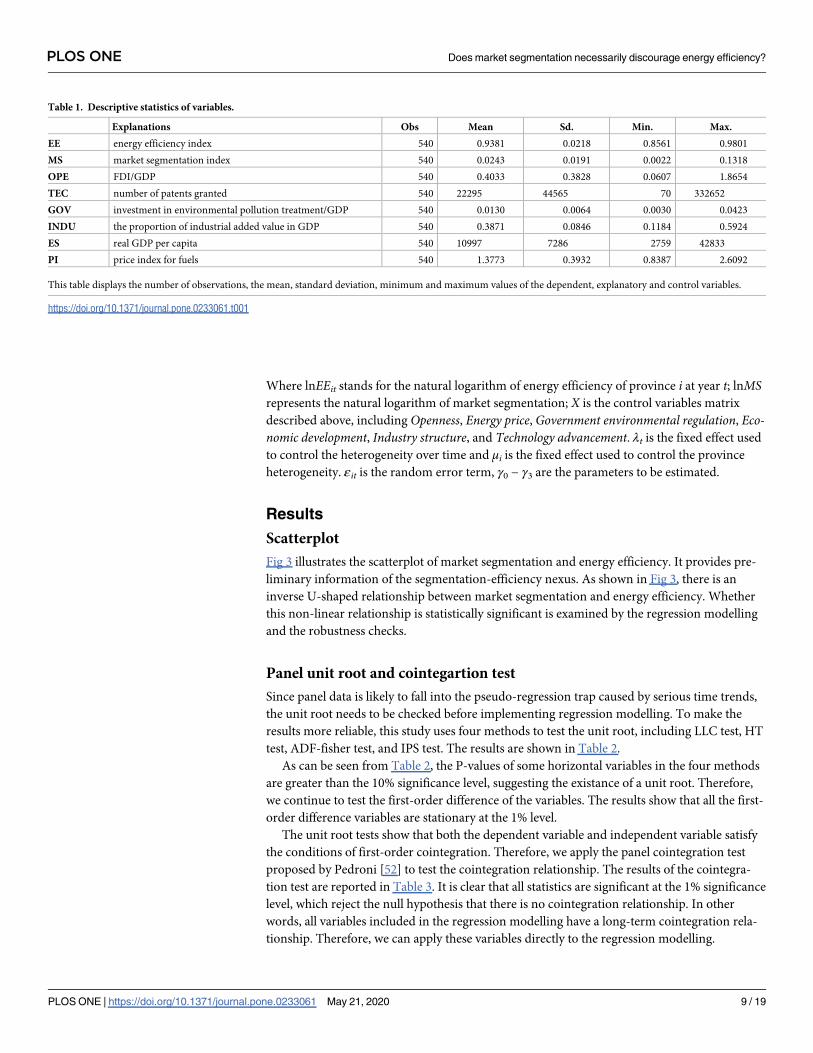
Table 1. Descriptive statistics of variables.
Explanations Obs Mean Sd. Min. Max.
EE energy efficiency index 540 0.9381 0.0218 0.8561 0.9801
MS market segmentation index 540 0.0243 0.0191 0.0022 0.1318
OPE FDI/GDP 540 0.4033 0.3828 0.0607 1.8654
TEC number of patents granted 540 22295 44565 70 332652
GOV investment in environmental pollution treatment/GDP 540 0.0130 0.0064 0.0030 0.0423
INDU the proportion of industrial added value in GDP 540 0.3871 0.0846 0.1184 0.5924
ES real GDP per capita 540 10997 7286 2759 42833
PI price index for fuels 540 1.3773 0.3932 0.8387 2.6092
This table displays the number of observations, the mean, standard deviation, minimum and maximum values of the dependent, explanatory and control variables.
https://doi.org/10.1371/journal.pone.0233061.t001
PLOS ONE Does market segmentation necessarily discourage energy efficiency?
PLOS ONE | https://doi.org/10.1371/journal.pone.0233061 May 21, 2020 9 / 19
Baseline results
Table 4 shows the baseline results of the regression modelling. Model 1 is the fixed effect
model that excludes the quadratic term of market segmentation, It shows that the coefficient
of the market segmentation is positive significant, which contradicts the negative relationship
examined in some prior researches [13, 14]. There may be two reasons for this contradiction.
Firstly, different from existing studies which used non-parametric estimates of energy effi-
ciency, the SFA method used in this paper takes into account the heterogeneity between differ-
ent regions (provinces). In this way, we can not only capture unobserved region-specific
characteristics, but also separation the errors and statistical noise from data [28]. Secondly,
endogenous bias may exist using fixed effect models. This is reflected in our robustness checks
when we control the endogeneity (in Table 5) that the coefficient of market segmentation is
significant and negative. Model 2 shows the results of a fixed-effect model with a quadratic
term for market segmentation included. Hausman test (Hausman = 21.3800, P-
value = 0.0032<0.01) shows that it is reasonable to choose the fixed effect model. In addition,
the BP test (P-value = 0.0071<0.01) shows that the model suffers a problem of heteroscedasti-
city. Therefore, Models 2 to 4 estimate the regression models with an inclusion of robust vari-
ance. Model 3 and Model 4 take into account time fixed effect, and both province and time
fixed effects, respectively. As the adjusted R2 is highest in Model 4 and the likelihood ratio test
(LR = 89.45, P = 0.0000) shows the superiority of this mdel, we interpret our results based on
Model 4. The results show that the coefficients of lnMS and (lnMS)2 are -0.0727 (p<0.001) and
-0.0099 (p<0.001), respectively. Consistent results are also found in Model 2 and Model 3.
Therefore, these findings support our proposition that there is an inverse U-shaped
Fig 3. Scatterplot of market segmentation and energy efficiency.
https://doi.org/10.1371/journal.pone.0233061.g003
PLOS ONE Does market segmentation necessarily discourage energy efficiency?
PLOS ONE | https://doi.org/10.1371/journal.pone.0233061 May 21, 2020 10 / 19
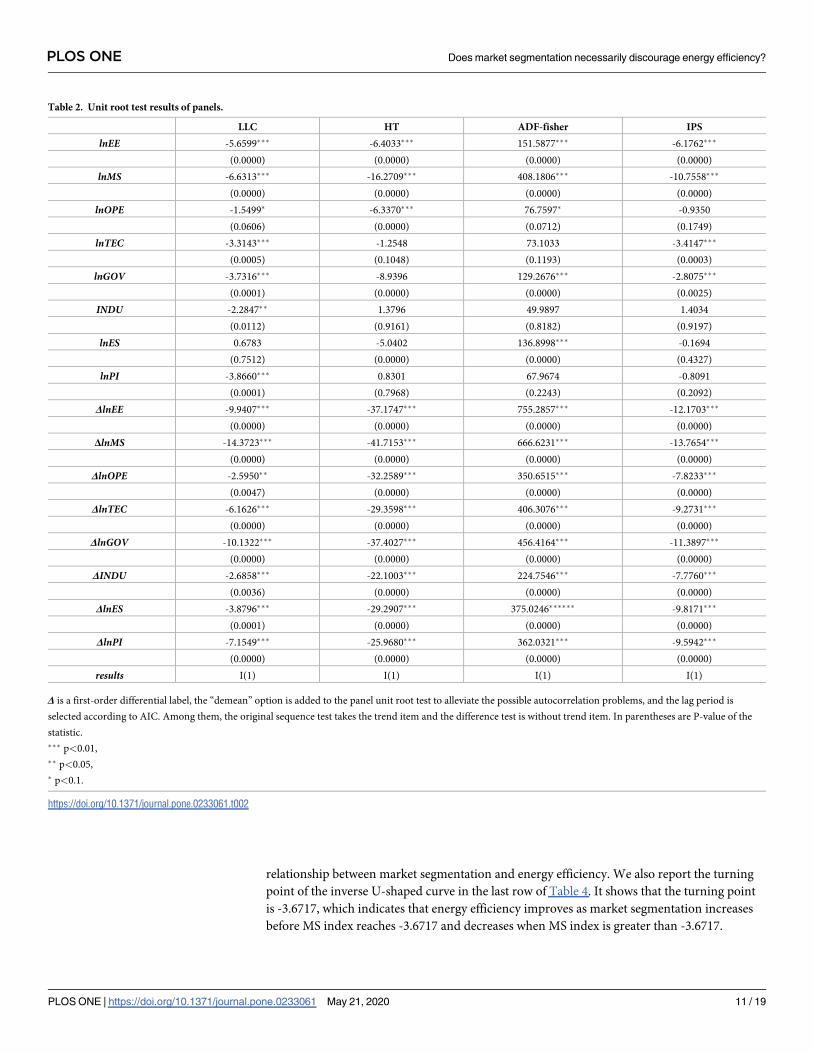
relationship between market segmentation and energy efficiency. We also report the turning
point of the inverse U-shaped curve in the last row of Table 4. It shows that the turning point
is -3.6717, which indicates that energy efficiency improves as market segmentation increases
before MS index reaches -3.6717 and decreases when MS index is greater than -3.6717.
Table 2. Unit root test results of panels.
LLC HT ADF-fisher IPS
lnEE -5.6599��� -6.4033��� 151.5877��� -6.1762���
(0.0000) (0.0000) (0.0000) (0.0000)
lnMS -6.6313��� -16.2709��� 408.1806��� -10.7558���
(0.0000) (0.0000) (0.0000) (0.0000)
lnOPE -1.5499� -6.3370��� 76.7597� -0.9350
(0.0606) (0.0000) (0.0712) (0.1749)
lnTEC -3.3143��� -1.2548 73.1033 -3.4147���
(0.0005) (0.1048) (0.1193) (0.0003)
lnGOV -3.7316��� -8.9396 129.2676��� -2.8075���
(0.0001) (0.0000) (0.0000) (0.0025)
INDU -2.2847�� 1.3796 49.9897 1.4034
(0.0112) (0.9161) (0.8182) (0.9197)
lnES 0.6783 -5.0402 136.8998��� -0.1694
(0.7512) (0.0000) (0.0000) (0.4327)
lnPI -3.8660��� 0.8301 67.9674 -0.8091
(0.0001) (0.7968) (0.2243) (0.2092)
ΔlnEE -9.9407��� -37.1747��� 755.2857��� -12.1703���
(0.0000) (0.0000) (0.0000) (0.0000)
ΔlnMS -14.3723��� -41.7153��� 666.6231��� -13.7654���
(0.0000) (0.0000) (0.0000) (0.0000)
ΔlnOPE -2.5950�� -32.2589��� 350.6515��� -7.8233���
(0.0047) (0.0000) (0.0000) (0.0000)
ΔlnTEC -6.1626��� -29.3598��� 406.3076��� -9.2731���
(0.0000) (0.0000) (0.0000) (0.0000)
ΔlnGOV -10.1322��� -37.4027��� 456.4164��� -11.3897���
(0.0000) (0.0000) (0.0000) (0.0000)
ΔINDU -2.6858��� -22.1003��� 224.7546��� -7.7760���
(0.0036) (0.0000) (0.0000) (0.0000)
ΔlnES -3.8796��� -29.2907��� 375.0246������ -9.8171���
(0.0001) (0.0000) (0.0000) (0.0000)
ΔlnPI -7.1549��� -25.9680��� 362.0321��� -9.5942���
(0.0000) (0.0000) (0.0000) (0.0000)
results I(1) I(1) I(1) I(1)
Δ is a first-order differential label, the “demean” option is added to the panel unit root test to alleviate the possible autocorrelation problems, and the lag period is
selected according to AIC. Among them, the original sequence test takes the trend item and the difference test is without trend item. In parentheses are P-value of the
statistic.
��� p<0.01,
�� p<0.05,
� p<0.1.
https://doi.org/10.1371/journal.pone.0233061.t002
PLOS ONE Does market segmentation necessarily discourage energy efficiency?
PLOS ONE | https://doi.org/10.1371/journal.pone.0233061 May 21, 2020 11 / 19
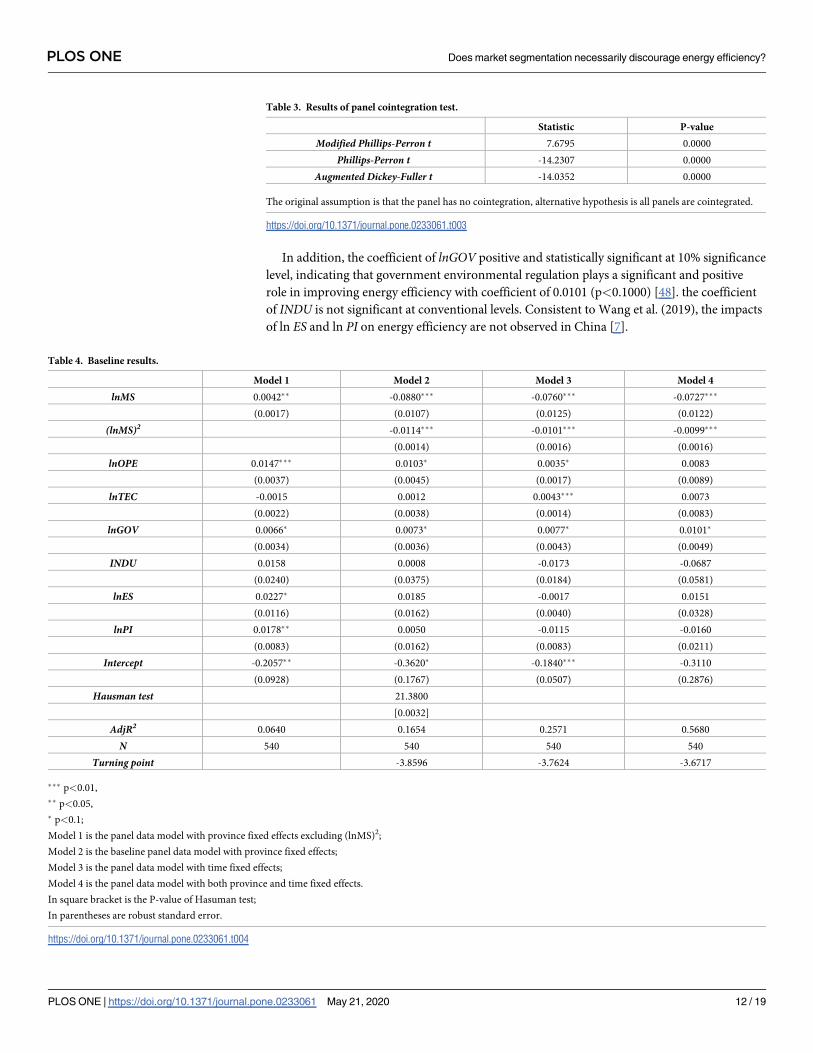
In addition, the coefficient of lnGOV positive and statistically significant at 10% significance
level, indicating that government environmental regulation plays a significant and positive
role in improving energy efficiency with coefficient of 0.0101 (p<0.1000) [48]. the coefficient
of INDU is not significant at conventional levels. Consistent to Wang et al. (2019), the impacts
of ln ES and ln PI on energy efficiency are not observed in China [7].
Table 3. Results of panel cointegration test.
Statistic P-value
Modified Phillips-Perron t 7.6795 0.0000
Phillips-Perron t -14.2307 0.0000
Augmented Dickey-Fuller t -14.0352 0.0000
The original assumption is that the panel has no cointegration, alternative hypothesis is all panels are cointegrated.
https://doi.org/10.1371/journal.pone.0233061.t003
Table 4. Baseline results.
Model 1 Model 2 Model 3 Model 4
lnMS 0.0042�� -0.0880��� -0.0760��� -0.0727���
(0.0017) (0.0107) (0.0125) (0.0122)
(lnMS)2 -0.0114��� -0.0101��� -0.0099���
(0.0014) (0.0016) (0.0016)
lnOPE 0.0147��� 0.0103� 0.0035� 0.0083
(0.0037) (0.0045) (0.0017) (0.0089)
lnTEC -0.0015 0.0012 0.0043��� 0.0073
(0.0022) (0.0038) (0.0014) (0.0083)
lnGOV 0.0066� 0.0073� 0.0077� 0.0101�
(0.0034) (0.0036) (0.0043) (0.0049)
INDU 0.0158 0.0008 -0.0173 -0.0687
(0.0240) (0.0375) (0.0184) (0.0581)
lnES 0.0227� 0.0185 -0.0017 0.0151
(0.0116) (0.0162) (0.0040) (0.0328)
lnPI 0.0178�� 0.0050 -0.0115 -0.0160
(0.0083) (0.0162) (0.0083) (0.0211)
Intercept -0.2057�� -0.3620� -0.1840��� -0.3110
(0.0928) (0.1767) (0.0507) (0.2876)
Hausman test 21.3800
[0.0032]
AdjR2 0.0640 0.1654 0.2571 0.5680
N 540 540 540 540
Turning point -3.8596 -3.7624 -3.6717
��� p<0.01,
�� p<0.05,
� p<0.1;
Model 1 is the panel data model with province fixed effects excluding (lnMS)2;
Model 2 is the baseline panel data model with province fixed effects;
Model 3 is the panel data model with time fixed effects;
Model 4 is the panel data model with both province and time fixed effects.
In square bracket is the P-value of Hasuman test;
In parentheses are robust standard error.
https://doi.org/10.1371/journal.pone.0233061.t004
PLOS ONE Does market segmentation necessarily discourage energy efficiency?
PLOS ONE | https://doi.org/10.1371/journal.pone.0233061 May 21, 2020 12 / 19
Robustness checks
Endogeneity issues. Our empirical analysis may suffer from endogeneity problems. This
may result from two factors. First, energy efficiency is likely to be affected by past factors as
improving energy efficiency is a dynamic process in the long run. A lack of consideration for
past factors may lead to estimation bias. Second, energy efficiency could have a feedback effect
on market segmentation because provinces with low energy efficiency are likely to receive
lower returns and so they are more likely to protect local firms and set financial and political
barriers for external firms, which in turn results in heavier market segmentation. Therefore, to
mitigate endogeneity problems, we implemented dynamic panel Generalised Method of
Moments (GMM) [53]. Both difference GMM (Diff-GMM) and system GMM (Sys-GMM)
are utilised for robustness checks.
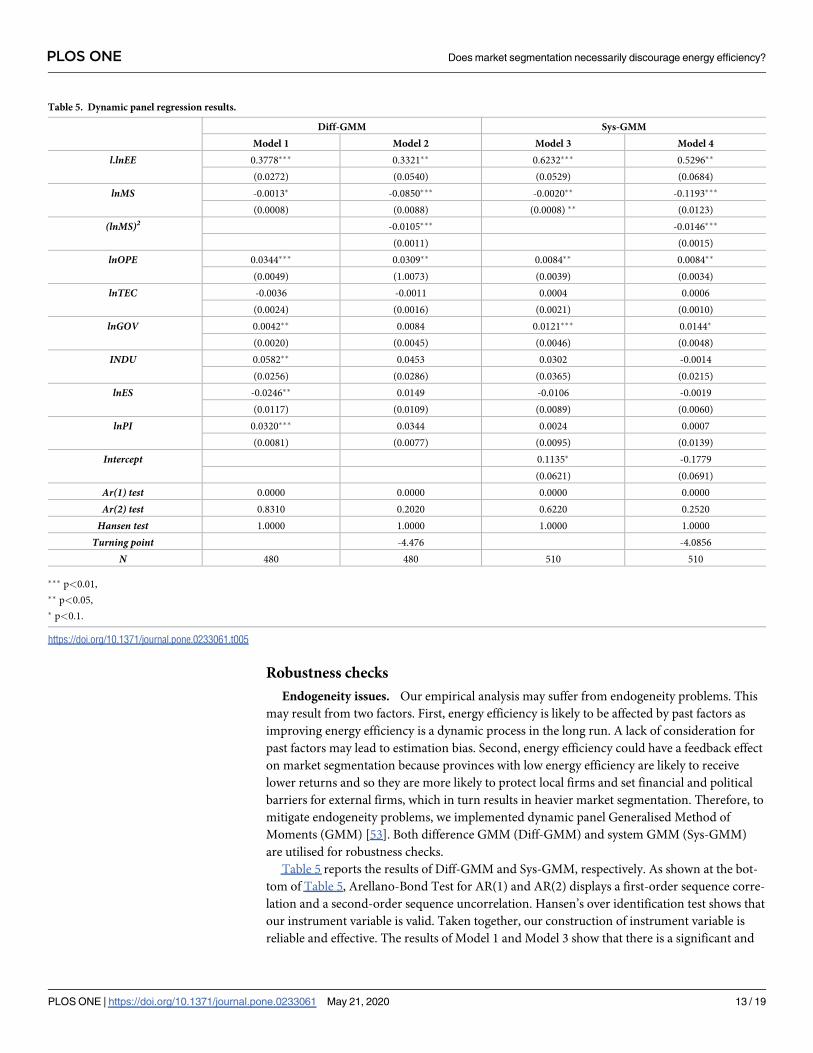
Table 5 reports the results of Diff-GMM and Sys-GMM, respectively. As shown at the bot-
tom of Table 5, Arellano-Bond Test for AR(1) and AR(2) displays a first-order sequence corre-
lation and a second-order sequence uncorrelation. Hansen’s over identification test shows that
our instrument variable is valid. Taken together, our construction of instrument variable is
reliable and effective. The results of Model 1 and Model 3 show that there is a significant and
Table 5. Dynamic panel regression results.
Diff-GMM Sys-GMM
Model 1 Model 2 Model 3 Model 4
l.lnEE 0.3778��� 0.3321�� 0.6232��� 0.5296��
(0.0272) (0.0540) (0.0529) (0.0684)
lnMS -0.0013� -0.0850��� -0.0020�� -0.1193���
(0.0008) (0.0088) (0.0008) �� (0.0123)
(lnMS)2 -0.0105��� -0.0146���
(0.0011) (0.0015)
lnOPE 0.0344��� 0.0309�� 0.0084�� 0.0084��
(0.0049) (1.0073) (0.0039) (0.0034)
lnTEC -0.0036 -0.0011 0.0004 0.0006
(0.0024) (0.0016) (0.0021) (0.0010)
lnGOV 0.0042�� 0.0084 0.0121��� 0.0144�
(0.0020) (0.0045) (0.0046) (0.0048)
INDU 0.0582�� 0.0453 0.0302 -0.0014
(0.0256) (0.0286) (0.0365) (0.0215)
lnES -0.0246�� 0.0149 -0.0106 -0.0019
(0.0117) (0.0109) (0.0089) (0.0060)
lnPI 0.0320��� 0.0344 0.0024 0.0007
(0.0081) (0.0077) (0.0095) (0.0139)
Intercept 0.1135� -0.1779
(0.0621) (0.0691)
Ar(1) test 0.0000 0.0000 0.0000 0.0000
Ar(2) test 0.8310 0.2020 0.6220 0.2520
Hansen test 1.0000 1.0000 1.0000 1.0000
Turning point -4.476 -4.0856
N 480 480 510 510
��� p<0.01,
�� p<0.05,
� p<0.1.
https://doi.org/10.1371/journal.pone.0233061.t005
PLOS ONE Does market segmentation necessarily discourage energy efficiency?
PLOS ONE | https://doi.org/10.1371/journal.pone.0233061 May 21, 2020 13 / 19
negative relationship between market segmentation and energy efficiency, which is consistent
with the conclusions from existing studies [13, 14]. In Model 2 and Model 4, the coefficients of
l.lnEE are positive and statistically significant, suggesting that energy efficiency is not only
affected by present factors, but also positively related to past energy efficiency. More impor-
tantly, these results document the inverse U-shaped relationship between market segmentation
and energy efficiency, with coefficient of lnMS and (lnMS)2 being negative and significant at
conventional levels. Therefore, our main findings are valid and robust.
Threshold regression. To confirm the non-linear relationship between market segmenta-
tion and energy efficiency, we estimated the following threshold regression modelling:
lnEE ¼ d0 þ d1lnMSitIðlnMSit < φÞ þ d2lnMSitIðlnMSit > φÞ þ yXit þ mi þ εit ð10Þ
where lnMS is the threshold variable and φ is the threshold value; I(�) is an indicator function,
the value of I(�) equals 1 when its argument is true, otherwise, equals 0; so δ1 and δ2 reflect
marginal effect.
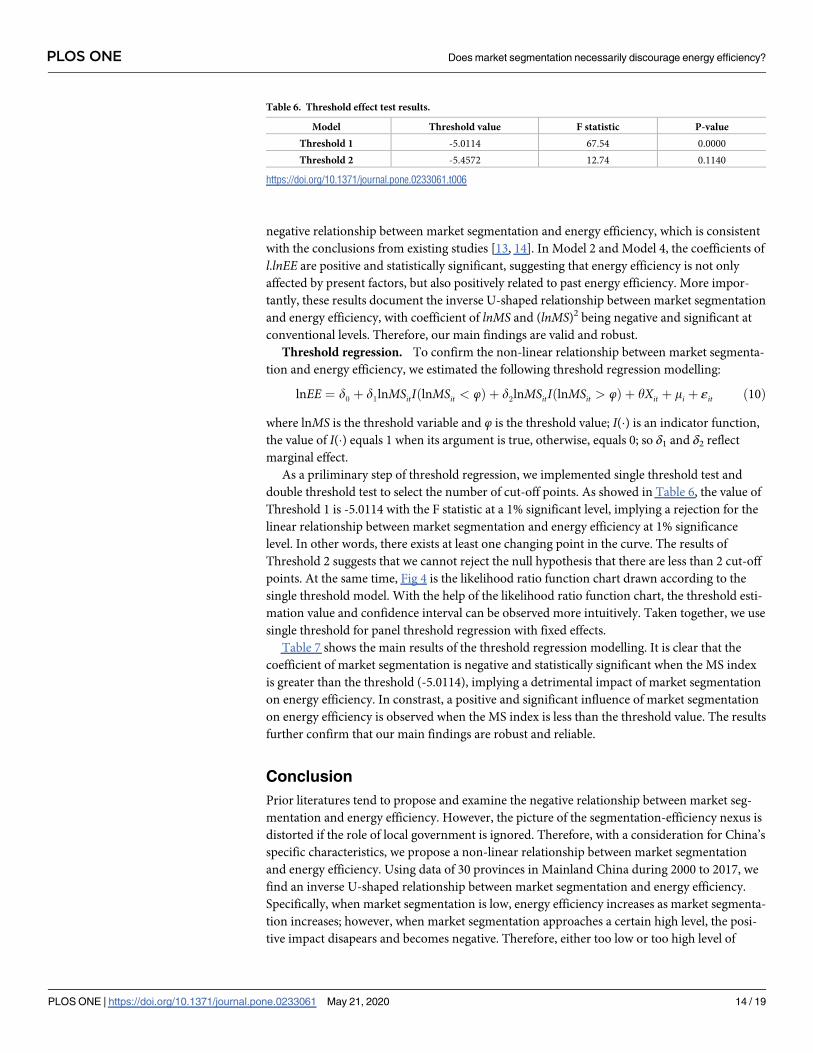
As a priliminary step of threshold regression, we implemented single threshold test and
double threshold test to select the number of cut-off points. As showed in Table 6, the value of
Threshold 1 is -5.0114 with the F statistic at a 1% significant level, implying a rejection for the
linear relationship between market segmentation and energy efficiency at 1% significance
level. In other words, there exists at least one changing point in the curve. The results of
Threshold 2 suggests that we cannot reject the null hypothesis that there are less than 2 cut-off
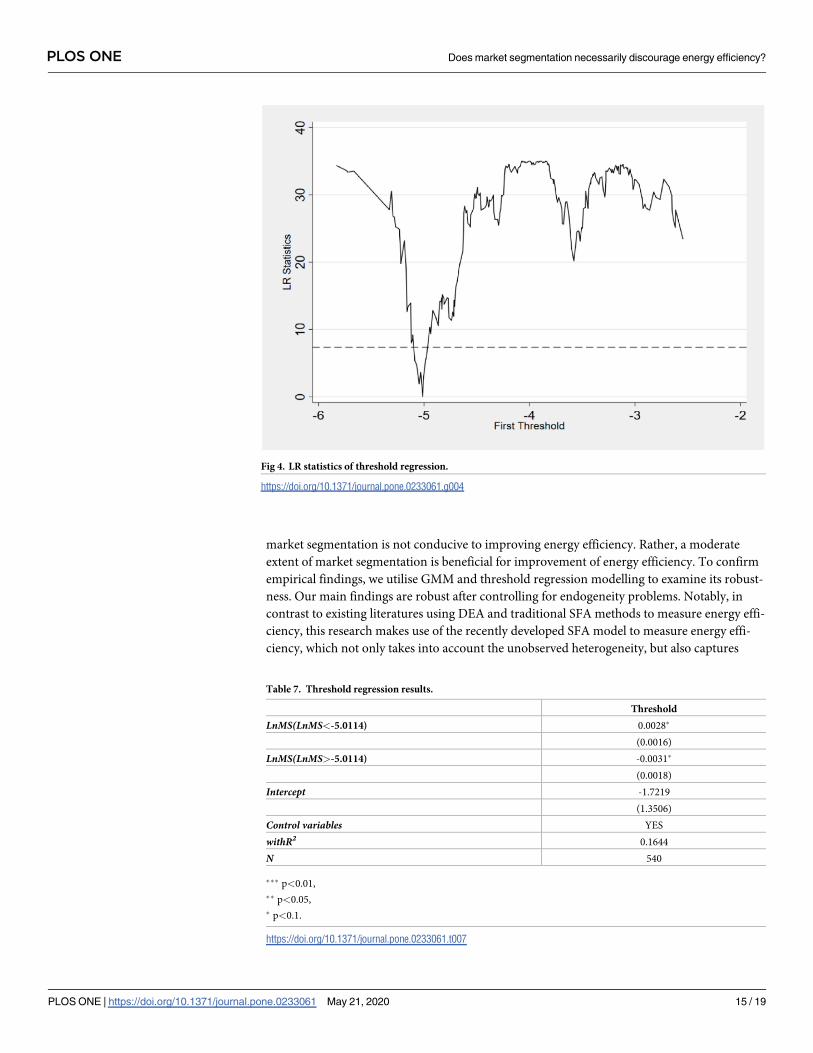
points. At the same time, Fig 4 is the likelihood ratio function chart drawn according to the
single threshold model. With the help of the likelihood ratio function chart, the threshold esti-
mation value and confidence interval can be observed more intuitively. Taken together, we use
single threshold for panel threshold regression with fixed effects.
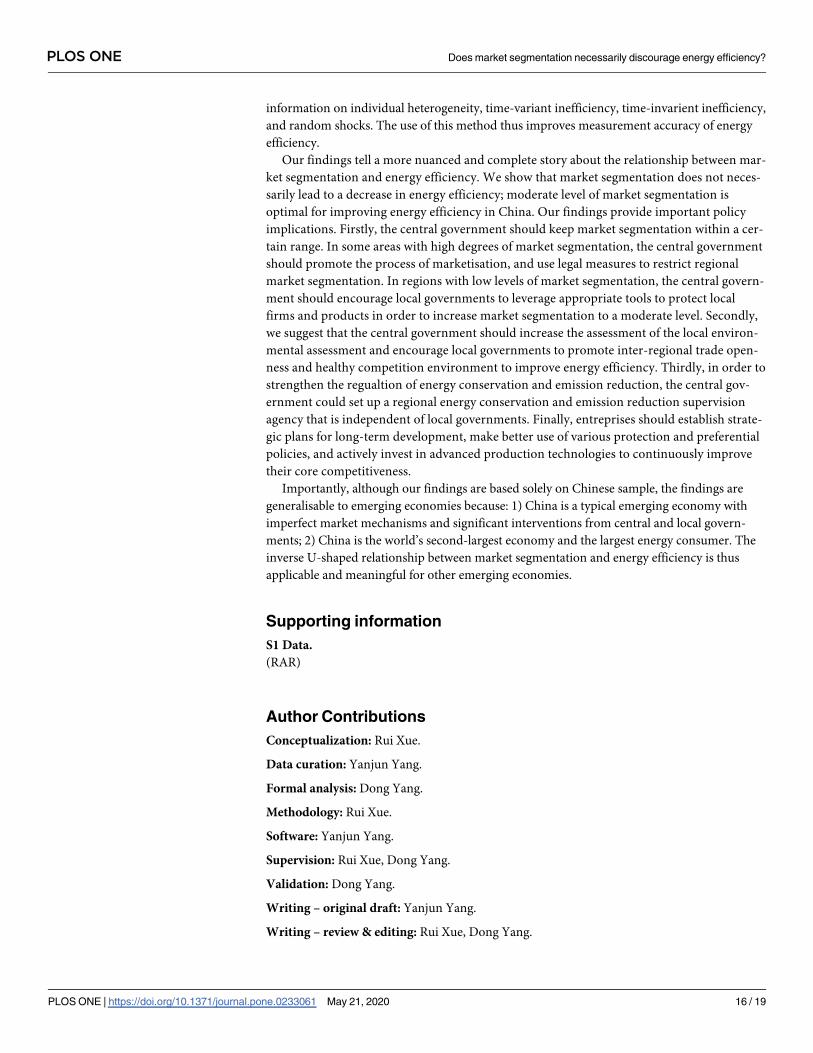
Table 7 shows the main results of the threshold regression modelling. It is clear that the
coefficient of market segmentation is negative and statistically significant when the MS index
is greater than the threshold (-5.0114), implying a detrimental impact of market segmentation
on energy efficiency. In constrast, a positive and significant influence of market segmentation
on energy efficiency is observed when the MS index is less than the threshold value. The results
further confirm that our main findings are robust and reliable.
Conclusion
Prior literatures tend to propose and examine the negative relationship between market seg-
mentation and energy efficiency. However, the picture of the segmentation-efficiency nexus is
distorted if the role of local government is ignored. Therefore, with a consideration for China’s
specific characteristics, we propose a non-linear relationship between market segmentation
and energy efficiency. Using data of 30 provinces in Mainland China during 2000 to 2017, we
find an inverse U-shaped relationship between market segmentation and energy efficiency.
Specifically, when market segmentation is low, energy efficiency increases as market segmenta-
tion increases; however, when market segmentation approaches a certain high level, the posi-
tive impact disapears and becomes negative. Therefore, either too low or too high level of
Table 6. Threshold effect test results.
Model Threshold value F statistic P-value
Threshold 1 -5.0114 67.54 0.0000
Threshold 2 -5.4572 12.74 0.1140
https://doi.org/10.1371/journal.pone.0233061.t006
PLOS ONE Does market segmentation necessarily discourage energy efficiency?
PLOS ONE | https://doi.org/10.1371/journal.pone.0233061 May 21, 2020 14 / 19
market segmentation is not conducive to improving energy efficiency. Rather, a moderate
extent of market segmentation is beneficial for improvement of energy efficiency. To confirm
empirical findings, we utilise GMM and threshold regression modelling to examine its robust-
ness. Our main findings are robust after controlling for endogeneity problems. Notably, in
contrast to existing literatures using DEA and traditional SFA methods to measure energy effi-
ciency, this research makes use of the recently developed SFA model to measure energy effi-
ciency, which not only takes into account the unobserved heterogeneity, but also captures
Table 7. Threshold regression results.
Threshold
LnMS(LnMS<-5.0114) 0.0028�
(0.0016)
LnMS(LnMS>-5.0114) -0.0031�
(0.0018)
Intercept -1.7219
(1.3506)
Control variables YES
withR2 0.1644
N 540
��� p<0.01,
�� p<0.05,
� p<0.1.
https://doi.org/10.1371/journal.pone.0233061.t007
Fig 4. LR statistics of threshold regression.
https://doi.org/10.1371/journal.pone.0233061.g004
PLOS ONE Does market segmentation necessarily discourage energy efficiency?
PLOS ONE | https://doi.org/10.1371/journal.pone.0233061 May 21, 2020 15 / 19
information on individual heterogeneity, time-variant inefficiency, time-invarient inefficiency,
and random shocks. The use of this method thus improves measurement accuracy of energy
efficiency.
Our findings tell a more nuanced and complete story about the relationship between mar-
ket segmentation and energy efficiency. We show that market segmentation does not neces-
sarily lead to a decrease in energy efficiency; moderate level of market segmentation is
optimal for improving energy efficiency in China. Our findings provide important policy
implications. Firstly, the central government should keep market segmentation within a cer-
tain range. In some areas with high degrees of market segmentation, the central government
should promote the process of marketisation, and use legal measures to restrict regional
market segmentation. In regions with low levels of market segmentation, the central govern-
ment should encourage local governments to leverage appropriate tools to protect local
firms and products in order to increase market segmentation to a moderate level. Secondly,
we suggest that the central government should increase the assessment of the local environ-
mental assessment and encourage local governments to promote inter-regional trade open-
ness and healthy competition environment to improve energy efficiency. Thirdly, in order to
strengthen the regualtion of energy conservation and emission reduction, the central gov-
ernment could set up a regional energy conservation and emission reduction supervision
agency that is independent of local governments. Finally, entreprises should establish strate-
gic plans for long-term development, make better use of various protection and preferential
policies, and actively invest in advanced production technologies to continuously improve
their core competitiveness.
Importantly, although our findings are based solely on Chinese sample, the findings are
generalisable to emerging economies because: 1) China is a typical emerging economy with
imperfect market mechanisms and significant interventions from central and local govern-
ments; 2) China is the world’s second-largest economy and the largest energy consumer. The
inverse U-shaped relationship between market segmentation and energy efficiency is thus
applicable and meaningful for other emerging economies.
Supporting information
S1 Data.
(RAR)
Author Contributions
Conceptualization: Rui Xue.
Data curation: Yanjun Yang.
Formal analysis: Dong Yang.
Methodology: Rui Xue.
Software: Yanjun Yang.
Supervision: Rui Xue, Dong Yang.
Validation: Dong Yang.
Writing – original draft: Yanjun Yang.
Writing – review & editing: Rui Xue, Dong Yang.
PLOS ONE Does market segmentation necessarily discourage energy efficiency?
PLOS ONE | https://doi.org/10.1371/journal.pone.0233061 May 21, 2020 16 / 19
References1. Tian YS, Xiong SQ, Ma XM, Ji JP. Structural path decomposition of carbonemission: A study of China’s
manufacturing industry. J. Clean. Prod. 2018; 193: 563–574.
2. Lin BQ, Chen Y. Will economic infrastructure development affect the energyintensity of China’s
manufacturing industry? Energy Policy. 2019; 132: 122–131.
3. British Petroleum. BP Statistical Review of World Energy. London. 2019. http://cngascn.com/public/
uploads/file/20190805/20190805102652_80658.pdf
4. Wang C, Wu K, Zhang X, Wang F, Zhang HO, Ye YY et al. Features and drivers for energy-related car-
bon emissions in mega city: The case of Guangzhou, China based on an extended LMDI model. PloS
one. 2019; 14(2):1–22.
5. Ghoshray A, Mendoza Y, Monfort M, Ordoñez J. Re-assessing causality between energy consumption
and economic growth. PloS one. 2018; 13(11):1–15.
6. Sun DX, Zeng SX, Lin H, Meng XH, Yu B. Can transportation infrastructure pave a green way? A city-
level examination in China. J. Clean. Prod. 2019; 226: 669–678.
7. Cai W, Lai KH, Liu CH, Wei FF, Ma MD, Jia S., et al. Promoting sustainability of manufacturing industry
through the lean energy-saving and emission-reduction strategy. Sci. Total Environ. 2019; 665: 23–32.
https://doi.org/10.1016/j.scitotenv.2019.02.069 PMID: 30772553
8. Shao S, Zhang K, Dou JM. Effects of economic agglomeration on energysaving and emission reduction:
Theory and empirical evidence from China. Manag World. 2019; 35 (02): 24–42+198.
9. Wang ZH, Sun YF, Yuan ZY, Wang B. Does energy efficiency have a spatial spill-over effect in China?
Evidence from provincial-level data. J. Cleaner Prod. 2019; 241: 118258.
10. Poncet S. A fragmented China: Measure and determinants of Chinese domestic market disintegration.
Review of international Economics. 2005; 13(3): 409–430.
11. Li JL, Lin BQ. Does energy and CO2 emissions performance of china benefit from regional integration?
Energy Policy. 2016; 101: 366–378. https://doi.org/10.1016/j.enpol.2016.10.036 PMID: 32287865
12. Lin BQ, Du KR. The Energy effect of factor market distortion in China. Econ. Res. J. 2013; 48 (9): 125–
136.
13. Wei C, Zheng XY. A new perspective on energy efficiency Enhancement: A test based on market seg-
mentation. Social Sciences in China. 2017; 10: 90–111+206.
14. Nie L, Zhang Z. Neighbors as competitors or" neighbors as partners": How does market segmentation
affect regional energy efficiency in China?. Working Paper. 2019; No. 027. https://www.feem.it/m/
publications_pages/ndl2019-0271.pdf.
15. Shi D. Characteristics, difficulties and key points of current energy price reform. Price: Theory and Prac-
tice. 2013; 01:18–20.
16. Jiang QS, Yang SW, Tang PC, Bao L. Promoting the polluters? The Competing objectives of energy
efficiency, pollutant emissions, and economic performance in Chinese municipalities. Energy Research
and Social Science. 2020; 61: 101365.
17. Ma L, Liang JQ. The effects of firm ownership and affiliation on government’s target setting on energy
conservation in China. J.Cleaner.prod. 2018; 199: 459–465.
18. Zhao XL, Fan Y, Fang M, Hua ZH. Do environmental regulations undermineenergy firm performance?
An empirical analysis from China’s stock market. Energy Res. Soc. Sci. 2018; 40: 220–231.
19. Zhao XF, Li HM, Wu L, Qi Y. Implementation of energy-saving policies in China: How local governments
assisted industrial enterprises in achieving energy-saving targets. Energy Policy. 2014; 66(Complete):
170–184.
20. Li XP, Zhu ZD. International trade, R&D spillover and productivity development: Based on the analysis
of Chinese industry’ s panel data. Econ. Res. J. 2006; 02: 31–43.
21. Jin XR, Zhao XJ. Administrative power division, market segmengtation and economic efficiency-An
empirical study based on separate-planning cities of China. Economic Theory and Business Manage-
ment. 2017; 03: 14–25.
22. Sun BW, Chen L, Li HM. Assessment of green growth efficiency losses from market segmentation:
Nonlinear mechanism rerification. China Population, Resources and Environmen. 2018; 07: 148–158.
23. Zhang DG, Lu YQ. Impact of market segmentation on energy efficiency. China Population, Resour Pat-
terson MG. What is energy efficiency? Concepts, indicators and methodological issues. Energy Policy.
1996; 24: 377–390.ces and Environmen. 2017; 01: 65–72.
24. Patterson MG. What is energy efficiency? Concepts, indicators and methodological issues. Energy Pol-
icy. 1996; 24: 377–390.
PLOS ONE Does market segmentation necessarily discourage energy efficiency?
PLOS ONE | https://doi.org/10.1371/journal.pone.0233061 May 21, 2020 17 / 19
25. Nagata Y. The US/Japan comparison of energy intensity. Estimating the real gap. Energy policy. 1997;
25(7–9): 683–691.
26. Hu JL, Wang SC. Total-factor energy efficiency of regions in China. Energy Policy. 2006; 34: 3206–
3217.
27. Kumbhakar SC, Lien G, Hardaker JB. Technical efficiency in competing panel data models: A study of
Norwegian grain farming. Journal of Productivity Analysis. 2014; 41(2): 321–337.
28. Filippini M, Hunt LC. Measurement of energy efficiency based on economic foundations. Energy Eco-
nomics. 2015; 52: S5–S16.
29. Zhang SH, Jiang WJ. Energy efficiency measures: comparative analysis. J. Quant. Tech. Econ. 2016;
07: 3–24.
30. Sinton JE, Fridley DG. What goes up: Recent trends in China’s energy consumption. Energy policy.
2000; 28(10): 671–687.
31. Zhao HL, Lin BQ. Will agglomeration improve the energy efficiency in China’s textile industry: Evidence
and policy implications. Applied Energy. 2019; 237: 326–337.
32. Feng C, Wang M. Analysis of energy efficiency in China’s transportation sector. Renew Sustain Energy
Rev. 2018; 94: 565–575.
33. Han F, Xie R, Fang JY. Urban agglomeration economies and industrial energy efficiency. Energy. 2018;
162: 45–59.
34. Zhu L, Wang Y, Shang PP, Qi L, Yang GC, Wang Y. Improvement path, the improvement potential and
the dynamic evolution of regional energy efficiency in China: Based on an improved nonradial multidi-
rectional efficiency analysis. Energy Policy. 2019; 133: 110883.
35. Haveman HA, Jia N, Shi J, Wang YX. The dynamics of political embeddedness in China. Administrative
Science Quarterly. 2017; 62(1): 67–104.
36. He WJ, Wang B, Danish, Wang ZH. Will regional economic integration influence carbon dioxide mar-
ginal abatement costs? Evidence from Chinese panel data. Energy Econ. 2018; 74: 263–274. https://
doi.org/10.1016/j.eneco.2018.06.010 PMID: 32287515
37. Qin QD, Jiao YM, Gan XB, Liu Y. Environmental efficiency and market segmentation: An empirical anal-
ysis of China’s thermal power industry. J. Cleaner Prod. 2020; 242: 118560.
38. Nie PY, Wang C, Yang YC. Comparison of energy efficiency subsidies undermarket power. Energy Pol-
icy. 2017; 110: 144–149.
39. Huang J, Zhou X. Customization and local protectionism: Empirical evidenceand the implication to the
construction of free trade zone. Management World. 2018; 34(12): 56–66.
40. Jin G, Shen KR. Polluting thy neighbor or benefiting thy neighbor: Enforcement interaction of environ-
mental regulation and productivity growth of Chinese cities. Management World. 2018; 34 (12): 43–55.
41. Claessens S, Feijen E, Laeven L. Political connections and preferential ac-cess to finance: The role of
campaign contributions. J. Financ. Econ. 2008; 88 (3): 554–580.
42. Dai KZ, Liu YJ. Factor market distortion and innovation efficiency: Empirical evidence of China’s high-
tech industries. Econ. Res. J. 2016; 51 (07): 72–86.
43. Yin JH, Wang S, Gong LD. The Effects of factor market distortion and technicalinnovation on China’s
electricity consumption. J. Clean. Prod. 2018; 188: 195–202.
44. Colombi R, Martini G, Vittadini G. A stochastic frontier model with short-run and long-run inefficiency
random effects. University of Bergamo working paper. 2011; No:1101. From: https://aisberg.unibg.it/
retrieve/handle/10446/842/1199/WPIngGe01%282011%29.pdf.
45. Jondrow J, Lovell CAK, Materov IS, Schmidt P. On the estimation of technicalin efficiency in the sto-
chastic frontier production function model, Journal of Econometrics. 1982; 19: 233–8.
46. Young A. The razor’s edge: Distortions and incremental reform in the people’s republic of China. The
Quarterly Journal of Economics. 2000; 115(4): 1091–1135.
47. Parsley DC, Wei SJ. Convergence to the law of one price without trade barriers or currency fluctuations.
The Quarterly Journal of Economics. 1996; 111(4): 1211–1236.
48. Samuelson PA. Theoretical notes on trade problems. The review of economics and statistics. 1964; 46
(2): 145–154.
49. Parsley DC, Wei SJ. Limiting currency volatility to stimulate goods market integration: A price based
approach. NBER working paper. 2001; No: W8468. https://www.nber.org/papers/w8468.
50. Pan XF, Guo SC, Han CC, Wang MY, Song JB, Liao XC. Influence of FDI quality on energy efficiency in
China based on seemingly unrelated regression method. Energy. 2019; 116463.
51. Huang JB, Du D, Tao QZ. An analysis of technological factors andenergy intensity in China. Energy Pol-
icy. 2017; 109:1–9.
PLOS ONE Does market segmentation necessarily discourage energy efficiency?
PLOS ONE | https://doi.org/10.1371/journal.pone.0233061 May 21, 2020 18 / 19

52. Pedroni P. Panel cointegration: Asymptotic and finite sample properties of pooled time series tests with
an application to the PPP hypothesis. Econometric Theory.2004; 20: 597–625.
53. Arellano M, Bond S. Some tests of specification for panel data: Monte Carlo evidence and an application
to employment equations. The Review of Economic Studies. 1991; 58(2): 277–297.
PLOS ONE Does market segmentation necessarily discourage energy efficiency?
PLOS ONE | https://doi.org/10.1371/journal.pone.0233061 May 21, 2020 19 / 19