Embed Size (px)
Citation preview
Diana Y. Zheng LEED and Energy Use Spring 2013
1
Does LEED save energy? A case study of LEED at UC Berkeley
Diana Y. Zheng
ABSTRACT
The United States faces many environmental challenges associated with high levels of energy
use in the country, much of which is used in buildings. Although there is no consensus on the
definition of environmental sustainability, most certification schemes aim to reduce the
environmental impact of buildings by providing guidelines to minimize resource and material
use and pollution while also improving the indoor environment. Leadership in Energy and
Environmental Design (LEED), an internationally recognized green building certification
scheme, plays an important role in bringing sustainability to the forefront of building design;
however, there is little academic research on the energy performance of LEED buildings after
occupancy and the effectiveness of LEED in reducing energy use. To investigate whether LEED
certification is associated with site and source energy savings and GHG emissions reductions, I
compared post-occupancy energy use from three LEED-NC projects on the UC Berkeley campus
to energy use in conventional buildings, LEED energy models, and pre-LEED building energy
use. In this study, LEED buildings generally used less energy than conventional buildings, and
they performed as expected or better than the energy models in two out of three cases. My
analysis also demonstrates LEED’s inconsistency in producing predictable results. This case
study suggests that the LEED energy models can be fairly accurate if the assumptions of the
building post-occupancy situation in the model are true. Although LEED does not guarantee
energy savings, and it can be difficult to determine how a building will perform from design-
phase models and assumptions, at UC Berkeley, LEED buildings have performed as well as or
better than expected.
KEYWORDS
sustainable design, post-occupancy evaluation, energy efficiency, energy conservation, green
buildings
Diana Y. Zheng LEED and Energy Use Spring 2013
2
INTRODUCTION
The United States faces many environmental challenges associated with high levels of
energy use in the country, including the rising importance of energy independence and reducing
greenhouse gas emissions from fossil fuel consumption. Much of this energy is used in buildings.
In the US, residential and commercial buildings used 70% of electricity in 2010 and produced
40% of carbon dioxide emissions in 2009 (U.S. EIA 2012). Most environmental impacts come
from when buildings are occupied (Junnila et al. 2006). Buildings have a long life span,
averaging thirty-five years, so they have far-reaching impacts on energy use patterns (Sam
Borgeson, personal communication 2011). As a major energy consumer and greenhouse gas
producer, buildings present an important and cost-effective opportunity to reduce the human
ecological and carbon footprints (Granade et al. 2009). To encourage more environmentally
sustainable or green building design, numerous green building certification programs have
appeared internationally in the past few decades (Lee 2012).
Although there is no consensus on the definition of environmental sustainability, most
certification schemes aim to reduce the environmental impact of buildings by providing
guidelines to minimize resource and material use and pollution while also improving the indoor
environment (Lee 2012). Leadership in Energy and Environmental Design (LEED), developed in
2000 and implemented by the U.S. Green Building Council (USGBC), is an internationally
recognized certification scheme that targets seven different areas of environmental design
(USGBC 2011). Even though LEED certification is a comprehensive assessment that addresses
energy use, energy efficiency and conservation and greenhouse gas emissions reductions are
critical components of the certification requirements (USGBC 2011). LEED requires a minimum
energy performance and offers many energy efficiency and renewable energy credit options in
the Energy and Atmosphere (E&A) section, seeking to reduce greenhouse gas emissions through
improve building energy efficiency and using renewable energy sources (USGBC 2011).
LEED plays an important role in bringing sustainability to the forefront of building
design, but there is little academic research on sustainable building energy performance after
occupancy and thus the effectiveness of LEED in reducing energy use (Moschandreas and
Nuanual 2008). Different studies come to conflicting conclusions; some suggest that LEED does
save energy (Turner and Frankel 2008, Newsham et al. 2009), while others conclude that LEED
Diana Y. Zheng LEED and Energy Use Spring 2013
3
does not generate statistically significant energy savings (Scofield 2009). However, the results
from Turner and Frankel (2008), one of the largest studies on LEED energy use to date, and
Newsham et al. (2009), which reanalyzes the Turner and Frankel study with more statistical
rigor, are both suspect because they compare median LEED energy use intensity (EUI) with
mean conventional building EUI, two different statistics that cannot be accurately juxtaposed
(Scofield 2009); additionally, the two studies calculate building-weighted mean EUI rather than
an area-weighted mean, which results in much lower total energy use than the actual energy use
recorded by meters when calculated backwards from the mean. Despite the controversy around
the link between LEED and energy savings or GHG reductions, there is some consensus that
although many LEED buildings use less energy than conventional buildings, a significant
number of certified buildings, especially larger ones, use substantially more energy than
conventional buildings (Scofield 2009, Turner and Frankel 2008); additionally, certification level
does not appear to correlate with energy use per unit area (Turner and Frankel 2008, Diamond et
al. 2006). In general, studies show that most LEED buildings perform as or better than modeled,
but some buildings do not (Turner and Frankel 2008), but uncertainty surrounds the actual
environmental impact of green buildings because of the young age of many certification schemes
and lack of research on post-occupancy building performance.
The University of California, Berkeley (UC Berkeley or Cal) prides itself for being
sustainable and currently houses six LEED-New Construction and Major Renovations (LEED-
NC) buildings, ranging from Certified to Gold (Green.Facilities Services 2012). In addition, all
new buildings and large renovation projects will be built according to LEED New Construction
standards (UC Berkeley 2011). It is important for a budget-constrained university such as Cal to
invest in building to green certification standards that are cost-effective. The actual post-
occupancy energy impacts of LEED certification must be carefully evaluated, because LEED
certification should not be pursued if it does not reduce energy use.
To investigate if LEED certification generates site energy savings, I compared post-
occupancy EUI per square foot and per capita from three LEED-NC buildings at UC Berkeley
with data from conventional buildings over 1.5 to 5 years, depending on the age of the LEED
project. From monthly billing data, I calculated the total average EUI per month as well as
monthly EUI to see seasonal variation for a finer-grained picture of energy consumption in each
building in my sample. I then compared LEED data with regional averages of energy
Diana Y. Zheng LEED and Energy Use Spring 2013
4
consumption from the 2006 California Commercial End Use Survey (CEUS) and the US Energy
Information Administration’s (EIA) 2009 Residential Energy Consumption Survey (RECS). I
also compared LEED buildings’ post-occupancy energy use with their pre-construction energy
models of expected energy performance, which at minimum should comply with ASHRAE
(American Society of Heating, Refrigerating and Air-Conditioning Engineers) or state baselines,
depending on what version of LEED under which individual projects were certified. These
energy models are required for certification and are used to predict energy savings. Additionally,
models are based on assumptions that may prove to be untrue, for example with occupant plug
loads. Lastly, for Durant Hall, the only Major Renovation project that maintained the building’s
original area, I analyzed pre- and post-LEED conversion EUI to see how energy use changed due
to certification.
METHODS
Study site and sample
To see if LEED buildings save energy, I analyzed the energy consumption of three
LEED-NC projects on the UC Berkeley campus: Durant Hall, Blum Hall/Naval Architecture
building, and University Village (UVA) (Table 1). The main campus operates Durant and Blum
Halls, while Residential and Student Services Programs (RSSP) manages UVA (Green.Facilities
Services 2008). I analyzed electricity use in Durant and Blum Halls and both electricity and
natural gas use at UVA. Although Durant and Blum use steam for heating purposes, Blum Hall
does not have a steam meter and Durant Hall’s meter is possibly recording incorrect data (Ben
Palaima, personal communication 2/12/2013). Because my sample size is so small, I did not
conduct statistical tests. Only half of University Village, the West Village, is LEED-certified, but
the Village only has one electricity and natural gas meter each for the entire Village.
Diana Y. Zheng LEED and Energy Use Spring 2013
5
LEED versus conventional buildings
Data collection
To compare energy use data between LEED and conventional buildings, I collected total
building energy use data from UC Berkeley Physical Plant-Campus Services (PP-CS) for Durant
and Blum Halls and UVA, and from RSSP for ECEC (Ben Palaima, personal communication
2012-2013). The monthly billing data includes electricity (kWh) and/or natural gas (therms) use
for the entire project. Depending on the age of the LEED project, I analyzed between one and
five years of data. I then compared the LEED buildings to average office and household energy
consumption I found average energy consumption data for office buildings in PG&E’s service
sector from the California Commercial End-Use Survey (CEUS), which was published in 2006. I
included all offices and small office (less than 30,000 square feet) in my analysis. For residential
energy use, I used 2009 California averages from the US Energy Information Administration
(EIA) Residential Energy Consumption Survey (RECS) to compare UVA with the average
Californian household, the average Western multi-family rented household, and households in a
marine climate. The “Western” designation includes Colorado, Idaho, Montana, Utah, Wyoming,
Arizona, New Mexico, Nevada, California, Alaska, Hawaii, Oregon, and Washington. The data
from both reports include total annual energy use for all fuel types used in each building type
category.
Data analysis
To see if LEED certification generates energy savings, I compared the EUI of LEED
projects and their paired conventional buildings. From monthly billing data of electricity
consumption, I calculated monthly EUI per square foot in kBtus and summed the various fuel
sources to find total energy consumption per square foot for each building. I compared total
mean monthly EUI across all months as well as mean monthly EUI per year to see whether the
LEED or conventional buildings used more energy overall. I also plotted monthly EUI in line
graphs for a finer analysis of yearly and seasonal fluctuation.
Diana Y. Zheng LEED and Energy Use Spring 2013
6
Pre-LEED versus post-LEED
Data collection
To determine how LEED certification affected energy consumption in Durant Hall, a
major renovation rather than a new construction project, I analyzed seven years of data prior to
conversion to LEED, from mid-2001 to mid-2008. The data was provided by PP-CS.
Data analysis
I converted Durant Hall’s pre-conversion data into kBtu per square foot per month and
compared it to post-LEED monthly EUI and median monthly EUI to see how LEED certification
changed energy use.
LEED model vs. post-occupancy energy performance
Data collection
To investigate if the LEED projects on campus are performing as expected, I obtained the
pre-construction energy model for Durant Hall from the Cal Capital Projects department, which
oversees the LEED process on campus, and for Blum Hall from Gensler, the architectural firm
that documented Blum Hall’s LEED certification process. These models, which are required for
E&A credits, generate a prediction of average annual and monthly energy use in kBtu. The
models incorporate parameters like climate, daily use schedules (e.g. lighting, occupancy, and
plug-load schedules), building materials, and building systems (e.g. heating, cooling), and plug
loads. Because the models are run before the project is completed, the models contain the
modeler’s assumptions about energy use that may not actually reflect the post-occupancy
situation of the building, such as plug loads and even the HVAC system that is actually installed.
Most of these factors will not differ drastically in the completed project, but plug loads can be
variable, and the University may not implement or may substitute some aspects of the designs
due to financial reasons. Buildings may also not be built exactly as they were designed, which
Diana Y. Zheng LEED and Energy Use Spring 2013
7
could change factors influencing energy use, such as air leakage. LEED certification is based on
these models rather than post-occupancy energy use; thus, the models do not necessarily reflect
actual energy use in certified buildings.
Data analysis
I compared the design, standard baseline, and actual EUI per month and median monthly
EUI by plotting the data to depict differences in energy performance. For Blum Hall, I used the
model from the Energy and Atmosphere Credit 1 Step 1 calculations, which considers district
steam to be purchased energy and excludes the energy efficiencies of equipment not in the
building (e.g. district steam generation equipment) (USGBC). This results in a stringent energy
and cost savings calculation.
Interviews
To analyze and better understand occupants’ energy use behaviors and attitudes behind
the energy use trends revealed in the data, I interviewed the facilities managers of Durant and
Blum Halls as well as a volunteer analyzing energy use at University Village. I asked them about
daily and seasonal operating schedules, lighting use, thermal comfort, and other sources of
energy consumption. I also asked questions about occupants’ attitudes toward energy
conservation.
RESULTS
LEED versus conventional buildings
Comparing the LEED buildings to the California Commercial Energy-Use Survey
(CEUS) and the national Residential Energy Consumption Survey (RECS), I found that the
LEED buildings vary widely in their energy performance relative to conventional buildings in
PG&E’s service area. Blum Hall uses less than half as much energy as similar conventional
office buildings and Durant Hall did not use less energy compared to similar office buildings
Diana Y. Zheng LEED and Energy Use Spring 2013
8
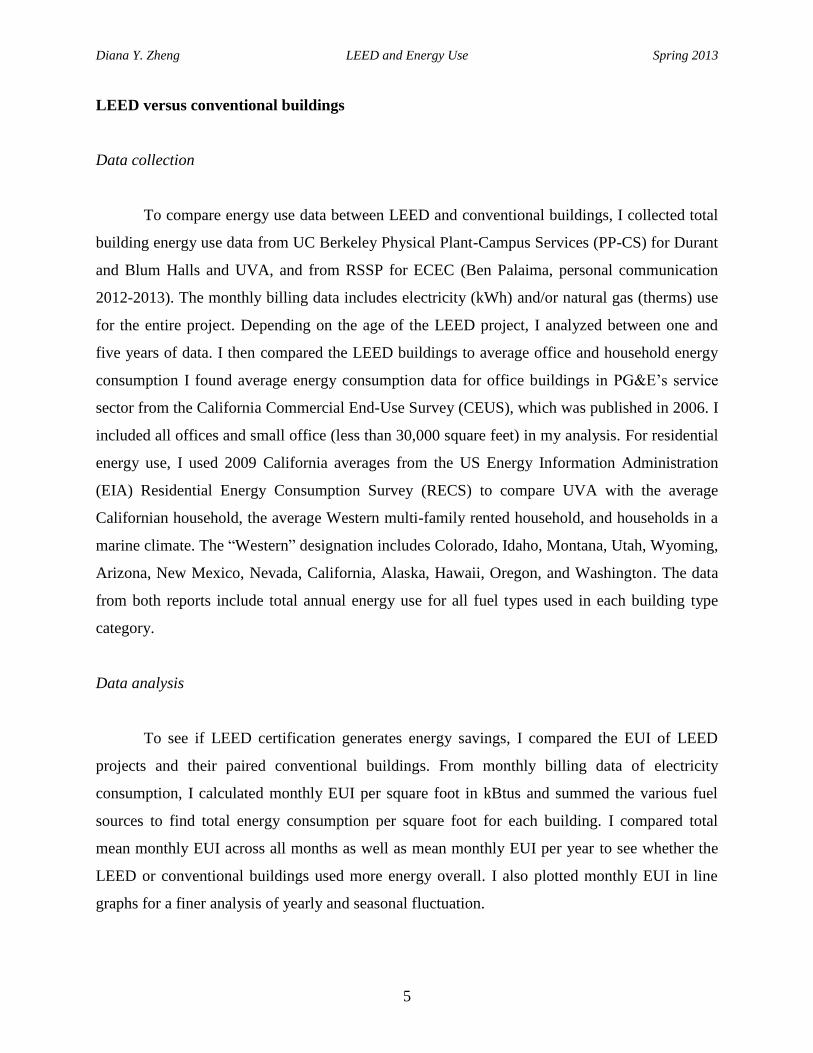
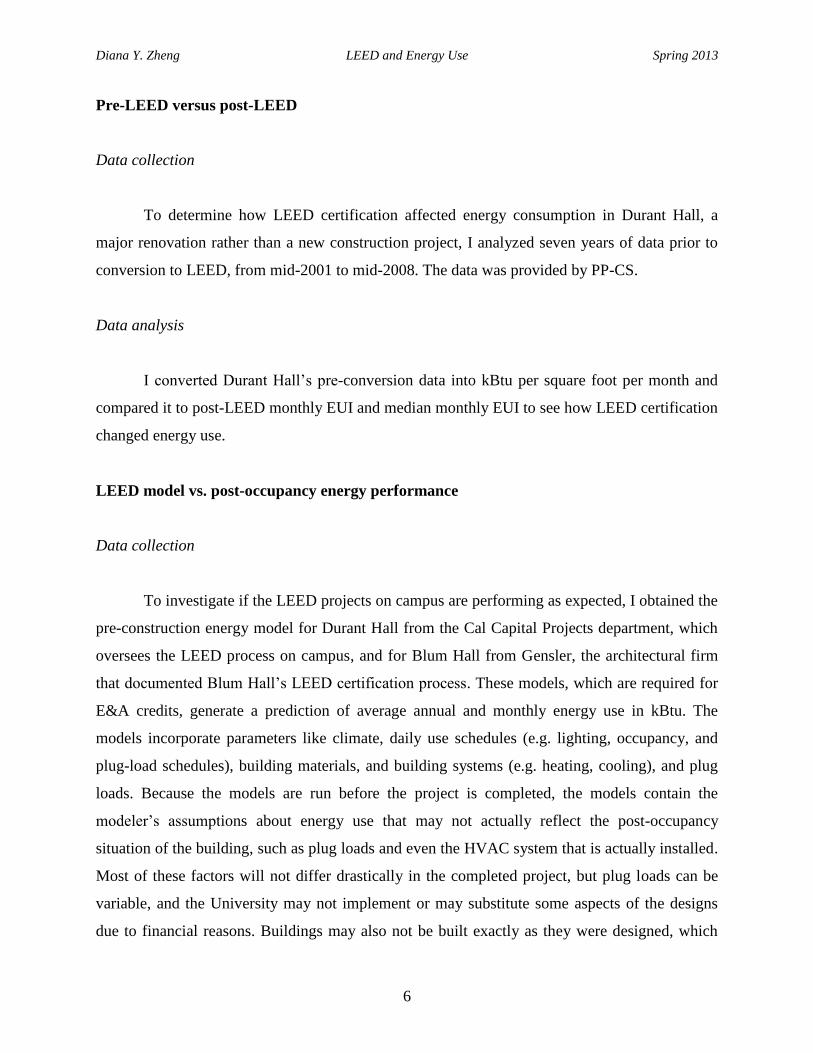
(Figure 1). University Village uses more energy than the average California household and
similar households, but emits almost as much GHGs as the average Western multi-family rented
household (Figure 2).
Fig. 1: Mean monthly energy use intensity (EUI) of LEED post-occupancy and conventional office buildings. On a square
foot basis, Blum Hall uses about half as much energy as an average office building, but Durant Hall uses more than average.
Fig. 2: Mean monthly EUI of LEED post-occupancy and conventional residential buildings. The entire Village uses more
energy than the average similar household.
Blum Hall uses a mean of 1.88 kBtu of electricity per square foot per month (kBtu/sf-
mo), while other California small offices (less than 30,000 square feet) uses a mean of 3.84 kBtu
of energy per square foot per month and all offices in California uses a mean of 4.49 kBtu per
0.00
1.00
2.00
3.00
4.00
5.00
6.00
Blum Durant CA Small officeelectricity (<30 ksf)
(CEUS report)
CA All office electricity(CEUS report)
kBtu
/sf-
mo
0.00
1.00
2.00
3.00
4.00
5.00
6.00
UVA avg CA household(RECS)
avg western multi-family rented
household (RECS)
marine climatehousehold (RECS)
kBtu
/sf-
mo
Diana Y. Zheng LEED and Energy Use Spring 2013
9
square foot per month (CEUS). Durant Hall uses a mean of 4.92 kBtu of electricity per square
foot per month, more energy than all offices and small offices only.
University Village as a whole uses a mean of 4.85 kBtu of energy (electricity and natural
gas) per square foot per month, while the average California household uses 3.23 kBtu/sf-mo, the
average Western1 multi-family rented household uses 3.83 kBtu/sf-mo, and the average
household in the same climate zone (marine climate) uses 3.31 kBtu/sf-mo (Residential Energy
Consumption Survey, or RECS).
Pre-LEED versus post-LEED
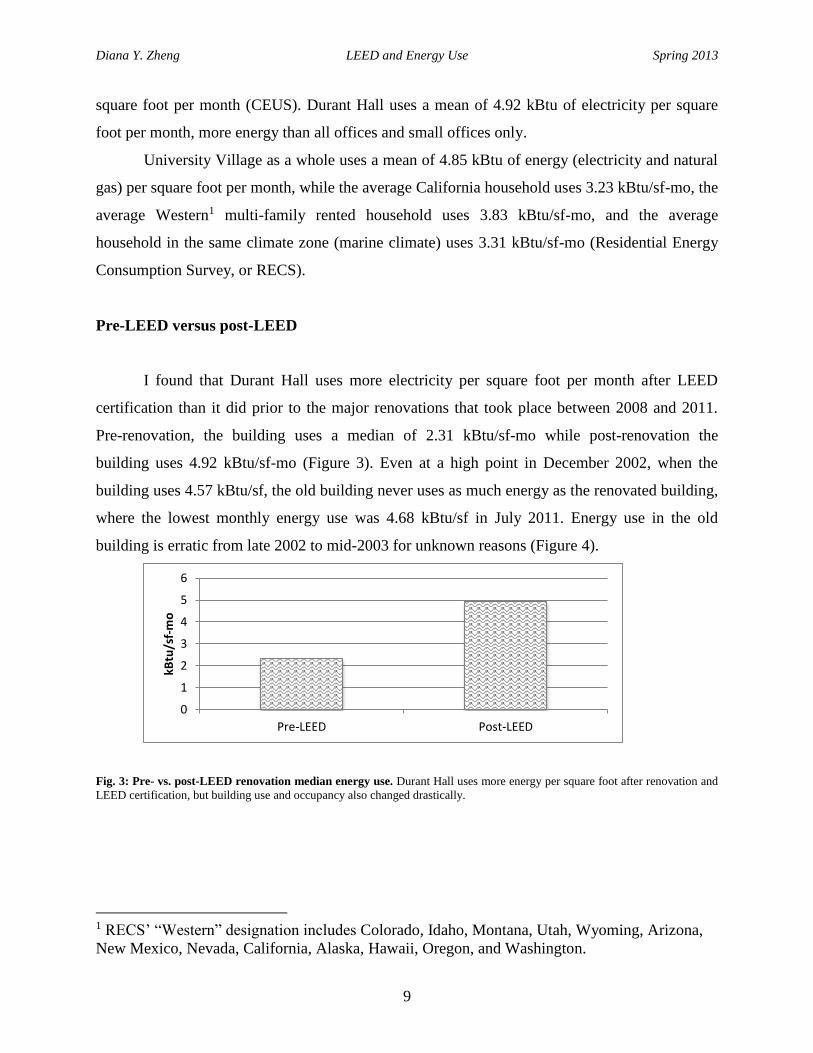
I found that Durant Hall uses more electricity per square foot per month after LEED
certification than it did prior to the major renovations that took place between 2008 and 2011.
Pre-renovation, the building uses a median of 2.31 kBtu/sf-mo while post-renovation the
building uses 4.92 kBtu/sf-mo (Figure 3). Even at a high point in December 2002, when the
building uses 4.57 kBtu/sf, the old building never uses as much energy as the renovated building,
where the lowest monthly energy use was 4.68 kBtu/sf in July 2011. Energy use in the old
building is erratic from late 2002 to mid-2003 for unknown reasons (Figure 4).
Fig. 3: Pre- vs. post-LEED renovation median energy use. Durant Hall uses more energy per square foot after renovation and
LEED certification, but building use and occupancy also changed drastically.
1 RECS’ “Western” designation includes Colorado, Idaho, Montana, Utah, Wyoming, Arizona,
New Mexico, Nevada, California, Alaska, Hawaii, Oregon, and Washington.
0
1
2
3
4
5
6
Pre-LEED Post-LEED
kBtu
/sf-
mo
Diana Y. Zheng LEED and Energy Use Spring 2013
10
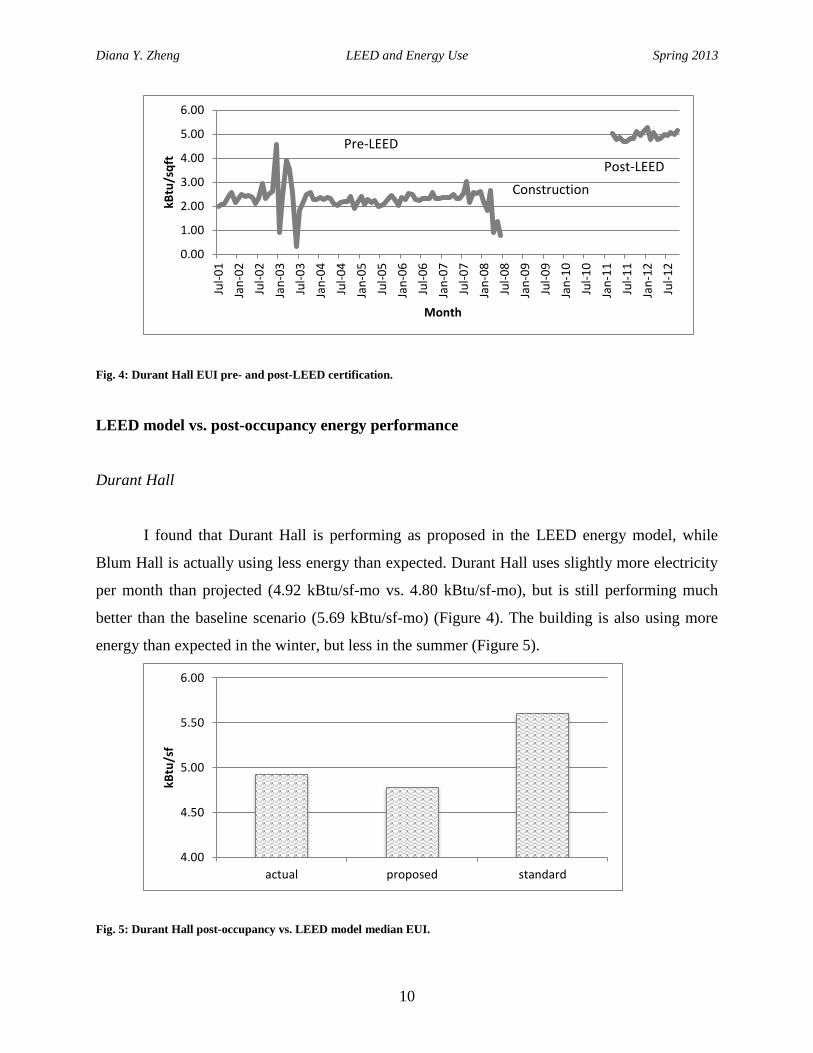
Fig. 4: Durant Hall EUI pre- and post-LEED certification.
LEED model vs. post-occupancy energy performance
Durant Hall
I found that Durant Hall is performing as proposed in the LEED energy model, while
Blum Hall is actually using less energy than expected. Durant Hall uses slightly more electricity
per month than projected (4.92 kBtu/sf-mo vs. 4.80 kBtu/sf-mo), but is still performing much
better than the baseline scenario (5.69 kBtu/sf-mo) (Figure 4). The building is also using more
energy than expected in the winter, but less in the summer (Figure 5).
Fig. 5: Durant Hall post-occupancy vs. LEED model median EUI.
0.00
1.00
2.00
3.00
4.00
5.00
6.00
Jul-
01
Jan
-02
Jul-
02
Jan
-03
Jul-
03
Jan
-04
Jul-
04
Jan
-05
Jul-
05
Jan
-06
Jul-
06
Jan
-07
Jul-
07
Jan
-08
Jul-
08
Jan
-09
Jul-
09
Jan
-10
Jul-
10
Jan
-11
Jul-
11
Jan
-12
Jul-
12
kBtu
/sq
ft
Month
Pre-LEED
Post-LEED
Construction
4.00
4.50
5.00
5.50
6.00
actual proposed standard
kBtu
/sf
Diana Y. Zheng LEED and Energy Use Spring 2013
11
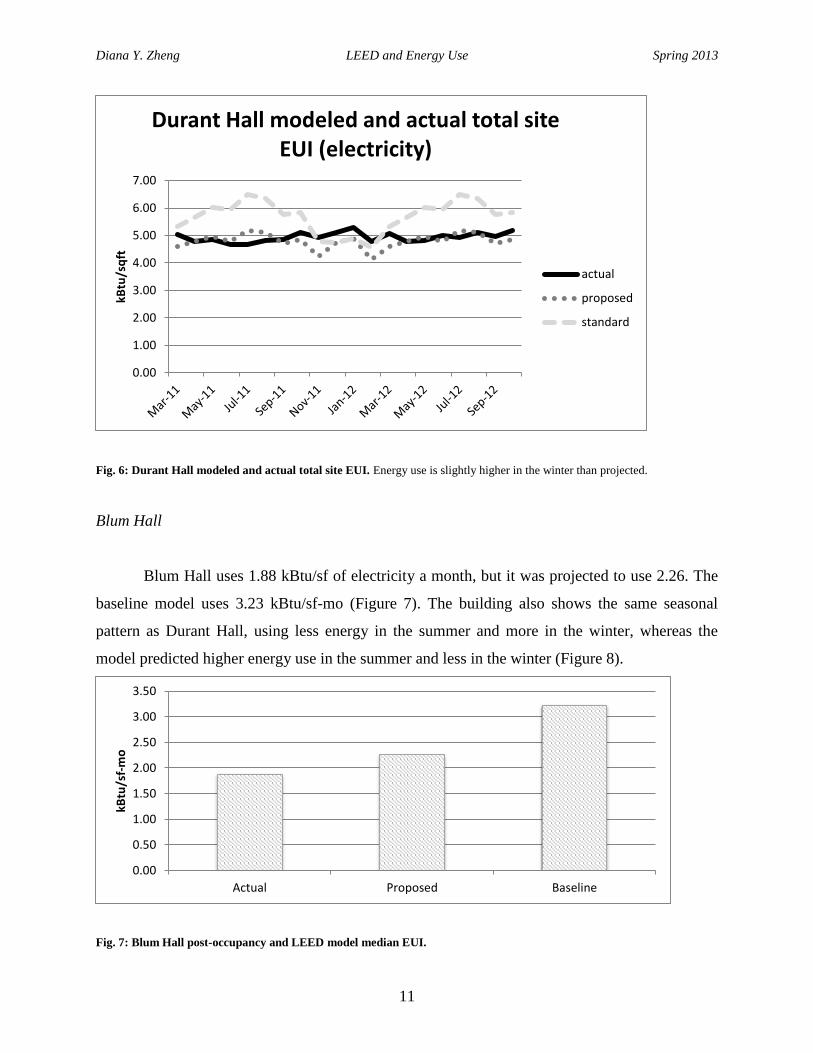
Fig. 6: Durant Hall modeled and actual total site EUI. Energy use is slightly higher in the winter than projected.
Blum Hall
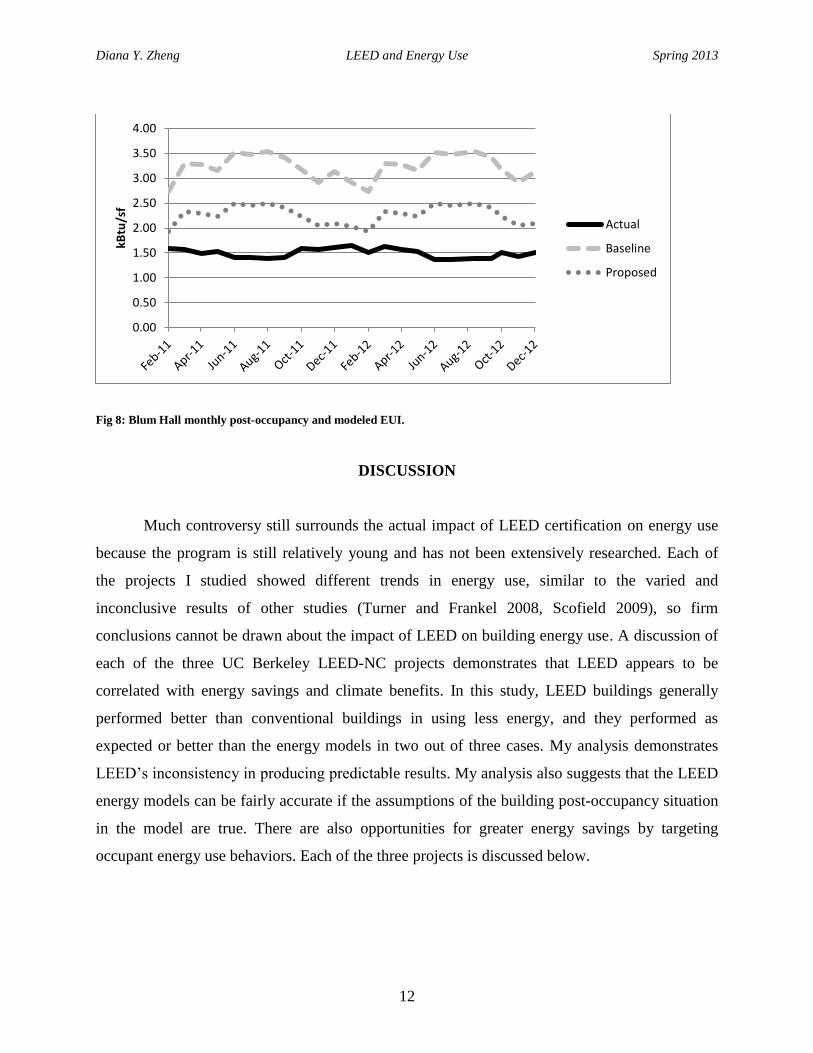
Blum Hall uses 1.88 kBtu/sf of electricity a month, but it was projected to use 2.26. The
baseline model uses 3.23 kBtu/sf-mo (Figure 7). The building also shows the same seasonal
pattern as Durant Hall, using less energy in the summer and more in the winter, whereas the
model predicted higher energy use in the summer and less in the winter (Figure 8).
Fig. 7: Blum Hall post-occupancy and LEED model median EUI.
0.00
1.00
2.00
3.00
4.00
5.00
6.00
7.00
kBtu
/sq
ftDurant Hall modeled and actual total site
EUI (electricity)
actual
proposed
standard
0.00
0.50
1.00
1.50
2.00
2.50
3.00
3.50
Actual Proposed Baseline
kBtu
/sf-
mo
Diana Y. Zheng LEED and Energy Use Spring 2013
12
Fig 8: Blum Hall monthly post-occupancy and modeled EUI.
DISCUSSION
Much controversy still surrounds the actual impact of LEED certification on energy use
because the program is still relatively young and has not been extensively researched. Each of
the projects I studied showed different trends in energy use, similar to the varied and
inconclusive results of other studies (Turner and Frankel 2008, Scofield 2009), so firm
conclusions cannot be drawn about the impact of LEED on building energy use. A discussion of
each of the three UC Berkeley LEED-NC projects demonstrates that LEED appears to be
correlated with energy savings and climate benefits. In this study, LEED buildings generally
performed better than conventional buildings in using less energy, and they performed as
expected or better than the energy models in two out of three cases. My analysis demonstrates
LEED’s inconsistency in producing predictable results. My analysis also suggests that the LEED
energy models can be fairly accurate if the assumptions of the building post-occupancy situation
in the model are true. There are also opportunities for greater energy savings by targeting
occupant energy use behaviors. Each of the three projects is discussed below.
0.00
0.50
1.00
1.50
2.00
2.50
3.00
3.50
4.00kB
tu/s
f
Actual
Baseline
Proposed
Diana Y. Zheng LEED and Energy Use Spring 2013
13
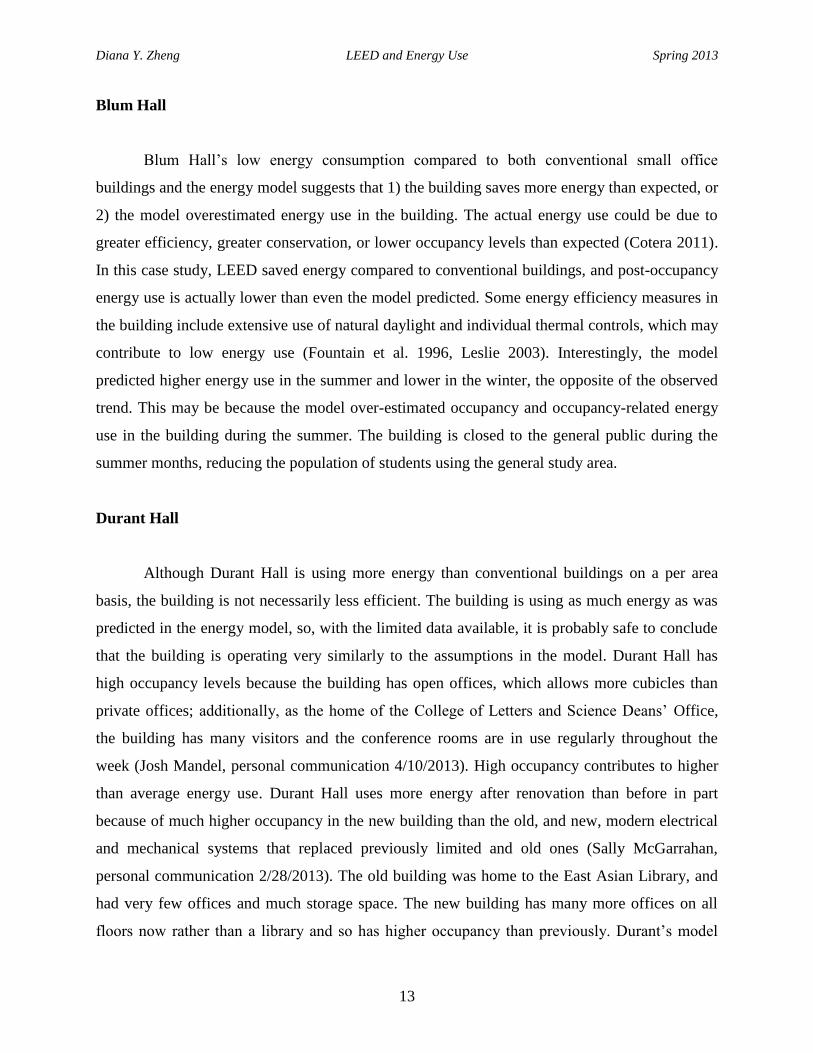
Blum Hall
Blum Hall’s low energy consumption compared to both conventional small office
buildings and the energy model suggests that 1) the building saves more energy than expected, or
2) the model overestimated energy use in the building. The actual energy use could be due to
greater efficiency, greater conservation, or lower occupancy levels than expected (Cotera 2011).
In this case study, LEED saved energy compared to conventional buildings, and post-occupancy
energy use is actually lower than even the model predicted. Some energy efficiency measures in
the building include extensive use of natural daylight and individual thermal controls, which may
contribute to low energy use (Fountain et al. 1996, Leslie 2003). Interestingly, the model
predicted higher energy use in the summer and lower in the winter, the opposite of the observed
trend. This may be because the model over-estimated occupancy and occupancy-related energy
use in the building during the summer. The building is closed to the general public during the
summer months, reducing the population of students using the general study area.
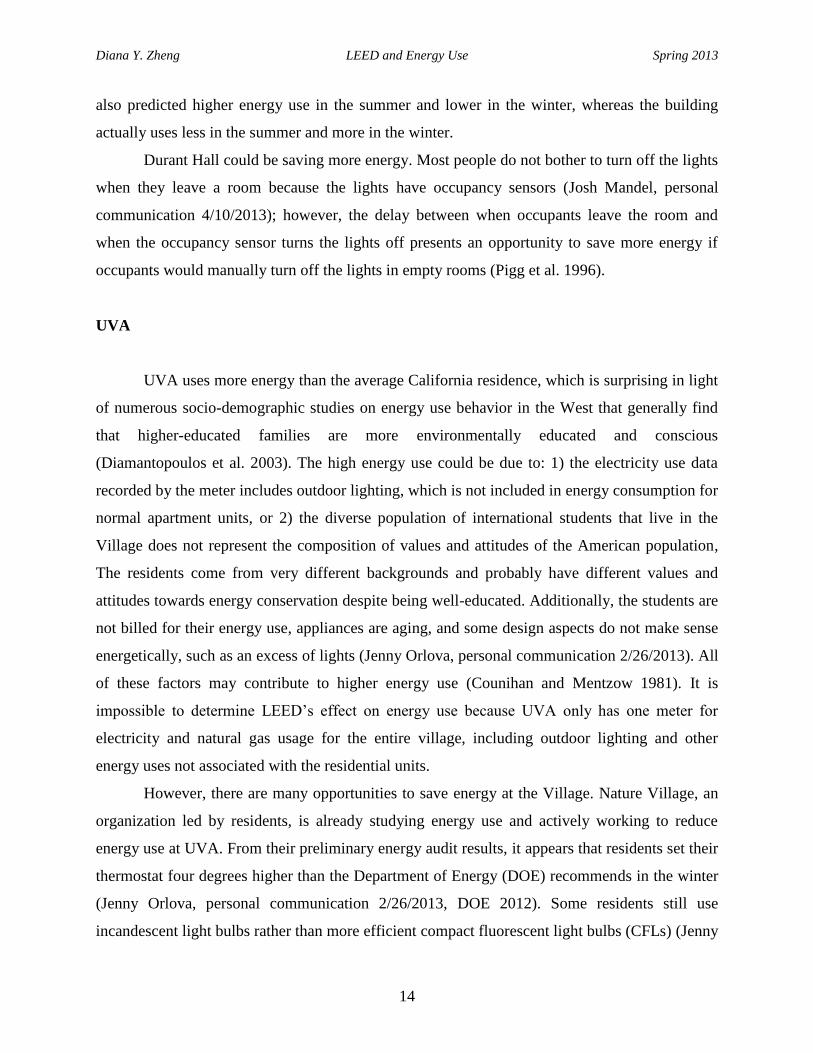
Durant Hall
Although Durant Hall is using more energy than conventional buildings on a per area
basis, the building is not necessarily less efficient. The building is using as much energy as was
predicted in the energy model, so, with the limited data available, it is probably safe to conclude
that the building is operating very similarly to the assumptions in the model. Durant Hall has
high occupancy levels because the building has open offices, which allows more cubicles than
private offices; additionally, as the home of the College of Letters and Science Deans’ Office,
the building has many visitors and the conference rooms are in use regularly throughout the
week (Josh Mandel, personal communication 4/10/2013). High occupancy contributes to higher
than average energy use. Durant Hall uses more energy after renovation than before in part
because of much higher occupancy in the new building than the old, and new, modern electrical
and mechanical systems that replaced previously limited and old ones (Sally McGarrahan,
personal communication 2/28/2013). The old building was home to the East Asian Library, and
had very few offices and much storage space. The new building has many more offices on all
floors now rather than a library and so has higher occupancy than previously. Durant’s model
Diana Y. Zheng LEED and Energy Use Spring 2013
14
also predicted higher energy use in the summer and lower in the winter, whereas the building
actually uses less in the summer and more in the winter.
Durant Hall could be saving more energy. Most people do not bother to turn off the lights
when they leave a room because the lights have occupancy sensors (Josh Mandel, personal
communication 4/10/2013); however, the delay between when occupants leave the room and
when the occupancy sensor turns the lights off presents an opportunity to save more energy if
occupants would manually turn off the lights in empty rooms (Pigg et al. 1996).
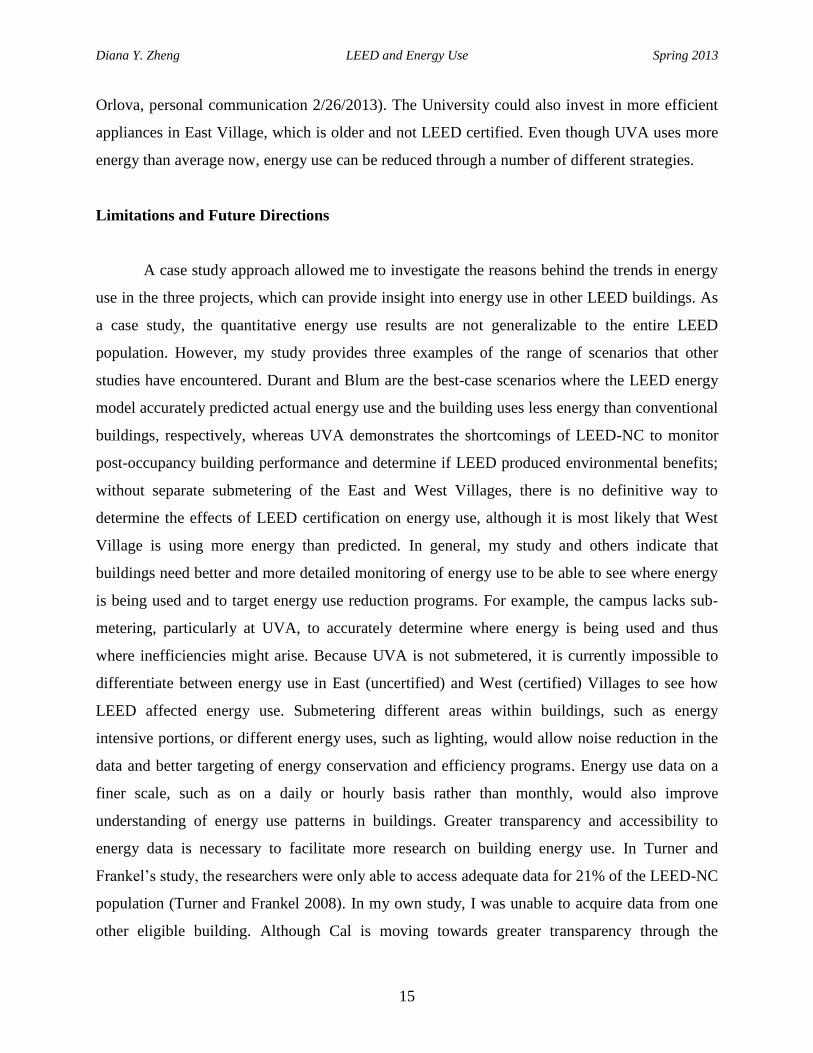
UVA
UVA uses more energy than the average California residence, which is surprising in light
of numerous socio-demographic studies on energy use behavior in the West that generally find
that higher-educated families are more environmentally educated and conscious
(Diamantopoulos et al. 2003). The high energy use could be due to: 1) the electricity use data
recorded by the meter includes outdoor lighting, which is not included in energy consumption for
normal apartment units, or 2) the diverse population of international students that live in the
Village does not represent the composition of values and attitudes of the American population,
The residents come from very different backgrounds and probably have different values and
attitudes towards energy conservation despite being well-educated. Additionally, the students are
not billed for their energy use, appliances are aging, and some design aspects do not make sense
energetically, such as an excess of lights (Jenny Orlova, personal communication 2/26/2013). All
of these factors may contribute to higher energy use (Counihan and Mentzow 1981). It is
impossible to determine LEED’s effect on energy use because UVA only has one meter for
electricity and natural gas usage for the entire village, including outdoor lighting and other
energy uses not associated with the residential units.
However, there are many opportunities to save energy at the Village. Nature Village, an
organization led by residents, is already studying energy use and actively working to reduce
energy use at UVA. From their preliminary energy audit results, it appears that residents set their
thermostat four degrees higher than the Department of Energy (DOE) recommends in the winter
(Jenny Orlova, personal communication 2/26/2013, DOE 2012). Some residents still use
incandescent light bulbs rather than more efficient compact fluorescent light bulbs (CFLs) (Jenny
Diana Y. Zheng LEED and Energy Use Spring 2013
15
Orlova, personal communication 2/26/2013). The University could also invest in more efficient
appliances in East Village, which is older and not LEED certified. Even though UVA uses more
energy than average now, energy use can be reduced through a number of different strategies.
Limitations and Future Directions
A case study approach allowed me to investigate the reasons behind the trends in energy
use in the three projects, which can provide insight into energy use in other LEED buildings. As
a case study, the quantitative energy use results are not generalizable to the entire LEED
population. However, my study provides three examples of the range of scenarios that other
studies have encountered. Durant and Blum are the best-case scenarios where the LEED energy
model accurately predicted actual energy use and the building uses less energy than conventional
buildings, respectively, whereas UVA demonstrates the shortcomings of LEED-NC to monitor
post-occupancy building performance and determine if LEED produced environmental benefits;
without separate submetering of the East and West Villages, there is no definitive way to
determine the effects of LEED certification on energy use, although it is most likely that West
Village is using more energy than predicted. In general, my study and others indicate that
buildings need better and more detailed monitoring of energy use to be able to see where energy
is being used and to target energy use reduction programs. For example, the campus lacks sub-
metering, particularly at UVA, to accurately determine where energy is being used and thus
where inefficiencies might arise. Because UVA is not submetered, it is currently impossible to
differentiate between energy use in East (uncertified) and West (certified) Villages to see how
LEED affected energy use. Submetering different areas within buildings, such as energy
intensive portions, or different energy uses, such as lighting, would allow noise reduction in the
data and better targeting of energy conservation and efficiency programs. Energy use data on a
finer scale, such as on a daily or hourly basis rather than monthly, would also improve
understanding of energy use patterns in buildings. Greater transparency and accessibility to
energy data is necessary to facilitate more research on building energy use. In Turner and
Frankel’s study, the researchers were only able to access adequate data for 21% of the LEED-NC
population (Turner and Frankel 2008). In my own study, I was unable to acquire data from one
other eligible building. Although Cal is moving towards greater transparency through the
Diana Y. Zheng LEED and Energy Use Spring 2013
16
myPower program and energy dashboard, the data itself is still hard to obtain and the dashboard
still does not contain all the buildings on campus. Reliable occupancy data is also often missing,
especially for Cal buildings. Without adequate occupancy data, some comparisons are difficult
and inadequate. Even though Durant Hall uses more energy on an area basis after renovation, in
this case a per capita comparison of energy use would be more informative because of the
change in occupancy. Better occupancy records would allow researchers to compare energy use
between populations of differing sizes in the same area for a more holistic view of energy use in
buildings. Naturally, buildings with higher population densities will use more energy, but the
increased energy use is not necessarily a reflection of energy waste. Some of these limitations,
such as lack of data, will diminish as more buildings are certified and age, enabling more reliable
and informative quantitative analyses beyond the case study approach, but building managers
also need to improve data collection to fully understand energy use in LEED buildings.
There is much more research to be done in the LEED and energy use field as more
buildings are certified under LEED and mature. UC Berkeley has just certified two buildings
under New Construction and one under Commercial Interiors. LEED models and post-occupancy
energy use need to be studied more to understand what factors contribute to an accurate model,
and what aspects of the modeling process need to be improved to produce more accurate results.
To study where the model and post-occupancy diverge, data on post-occupancy energy use, post-
occupancy surveys on occupants’ energy use attitudes and behaviors, and differences between
design plans and final constructed buildings need to be recorded and analyzed to understand if
there are general trends in results that could suggest a systemic flaw in the modeling process, or
if the variation seen is more random. Occupancy is often the least predictable, especially for
office buildings that are rented to unknown tenants, whereas on campus occupancy can be more
readily and accurately estimated, which could contribute to the generally accurate models seen in
the three projects included in this study.
Broader Implications
Controversy over the legitimacy of LEED’s claim to be green still abounds, as LEED
certification is only just over a decade old and there is still little research on post-occupancy
energy use in LEED buildings. Critics question not just LEED’s ability to produce energy
Diana Y. Zheng LEED and Energy Use Spring 2013
17
savings, but whether LEED buildings actually meet their objectives to reduce environmental
impacts and improve occupant comfort. Common criticisms include rewarding easy points rather
than actually reduce the environmental impact of buildings, not including simple but effective
techniques for reducing energy use, and, especially for energy use, not including any
requirements for post-occupancy monitoring to corroborate pre-construction predictions. Instead
of focusing on specific practices and pre-construction, could instead score based on results to
reduce the number of certifications earned from targeting easy points rather than truly
environmentally friendly practices. LEED has sought to rectify this by requiring at least 2 EAc1
points for energy efficiency since 2007. Even so, according to the NBI study, the average Energy
Star rating of LEED buildings is 68, or only 68% better than similar buildings—this means that
LEED on average does not even garner an Energy Star rating, which is awarded to the top
quartile (at least 75 points) of buildings (Turner and Frankel 2008). Even though 47% of the
buildings in the NBI study buildings would receive Energy Star rating, 15% scored 30 or less
(Turner and Frankel 2008). LEED is not solely focused on energy efficiency, and project
managers have leeway in determining which points to achieve, but energy efficiency is an
important part of green building and LEED (energy is in the name, after all), and for so many
“green” buildings to be worse than the median building is disappointing, misleading, and
mocking of the goal of green buildings to have a smaller impact on the environment. Green
buildings should perform among the best of the building stock, and although currently many
LEED buildings are indeed energy efficient, too many are not (Gifford 2009).
My results, however, suggest that LEED can guide the construction of energy efficient
buildings with careful implementation and suggest why LEED on campus is generally effective
from information gathered from interviewing building managers. This study supports the idea
that LEED buildings do save energy, strengthening the UC policy to build all new construction
on campus to LEED standards. Although LEED currently does not take post-occupancy
performance into consideration for certification, it is beneficial for Cal to conduct post-
occupancy analyses of building performance to ensure that buildings are performing as expected
and generating expected savings and other benefits. UC Berkeley should monitor post-occupancy
as more buildings are certified to see if buildings continue to show the same trends in reduced
energy use seen in this study; if not, LEED is not necessarily worthwhile to pursue, as it is
expensive to certify with LEED.
Diana Y. Zheng LEED and Energy Use Spring 2013
18
Conclusions
LEED does not guarantee energy savings, and it can be difficult to ascertain how a
building will perform from design-phase models and assumptions; however, at UC Berkeley,
LEED buildings have performed as or better than expected. LEED can and does produce
buildings that save energy, but the energy models and post-occupancy monitoring still need to be
refined or implemented, or consistent improvement over the conventional building stock. The
trends seen in this study, although positive, are too varied to draw any definite conclusions about
the impact of LEED on energy use; with more data, it will become clearer how LEED measures
up to its “green building” claims. The certified office buildings on campus are performing as
well or better than expected, and therefore may be a good investment for the campus from an
energy perspective.
ACKNOWLEDGEMENTS
Thank you to all of the people who provided me with data and ideas for my thesis: Ben Palaima
(PP-CS), Rebecca Anderson and Judy Chess (Capital Projects), Tavie Tipton (UVA), Josh
Mandel (Durant Hall), Paula Zamora (Blum Hall), Sarah Viducich (Facilities Link), Sam
Borgeson and Joe Kantenbacher (ERG), Chuck Frost (Energy Office), Chris Jones (RAEL) and
Lisa McNeilly and Kira Stoll (Office of Sustainability). A huge thank you to the ES 196 team
(Patina Mendez, Kurt Spreyer, Carrie Cizauskas, Rachael Marzion, and Anne Murray) especially
Rachael Marzion, for reading all of my assignments and in essence becoming my mentor.
Another huge thank you to my peer review group, who also gave me good feedback and
constructive criticism: Mashail Arif, Jolie Chan, and Cece Chu. Lastly, eternal thanks to my
parents, who have lovingly supported me in all of my endeavors. My interviews were exempted
from CPHS review.
Diana Y. Zheng LEED and Energy Use Spring 2013
19
REFERENCES
2007. California Commercial End-Use Survey Results. Itron, Inc.
<http://capabilities.itron.com/CeusWeb/Chart.aspx>
2009. Residential Energy Consumption Survey (RECS). Energy Information Administration.
<http://www.eia.gov/consumption/residential/>
Anwar, Y. 2010. Blum Hall opens its doors. UC Newsroom.
<http://www.universityofcalifornia.edu/news/article/24260>
Cotera, P. 2011. A post-occupancy evaluation: to what degree do LEED certified buildings
maintain their sustainable integrities over time? PhD thesis, University of Florida,
Florida. < http://etd.fcla.edu/UF/UFE0042961/cotera_p.pdf>
Counihan, R. H. and D. Mentzow. 1981. Energy Conservation and the Market Rental Housing
Market. Solar Law Reporter. 2:1103-1132.
Diamantopoulos, A., B. B. Schlegelmilch, R. R. Sinkovics, and G. M. Bohlen. 2003. Can socio-
demographics still play a role in profiling green consumers? A review of the evidence
and an empirical investigation. Journal of Business Research 46:465-480.
Diamond, R., M. Opitz, T. Hicks, B. Von Neida, and S. Herrera. 2006. Evaluating the energy
performance of the first generation of LEED-certified commercial buildings. Proceedings
of the 2006 Summer Study on Energy Efficiency in Buildings. American Council for an
Energy Efficient Economy.
DOE. 2012. Thermostat and Control Systems. Energy.gov.
<http://energy.gov/energysaver/articles/thermostats-and-control-systems>
Family Student Housing. 2011. Guide to living in family student housing. Residential and
Student Services Programs. UC Berkeley.
Fountain, M., G. Brager, and R. de Dear. 1996. Expectations of indoor climate control. Energy
and Buildings 24:179-182.
Gifford, H. 2009. A better way to rate green buildings. Northeast Sun.
Granade, H.C., J. Creyts, A. Derkach, P. Farese, S. Nyquist, and K. Ostrowski. 2009. Unlocking
energy efficiency in the U.S. economy: Executive summary. McKinsey and Company.
Green.Facilities Services. 2012. UC Berkeley LEED projects. <
http://www.facilities.berkeley.edu/GreenBuildings/LEED/UCB-LEED-projects-
2012_08_10.pdf>
Diana Y. Zheng LEED and Energy Use Spring 2013
20
Itron, Inc. 2006. California Commercial End-Use Survey (CEUS) Consultant Report. CEC-400-
2006-005. California Energy Commission.
Junnila, S., A. Horvath, and A. A. Guggemos. 2006. Life-cycle assessment of office buildings in
Europe and the United States. Journal of Infrastructure Systems 12:10-17.
Lee, W.L. 2012. Benchmarking energy use of building environmental assessment schemes.
Energy and Buildings 45:326-334.
Leslie, R. P. 2002. Capturing the daylight dividend in buildings: why and how? Building and
Environment 38:281-285.
Moschandreas, D.J. and R. M. Nuanual. 2008. Do certified sustainable buildings perform better
than similar conventional buildings? International Journal of Environment and
Sustainable Development 7:276–292.
Newsham, G. R., S. Mancini, and B.J. Birt. 2009. Do LEED-certified buildings save energy?
Yes, but… Energy and Buildings 41:897-905.
Pigg, S., M. Eilers, and J. Reed. 1996. Behavioral aspects of lighting and occupancy sensors in
privates o ces: a case study of a university o ce building. Proceedings of the 1996
ACEEE Summer Study on Energy E ciency in Buildings 8:8.161–8.171.
Scofield, J. H. 2009. Do LEED-certified buildings save energy? Not really. . . Energy and
Buildings 41:1386-1390.
Turner, C. and M. Frankel. 2008. Energy performance of LEED® for new construction
buildings. New Buildings Institute.
UC Berkeley. 2011. Campus Sustainability Report. <
http://sustainability.berkeley.edu/os/pages/reports/docs/2011_Campus_Sustainability_Re
port.pdf>
U.S. Energy Information Administration. 2012. EIA. <http://www.eia.gov>
U.S. Green Building Council. 2011. USGBC. <http://www.usgbc.org/>
Diana Y. Zheng LEED and Energy Use Spring 2013
21
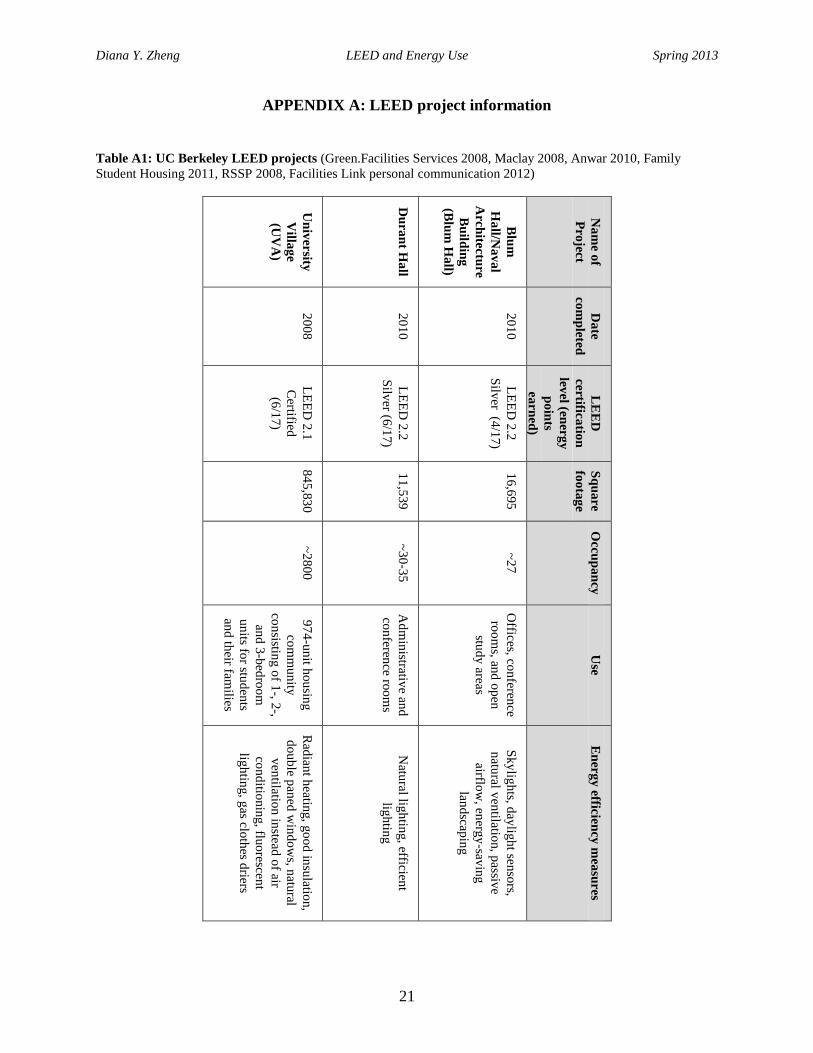
APPENDIX A: LEED project information
Table A1: UC Berkeley LEED projects (Green.Facilities Services 2008, Maclay 2008, Anwar 2010, Family
Student Housing 2011, RSSP 2008, Facilities Link personal communication 2012)
Un
iver
sity
Villa
ge
(UV
A)
Du
ran
t Ha
ll
Blu
m
Ha
ll/Na
va
l
Arc
hitectu
re
Bu
ildin
g
(Blu
m H
all)
Na
me o
f
Pro
ject
20
08
20
10
20
10
Da
te
com
pleted
LE
ED
2.1
Certified
(6/1
7)
LE
ED
2.2
Silv
er (6/1
7)
LE
ED
2.2
Silv
er (4/1
7)
LE
ED
certifica
tion
level (en
erg
y
po
ints
earn
ed)
84
5,8
30
11
,539
16
,695
Sq
ua
re
foo
tag
e
~2
80
0
~3
0-3
5
~2
7
Occ
up
an
cy
97
4-u
nit h
ou
sing
com
mu
nity
con
sisting
of 1
-, 2-,
and
3-b
edro
om
un
its for stu
den
ts
and
their fam
ilies
Ad
min
istrative an
d
con
ference ro
om
s
Offices, co
nferen
ce
roo
ms, an
d o
pen
stud
y areas
Use
Rad
iant h
eating
, go
od
insu
lation
,
do
ub
le pan
ed w
ind
ow
s, natu
ral
ven
tilation
instead
of air
con
ditio
nin
g, flu
orescen
t
ligh
ting
, gas clo
thes d
riers
Natu
ral ligh
ting
, efficient
ligh
ting
Sk
ylig
hts, d
aylig
ht sen
sors,
natu
ral ven
tilation, p
assive
airflow
, energ
y-sav
ing
land
scapin
g
En
ergy
efficiency
mea
sures


![SUSTAINABLE BUILDING DE and HVAC SIGN LEED · LEED Accredited Professionals (APs) has topped 131,000. USGBC’s LEED version 3 (v3)—includes LEED 2009[1], a new LEED ac-creditation](https://img.pdfslide.us/doc/110x75/5f0aaf2e7e708231d42cd46c/sustainable-building-de-and-hvac-sign-leed-leed-accredited-professionals-aps-has.jpg)