Embed Size (px)
Citation preview
Does “Just-in-time” Mean “Right-next-door”? Evidence from the Auto Industry on the Spatial Concentration of Supplier Net-works Thomas H. Klier∗
1. Introduction Lean manufacturing was pioneered by Toyota Motor Company in Japan during the 1950s. It has since become the standard for many manufacturing companies in Japan and around the world. This produc-tion system tries to improve on the type of mass production systems that have been prominent in the post-war period. Instead of organizing pro-duction according to a pre-set schedule it operates on the premise of a so-called “pull system”, whereby the flow of materials and products through the various stages of production is triggered by the customer. In addition, the production process itself is subject to continuous im-provement efforts. The GM strike during June and July of 1998 showed the extent to which lean manufacturing production methods, such as efforts to keep inventories low and reduce the number of parts suppliers, have taken hold in the U.S. auto sector. This paper addresses the question if the application of this new pro-duction system leads to tight geographical linkages between assembler and supplier plants. Proponents of that argument suggest that close linkages across the supply chain, such as frequent interactions and deliv-ery work most effectively when supplying and receiving plants are in reasonably close proximity (Estall 1985, Kenney and Florida 1992; Mair
∗ Federal Reserve Bank of Chicago, 230 S. LaSalle Street, Chicago, Illinois 60604. [email protected]. The author would like to thank Mike Rorke, Loula Merkel and George Simler for excellent research assistance. The views expressed in this paper are those of the author and do not necessarily reflect opinions of either the Federal Reserve Bank of Chi-cago or the Federal Reserve System. The paper was originally presented at the Presidential Symposium of the 30th Annual MCRSA Meetings in Minneapolis, MN, June 10-12, 1999.
JRAP (2000)30:1
42 Klier
1992; Dyer 1994). They point to the degree of spatial clustering observed in Japan. However, there is evidence that dense spatial clustering is not a necessary outcome of lean manufacturing applications (Smith and Flor-ida 1994; Glassmeier and McCluskey 1997). If that is the case, what ulti-mately matters is the quality of transportation infrastructure in combina-tion with the capability of delivery management systems in assuring predictable on-time arrival of goods. This might well be achieved with no significant increase in clustering.
2. Literature Review
The issues of geographic concentration in U.S. manufacturing have recently seen an increase of attention (Krugman 1991, Ellison and Glae-ser 1997, and Hewings et al. 1998).1 Several studies have documented trends in plant location choices for the U.S. auto industry (Rubenstein 1992; McAlinden and Smith 1993; Rubenstein 1997). They find that since the mid-70s the assembly plants for light vehicles have re-concentrated in the Midwest and Southeast of the country. Rubenstein attributes that development to the demise of the branch plant assembly system, under which identical models were produced around the country at various assembly plants that were located close to population centers. Plant lo-cation trends in the supplier industry are not as clear-cut. Apparently there has been a migration of labor-intensive parts production to the south and south of the border; however, parts requiring highly skilled labor, such as engines, transmissions, and large stampings, have re-mained heavily concentrated in the Midwest. That is especially true for parts plants operated by the auto assemblers themselves (so-called cap-tive suppliers) (see Table 1).
Table 1. Distribution of Captive Parts Plants
Assembly Share of its Captive Suppliers in MI, IN, and OH Company % plants % employees
GM 69.8 73.8 Chrysler 82.3 86.9 Ford 84.6 85.5
Overall 75.6 77.6
Source: ELM International, Inc., 1997, The ELM GUIDE Supplier Database, East Lansing, Mi, database file, and author’s calculations.
1 Alfred Marshall (1920) identified three reasons for localization of industry: an industrial center allows a pooled labor market for workers with specialized skills; an industrial center allows provision of nontraded inputs specific to an industry in greater variety and at lower cost; and, an industrial center generates technological spillovers as information flows more easily locally (see Krugman 1991, pp 36-37).
Spatial Concentration of Supplier Networks 43
A set of studies specifically investigates possible effects of lean manufacturing on the spatial structure of the auto supplier industry. The results are ambiguous. Rubenstein and Reid (1987) and Rubenstein (1988) analyze the changing supplier distribution of U.S. motor vehicle parts suppliers. Their analysis of supplier plants located in Ohio cannot establish a clear-cut effect of lean manufacturing on plant location, yet the authors find evidence for a change in the locational pattern after 1970. Most of the existing analysis of the location effects of lean manu-facturing, however, concerns Japanese-owned manufacturing establish-ments within the U.S. This is not surprising, as these plants are generally set up to meet the demands of lean manufacturing based assembly plants. In addition, most of them represent new plants established at newly developed, so-called greenfield sites. As the location decision for these plants does not involve a re-location, it makes them a preferred object of study.
Both Kenney and Florida (1992) and Reid (1994) find support for very local clustering effects. Kenney and Florida (1992) report from a 1998 survey of about 70 Japanese-owned auto supplier plants in the auto corridor and note that 41.4% are located within 100 miles of their respec-tive assembly plant customers. Reid (1994) tested the effect of just-in-time inventory control on spatial clustering in observing the level of in-puts purchased locally for a set of 239 Japanese-owned manufacturing plants located in the U.S. The author performs this analysis at three dif-ferent levels of aggregation: at the county, state and national level. He finds differences in the proportion of material inputs purchased locally between plants that use just-in-time inventory control and those that don’t only at the county-level. This result suggests spatial clustering ef-fects on a very local scale.
The following set of papers suggests clustering to occur at a more re-gional scale. Woodward (1992) investigates what determines the loca-tion of Japanese manufacturing start-up plants in the U.S. While his ob-servations include plants from many different manufacturing industries, the author estimates a model specification for 250 plants that located be-tween 1980 and 1989 in the Michigan-Tennessee automotive corridor. He finds the presence of an interstate connection linking counties to ma-jor markets to be crucial in determining plant location. Smith and Flor-ida (1994) test for the existence of agglomeration effects in examining location decisions of over 400 Japanese-affiliated manufacturing estab-lishments in automotive related industries. They analyze all U.S. coun-ties as well as an automotive corridor subset, and find that Japanese af-filiated suppliers prefer to locate in proximity to Japanese automotive assemblers. However, the authors measure proximity by the distance
44 Klier
between a supplier plant and the closest assembly plant and do not dif-ferentiate degrees of proximity, say 100 versus 400 miles.2 Lilley and DeFranco (1999) study the production of Formula One racing cars in the UK’s South Midlands and find that being able to deliver within one day largely explains the spatial pattern of supplier locations in that very high-end segment of auto manufacturing. Dyer (1994) reports that in the U.S., independent suppliers to GM are on average located almost five times further away from assembly plants than their counterparts supply-ing Toyota in Japan. Unfortunately, the author does not report informa-tion on differences between Toyota’s supplier networks in the U.S. and Japan.
3. Data
This study presents evidence on the spatial characteristics of inde-pendent auto supplier plants located in the U.S. by focussing on actual linkages between supplier and assembly plants. In order to investigate data at that level of detail, publicly available data are not much help. The obvious data source, the Census of Manufactures, can offer only in-complete information, because it does not distinguish between original equipment manufacturers and producers of replacement parts. In addi-tion, because of the large variety of parts that make up an automobile, supplier plants in the auto industry are classified among eighteen of the 20 two-digit SIC categories. Finally, census data cannot establish infor-mation about linkages between supplier plants and their customers.
The basis for the data analyzed in this study is the ELM Guide sup-plier database, a set of plant-level data on the auto supplier industry put together by a private company in Michigan.3 The data represent the year 1997 and cover 3,425 independent supplier plants located in the U.S.4 As the database identifies customers for the individual supplier plants, I was able to categorize these plants by supplier tier: 2,008 plants were found to be tier 1 suppliers, i.e. supplier plants that ship their products exclusively to auto assembly plants and not to other supplier plants or other customers; 1,292 were classified as mixed-tier supplier, i.e., ship-ping to other supplier plants and/or non-automotive assemblers as well as auto assembly plants; 50 observations had to be excluded from the
2 They report a median distance between assembler and supplier of 486 miles. 3 It identifies for each of these the address, the list of products produced as well as the pro-duction processes used, employment, as well as the plants’ customers (at the company level). 4 An earlier paper (Klier 1995) includes a much more limited analysis of the same issues for a comparatively small set of independent supplier plants operational in 1993. The analysis presented here does not include the so-called captive supplier plants.
Spatial Concentration of Supplier Networks 45
analysis as they did not provide information on which customer(s) they were shipping to.5
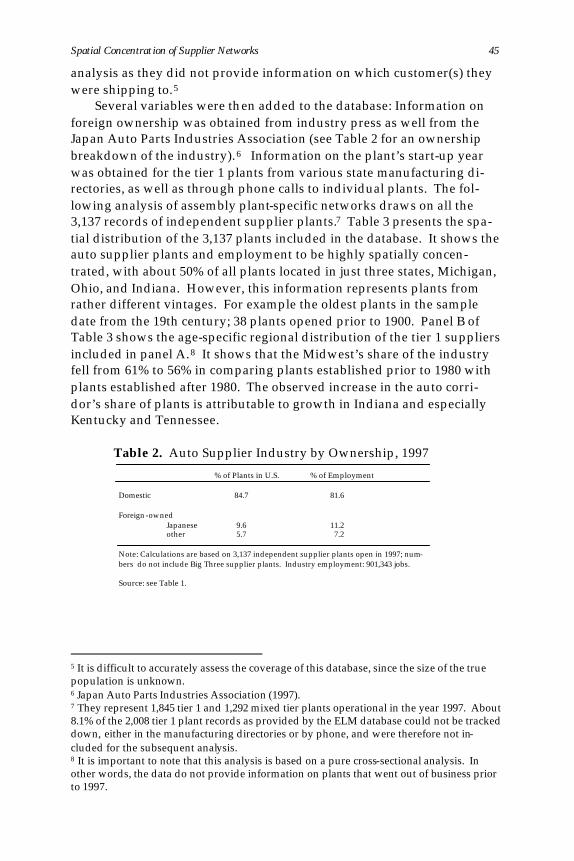
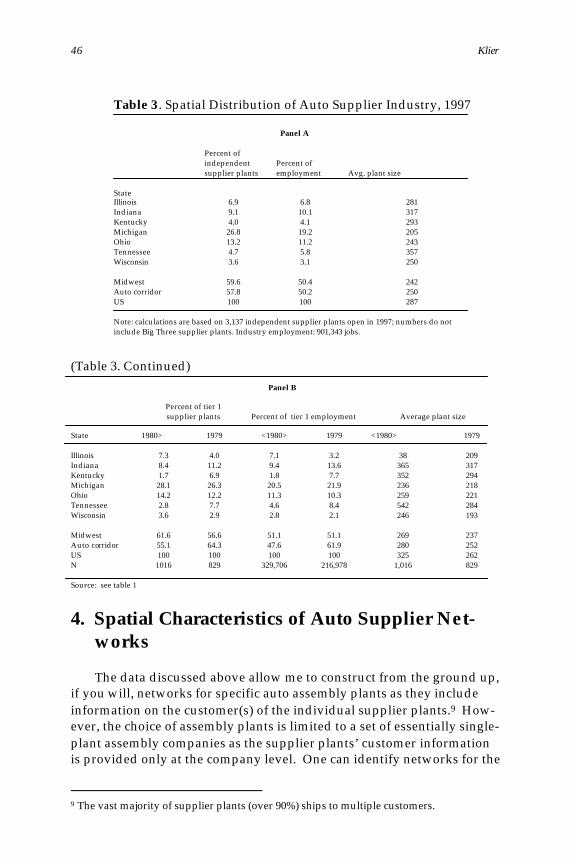
Several variables were then added to the database: Information on foreign ownership was obtained from industry press as well from the Japan Auto Parts Industries Association (see Table 2 for an ownership breakdown of the industry).6 Information on the plant’s start-up year was obtained for the tier 1 plants from various state manufacturing di-rectories, as well as through phone calls to individual plants. The fol-lowing analysis of assembly plant-specific networks draws on all the 3,137 records of independent supplier plants.7 Table 3 presents the spa-tial distribution of the 3,137 plants included in the database. It shows the auto supplier plants and employment to be highly spatially concen-trated, with about 50% of all plants located in just three states, Michigan, Ohio, and Indiana. However, this information represents plants from rather different vintages. For example the oldest plants in the sample date from the 19th century; 38 plants opened prior to 1900. Panel B of Table 3 shows the age-specific regional distribution of the tier 1 suppliers included in panel A.8 It shows that the Midwest’s share of the industry fell from 61% to 56% in comparing plants established prior to 1980 with plants established after 1980. The observed increase in the auto corri-dor’s share of plants is attributable to growth in Indiana and especially Kentucky and Tennessee.
Table 2. Auto Supplier Industry by Ownership, 1997
% of Plants in U.S. % of Employment
Domestic 84.7 81.6
Foreign-owned
Japanese 9.6 11.2 other 5.7 7.2
Note: Calculations are based on 3,137 independent supplier plants open in 1997; num-bers do not include Big Three supplier plants. Industry employment: 901,343 jobs.
Source: see Table 1.
5 It is difficult to accurately assess the coverage of this database, since the size of the true population is unknown. 6 Japan Auto Parts Industries Association (1997). 7 They represent 1,845 tier 1 and 1,292 mixed tier plants operational in the year 1997. About 8.1% of the 2,008 tier 1 plant records as provided by the ELM database could not be tracked down, either in the manufacturing directories or by phone, and were therefore not in-cluded for the subsequent analysis. 8 It is important to note that this analysis is based on a pure cross-sectional analysis. In other words, the data do not provide information on plants that went out of business prior to 1997.
46 Klier
Table 3 . Spatial Distribution of Auto Supplier Industry, 1997
Panel A
State
Percent of independent supplier plants
Percent of employment
Avg. plant size
Illinois 6.9 6.8 281 Indiana 9.1 10.1 317 Kentucky 4.0 4.1 293 Michigan 26.8 19.2 205 Ohio 13.2 11.2 243 Tennessee 4.7 5.8 357 Wisconsin
3.6 3.1 250
Midwest 59.6 50.4 242 Auto corridor 57.8 50.2 250 US
100 100 287
Note: calculations are based on 3,137 independent supplier plants open in 1997; numbers do not include Big Three supplier plants. Industry employment: 901,343 jobs.
(Table 3. Continued)
Panel B
Percent of tier 1 supplier plants
Percent of tier 1 employment
Average plant size
State <1980> 1979 <1980> 1979 <1980> 1979
Illinois 7.3 4.0 7.1 3.2 38 209 Indiana 8.4 11.2 9.4 13.6 365 317 Kentucky 1.7 6.9 1.8 7.7 352 294 Michigan 28.1 26.3 20.5 21.9 236 218 Ohio 14.2 12.2 11.3 10.3 259 221 Tennessee 2.8 7.7 4.6 8.4 542 284 Wisconsin
3.6 2.9 2.8 2.1 246 193
Midwest 61.6 56.6 51.1 51.1 269 237 Auto corridor 55.1 64.3 47.6 61.9 280 252 US 100 100 100 100 325 262 N 1016 829 329,706 216,978 1,016 829
Source: see table 1
4. Spatial Characteristics of Auto Supplier Net-works
The data discussed above allow me to construct from the ground up,
if you will, networks for specific auto assembly plants as they include information on the customer(s) of the individual supplier plants.9 How-ever, the choice of assembly plants is limited to a set of essentially single-plant assembly companies as the supplier plants’ customer information is provided only at the company level. One can identify networks for the
9 The vast majority of supplier plants (over 90%) ships to multiple customers.
Spatial Concentration of Supplier Networks 47
following assembly plants: Honda of America, which started operating its Marysville, Ohio, plant in 1982 (and added a second assembly plant in nearby East Liberty, Ohio, in 1989); Nissan, which opened an assembly plant in Smyrna, Tennessee, in 1983; NUMMI, the joint venture between Toyota and GM, located in Fremont, California, and operational since 1984; AutoAlliance, which started as a joint venture between Ford and Mazda in 1987, located in Flat Rock, Michigan; Diamond-Star, conceived as a Mitsubishi-Chrysler joint venture, located in Normal, Illinois, which started production in 1988; Toyota, which opened its Georgetown, Ken-tucky, plant in 1988; SIA, the Subaru-Isuzu joint venture opened in La-fayette, Indiana, in 1989; Saturn, GM’s attempt to capture the efficiencies of lean manufacturing, which started production in 1990 and is located in Spring Hill, Tennessee; and BMW and Mercedes-Benz which recently opened assembly plants in South Carolina (1994) and Alabama (1997), respectively.
By nature of the data constraint, this paper analyzes the supplier networks of all foreign-owned assembly plants in the US that opened since 1980 plus GM’s Saturn plant. As has been reported above, the vast majority of these plants were built on greenfield sites with the intention of using the best practice manufacturing techniques. If lean manufactur-ing has had an effect on supplier plant locations, one would expect to find it there.10
The paper identifies the spatial characteristics of ten supplier net-works and focuses on cross-sectional variation among them. Underlying this approach is a standard location theory model, whereby a plant chooses its location in order to minimize the sum of transportation and production cost, given the location of its customer(s).
Within such a framework, implementation of lean manufacturing production techniques is expected to put greater importance on trans-portation costs as a result of more frequent deliveries and smaller lot sizes. What is unclear is if that effect is large enough to affect the plant location choice. In addition, productivity increases in the transportation sector combined with the existing stock of transportation infrastructure might keep the spatial effects of lean manufacturing rather small.
Concentration of plants and employment
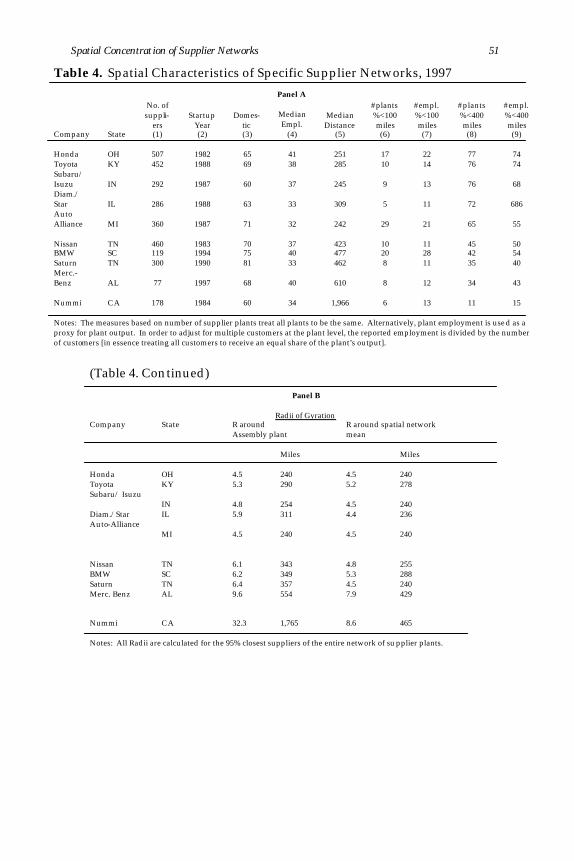
Table 4 presents characteristics of the networks identified from the database. Each network includes all independent supplier plants that
10 The data don’t allow for construction of networks of individual Big Three assembly plant networks. See Klier (1999) for an alternative approach for the case of Ford, that shows a marked increase concentration of Ford suppliers in southern Michigan in comparing the two decades 1970-1980 and 1983-1993.
48 Klier
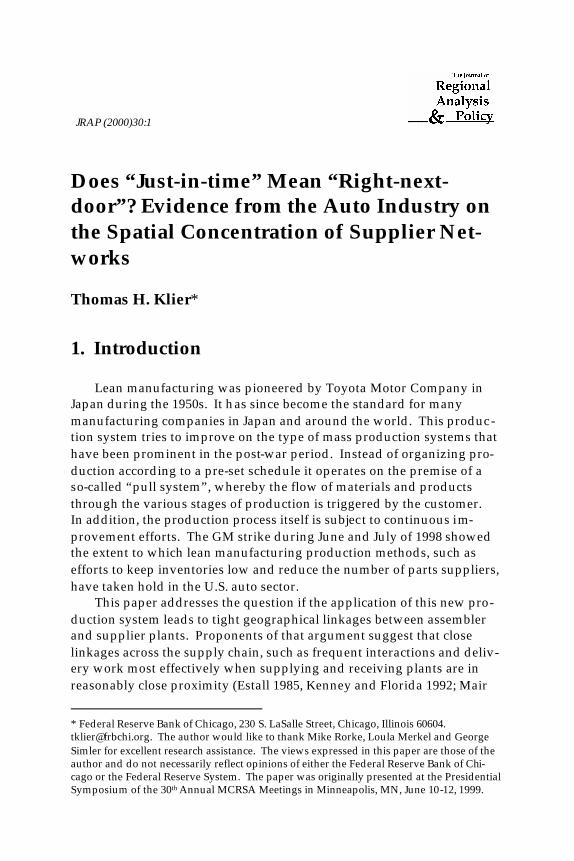
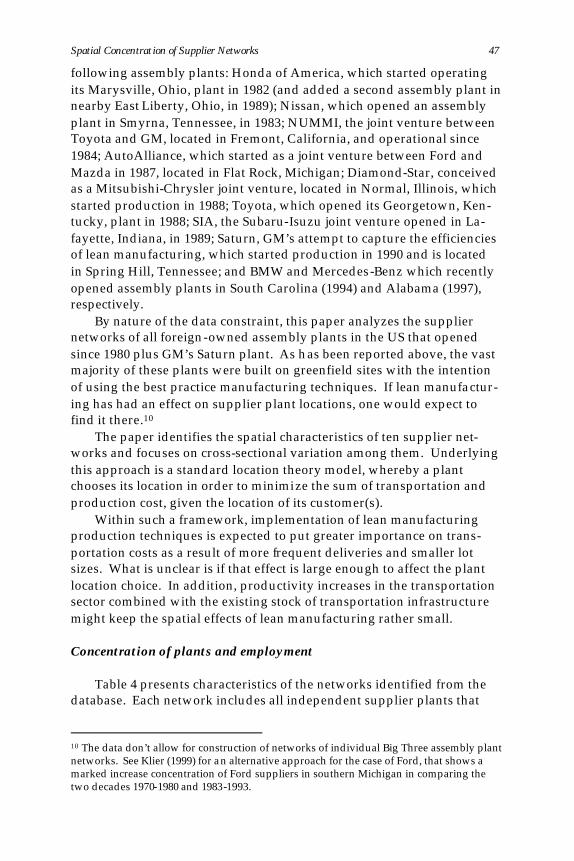
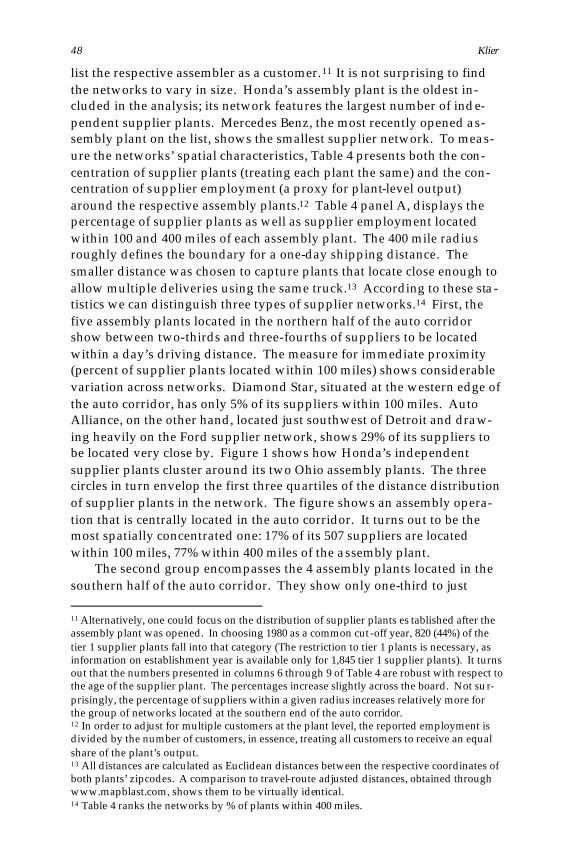
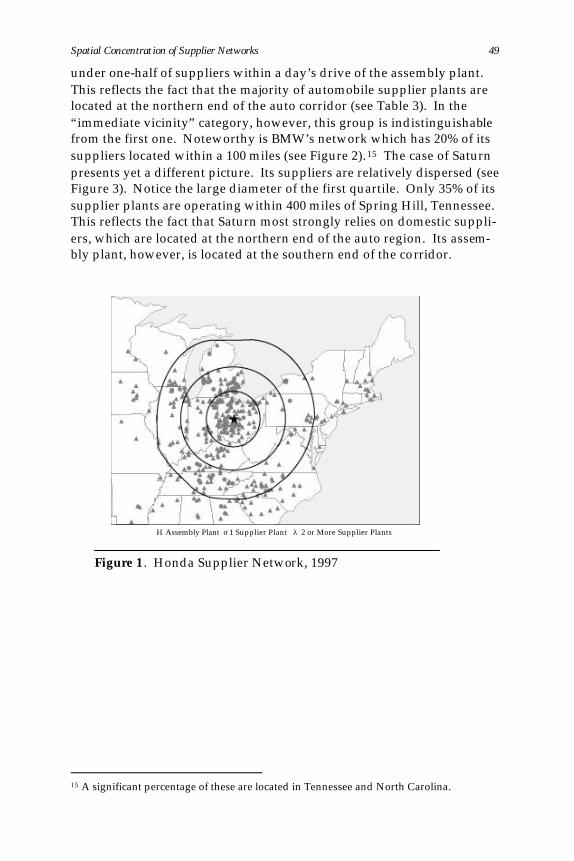
list the respective assembler as a customer.11 It is not surprising to find the networks to vary in size. Honda’s assembly plant is the oldest in-cluded in the analysis; its network features the largest number of inde-pendent supplier plants. Mercedes Benz, the most recently opened as-sembly plant on the list, shows the smallest supplier network. To meas-ure the networks’ spatial characteristics, Table 4 presents both the con-centration of supplier plants (treating each plant the same) and the con-centration of supplier employment (a proxy for plant-level output) around the respective assembly plants.12 Table 4 panel A, displays the percentage of supplier plants as well as supplier employment located within 100 and 400 miles of each assembly plant. The 400 mile radius roughly defines the boundary for a one-day shipping distance. The smaller distance was chosen to capture plants that locate close enough to allow multiple deliveries using the same truck.13 According to these sta -tistics we can distinguish three types of supplier networks.14 First, the five assembly plants located in the northern half of the auto corridor show between two-thirds and three-fourths of suppliers to be located within a day’s driving distance. The measure for immediate proximity (percent of supplier plants located within 100 miles) shows considerable variation across networks. Diamond Star, situated at the western edge of the auto corridor, has only 5% of its suppliers within 100 miles. Auto Alliance, on the other hand, located just southwest of Detroit and draw-ing heavily on the Ford supplier network, shows 29% of its suppliers to be located very close by. Figure 1 shows how Honda’s independent supplier plants cluster around its two Ohio assembly plants. The three circles in turn envelop the first three quartiles of the distance distribution of supplier plants in the network. The figure shows an assembly opera-tion that is centrally located in the auto corridor. It turns out to be the most spatially concentrated one: 17% of its 507 suppliers are located within 100 miles, 77% within 400 miles of the assembly plant.
The second group encompasses the 4 assembly plants located in the southern half of the auto corridor. They show only one-third to just 11 Alternatively, one could focus on the distribution of supplier plants es tablished after the assembly plant was opened. In choosing 1980 as a common cut-off year, 820 (44%) of the tier 1 supplier plants fall into that category (The restriction to tier 1 plants is necessary, as information on establishment year is available only for 1,845 tier 1 supplier plants). It turns out that the numbers presented in columns 6 through 9 of Table 4 are robust with respect to the age of the supplier plant. The percentages increase slightly across the board. Not sur-prisingly, the percentage of suppliers within a given radius increases relatively more for the group of networks located at the southern end of the auto corridor. 12 In order to adjust for multiple customers at the plant level, the reported employment is divided by the number of customers, in essence, treating all customers to receive an equal share of the plant’s output. 13 All distances are calculated as Euclidean distances between the respective coordinates of both plants’ zipcodes. A comparison to travel-route adjusted distances, obtained through www.mapblast.com, shows them to be virtually identical. 14 Table 4 ranks the networks by % of plants within 400 miles.
Spatial Concentration of Supplier Networks 49
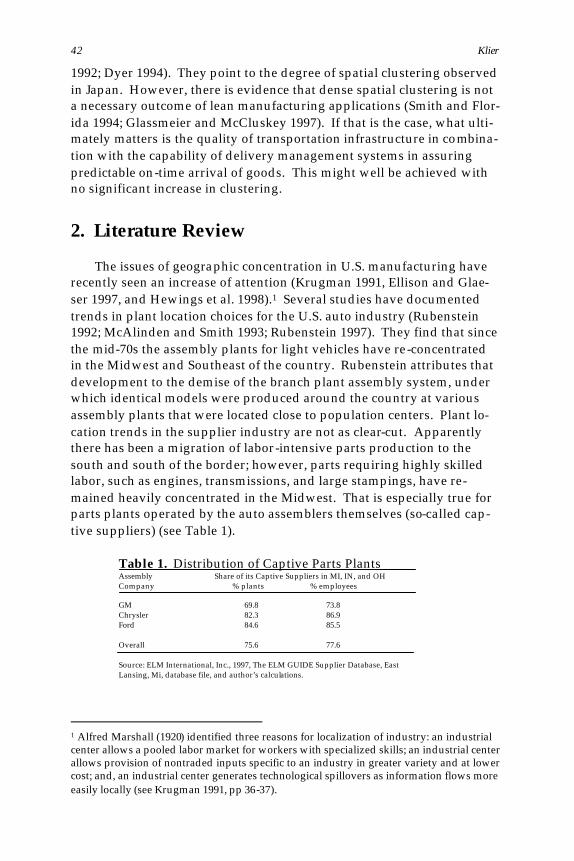
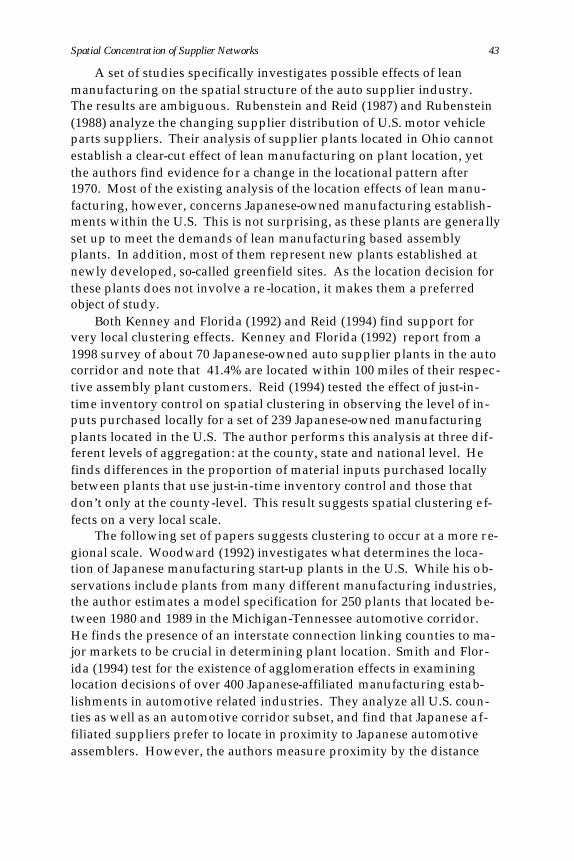
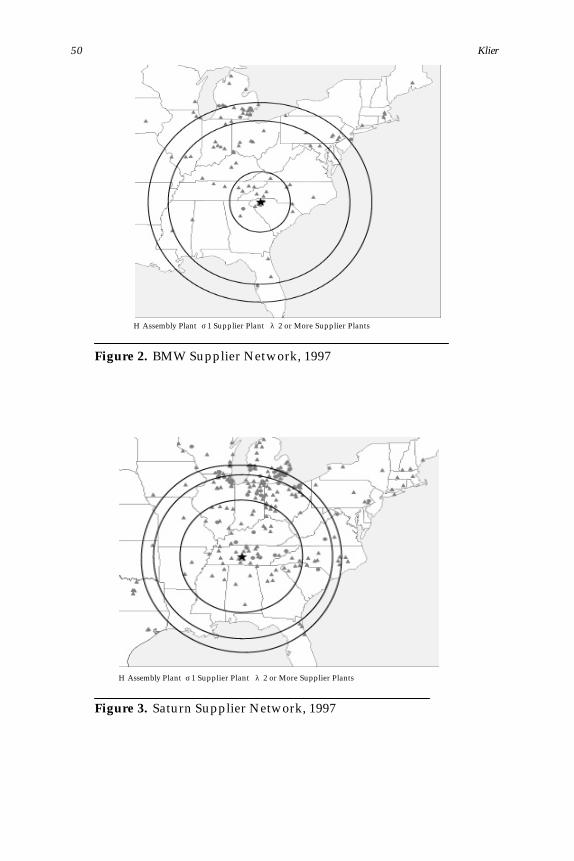
under one-half of suppliers within a day’s drive of the assembly plant. This reflects the fact that the majority of automobile supplier plants are located at the northern end of the auto corridor (see Table 3). In the “immediate vicinity” category, however, this group is indistinguishable from the first one. Noteworthy is BMW’s network which has 20% of its suppliers located within a 100 miles (see Figure 2).15 The case of Saturn presents yet a different picture. Its suppliers are relatively dispersed (see Figure 3). Notice the large diameter of the first quartile. Only 35% of its supplier plants are operating within 400 miles of Spring Hill, Tennessee. This reflects the fact that Saturn most strongly relies on domestic suppli-ers, which are located at the northern end of the auto region. Its assem-bly plant, however, is located at the southern end of the corridor.
Η Assembly Plant σ 1 Supplier Plant λ 2 or More Supplier Plants
Figure 1 . Honda Supplier Network, 1997
15 A significant percentage of these are located in Tennessee and North Carolina.
50 Klier
Η Assembly Plant σ 1 Supplier Plant λ 2 or More Supplier Plants
Figure 2. BMW Supplier Network, 1997
Η Assembly Plant σ 1 Supplier Plant λ 2 or More Supplier Plants
Figure 3. Saturn Supplier Network, 1997
Spatial Concentration of Supplier Networks 51
Table 4. Spatial Characteristics of Specific Supplier Networks, 1997 Company
State
No. of suppli-
ers (1)
Startup Year (2)
Domes-tic (3)
Panel A
Median Empl.
(4)
Median Distance
(5)
#plants %<100 miles (6)
#empl. %<100 miles (7)
#plants %<400 miles (8)
#empl. %<400 miles (9)
Honda OH 507 1982 65 41 251 17 22 77 74 Toyota KY 452 1988 69 38 285 10 14 76 74 Subaru/ Isuzu
IN
292
1987
60
37
245
9
13
76
68
Diam./ Star
IL
286
1988
63
33
309
5
11
72
686
Auto Alliance
MI
360
1987
71
32
242
29
21
65
55
Nissan TN 460 1983 70 37 423 10 11 45 50 BMW SC 119 1994 75 40 477 20 28 42 54 Saturn TN 300 1990 81 33 462 8 11 35 40 Merc.-Benz
AL
77
1997
68
40
610
8
12
34
43
Nummi CA 178 1984 60 34 1,966 6 13 11 15 Notes: The measures based on number of supplier plants treat all plants to be the same. Alternatively, plant employment is used as a proxy for plant output. In order to adjust for multiple customers at the plant level, the reported employment is divided by the number of customers [in essence treating all customers to receive an equal share of the plant’s output].
(Table 4. Continued)
Panel B
Radii of Gyration
Company State R around Assembly plant
R around spatial network mean
Miles Miles Honda OH 4.5 240 4.5 240 Toyota KY 5.3 290 5.2 278 Subaru/ Isuzu
IN 4.8
254
4.5
240
Diam./Star IL 5.9 311 4.4 236 Auto-Alliance
MI 4.5
240
4.5
240
Nissan
TN
6.1
343
4.8
255
BMW SC 6.2 349 5.3 288 Saturn TN 6.4 357 4.5 240 Merc. Benz
AL 9.6 554 7.9 429
Nummi CA 32.3 1,765 8.6 465 Notes: All Radii are calculated for the 95% closest suppliers of the entire network of supplier plants.
52 Klier
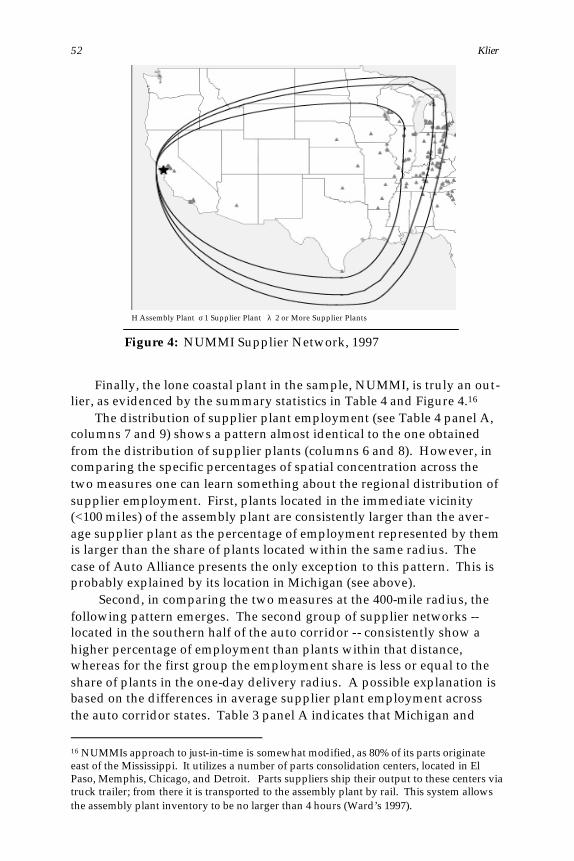
Η Assembly Plant σ 1 Supplier Plant λ 2 or More Supplier Plants
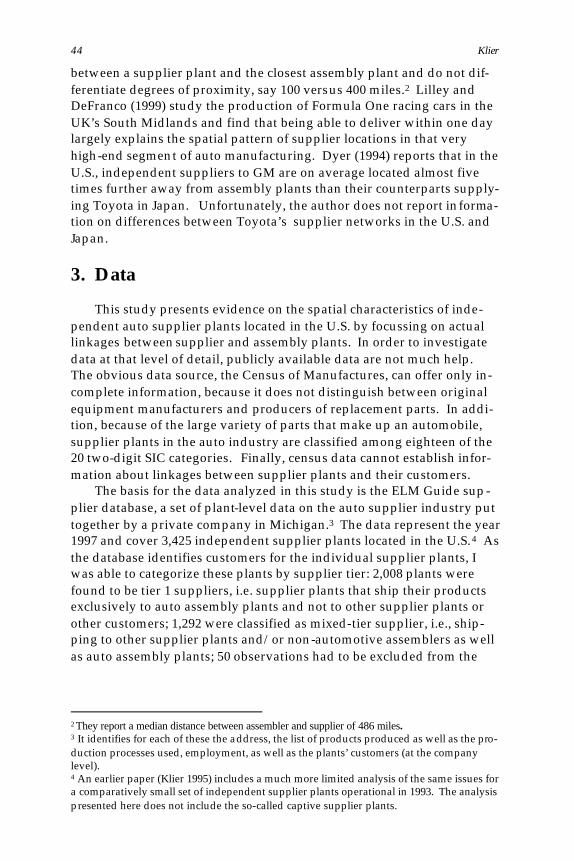
Figure 4: NUMMI Supplier Network, 1997
Finally, the lone coastal plant in the sample, NUMMI, is truly an out-lier, as evidenced by the summary statistics in Table 4 and Figure 4.16
The distribution of supplier plant employment (see Table 4 panel A, columns 7 and 9) shows a pattern almost identical to the one obtained from the distribution of supplier plants (columns 6 and 8). However, in comparing the specific percentages of spatial concentration across the two measures one can learn something about the regional distribution of supplier employment. First, plants located in the immediate vicinity (<100 miles) of the assembly plant are consistently larger than the aver-age supplier plant as the percentage of employment represented by them is larger than the share of plants located within the same radius. The case of Auto Alliance presents the only exception to this pattern. This is probably explained by its location in Michigan (see above).
Second, in comparing the two measures at the 400-mile radius, the following pattern emerges. The second group of supplier networks -- located in the southern half of the auto corridor -- consistently show a higher percentage of employment than plants within that distance, whereas for the first group the employment share is less or equal to the share of plants in the one-day delivery radius. A possible explanation is based on the differences in average supplier plant employment across the auto corridor states. Table 3 panel A indicates that Michigan and
16 NUMMIs approach to just-in-time is somewhat modified, as 80% of its parts originate east of the Mississippi. It utilizes a number of parts consolidation centers, located in El Paso, Memphis, Chicago, and Detroit. Parts suppliers ship their output to these centers via truck trailer; from there it is transported to the assembly plant by rail. This system allows the assembly plant inventory to be no larger than 4 hours (Ward’s 1997).
Spatial Concentration of Supplier Networks 53
Ohio, the two states hosting the largest number of supplier plants in the sample -- together they account for 40% of all plants -- represent the two states in the auto corridor with the smallest average plant size. Together they account for only 30.4% of industry employment. Panel B of the same table shows that pattern to hold for both old and new tier 1 plants. While average plant size has fallen for tier 1 supplier plants opened since 1980 for all the states reported, the smaller plants in both time periods reside in the northern end of the auto region.
To summarize so far, the plant- and employment-based measures of spatial concentration produce almost identical results, suggesting that the distribution of plant locations is a good proxy for the distribution of output within the network. The distinguishing criterion among the vari -ous networks seems to be the share of supplier plants located within a day’s driving distance. This suggests that lean manufacturing, places a greater weight on regional versus local agglomeration within the auto corridor. In that context it is interesting to note that this paper finds less evidence of local spatial concentration than suggested by earlier litera-ture. Specifically, the highest concentration of Japanese-owned suppliers around Japanese assemblers applies to the Honda network, with 29.3% of Japanese-owned suppliers within 100 miles of the assembly plant, fol -lowed by Toyota (22.9%) and Auto Alliance (22.5%). That compares to the 41% reported by Kenney and Florida (1992). Radius of Gyration
Complementing the analysis from above, the paper also presents a measure of cluster size for the individual supplier networks. Borrowing from percolation theory, a “radius of gyration” measure is reported (Keitt et al. 1997). It controls for irregular shapes inherent in the spatial distribution of networks and measures the average Euclidean distance of a cluster of points – in this case a supplier plant network -- from their spatial mean. It is defined as follows:
where x and y are the mean coordinates of the plants in the network, x i and yi are the coordinates of the ith supplier plant in the network, and n is the total number of plants in the network.
Table 4 Panel B reports two different radii of gyration. In addition, as the radii are measured in degrees, it also reports a translation into miles. The first radius measure averages distance from the coordinates of the assembly plant, whereas the second radius measure calculates the
221
)y-yi(+)x-xi(n
i1/n=R ∑
= (1)

54 Klier
average distance from the spatial mean of all the supplier plants in the network. Finally, these calculations utilize information on only the clos -est 95% of supplier plants within each network in order to minimize the distorting effects of outliers.
Consistent with the spatial measures reported earlier, the radius of gyration measured around the location of the assembly plant shows supplier networks increasing in spatial extension for assembly plants located in the southern half of the auto corridor. The second radius of gyration reported measures the extension of a network relative to its own spatial mean. In comparing these two measures two general infer-ences can be drawn. First, the spatial extension of networks, as meas-ured by the average distance between a network’s supplier plants and its spatial mean is remarkably similar across all networks. With the excep-tion of Mercedes Benz and NUMMI, the radii are all within the 240-290 mile range. Second, if both radius of gyration measures show a similar value, one can infer that the assembly plant is located at or very close to the spatial mean of its suppliers. With the exception of Diamond-Star -- located at the western fringe of the auto corridor -- that applies to the remaining four networks of the assembly plants located in the northern end of the auto corridor (most notably Honda and Auto Alliance). The remaining five assembly plant networks are characterized by assembly plants not being located close to the spatial mean of the network, even though the extension of the networks is very similar to the ones in the first group.
5. Conclusion
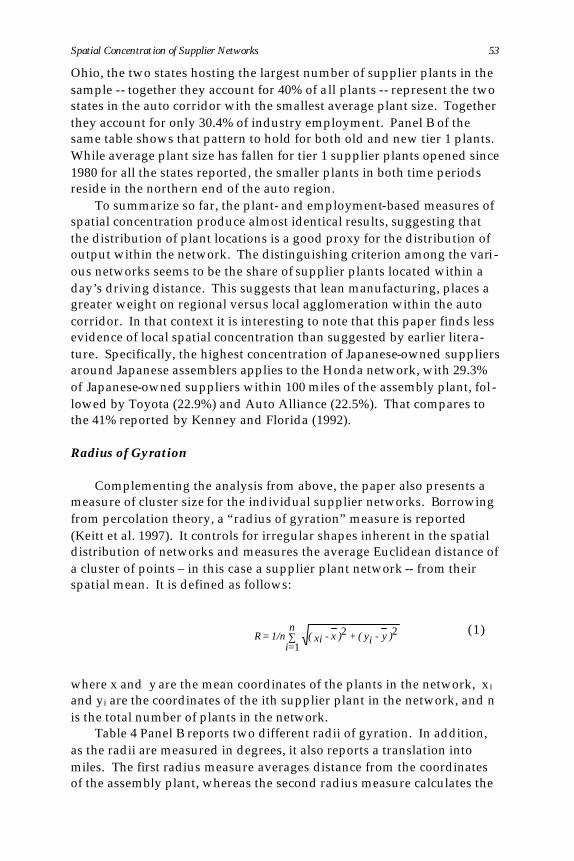
This paper set out to investigate the effects of lean manufacturing practices on the spatial configuration of supplier networks. In order to do that it uses data that allows to build assembly plant specific supplier networks from the ground up. The evidence thus obtained consistently supports the notion that the importance of access to transportation seems to outweigh the need for a location in the immediate vicinity of the cus-tomer plant (see figure 5). Rather than being able to have a large share of suppliers within very close range of the assembly plant, it seems impor-tant to have a large share within a day’s shipping distance (approxi-mately 400 miles). That finding highlights the importance of interstate access in the so-called I-65/I-75 auto corridor. Incidentally, interstate access plays an important role for east-west connectivity as well. For example, Toyota operates a car assembly plant in Georgetown, Ken-tucky, a recently opened light truck assembly plant in Princeton, Indiana, and an engine plant in Buffalo, West Virginia. All three of these are linked by Interstate 64. This illustrates the importance of highway access
Spatial Concentration of Supplier Networks 55
to assure timely delivery of shipments in an environment of just-in-time production.
σ 1 or more domestic suppliers Note: The figure shows only those parts of highways that intersect the auto corridor.
Figure 5. Importance of Highway Transportation for the Auto
Corridor, 1997 The evidence presented in this paper, points to the existence of re-
gional rather than local spillovers from locating an assembly facility. For example, in the case of the Mercedes assembly plant that opened 1993, the state of Alabama provided incentives worth about $250 million to attract that plant. However, the evidence on the spatial extension of supplier networks suggests that suppliers to Mercedes will locate not just in Alabama, but more likely in Tennessee, Kentucky, and even fur-ther north.17 By the end of 1997 only 34% of Mercedes’s suppliers were located within 400 miles of the assembly plant, and only 16.5 % of its supplier employment resided in Alabama.18 In short, this type of analy-sis suggests that subsidies that are offered by a state not in the auto cor-ridor are considerably less effective in terms of attracting a significant portion of the related supplier employment to that state.
17 See Elhance and Chapman (1992) who find similar evidence in analyzing the labor mar-ket of the Diamond -Star assembly plant in central Illinois. They find the labor market for that plant to cover a large geographical area in the U.S. stretching over 15 states. This, they take as evidence to suggest that the benefits of incentive packages intended to attract la rge manufacturing plants will not remain within the communities or states providing such incentives. 18 See Klier (1999).
56 Klier
References Commerce Register Inc. 1997. Massachusetts, Maine, New Hampshire, and Vermont
Directory of Manufacturers. Database Publishing Co. 1997. Arizona, and California Manufacturers Register. Dyer, J.H. 1994. Dedicated assets: Japan's manufacturing edge. Harvard Business
Review ovember-December: 174-178. Glassmeier, A. and R. McCluskey. 1987. U.S. auto parts production: an analysis
of the organization and location of a changing industry. Economics Geogra-phy 63: 142-159.
Hewings, G.J.D., P. Israilevich, G. Schindler and R. Graham. 1998. Interstate trade among Midwest economies. Chicago Fed Letter. Federal Reserve Bank of Chicago, May, Number 129.
Elhance, A.P. and M. Chapman. 1992. Labor market of a U.S.-Japanese automo-bile joint venture. Growth and Change 23(2): 160-182.
ELM International, Inc.. 1997. “The ELM GUIDE supplier database,” East Lans-ing, MI, database file.
Ellison G. and E.L. Glaeser. 1997. Geographic Concentration in U.S. Manufac-turing Industries: A Dartboard Approach. Journal of Political Economy 105(5): 889-927.
Estall, R.C. 1985. Stock control in manufacturing: the just-in-time system and its locational implications. Area 17:129-132.
Harris Publishing Co. 1997. Harris Illinois Industrial Directory. Japan Auto Parts Industries Association. 1998. Membership directory. Keitt, T, D. Urban and B. Milne. 1997. Detecting critical scales in fragmented
landscapes. Conservation Ecology 1(1): 4. [http://www.consecol.org./vol1/iss1/art4]
Kenney, M. and R. Florida. 1992. The Japanese transplants - production organi-zation and regional development. Journal of the American Planning Associa-tion 58(1): 21-38.
Klier, T. 1999. Agglomeration in the U.S. auto supplier industry. Economic Perspectives 23(1): 18-34
Klier, T. 1995. The geography of lean manufacturing: Recent evidence from the U.S. auto industry. Economic Perspectives 19(6): 2-17.
Klier, T. 1998. Geographic concentration in U.S. manufacturing: evidence from the U.S. auto supplier industry. Federal Reserve Bank of Chicago, working paper 98-17.
Krugman, P. 1991. Geography and Trade. Cambridge, Mass. MIT Press. Lilley, W. III and L. DeFranco. 1999. The Impact of the European Grands Prix.
Federation Internationale de l’Automobile. Mair, A. 1992. Just-in-time manufacturing and the spatial structure of the auto-
mobile industry: lessons from Japan. Tijdschrift voor Econ. en Soc. Geografie 82(2): 82-92.
Manufacturers' News Inc. 1997. Alabama, Georgia, Florida, Indiana, Iowa, Ken-tucky, Missouri, Nebraska, North Carolina, Ohio, Oklahoma, Pennsylvania, Texas, Virginia and Wisconsin Manufacturers Register.
Marshall, A. 1920. Principles of Economics. London: Macmillan.
Spatial Concentration of Supplier Networks 57
McAlinden, S. and B. Smith. 1993. The changing structure of the U.S. automo-tive parts industry. University of Michigan Transportation Research Insti-tute. UMTRI 93-6.
Pick Publications. 1997. Michigan Manufacturers Directory. Reid, N. 1994. Just-in-time inventory control and the economic integration of
Japanese-owned manufacturing plants with the county, state and national economies of the United States. Regional Studies 29(4): 345-355.
Rubenstein, J.M. 1997. The evolving geography of production - Is manufactur-ing activity moving out of the Midwest? Evidence from the auto industry. Assessing the Midwest Economy working paper SP-3. Federal Reserve Bank of Chicago.
Rubenstein, J.M. 1992. The changing U.S. Auto Industry - A geographical analysis . Routledge.
Rubenstein, J.M. 1988. Changing distribution of American motor-vehicle-parts suppliers. Geographical Review 18(3): 288-298.
Rubenstein, J.M. and N. Reid. 1987. Ohio's motor vehicle industry - industrial change and geographical implications. Miami University, Geographical Research Paper No. 1.
Smith, D. and R. Florida. 1994. Agglomeration and industrial location: An econometric analysis of Japanese-affiliated manufacturing establishments in automotive-related industries. Journal of Urban Economics.36(1): 23-41.
Smith Publishers & Printers. 1997. 1997 Directory of Tennessee Manufacturers. South Carolina Department of Commerce. 1997. 1997 South Carolina Industrial
Directory. Ward’s Communications. 1997. NUMMI requires returnables, but no deposit.
Ward’s Automotive Reports October 27:2. Ward's Communications. Ward's Automotive Yearbook. Detroit. Various years. Woodward, D.P. 1992. Locational determinants of Japanese manufacturing
start-ups in the United States. Southern Economic Journal 58(3): 690-708.