Embed Size (px)
Citation preview

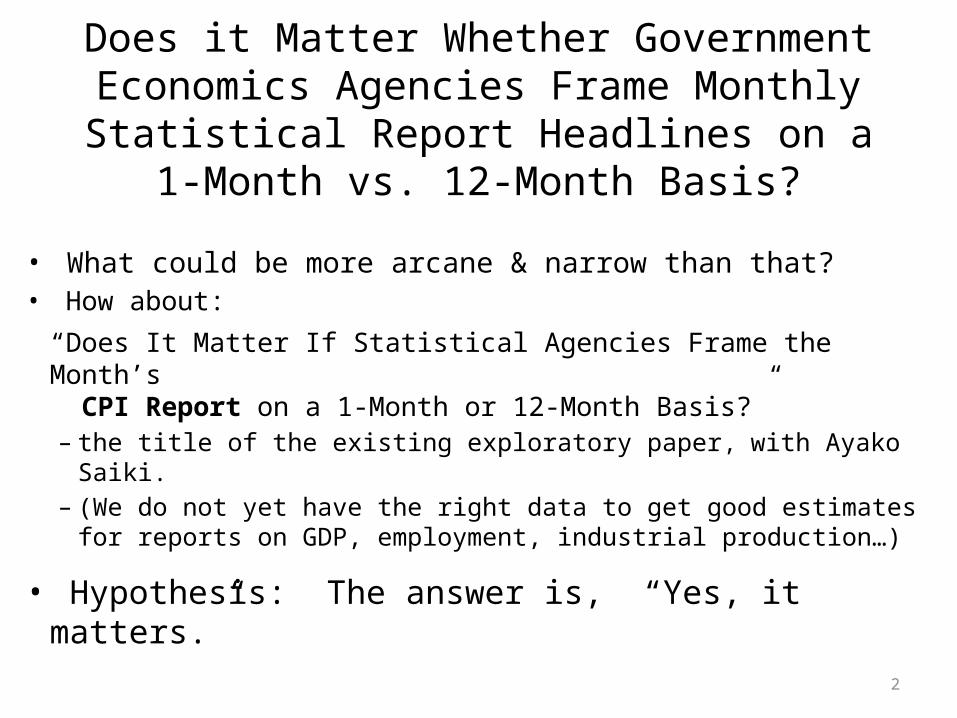
Does it Matter Whether Government Economics Agencies Frame
Monthly Statistical Report Headlines on a 1-Month vs. 12-Month Basis?
Jeff FrankelFaculty Research Seminar
November 19, 2014
2
Does it Matter Whether Government Economics Agencies Frame Monthly Statistical Report
Headlines on a 1-Month vs. 12-Month Basis?
• What could be more arcane & narrow than that?• How about:
“Does It Matter If Statistical Agencies Frame the Month’s CPI Report on a 1-Month or 12-Month Basis?”– the title of the existing exploratory paper, with Ayako Saiki.– (We do not yet have the right data to get good estimates for
reports on GDP, employment, industrial production…)
• Hypothesis: The answer is, “Yes, it matters.”

3
The hypothesis potentially has wide implications:
• A clean test of “framing”– à la Kahneman-Tversky– vs. the Efficient Markets Hypothesis.
• Relevant to suspicions that Americans may be more short-term oriented than others.– US financial markets – & possibly media and voters too.
• Implying a simple policy prescription to improve the accuracy/usefulness of economic perceptions– a prescription nobody else seems to have thought of,– and that BLS, BEA & the FRB could easily implement.

4
Announcements of economic statisticsby government agencies
In the US• Each month,
– the BLS announces change in employment; – the BLS announces CPI inflation rate;– the Fed announces industrial production.
• Each quarter,– the BEA announces GDP growth. Etc.
• The releases include the most recent month (or quarter) as well as the past time series, including any revisions of preceding periods.

5
The macroeconomics/finance literature on announcement effects
• Financial markets react to announcements.– in particular, to the “surprise” or “news” component,– i.e., the announcement measured relative to
what the market had been expecting.
• E.g., if the news is “CPI up” => bond prices fall. • Reactions are far more significant statistically
if the market prices are observed tightly before and after the announcement,– often ½ hour, rather than using daily data.– Reason: lots of other things happen during the day;
the noise drives out the significance of the announcement.

6
By “framing,” I mean:
• Which number do they put into the headline of the press release?
• Which number appears first in the body of the press release?
• Which number is featured prominently on the agency’s website?
How do official agencies frame the economic statistics they report each month?
With primary focus on the most recent month (or quarter)? or on the preceding 12 months?

7
Does it matter how official agencies frame the economic statistics they report each month?
• In theory, it should not matter at all.
• In the case of the CPI, the news component in the 1-month number is identical to the news component in the 12-month number
• because the CPI is not revised.• Standard tests control for market expectations.
• In the case of GDP and the other variables, the 1-year number includes revisions of previous periods.
• But, still, both forms are made available at the same time.– => markets should react to all the information.– What is in the headline should not matter.

8
How do official agencies frame the economic statistics they report each month?
• In the US, the emphasis is generally on the most recent month or quarter.
• Some other countries do it that way: focus on the last 12 months or 4 quarters.
Examples from 2014 releases:
• CPI of July, US vs. UK
• GDP of Q2, US vs. China
• Industrial Production, US vs. Switzerland

9
The BLS on Aug. 19, 2014, released the CPI for the preceding month.
The 1st sentence of the press release, as usual, gave the inflation rate for the month of July.
(The 2nd sentence gave the 12-month rate.)

10
As always, the BLS website also featured the changerelative to the preceding month
LATEST NUMBERS
Consumer Price Index (CPI):
+0.1% in Jul 2014
Unemployment Rate:
6.1% in Aug 2014
Payroll Employment:
+142,000(p) in Aug 2014
U.S. Bureau of Labor Statistics Follow Us | What's New | Release
Calendar | Site Map

11
The wire services & newspapers followed suit,reporting 1-month inflation
• BUSINESS By Bryan Cronan, Staff Writer AUGUST
19, 2014
Food costs up, energy costs down as inflation rises slightlyThe Bureau of Labor Statistics announced Tuesday that the Consumer Price Index rose 0.1 percent in July. One of the major drivers of the inflation increase was rising food prices, but they were offset by a dip in energy prices.

12
On the same day, the UK Office for National Statistics reported its CPI
The 1st sentence of the press release, as usual, gave the inflation rate over the preceding 12 months.

13
The wire services & newspapers followed suit,reporting 12-month inflation (without even specifying)
19 August 2014 The rate of UK inflation fell more than expected in July to 1.6%, as the cost of clothing and footwear, food and non-alchoholic drinks eased.
The Consumer Price Index fell to 1.6%, from 1.9% in June, according to the Office for National Statistics.

14
The wire services don’t always follow the lead of the government agency
• But they tend to.
• We code the framing by the agency:1 = Emphasis is clearly on the annual basis.2 = Some emphasis on annual version, but not consistently.3 = Precisely equal emphasis on both versions.4 = Some emphasis on monthly/quarterly basis, but not consistently.5 = Emphasis is clearly and consistently on monthly/quarterly version.
• Similarly we code the emphasis by Bloomberg & Reuters.• and, for the graph, average the two.

15
Table 1A: Reporting patterns for GDP growth released by official agencies and financial news services across 21 countries
• Note regarding press statement accompanying release of statistics:
1 = Emphasis is clearly on the annual basis.2 = Some emphasis on annual version, but not consistently, relative to shorter-term basis.3 = Precisely equal emphasis on both versions.4 = Some emphasis on quarterly basis, but not consistently, relative to the 12-month basis.5 = Emphasis is clearly and consistently on quarterly version.•
+ Month-on-Month † Annualized Quarter-on-Quarter. An appendix documents the basis of the classification of each country.• # Canada also reports monthly growth figures as a reference. * The Netherlands Statistics Bureau (CBS) recently changed its focus from annual to quarterly (in 2012).

16
0.5 1 1.5 2 2.5 3 3.5 4 4.5 5 5.50
1
2
3
4
5
6
ChinaTaiwan
BelgiumSweden
Mexico Finland
BrazilSpain
ItalyNLUK
US
Canada
GermanyIreland
EZ
DenmarkSwissJapan Korea
France
Correlation between governments and press releases (% GDP)
Government
Med
ia
Quarterly ReportingAnnual reporting
Quarterly Reporting
Annual reporting
The choice by news services whether to frame GDP growth as 1-quarter vs. year-over-year is correlated with
the choice by government agencies that release it.
17
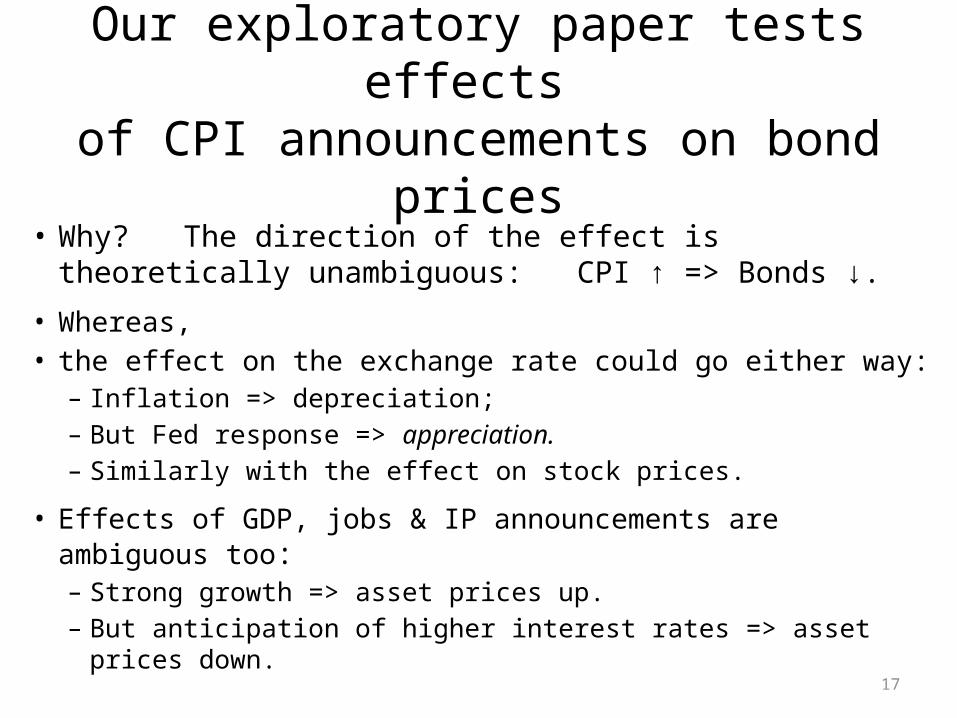
Our exploratory paper tests effects of CPI announcements on bond prices
• Why? The direction of the effect is theoretically unambiguous: CPI ↑ => Bonds ↓.
• Whereas,• the effect on the exchange rate could go either way:
– Inflation => depreciation;– But Fed response => appreciation.– Similarly with the effect on stock prices.
• Effects of GDP, jobs & IP announcements are ambiguous too:– Strong growth => asset prices up.– But anticipation of higher interest rates => asset prices down.

18
Table 2. Reactions of bond prices to CPI releases in countries that emphasize 12-month vs. 1-month news
*** Statistically significant at 1% level. (t-statistics are in parentheses.)† Forecast is average of analysts' forecasts before the announcement (Source: Bloomberg)Panel regression (with country fixed effects) Sample period (by month of release)
UK: Dec. 2003 – August 2014 US: February 2003 – Aug.2014 Canada: Feb. 2003 – Aug. 2014 Korea: Feb 2004 – Dec 2013

19
Preliminary conclusion• The hypothesis appears to be supported:• In countries where the official press release
& news services frame the CPI in 1-month terms(US & Korea), bond markets react to that number and not at all to the 12-month number.
• Vice versa for countries that frame the CPI in 12-month terms (UK & Canada).
• A truly persuasive study would:– get data with ½ hour intervals, rather than 24 hours;– try GDP, employment & industrial production releases;– and look at reactions also in forex & stock markets.

20
Policy prescription (assuming the finding holds up)
• BLS, BEA & FRB should switch the focus in their releases to the year-over-year number.
• The media and financial markets would then give their scarce attention to more informative numbers:– The 12-month number includes revisions in preceding months.– Seasonal adjustment is automatic & natural.– It helps focus public attention on important trends
• as opposed to the distractions of short-term noise.
• Maybe even pundits & voters would then find it worth their while to try to monitor the true state of the economy.

21
Voters
• Polls indicate:– 4 ½ years after the end of the great recession in mid-
2009, from 74% to nearly 80% of Americans thought that the country was still in recession.
– As of June 1, 2014, only 43 % thought that the U.S. economy had even begun to recover.
• “Rational inattention”?– In truth, most economic news reports
are so noisy as to contain little value.– Let’s raise the signal/noise ratio.

22

23
Appendices
• Literature– Effect of inflation news on the bond market.
• Framing – CPI news (for 19 countries)– Employment news (for 4 countries)
• Recent examples:– August 2014 announcements of GDP– of Industrial Production

24
Statistical findings of highly significant positive jumps in interest rates in response to inflationary news
• The early 1980s, when Fed money announcements were important: Grossman (1981), Roley (1983), Urich & Wachtel (1981), Urich (1982), Naylor (1982), Cornell (1982), Engel & Frankel (1982), and Campbell, Schoenholtz & Shiller (1983).
• More recent papers, able to take advantage of larger and higher-frequency data sets, have similarly found interest rates rising or bond prices falling in reaction to news of higher inflation or stronger economic growth: Fleming and Remolona (1999), Gurkaynak, Sack & Swanson (2005), Andersen et al. (2007), Faust et al. (2007), Goldberg & Leonard (2003), and Ehrmann & Fratscher (2005), among others.

25
Some other studies of macroeconomic news effects on financial markets (almost all of them with intra-day data)
• Foreign exchange: Cornell (1982), Engel & Frankel (1984), Evans & Lyons (2005), Galati & Ho (2003), and Love & Payne (2008).
• Equities: Pearce & Roley (1985) • Multiple markets: Andersen, Bollerslev,
Diebold and Vega (2007), Bartolini, Goldberg, & Sacarny (2008), Frankel & Hardouvelis (1985), Goldberg & Leonard (2003)

26
0 1 2 3 4 5 60
0.5
1
1.5
2
2.5
3
3.5
4
4.5
Germany
The Netherlands
Eurozone
Denmark
UK
Canada
Finland
Sweden
IrelandSpain
France
Mexico
Japan
Brazil
Italy Switzerland
Belgium
Korea
US
Correlation between governments and press releases(% CPI)
Government
Med
ia
Monthly ReportingAnnual reporting
Mon
thly
Rep
ortin
g
Ann
ual
repo
rting
The choice by news services whether to frame CPI inflation
as 1-quarter vs. year-over-year is (weakly) correlated with the choice by government agencies that release it.

27
Table 1: Reporting patterns for CPI statistics released by official agencies and financial news services across countries
Updated Sep 19, 2014
• * English-language media tend to focus on MoM, while the local news services focus on YoY, consistent with the gov't release.• †English media tend to focus on YoY, while the local news services focus on MoM, consistent with the government release.
• 1 = Emphasis (e.g., headlines) is clearly and consistently on the 12-month version, even though the monthly basis is also contained somewhere in the announcement.• 2 = Some emphasis on the 12-month version, but not consistently, relative to the shorter-term basis.• 3 = Precisely equal emphasis on both versions.• 4= Some emphasis on the shorter term basis, but not consistently, relative to the 12-month basis.• 5 = Emphasis is clearly and consistently on the monthly (or quarterly) version, even though the 12-month basis is also contained in the release• Source: The Secrets of Economic Indicators and authors’ investigations from press releases and news services. An appendix available online documents the basis of the classification of each country.
28
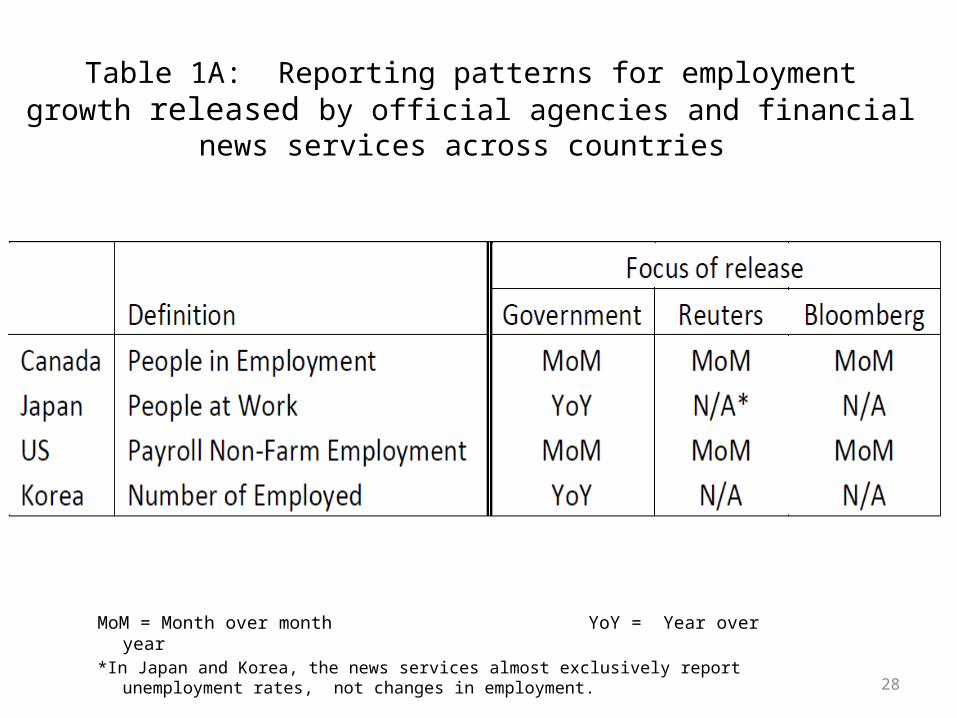
Table 1A: Reporting patterns for employment growth released by official agencies and financial news services across countries
MoM = Month over month YoY = Year over year*In Japan and Korea, the news services almost exclusively report
unemployment rates, not changes in employment.

29
The BEA on Aug.28, 2014, released US GDP for the preceding quarter.
EMBARGOED UNTIL RELEASE AT 8:30 A.M. EDT, THURSDAY, AUGUST 28, 2014
National Income and Product AccountsGross Domestic Product, Second Quarter 2014 (Second Estimate); Real gross domestic product -- the output of goods and services produced by labor and property located in the United States -- increased at an annual rate of 4.2 percent in the second quarter of 2014, according to the "second" estimate released by the Bureau of Economic Analysis. In the first quarter, real GDP decreased 2.1 percent.
The 1st sentence of the press release, as usual, gave the GDP growth rate for the quarter.
(The 2nd sentence gave the revised QI.)

30
US economy grew 4.2 percent in Q2, but weaknesses remain
The US economy grew annualized rate of 4.2 percent in the second quarter, according to revised figures released Thursday by the Bureau of Economic Analysis. While the GDP growth was slightly higher than expected, experts say weak spots in the economy linger.
By Bryan Cronan, Staff Writer AUGUST 28, 2014 http://www.csmonitor.com/Business/2014/0828/US-economy-grew-4.2-percent-in-Q2-but-weaknesses-remain-video
The wire services & newspapers followed suit,reporting 1-quarter GDP growth.
BUSINESS

31
In China, the government and the news led the mid-2014 GDP report with growth rates
relative to the same quarter in the preceding year.

32
The wire services and newspapers also report China’s growth rate relative to Q2 in the preceding year.
http://online.wsj.com/articles/china-inflation-remains-tame-in-july-1407556801

33
The Fed releases Industrial Production statistics.
The 1st sentence of the press release gives the increase in IP relative to the preceding month.
(The 6th sentence gives the 12-month increase.)
FEDERAL RESERVE STATISTICAL RELEASE http://www.federalreserve.gov/Releases/g17/current/g17.txt
FEDERAL RESERVE STATISTICAL RELEASE http://www.federalreserve.gov/Releases/g17/current/g17.txt

34
The wire services & newspapers follow suit,reporting 1-month IP.

35
http://www.bfs.admin.ch/bfs/portal/en/index/themen/06/01/new/nip_detail.html?gnpID=2014-610
The Swiss FSO releases its Industrial Production statistics quarterly.
The press release gives the increase in IP relative to four quarters previously.

36
• http://www.rttnews.com/story.aspx?Id=2379521
The wire services & newspapers follow suit,reporting IP as changes relative to the same
quarter in the previous year.
September 5, 2014 http://www.lse.co.uk/AllNews.asp?code=9i92fc8r&headline=Euro_Mixed_After_Eurozone_GDP_Data


![Issue 47 • January 2021 ehsd.org Headlines · 2021. 1. 7. · Issue 47 • January 2021 ehsd.org. JANUARY 2021 [ 2] Headlines J A N U A R Y I S ELIGIBILITY WORKER MONTH Despite](https://img.pdfslide.us/doc/110x75/60d0a20e9520844f2a0872e9/issue-47-a-january-2021-ehsdorg-headlines-2021-1-7-issue-47-a-january.jpg)