Embed Size (px)
Citation preview

Bowling Green State University Bowling Green State University
ScholarWorks@BGSU ScholarWorks@BGSU
Masters of Education in Human Movement, Sport, and Leisure Studies Graduate Projects Human Movement, Sport, and Leisure Studies
2016
Does Installing Artificial Turf Create a Honeymoon Effect for Does Installing Artificial Turf Create a Honeymoon Effect for
College Football Teams? College Football Teams?
Ashley E. Birchmeier Bowling Green State University
Follow this and additional works at: https://scholarworks.bgsu.edu/hmsls_mastersprojects
Repository Citation Repository Citation Birchmeier, Ashley E., "Does Installing Artificial Turf Create a Honeymoon Effect for College Football Teams?" (2016). Masters of Education in Human Movement, Sport, and Leisure Studies Graduate Projects. 4. https://scholarworks.bgsu.edu/hmsls_mastersprojects/4
This Article is brought to you for free and open access by the Human Movement, Sport, and Leisure Studies at ScholarWorks@BGSU. It has been accepted for inclusion in Masters of Education in Human Movement, Sport, and Leisure Studies Graduate Projects by an authorized administrator of ScholarWorks@BGSU.
Running head: Does Installing Artificial Turf Create a Honeymoon Effect 1
DOES INSTALLING ARTIFICIAL TURF CREATE A HONEYMOON EFFECT FOR
COLLEGE FOOTBALL TEAMS?
Ashley E. Birchmeier
Master’s Project
Submitted to the School of Human Movement, Sport, and Leisure Studies
Bowling Green State University
In partial fulfillment of the requirements for the degree of
MASTER OF EDUCATION
In
Sport Administration
Date: April 19, 2016
Project Advisor
Ray Schneider
Second Reader
Sungho Cho
Does Installing Artificial Turf Create a Honeymoon Effect 2
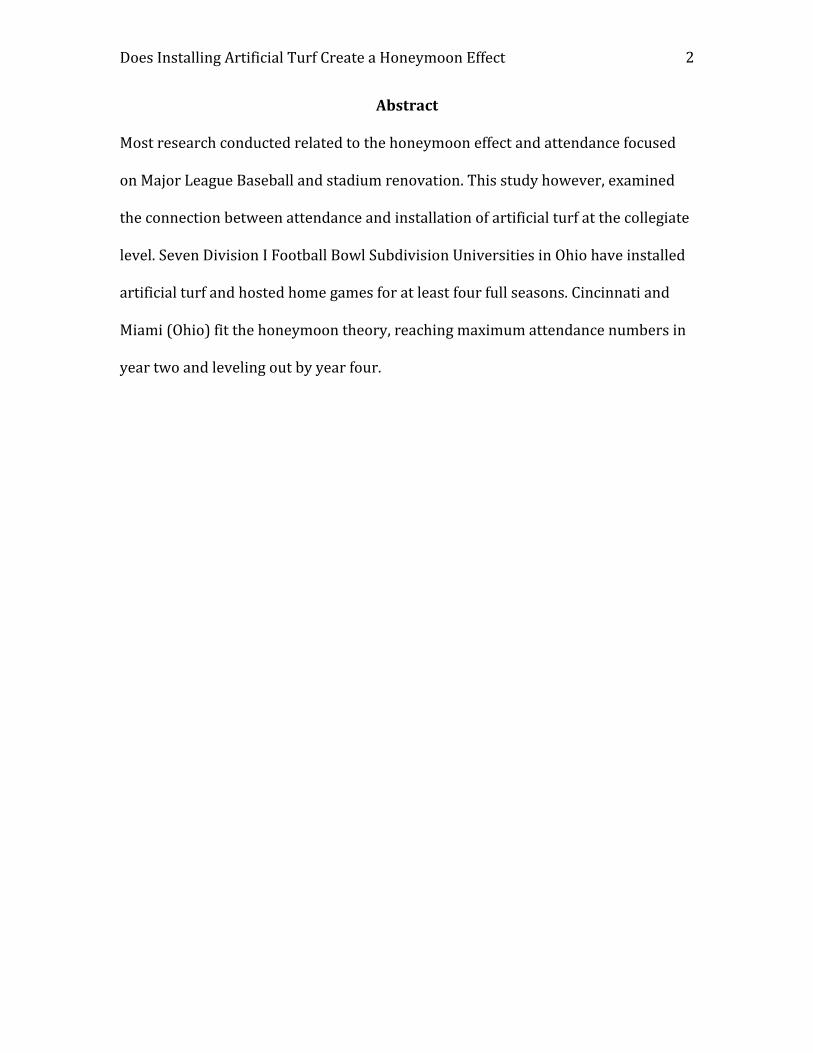
Abstract
Most research conducted related to the honeymoon effect and attendance focused
on Major League Baseball and stadium renovation. This study however, examined
the connection between attendance and installation of artificial turf at the collegiate
level. Seven Division I Football Bowl Subdivision Universities in Ohio have installed
artificial turf and hosted home games for at least four full seasons. Cincinnati and
Miami (Ohio) fit the honeymoon theory, reaching maximum attendance numbers in
year two and leveling out by year four.

Does Installing Artificial Turf Create a Honeymoon Effect 3
Artificial turf continues to be a growing trend at all levels of sports. The
synthetic grass is installed as an alternative to natural grass and is used to cut back
costs and maintenance fees that come with natural grass. Upon installing the
artificial turf, the community and its users are usually filled with a sense of
excitement. However, like anything over time the value tends to diminish and the
excitement fade, thus known as the “honeymoon effect” (Zygmont & Leadley, 2005,
p. 278). According to Hamilton and Kahn (2005, p. 253) “the honeymoon begins to
fade after three years,” meaning that by the fourth year a decline in happiness or
satisfaction can be detected.
In college football, artificial turf continues to grow in popularity. However,
the installation of these fields are not inexpensive. For instance, on average
“Fieldturf may cost about $5.50 per square foot, or $450,000 per full-sized field, for
an initial installation” (Renstrom, 2004). Thus, investors inspect a complete return
on investment.
This research focuses on Division I, Football Bowl Subdivision schools
located in Ohio who have installed artificial turf and have hosted home games for at
least four full seasons. Weather plays a major role in field conditions and in some
cases game outcomes.
Price and Sen (2003) stated that college football is a vital part of campus life
and the revenue generated from the program out weighs any other sport offered at
the Division I level. “Ticket sales are the main contributor to total revenue,”
(Renstrom, 2004). The biggest issue with ticket sales however, is that spectators at
most institutions are-often more inclined to buy single game tickets verses season
Does Installing Artificial Turf Create a Honeymoon Effect 4
tickets. This is why research must fill the void and address the independent variable
of team performance. Team performance consist of several factors, the most
important being win/loss record.
Literature Review
The article “When is the Honeymoon Over? Major League Baseball
Attendance (2005)” addresses the issues or concerns with the building of a new
stadium and how the honeymoon effect plays a role in a project at the professional
level. Several different factors were analyzed including increased attendance from
winning percentage, ticket price and unemployment rate and a formula to predict a
honeymoon effect was developed (Zygmont & Leadley, 2005). The research
examined new major league stadiums built between 1970-2000 (Zygmont &
Leadley, 2005).
Zygmont and Leadley found that in the first two seasons of developing a new
stadium, attendance and price had a positive relationship, meaning as one increased
so did the other. However, by year five, ticket prices remained high but attendance
began to fall. An increase in attendance and ticket price was important for two
reasons. The first being an “increase in revenue might cover a significant part of the
cost….and second there might be a local economic impact” (Zygmont & Leadley,
2005, p. 296). Thus, proving a honeymoon effect existed between attendance and
stadiums.
“Impact of New Minor League Baseball Stadiums on Game Attendance
(2008)” also raised the question of whether or not a new stadium would lead to an
attendance boost or if it simply noted as a “novelty effect” (Roy, 2008, p. 146). One-
Does Installing Artificial Turf Create a Honeymoon Effect 5
hundred one stadiums built between 1993-2004 were examined over a 12-year
span to determine if the attendance spike was short-term or long-term (Roy, 2008).
The researcher approached this study with three different questions, the first
being, does a new stadium result in short-term and/or long-term attendance
increase. Second does it matter if the team is moving from an old stadium to a new
stadium? Finally does attendance among different levels of minor league baseball
lead to a variation in attendance (Roy, 2008)? Data was collected using the average
attendance for each of the stadiums first five years in existence. The research
determined that a novelty effect did indeed exist and that year two showed roughly
a 4% higher attendance rate then displayed in year one (Roy, 2008). By year five, at
most levels of minor league baseball, the data presented a negative trend in
attendance rates. This is important when addressing minor renovations and new
stadium projects. Attendance is key for any spectator sport and knowing attendance
trends helps to identify sources of revenue.
Attendance is not just measured at the professional sports level, but it is also
used at the collegiate level when making decisions such as whether to build new
facilities or renovate existing venues. Judge and Petersen analyzed NCAA Division I
institutions, more specifically the current state of their strength and condition
facilities. The main goal was to determine a relationship between the facilities
budget, staffing and equipment based on the overall usage by athletes (Judge et al.,
2014). Usage of the facilities was much higher from institutions with football
programs than those without. In addition, “in the past five years, schools in the
NCAA’s top six sport conferences raised more than $3.9 billion for new sport

Does Installing Artificial Turf Create a Honeymoon Effect 6
facilities,” (Judge et al., 2014, p. 2259). Among the top of expenditures, upgrades to
new stadiums was a primary concern for institutions.
Upgrades are important when addressing concerns within a facility because
at the collegiate level, the largest revenue for institutions are ticket sales (Price &
Sen, 2003). What exactly influences ticket sales was based on three variables. The
first being the quality of the opponent and the weather on game day. The second
being the length of the game and location, as well as age of the facility. Thirdly was
variables specific to the University (Price & Sen, 2003). The research examined one-
hundred twelve Division I-A college football teams during the 1997 season and
studied average home game attendance based on stadium size (Price & Sen, 2003).
Price and Sen found that game day attendance is influenced by several factors and
the most important factors were past team performance and the visiting teams
record and the size of the University (Price & Sen, 2003).
When making renovations to any facility, cost is a major concern. That is why
it is critical to determine the question, if a University installs artificial turf, does it
experience a life cycle similar to a honey moon effect and see an increase in
attendance?
Methods
Population and Sample
There are roughly 128 football bowl subdivision teams in the National
Collegiate Athletic Association (“National Collegiate Athletic Association,”2016). All
128 teams are divided among ten conferences across the United States and span

Does Installing Artificial Turf Create a Honeymoon Effect 7
from the east coast to the west coast (“National Collegiate Athletic
Association,”2016).
The sample group consisted of seven Football Bowl Subdivision Division I
Universities located in Ohio who have installed artificial. The Universities included
Bowling Green State University, Akron University, Kent State University, Cincinnati
University, Miami (Ohio) University, Toledo University, and The Ohio State
University. Further each has used the turf for at least four full seasons. Division I
colleges in the state of Ohio were selected for two reasons. The weather in Ohio is
much different than that of other states, thus eliminating the chance at skewed data
due to incomparable weather. Secondly the researcher was trying to collect data
that would impact and have value on our own University.
Attendance data was collected for all seven Universities, four seasons pre-
artificial turf and four seasons post artificial turf.
The data was collected from the National Collegiate Athletic Associations
official database (“National Collegiate Athletic Association,”2016). All members of
the NCAA must report attendance numbers at the conclusion of each contest,
providing the most accurate information in collegiate sports (“National Collegiate
Athletic Association,”2016).
Measures
The dependent variable is the age of the artificial turf and where exactly the
surface is in its life cycle. This was paired with the average attendance in the first
four seasons of the turfs life cycle and the four seasons prior to its installation. The
age of the artificial turf is vital when determining a honeymoon effect because the
Does Installing Artificial Turf Create a Honeymoon Effect 8
attendance spike is most likely to peak in the first four seasons, reaching maximum
attendance levels within that time frame and leveling out by year four.
Win/loss records were also collected, as the number one factor in game
attendance is team performance (Price & Sen, 2003). In order to compare overall
record with attendance, wins and losses were added together and then divided by
the number of wins to get what is known as a winning percentage. If the data
presented an upward trend and peaked within the four-year time frame then the
artificial turf was part of a honeymoon effect. However if a downward trend was
presented or no trend was determined then the data is reliable, but inconclusive.
Procedure/Treatment
The independent variable, attendance, was then displayed as a percentage of
the facilities total capacity, this is the average attendance for each season and
dividing it by the total capacity of the stadium to get an accurate representation of
total attendance. The capacity of each stadium was obtained using the Universities
respective athletic website. Akron and Ohio State were the only two schools where
capacity changed pre-turf to post turf. Akron built a new stadium in 2008
(“University of Akron,” 2016), while Ohio State expanded seating in its existing
facility between the 2006-2007 season (“Ohio State University,” 2016).
Winning percentage, was determined by taking the wins from each season
and dividing them by the total number of games that season. The winning
percentage for all four seasons pre-turf and post turf were also determined, in order
to compare the percent of capacity and the success of the team. This was done for all
seven Universities within the study.
Does Installing Artificial Turf Create a Honeymoon Effect 9
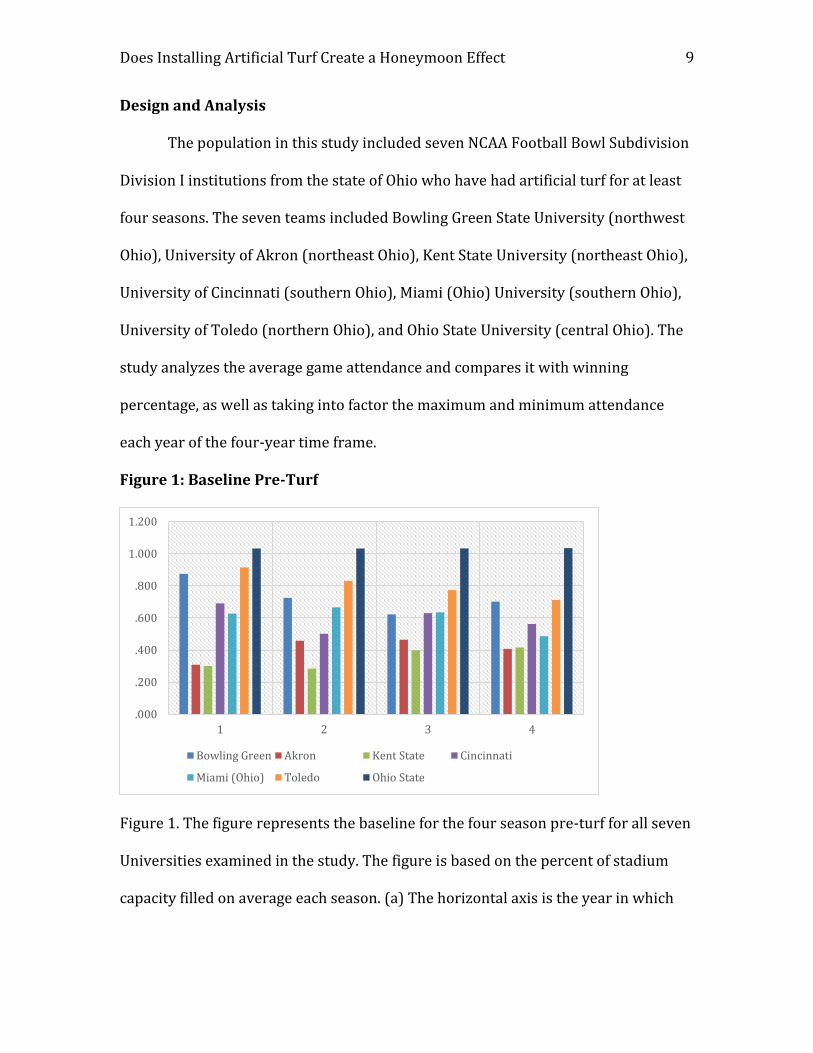
Design and Analysis
The population in this study included seven NCAA Football Bowl Subdivision
Division I institutions from the state of Ohio who have had artificial turf for at least
four seasons. The seven teams included Bowling Green State University (northwest
Ohio), University of Akron (northeast Ohio), Kent State University (northeast Ohio),
University of Cincinnati (southern Ohio), Miami (Ohio) University (southern Ohio),
University of Toledo (northern Ohio), and Ohio State University (central Ohio). The
study analyzes the average game attendance and compares it with winning
percentage, as well as taking into factor the maximum and minimum attendance
each year of the four-year time frame.
Figure 1: Baseline Pre-Turf
Figure 1. The figure represents the baseline for the four season pre-turf for all seven
Universities examined in the study. The figure is based on the percent of stadium
capacity filled on average each season. (a) The horizontal axis is the year in which
.000
.200
.400
.600
.800
1.000
1.200
1 2 3 4
Bowling Green Akron Kent State Cincinnati
Miami (Ohio) Toledo Ohio State

Does Installing Artificial Turf Create a Honeymoon Effect 10
the attendance was measured. (b) The vertical axis represents the percentage of
capacity each individual University reached in each of the four season measured.
Results
The research conducted was based on the hypothesis that a honeymoon
effect would be present following the installment of artificial turf. In addition, by
year two of the life cycle it would peak at maximum attendance rates and level out
by year four. To test this hypothesis, attendance based on the percent of capacity
was compared to win/lose records for the four seasons pre-turf and compared the
data to the four season post turf. The dependent variable, artificial turf was
examined at various levels of its life cycle in order to determine if the presence of a
honeymoon effect existed. The independent variable attendance was then displayed
in the form of percent of capacity, which was found by taking the average total
attendance for the year and dividing it by the total capacity of the stadium. For
example, in year one at Bowling Green State University, Doyt Perry Stadium, the
average attendance was 17,909 which was divided by 24,000 (the stadiums total
capacity) to get the percent of capacity of .746 (“Bowling Green State University,”
2016). This was done for all four seasons pre-turf and post turf and for all seven
Universities examined.
The results appeared to be inconclusive in this study as a significant change
in attendance was not visible, however the data is still reliable. Of all the
Universities examined two displayed the greatest change in attendance pre turf to
post turf. The University of Cincinnati and Miami (Ohio) University fit the research
best.
Does Installing Artificial Turf Create a Honeymoon Effect 11
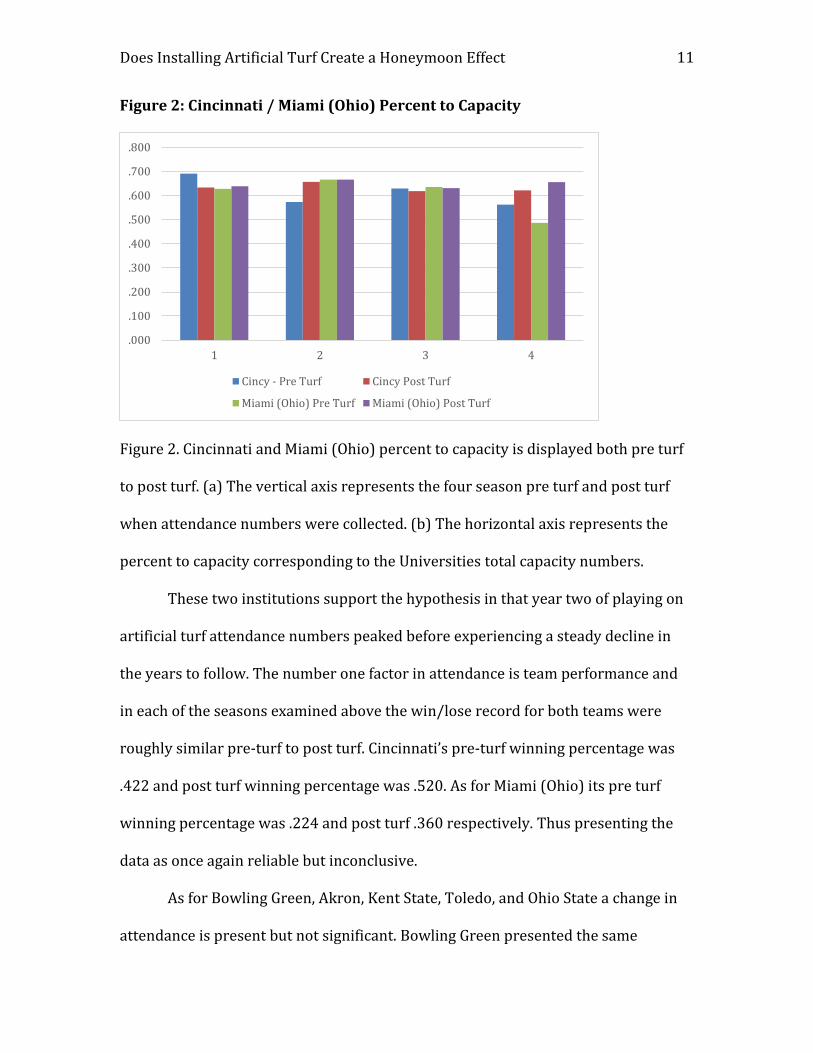
Figure 2: Cincinnati / Miami (Ohio) Percent to Capacity
Figure 2. Cincinnati and Miami (Ohio) percent to capacity is displayed both pre turf
to post turf. (a) The vertical axis represents the four season pre turf and post turf
when attendance numbers were collected. (b) The horizontal axis represents the
percent to capacity corresponding to the Universities total capacity numbers.
These two institutions support the hypothesis in that year two of playing on
artificial turf attendance numbers peaked before experiencing a steady decline in
the years to follow. The number one factor in attendance is team performance and
in each of the seasons examined above the win/lose record for both teams were
roughly similar pre-turf to post turf. Cincinnati’s pre-turf winning percentage was
.422 and post turf winning percentage was .520. As for Miami (Ohio) its pre turf
winning percentage was .224 and post turf .360 respectively. Thus presenting the
data as once again reliable but inconclusive.
As for Bowling Green, Akron, Kent State, Toledo, and Ohio State a change in
attendance is present but not significant. Bowling Green presented the same
.000
.100
.200
.300
.400
.500
.600
.700
.800
1 2 3 4
Cincy - Pre Turf Cincy Post Turf
Miami (Ohio) Pre Turf Miami (Ohio) Post Turf
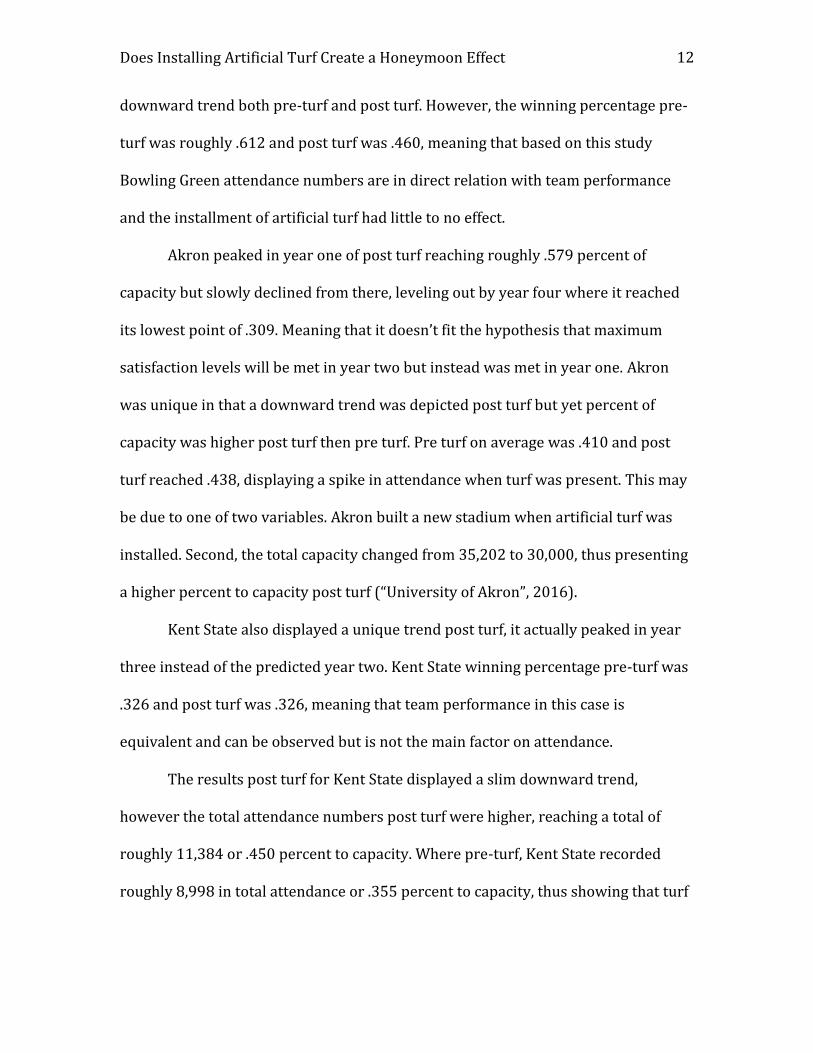
Does Installing Artificial Turf Create a Honeymoon Effect 12
downward trend both pre-turf and post turf. However, the winning percentage pre-
turf was roughly .612 and post turf was .460, meaning that based on this study
Bowling Green attendance numbers are in direct relation with team performance
and the installment of artificial turf had little to no effect.
Akron peaked in year one of post turf reaching roughly .579 percent of
capacity but slowly declined from there, leveling out by year four where it reached
its lowest point of .309. Meaning that it doesn’t fit the hypothesis that maximum
satisfaction levels will be met in year two but instead was met in year one. Akron
was unique in that a downward trend was depicted post turf but yet percent of
capacity was higher post turf then pre turf. Pre turf on average was .410 and post
turf reached .438, displaying a spike in attendance when turf was present. This may
be due to one of two variables. Akron built a new stadium when artificial turf was
installed. Second, the total capacity changed from 35,202 to 30,000, thus presenting
a higher percent to capacity post turf (“University of Akron”, 2016).
Kent State also displayed a unique trend post turf, it actually peaked in year
three instead of the predicted year two. Kent State winning percentage pre-turf was
.326 and post turf was .326, meaning that team performance in this case is
equivalent and can be observed but is not the main factor on attendance.
The results post turf for Kent State displayed a slim downward trend,
however the total attendance numbers post turf were higher, reaching a total of
roughly 11,384 or .450 percent to capacity. Where pre-turf, Kent State recorded
roughly 8,998 in total attendance or .355 percent to capacity, thus showing that turf

Does Installing Artificial Turf Create a Honeymoon Effect 13
may have had an effect on attendance but did not necessary follow the honeymoon
pattern (peak in year two and level out by year four).
Figure 3: Kent State Post Turf
Toledo’s highest attendance post turf was met in season four when
attendance reached on average 22,156.8 or .844 percent of capacity. The attendance
peaked at its highest point during the 2004 pre-turf era reaching .915 percent of
capacity before slowly declining until 2008. The data post turf did not support the
hypothesis as attendance numbers reached their lowest point of .621 percent of
capacity in year two and peeked in year four post turf. The data presented by Toledo
also fits the idea that winning percentage is an important factor in game attendance,
for example during the 2009 season average attendance was 16,284 and the teams
winning percentage was .417. However, by 2011 (the highest registered attendance
data) attendance was 22,156 and a winning percentage of .692 was recorded. Even
though Toledo does not fit the exact model of the hypothesis the data presented is
.000
.100
.200
.300
.400
.500
.600
.700
.800
0 1 2 3 4 5
% Capacity - Post Win % Linear (% Capacity - Post)

Does Installing Artificial Turf Create a Honeymoon Effect 14
still valid in that post turf attendance did display an upward trend, while the pre-
turf era fell from .915 percent of capacity in 2004 to .711 by 2007.
As for Ohio State, the attendance numbers were slightly different in that year
four displayed the highest attendance numbers both pre-turf and post turf. Post turf
a giant jump in attendance was seen between year two and year three with the
attendance leveling out by year four. Post turf reached its highest point of capacity
in year three when it reached 1.029 and the exact same percent of capacity 1.029
was displayed in year four. This can be deemed in relation to the presence of turf as
the winning percentage in year three was only .846 but reached .923 in year four,
eliminating the factor of winning percentage. Ohio State is another unique case were
total capacity of the stadium changed from 101,568 pre-turf to 102,329 post turf but
the results still favored the idea of a honeymoon effect in that satisfaction levels
were met by year four and leveled out by the end of the four-year lifecycle.
Discussion
The results for all seven Universities showed a change in attendance from
pre-turf to post turf. The percent of capacity for Kent State, Akron and Cincinnati all
displayed higher on average percent to capacity post turf than pre-turf, with
Cincinnati peaking in year two. The results suggest that artificial turf has an effect
on attendance and a honeymoon effect can be detected but the significance may be
minimal.
This study did provide contributions to existing literature and overall
influences attendance. For instance, an increase in attendance is important for
several reasons, the first being “the resulting increase in revenue might cover a

Does Installing Artificial Turf Create a Honeymoon Effect 15
significant part of the cost” (Zygmont and Leadley, p. 296). This supports the
research conducted in that attendance is the most important factor in team revenue
and should be deemed as one of the most important factors when making a decision.
McEvoy, Nagel, Deschriver, and Brown (2005) stated that “ticket sales have long
been a vital revenue source” reassuring the importance of attendance. The
attendance numbers in this study fluctuated based on different factors but the
overall results displayed that any change in venue or team can have a significant
impact.
The study can be used as an informal tool when deciding whether or not
upgrading a facility with the addition of artificial turf is a profitable decision. It
provides an insight into the effects of post artificial turf upgrades and the various
cycles Universities can expect to experience. I feel that artificial turf is a great
upgrade to an existing facility and that a much larger study would display a positive
impact. I recommend the installation of artificial turf when looking to have an
increase in attendance as this study demonstrated a positive relationship. I believe
that not only in Ohio but in Universities across the nation attendance numbers can
be in direct relation to the installation of artificial turf and will help lead to higher
attendance numbers early in its life cycle.
Individuals looking to do future research on this topic may want to extend
the current study from seven Universities in Ohio to Universities throughout all of
Division I football bowl subdivision. A limitation of this study was the population
size as it was adequate for this study but a much more definite change could be seen
with a much larger population. It may also want to examine different factors such as

Does Installing Artificial Turf Create a Honeymoon Effect 16
opponents throughout each season examined, as well as the amenities offered at the
various stadiums. This was another limitation in this study, it addressed attendance
and win/loss record with out examining things such as family day and various
services offered by Universities. In summary the results of this study could be
applied when looking at attendance patterns in relation to a honeymoon effect.

Does Installing Artificial Turf Create a Honeymoon Effect 17
References
Bowling Green State University. (n.d.). Retrieved February 2016, from
http://www.bgsufalcons.com/sports/2009/6/25/GEN_0625091316.aspx.
Hamilton, B.W., & Kahn P. (1997) Baltimore’s Camden Yards ballparks, In R.G. Noll &
A. Zimbalist (Eds.), Sports, jobs, and taxes: The economic impact of sports teams
and stadiums (pp. 245-281). Washington, D.C.: The Brookings Institution.
Judge, L. W., Petersen, J. C., Bellar, D. M., Craig, B. W., Cottingham, M. P., & Gilreath,
E. L. (2014, August). The Current State of NCAA Division I Collegiate Strength
Facilities: Size, Equipment, Budget, Staffing, and Football Status [Electronic
version]. The Journal of Strength and Conditioning Research, 28(8), 2253-2261.
doi:10.1519/JSC.0000000000000368
Kent State University. (n.d.). Retrieved February 2016, from
http://www.kentstatesports.com/sports/2013/7/16/dix%20stadium.aspx?tab=dixsta
dium&path=football.
McEvoy, C. D., Nagel, M. S., DeSchriver, T. D., & Brown, M. T. (2005, May). Facility
Age and Attendance in Major League Baseball [Electronic version]. Sport
Management Review, 8(1), 19-41. doi:10.1016/S1441-3523(05)70031-0
Miami University. (n.d.). Retrieved February 2016, from
http://www.miamiredhawks.com/facilities/yager-stadium-guide-15.html.
National Collegiate Athletic Association. (n.d.). Retrieved April 2016, from
http://www.ncaa.com.
National Collegiate Athletic Association. (n.d.). Retrieved February 2016, from
http://web1.ncaa.org/stats/StatsSrv/careersearch.

Does Installing Artificial Turf Create a Honeymoon Effect 18
Ohio State University. (n.d.). Retrieved February 2016, from
http://www.ohiostatebuckeyes.com/facilities/ohio-stadium.html.
Price, D. I., & Sen, K. C. (2003, January). The Demand for Game Day Attendance in
College Football: An Analysis of the 1997 Division 1-A Season [Electronic
version]. Managerial and Decision Economics, 21(1), 35-46.
doi:10.1002/mde.1100
Renstrom, R. (2004, May 10). Polymer-laden artificial turf gains popularity [Electronic
version]. Plastics News, 16(10), 9.
Roy, D. P. (2008, September). Impact of New Minor League Baseball Stadiums on Game
Attendance [Electronic version]. Sport Marketing Quarterly, 17(3), 146-153.
University of Akron. (n.d.). Retrieved February 2016, from
http://gozips.com/athletics/facilities/InfoCision.
University of Cincinnati. (n.d.). Retrieved February 2016, from
http://www.gobearcats.com/facilities/nippert-stadium.html.
University of Toledo. (n.d.). Retrieved February 2016, from
http://utrockets.com/sports/2015/6/22/theglassbowl.aspx.
Zygmont, Z. X., & Leadley, J. C. (2005, July). When is the Honeymoon Over? Major
League Baseball Attendance 197-2000 [Electronic version]. Journal of Sport
Management, 19(3), 278-299