Embed Size (px)
Citation preview
1
DOES INNOVATION AFFECT CREDIT ACCESS? NEW EMPIRICAL EVIDENCE
FROM ITALIAN SMALL BUSINESS LENDING.
Andrea Bellucci♣∗, Ilario Favaretto♦, Germana Giombini♠
Abstract In this paper we address the problem of the credit access of innovative SMEs undertaking innovative investments in price and non-price terms from a bank’s side perspective, overcoming some problems of supply shock. In the case of innovative firms, informational opaqueness and risk may exacerbate difficulties in the access to bank financing. In fact, the provision of bank financing for firms’ R&D activities remains - in qualitative and quantitative terms - largely inefficient and constrained due to their inherent riskiness and weaknesses. Using information from two datasets, we use a propensity score matching procedure to estimate the impact of the innovative nature of firms on: (a) loan interest rates; (b) the probability of having to post collateral; and (c) the probability of overdrawing. Our analysis reveals that banks trade off higher interest rates and lower collateral requirements for firms involved in innovative processes. Further, innovative firms have a lower probability of being credit rationed than their non-innovative peers.
JEL Classification: D82, E43, D40, G21. Keywords: innovative firms, interest rate, collateral, credit availability.
♣ Corresponding Author. IAW, Institute for Applied Economic Research, Ob dem Himmelreich 1, 72074 Tubingen,
Germany. [email protected] ∗Phone: +49 7071 9896 13. Fax: +49 7071 9896 99. ♦ Università di Urbino, Dipartimento di Economia Società Politica. Via Saffi 42, 61029 Urbino (PU), Italy. [email protected] Phone: +39 0722 3055 64. Fax +39 0722 305550. ♠ Università di Urbino, Dipartimento di Economia Società Politica. Via Saffi 42, 61029 Urbino (PU), Italy. [email protected] Phone: +39 0722 3055 57. Fax +39 0722 305550.
2
1. Introduction
Does innovation affect credit access? Recently, this question has been attracting attention in the
economic literature, broadly limited to the issue of credit access from a firm’s perspective. By contrast,
the credit costs for small- and medium-sized firms with an innovative activity, i.e. the question of
whether banks’ lending behaviors reflect more or less prudential preferences toward the nature of these
firms, and how these lending behaviors influence the pricing and supply of bank loans, remains an
open question.
In this study we contribute to advancing the previous empirical literature by looking at the context
of small business lending to innovative firms from the point of view of the bank, overcoming some
problems of supply shock, and addressing two important questions. First, our analysis aims to test
whether the innovative nature of firm activities is a key variable in accessing credit markets, i.e. whether
banks apply different loan conditions to innovative firms in price and non-price terms. Second, our
analysis investigates if the nature of differences in credit access of innovative firms depends on the
degree of borrower transparency and information asymmetry.
In general, from the bank’s side perspective the aspects that may negatively affect the financing
conditions of small and medium innovators, and consequently their opportunities to undertake new
investments in R&D activities prevalently originate in two facts.
The first fact depends on the presence of an information gap between entrepreneurs asking for a
loan and the bank managers supplying them. The informational opaqueness of small- and medium-
sized innovative firms increases the uncertainty between contracting parties, reducing the lender’s
ability to obtain and screen the private soft information, and consequently the banks’ ability of
evaluating them (Berger et al. 2001). Soft information directly gathered during banks’ relationship
lending or indirectly through interactions with the social context of the borrower, is crucial for both
contracting parties. Firstly, for the local bank managers to use the set of information on the proposed
borrower’s quality and/or ability to undertake the innovative project, with the aim of better discerning
the nature of the riskiness involved and the possible success of the innovative investment activities
proposed (Berger and Udell 1998). Secondly, for SMEs, which rely on the quality of this information to
reduce their informational opaqueness, and increase the probability that their investments in innovative
activities will be financed.
The second fact that may negatively affects the lending conditions and compromise the financing of
potential R&D investment refers to the bank’s assessment of the risky nature of the innovative activity.
In general, when banks evaluate an R&D project have to optimally trade-off between potential risk and
future returns from granting credit. Reputedly, bank’s evaluation may impact negatively on lending
condition of R&D investments for many reasons: i.e.: intangible capital is considered hardly re-
deployable (Mocnik 2001), R&D project is characterized by high specific sunk costs not ever
3
refundable to the bank or even fully collateralizable. Another aspect refers to the fact that innovative
firms typically base their activity on intellectual capital and intangible assets that amplify the problem of
financial opaqueness i.e. investors find it more difficult to evaluate the profitability of their investment
projects and, therefore, firms’ current and future market value (Hall 2010). In additions, banks may
consider R&D returns intrinsically more uncertain and less predictable (Carpenter and Petersen 2002,
Hall 2002) also due to the fact that SMEs may have fewer possibilities to diversify their innovative
projects and obtain more stable cash flows compared to large innovative firms (Giudici and Paleari
2000). Not a secondary aspect for the bank that may negatively affect the financing of R&D investment
is its possible appropriability that may reduce the future returns and consequently the firm’s ability to
refund the loan (Levin et al. 1985).
Hence, bank’s evaluation of the firm’s financial and non-financial characteristics in order to assess its
creditworthiness becomes particularly difficult in the case of firms that undertake innovative activities.
Both information opaqueness and the riskiness of innovative firm activities, by exacerbating the
problem of asymmetric information between the contracting parties, increase the bank managers’
efforts to assess the quality, investment riskiness and profitability of firm investments. As a
consequence, such increased efforts are expected to raise the cost of obtaining financing for SMEs or
limit their loan access in quantitative terms, lowering their opportunities to undertake new investments
in R&D activities.
From the point of view of firms empirical literature provides evidence of financial constraints for
younger and SME innovators (Czarnitzki 2006; Czarnitzki and Hottenrott 2011). In addition, some
studies using innovation survey data stressed the importance of firm innovation activity to have access
to loan markets. Using surveys for UK, few works find a negative association between “innovativeness”
and loan application success (Freel 2007) and a positive relation between “innovation activity” and its
relative cost and availability of credit Canepa and Stoneman (2008).
In fact, for established SMEs the provision of bank financing for their R&D activities remains - in
qualitative and quantitative terms - largely inefficient and constrained due to their inherent riskiness and
weaknesses.
Only recently have several empirical works pointed out the importance of the role played by
financial intermediation in terms the screening expertise of lenders for the provision of funds for R&D
activities and, consequently, the outcomes of innovative firms’ investments (Brown et al. 2012; Chava
et al. 2013).
To address our research questions, we estimate two models: (i) a simultaneous-equation model for
the interest rate and the collateral requirements; (ii) a Probit model for the likelihood that borrowers
will draw more credit than that made available by the bank. Specifically, we aim at testing whether
banks apply the same loan contract conditions to innovative- and non-innovative firms, after

4
controlling for their respective credit worthiness by means of a set of firm, loan, and bank
characteristics.1
Second, in order to substantiate our two arguments (firm opaqueness and riskiness) about the nature
of differences in credit access of R&D activities, we categorize the loans in our sample by dividing
them into sub-samples intended to offer cross-sectional variation in the degree of borrower
transparency and information asymmetry.
We improve on the existing literature in two ways. First, from a bank’s supply side, our findings
confirm theoretical arguments according to which innovative firms have more difficulty accessing
credit, finding a positive association between innovation and interest rates. This result is consistent
both with an argument for information-based frictions and with the riskier nature of innovative firms
compared to traditional ones. Secondly, we also find that innovative firms face less binding credit limits
and thus are less likely to overdraw funds than the others. These findings together suggest that, on one
hand, banks evaluate innovative firms to be riskier, and then charge them a higher price. On the other
hand, however, banks also seem to recognize that innovative firms are more profitable than other
firms, and reward them with less binding credit limits. Our analysis also shows that innovation is a key
determinant for the probability that a firm will experience binding credit limits for those firms that are
more likely to suffer from problems of information asymmetry. Among them, banks evaluate
positively, in term of credit availability, the presence of an innovative activity carried out by the firm.
Meanwhile, for those firms who are well known by the bank and for which the loan officers may rely
on additional information, being innovative is not a key determinant. These findings seem to suggest
that innovation may reduce the presence of credit constraints among those firms that, typically, may
suffer more from financing constraints. For these firms, innovation may help to avoid the costly option
of overdrawing expensive funds.
The paper is organized as follows. Section 2 describes the dataset employed, while Section 3 analyzes
the model specifications. Section 4 discusses our identification strategy. Section 5 shows our empirical
findings, and Section 6 concludes.
2. Data and variables
To analyze innovative firms’ access to credit we combine information from two datasets. The first
dataset contains the entire bank portfolio on more than 15,000 credit lines granted to SMEs by a major
inter-regional Italian bank (hereafter, simply the bank) as of September 2004 and 2006. The bank
belongs to a major Italian banking group quoted on the Milan Stock Exchange. One of the bank’s core
businesses is the provision of financing to SMEs, making this dataset ideal for the purposes of our
1 However, measures of firm profitability are not available in our datasets.
5
analysis. The bank’s portfolio was mainly concentrated in two Italian provinces.2 The provinces are also
representative of the Italian economic structure, characterized by the presence of a large number of
SMEs.3 Approximately 42.8% of the borrowing firms are Sole Proprietorships, accounting for more than
18% of the loans granted by the bank. Other legal business profiles are Partnerships (27.6%) and
Corporations (26.7%) accounting for 27,7% and 43,2% respectively of the total loans granted by the
bank. The remaining 2.9% of borrowing firms take the form of Cooperatives. Firms operate in more than
23 industry sectors defined at the 2-digit level according to the Italian National Institute of Statistics
(ISTAT).
During the timeframe of our study, the bank had more than 60 branches in both provinces. The
dataset contains information on loan contract terms, bank-borrower relationship, borrower
characteristics, and characteristics of the local credit market and lending branch. These variables permit
us to verify whether the relative advantage between innovative and traditional firms is determined by
market concentration, by the extent of entry barriers, or by the composition of firm size within the
industry (Acs and Audretsch 1987; Benfratello et al. 2008).
The latter dataset above combines information on firm innovative activities collected by the
Regional Government Agency, which aims to promote the collaboration between firms in R&D
projects, facilitating their access to technological consultation and improving the knowledge of the
regional innovation system. We identify the innovative firms through a series of innovation activity
processes in which they participated in 2004 and 2006. Examples include the registration of patents,
projects funded and the involvement and development of R&D projects. A firm is defined innovative
or, more precisely, a “firm that innovates” if it pursued at least one of the activities listed in Table 1
during this period of time. Then, we construct an indicator “Innov”, which assumes the value of 1 if the
firm pursued at least one of the activities reported in Table 1, and 0 otherwise.
We identify 301 innovative firms operating in these provinces. By matching information on the
bank’s portfolio and firm innovation activities, we identify 234 bank-innovative firm relationships, 110
in 2004 and 124 in 2006, respectively. In 2006 almost 53% of the existing innovative firms borrowed
from this bank. As our focus is on small business lending, we follow the EU definition of Small
Business Enterprises and exclude 15 innovative borrowers with sales exceeding €50,000,000 from our
dataset4. Generally, most of the firms that carried out an innovative project in 2004 were also involved
in these activities in 2006. However, in the last year available we can observe 14 firms not previously
2 Less than 4% of the credit lines are granted to firms located in other two neighboring provinces. 3 Using GDP per capita in Italy in 2006 as a base of 100, both provinces are slightly richer than the average Italian province (110.3 and 101.2, respectively). In both provinces, the manufacturing sector contributes 30% of overall value added, services contribute 68%, and agriculture only 2% (for the aggregate Italian economy, these figures are 27%, 71% and 2%, respectively). 4 Recommendation of 6 May 2003 (GUCE L 124/36 del 20/05/2003).
6
involved in innovative projects. Thus, our final sample contains 95 innovative firms in 2004 and 109
innovative ones in 2006, respectively, showing an increase of about 15%. 5
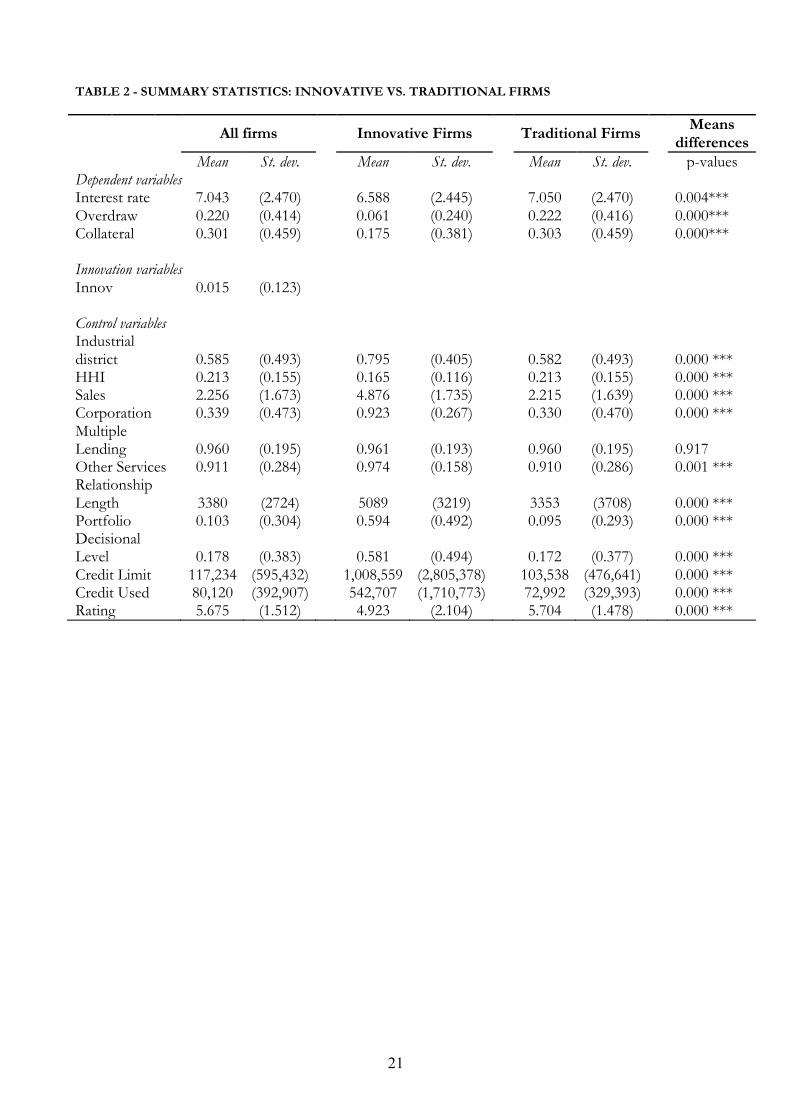
Table 2 reports the descriptive statistics of firms – innovative and traditional - detected in the
financial dataset.
A. Dependent Variables
We analyze the role of innovation on price and non-price terms of the loan contract, i.e.: Interest rates,
Overdraw and Collateral.
The first dependent variable is the interest rate actually paid by the borrower for the utilized amount
of credit. The average rate is 7.043%. The difference in the interest rate between innovative and
traditional borrowers is, on average, statistically significant: innovative borrowers pay approximately 46
basis points more than traditional ones (6.59 vs. 7.05).
The second dependent variable we consider is Overdraw, a dichotomous variable taking the value of 1
if a borrower draws more credit than what is actually granted by the bank in its loan contract and 0 if
he/she uses up or utilizes strictly less than the available credit line. In Italy, credit lines provide
borrowers with a certain degree of flexibility by either allowing them to not fully utilize the committed
credit, free of any charge, or overdraw up to a certain amount, subject to payment of fees and penalty
interest rates by the overdrawing customer. Credit availability is tighter for overdrawing firms in the
sense that they may count on a lower credit buffer. On average, 22% of borrowers face tight credit
limits, i.e. overdraw funds. Furthermore, the frequency with which traditional firms overdraw is
significantly higher with respect to innovative ones (6% vs. 22%).
The average credit limit of the contracts in our sample is €117,234 with considerable variation across
legal business forms (€49,209 for Sole Proprietorships vs. €189,931 for Corporations). The average
amount of credit that is actually used is €72,992, equivalent to 62.26% of the credit limit allowed by the
bank (€39,091 for Sole Proprietorships vs. €112,468 for Corporations – equivalent to 79.44% and
59.21%, respectively, of the credit limits set by the bank). Again, overdrawing borrowers are more likely
to be located outside the local credit market (24.65% vs. 20.89%) and outside an industrial cluster
(23.70% vs. 20.75%).
The third dependent variable of interest we consider is Collateral. It is and indicator variable, that
takes the value of 1 if the credit line is secured by real collateral, and 0 otherwise. On average, 30
percent of our borrowers are required to provide collateral. This share remains stable if we consider
traditional firms, while form innovative firms it decreases to 17.5 percent.
5 A previous research project on innovation identified 346 innovative firms located in this region in the year 2007. Results showed that these firms carried out at least one of the innovative activities listed in Table 1, constituted a large share of all innovative firms located in this Region, and were concentrated in a few and often non-front-rank innovative activities (Favaretto and Zanfei 2007).
7
B. Control Variables
In order to ensure that our measure of innovation does not capture factors other than innovative
activity, we introduced a set of control variables related to borrower and lending branch characteristics
and the nature of the bank-customer relationship.
Firm size is measured by the borrower’s total sales. As the bank only provides sales categories rather
than exact sales amounts, we construct a step variable considering six categories of sales. Sales is a step
variable that takes the value of: 1 if sales are less than €250,000; 2 for sales between €250,000 and
€500,000; 3 for sales between €500,000 and €1,500,000; 4 for sales between €1,500,000 and €5,000,000,
5 for sales between €5,000,000 and €25,000,000; 6 for sales between €25,000,000 and €50,000,000.
D(Sales i) is an indicator variable that takes the value of 1 if the firm’s sales fall in the i-th category (1
through 6) and 0 otherwise.
In terms of turnover innovative firms have significantly higher figures than the traditional ones, (on
average 4,88 vs. 2,22 million euro). The average borrower in our sample falls into the second category,
while the innovative borrower falls into the fourth one. The expected impact of firm size is an
improvement in firms’ access to credit, by lowering interest rates and the likelihood of experiencing
credit tightness, particularly if innovative firms are involved.
Another borrower characteristic we also consider is the legal business form of the firm. Corporation is
an indicator that takes the value of 1 if the loan recipient is a corporation and 0 otherwise. In our
dataset almost 34% of the borrowers were set up with a corporate form, but only 7.7% of innovative
firms are not corporations. This fact could be due to the industrial sector in which they operate (i.e. the
secondary sector and manufacturing in particular), by the firm’s size and/or by the firm’s activity
seniority. In the latter case it is possible that younger firms tend to be less structured (Berger and Udell
1998). To take into consideration differences in the specialization of the borrower, we introduce a
dummy variable Industrial district that takes the value of 1 if the borrower is located in an industrial
cluster and 0 otherwise. From Table 2 we note that 58.5% of our borrowers are located in such clusters
but on average the presence of innovative firms is higher than traditional ones (78.5% vs. 58.2%
respectively). We also control for sectoral differences in the cost of credit by adding a set of industry
indicators based on the ISTAT classification discussed earlier.
We furthermore introduce three measures intended to capture the nature of the bank-borrower
lending relationship. First, Relationship Length is the number of days since the firm first borrowed from
our bank. On average, the firms included in the sample have been clients of the bank for 3,380 days.
The average length is 3,353 days for innovative and 5,089 days for traditional firms, respectively. These
figures are comparable to findings by Cole (1998), and in Italy with Gambini and Zazzaro (2012). In the
multivariate analysis, we take a logarithmic transformation of this variable. Second, Multiple Lending is a
dummy variable designed to capture the exclusivity of the relationship. The variable takes the value of 1
if the firm borrows from multiple banks and 0 if the borrower has an exclusive relationship with our

8
bank. In our sample, only 4% of the firms have an exclusive lending relationship with the bank and we
do not notice differences between innovative and traditional firms. Lastly, Other Services considers the
scope of the bank-borrower interaction (Cole and Wolken 1995). The variable takes the value of 1 if
the firm uses additional services provided by the bank and 0 otherwise. 91,1% of firms utile other
financial services from this bank. However, innovative firms tend to use more of these services from
the bank respect to their traditional counterparts (97,4% vs. 91%).
To take in account the organizational structure and decision making process of the bank (Liberti and
Mian 2009), we include the variable Portfolio, that identifies the operating segment of the bank into
which the borrower falls. Specifically, the variable takes the value of 1 if the bank considers the credit
line to be part of its small business market and 0 if it is part of its corporate market. The small business
market represents more than 90% of the bank’s loan portfolio. The bank might consider a firm with a
corporate organizational form to be part of the small business market because of the firm’s characteristics
and services it requires. This distinction has implications for the riskiness of the subset of the loan
portfolio and for the internal division that manages the credit line. In our sample innovative firms fall,
on average, inside corporate portfolios in 59% of the cases.
We also take into account the hierarchical level of the lending branch in the bank’s organizational
structure. We construct a dummy variable, Decisional level that takes the value of 1 if the credit line is
managed at the headquarters level and 0 if this happens at a local bank branch. In our sample the 18%
and the 58% of the credit lines of traditional and innovative firms, respectively, are managed at the
headquarters level.
We also include a branch-based Herfindahl Hirschman Index (HHI), to capture local credit market
conditions and competition, calculated for both years. On average branches are located in contestable
markets with an HHI close to 0.21. Moreover, in our formal analysis, time-invariant heterogeneity
across bank branches is absorbed through branch fixed effects, while year effects account for
differences in the aggregate economic conditions between 2004 and 2006.
Lastly, in order to measure the degree of collateralization of the credit line we construct a step
variable Amount Collateral that takes the value of 1 if the credit line is not collateralized, 2 if it is
collateralized up to 75% of the credit limit, and 3 if the collateral amount exceeds that 75% level. In the
multivariate analysis, we use indicator variables for each category of collateralization. Specifically,
D(Collateral i) takes the value of 1 if the collateralization of a credit line falls into the i-th category. Note
that 70% of the credit lines are not covered by collateral, i.e. fall into category 1. The fraction of credit
lines in the 2nd and 3rd category is 19% and 11%, respectively.
In case of innovative firms the figures for category 1 and fixed assets and equipment are 82% and
3% respectively.
3. Empirical Models
9
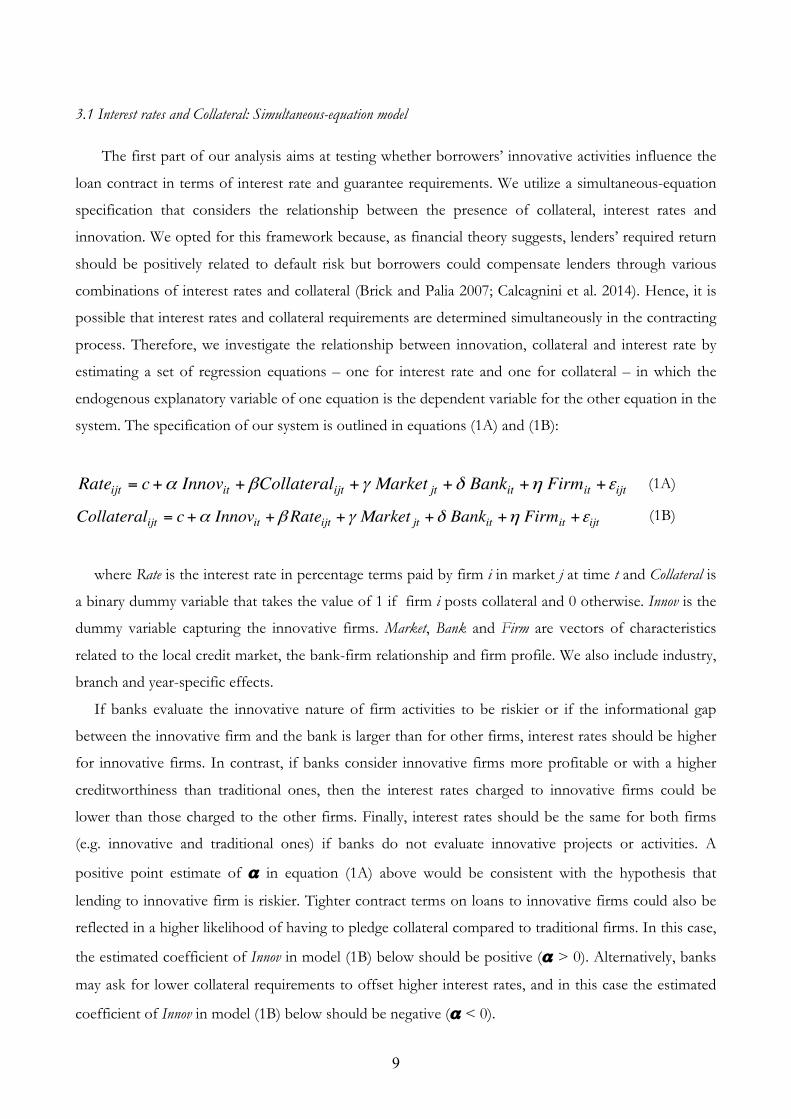
3.1 Interest rates and Collateral: Simultaneous-equation model
The first part of our analysis aims at testing whether borrowers’ innovative activities influence the
loan contract in terms of interest rate and guarantee requirements. We utilize a simultaneous-equation
specification that considers the relationship between the presence of collateral, interest rates and
innovation. We opted for this framework because, as financial theory suggests, lenders’ required return
should be positively related to default risk but borrowers could compensate lenders through various
combinations of interest rates and collateral (Brick and Palia 2007; Calcagnini et al. 2014). Hence, it is
possible that interest rates and collateral requirements are determined simultaneously in the contracting
process. Therefore, we investigate the relationship between innovation, collateral and interest rate by
estimating a set of regression equations – one for interest rate and one for collateral – in which the
endogenous explanatory variable of one equation is the dependent variable for the other equation in the
system. The specification of our system is outlined in equations (1A) and (1B):
(1A)
(1B)
where Rate is the interest rate in percentage terms paid by firm i in market j at time t and Collateral is
a binary dummy variable that takes the value of 1 if firm i posts collateral and 0 otherwise. Innov is the
dummy variable capturing the innovative firms. Market, Bank and Firm are vectors of characteristics
related to the local credit market, the bank-firm relationship and firm profile. We also include industry,
branch and year-specific effects.
If banks evaluate the innovative nature of firm activities to be riskier or if the informational gap
between the innovative firm and the bank is larger than for other firms, interest rates should be higher
for innovative firms. In contrast, if banks consider innovative firms more profitable or with a higher
creditworthiness than traditional ones, then the interest rates charged to innovative firms could be
lower than those charged to the other firms. Finally, interest rates should be the same for both firms
(e.g. innovative and traditional ones) if banks do not evaluate innovative projects or activities. A
positive point estimate of α in equation (1A) above would be consistent with the hypothesis that
lending to innovative firm is riskier. Tighter contract terms on loans to innovative firms could also be
reflected in a higher likelihood of having to pledge collateral compared to traditional firms. In this case,
the estimated coefficient of Innov in model (1B) below should be positive (α > 0). Alternatively, banks
may ask for lower collateral requirements to offset higher interest rates, and in this case the estimated
coefficient of Innov in model (1B) below should be negative (α < 0).
€
Rateijt = c+α Innovit +βCollateralijt +γ Market jt +δ Bankit +η Firmit +εijt
€
Collateralijt = c+α Innovit +βRateijt +γ Market jt +δ Bankit +η Firmit +εijt
10
Equations (1A) and (1B) explicitly show that Collateral and Interest Rates are determined
simultaneously, i.e.: we explain interest rates with collateral but collateral is also explained by interest
rates and other variables, and is not exogenous anymore. This result in endogeneity, i.e. Collateral
(I_Rate) is correlated with the error-term, and therefore OLS will lead to biased and inconsistent
estimates. Thus, we estimate the system of equations (1A)-(1B) by means of a Three Stage Least Square
regression (3-SLS). Differently from 2-SLS, 3-SLS uses the additional information that these equations
could be related through their error-terms, thus, increasing the efficiency of the results (Zellner and
Theil 1962). Specifically, we adopt I_Rate and Collateral as endogenous variables and we use the Rival
Distance, Rating, and Overdraw as additional exogenous variables; the latter are not included in any of the
system equations (1A)-(1B) - These variables will be added to the exogenous variables in the system and
used in the first stage as instruments for the endogenous variables.6
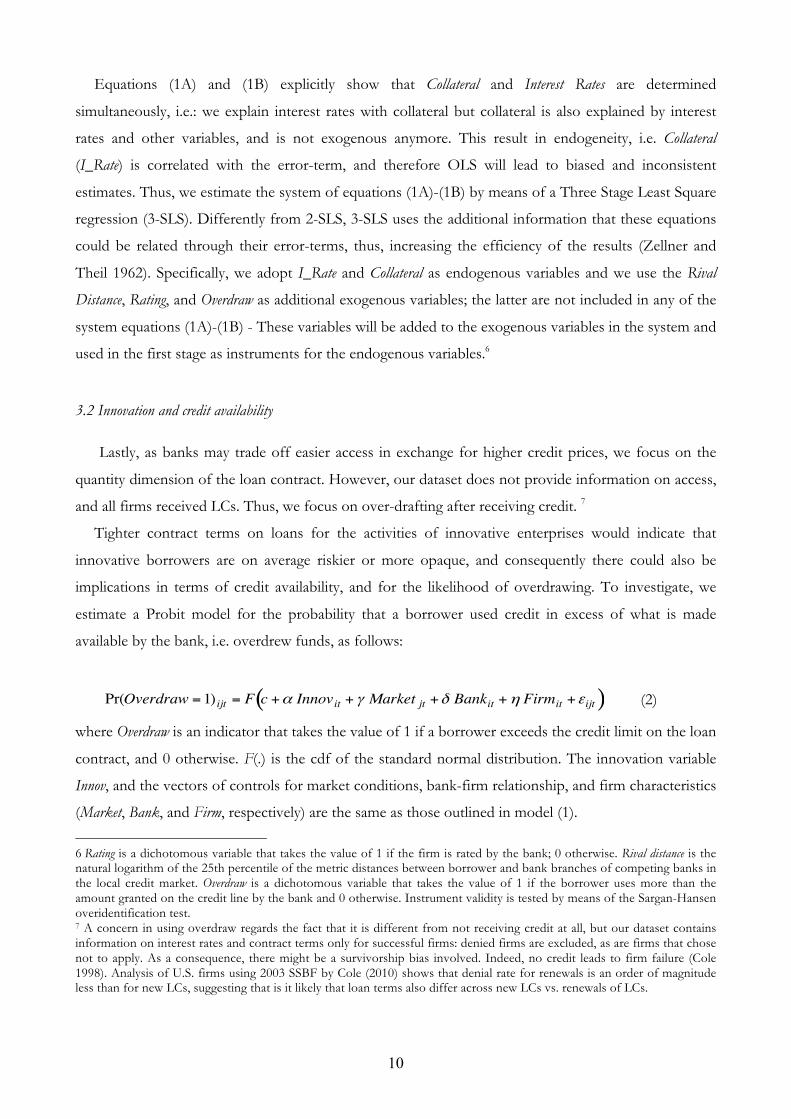
3.2 Innovation and credit availability
Lastly, as banks may trade off easier access in exchange for higher credit prices, we focus on the
quantity dimension of the loan contract. However, our dataset does not provide information on access,
and all firms received LCs. Thus, we focus on over-drafting after receiving credit. 7
Tighter contract terms on loans for the activities of innovative enterprises would indicate that
innovative borrowers are on average riskier or more opaque, and consequently there could also be
implications in terms of credit availability, and for the likelihood of overdrawing. To investigate, we
estimate a Probit model for the probability that a borrower used credit in excess of what is made
available by the bank, i.e. overdrew funds, as follows:
€
Pr(Overdraw =1) ijt = F c +α Innovit + γ Market jt +δ Bankit +η Firmit +εijt( ) (2)
where Overdraw is an indicator that takes the value of 1 if a borrower exceeds the credit limit on the loan
contract, and 0 otherwise. F(.) is the cdf of the standard normal distribution. The innovation variable
Innov, and the vectors of controls for market conditions, bank-firm relationship, and firm characteristics
(Market, Bank, and Firm, respectively) are the same as those outlined in model (1).
6 Rating is a dichotomous variable that takes the value of 1 if the firm is rated by the bank; 0 otherwise. Rival distance is the natural logarithm of the 25th percentile of the metric distances between borrower and bank branches of competing banks in the local credit market. Overdraw is a dichotomous variable that takes the value of 1 if the borrower uses more than the amount granted on the credit line by the bank and 0 otherwise. Instrument validity is tested by means of the Sargan-Hansen overidentification test. 7 A concern in using overdraw regards the fact that it is different from not receiving credit at all, but our dataset contains information on interest rates and contract terms only for successful firms: denied firms are excluded, as are firms that chose not to apply. As a consequence, there might be a survivorship bias involved. Indeed, no credit leads to firm failure (Cole 1998). Analysis of U.S. firms using 2003 SSBF by Cole (2010) shows that denial rate for renewals is an order of magnitude less than for new LCs, suggesting that is it likely that loan terms also differ across new LCs vs. renewals of LCs.
11
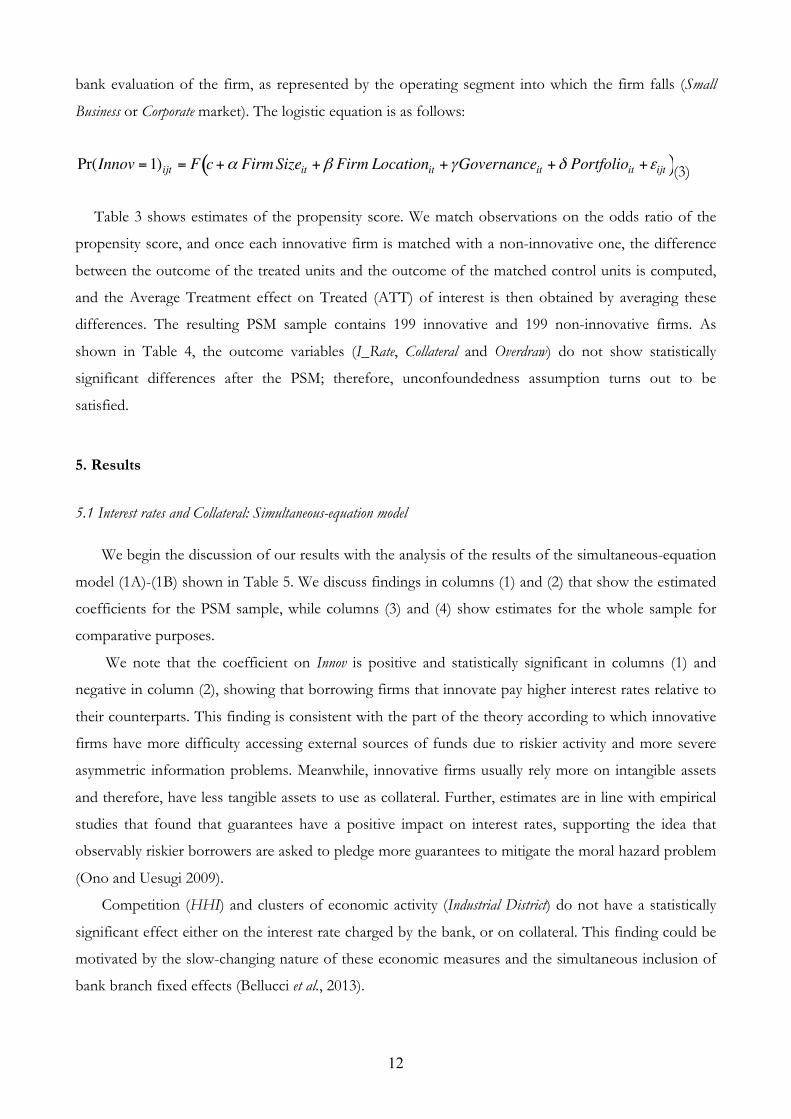
If innovation proxies for riskiness or for higher informational gap, borrowers dealing with
innovation activities should face more binding credit limits and thus should be more likely to overdraw
funds. Hence, a positive coefficient (α > 0) on the measure of innovation would be consistent with
lending practices of constraint. By contrast, a negative coefficient (α < 0) on the innovation variable
should reflect the fact that banks evaluate the innovation activity pursued positively.
4. Identification: propensity score matching results
Ideally, one should need innovative and non-innovative firms to be identical along every possible
dimension other than innovation. Unfortunately, this assumption does not hold in our dataset, as very
different types of firm are included in both groups, and innovative and non-innovative firms turn out
to be significantly different, as shown from the descriptive statistics in Table 2.
Thus, we need a method to solve the problem that innovative and non-innovative firms are different
along some dimension, which also explains innovation itself and, consequently, the outcome of our
models, i.e. bank behaviors in terms of interest rate, collateral requirements and overdraw. Indeed, for
example, most innovative firms are larger while non-innovative ones tend to be smaller, or the former
tend to be organized in a more highly structured business legal form than the latter. This aspect is
known as the ‘common support problem’: due to selection processes on the part of the banks that
decide how to grant credit among firms, the group of innovative firms is a special and selective one.
Thus, we opted to use propensity score matching (PSM), as has been done by, e.g. Almus and
Czarnitzki (2003) or Gorg and Strobl (2007), whose research specifically deals with the potential
common support problem in analyzing the impact of R&D subsidies on innovation. Under the
matching assumptions, the only difference between the treated and the control group on observables is
innovative activity, and hence one can evaluate the effect of innovation on bank contract characteristics
by estimating the difference in interest rates, collateral and overdraw between the treated group
(innovative firms) and the matched control group (non-innovative firms).
One crucial assumption of this approach is unconfoundedness, i.e. controlling for observables, the
outcomes of the non-treated are independent of innovation. The basic idea is to find in a large group of
non-innovative firms similar to the innovative firms in all relevant pre-treatment characteristics X. The
match should be based on variables that (i) simultaneously influence the treatment status and the
outcome variables; (ii) are unaffected by treatment. Furthermore, over-parameterized models should be
avoided (Grilli and Rampichini 2011).
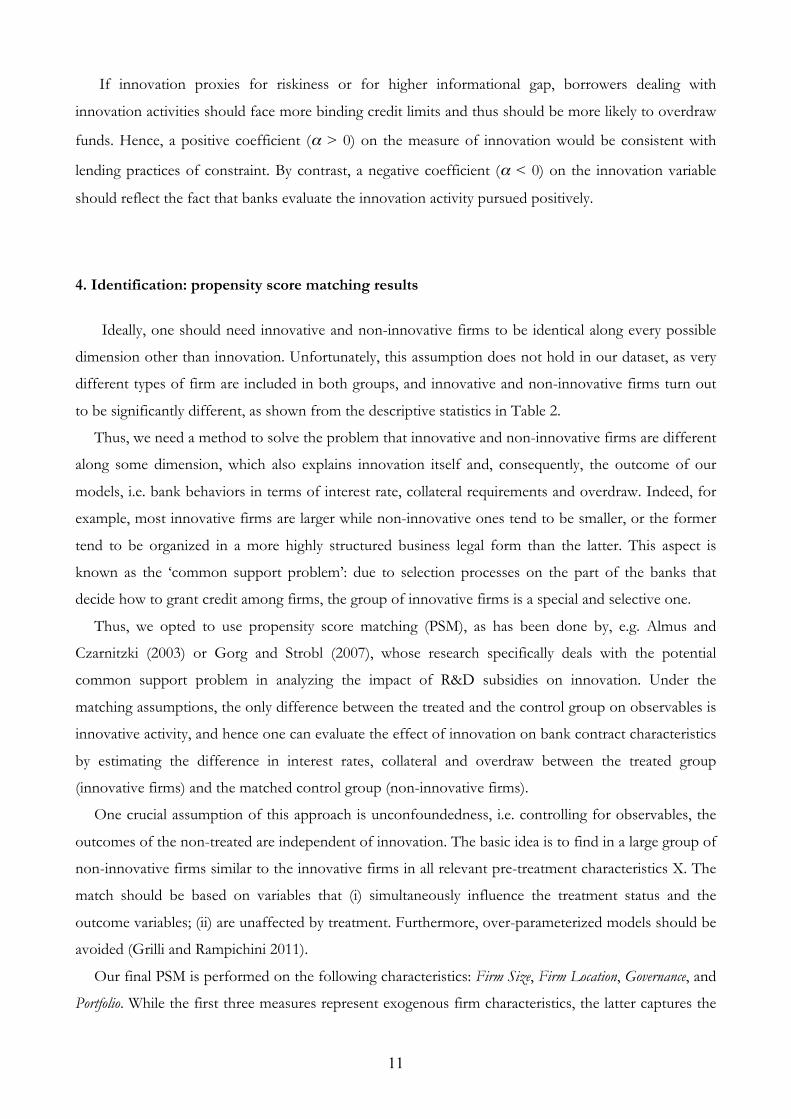
Our final PSM is performed on the following characteristics: Firm Size, Firm Location, Governance, and
Portfolio. While the first three measures represent exogenous firm characteristics, the latter captures the
12
bank evaluation of the firm, as represented by the operating segment into which the firm falls (Small
Business or Corporate market). The logistic equation is as follows:
€
Pr(Innov =1)ijt = F c+α FirmSizeit +β Firm Locationit +γGovernanceit +δ Portfolioit +εijt( )(3)
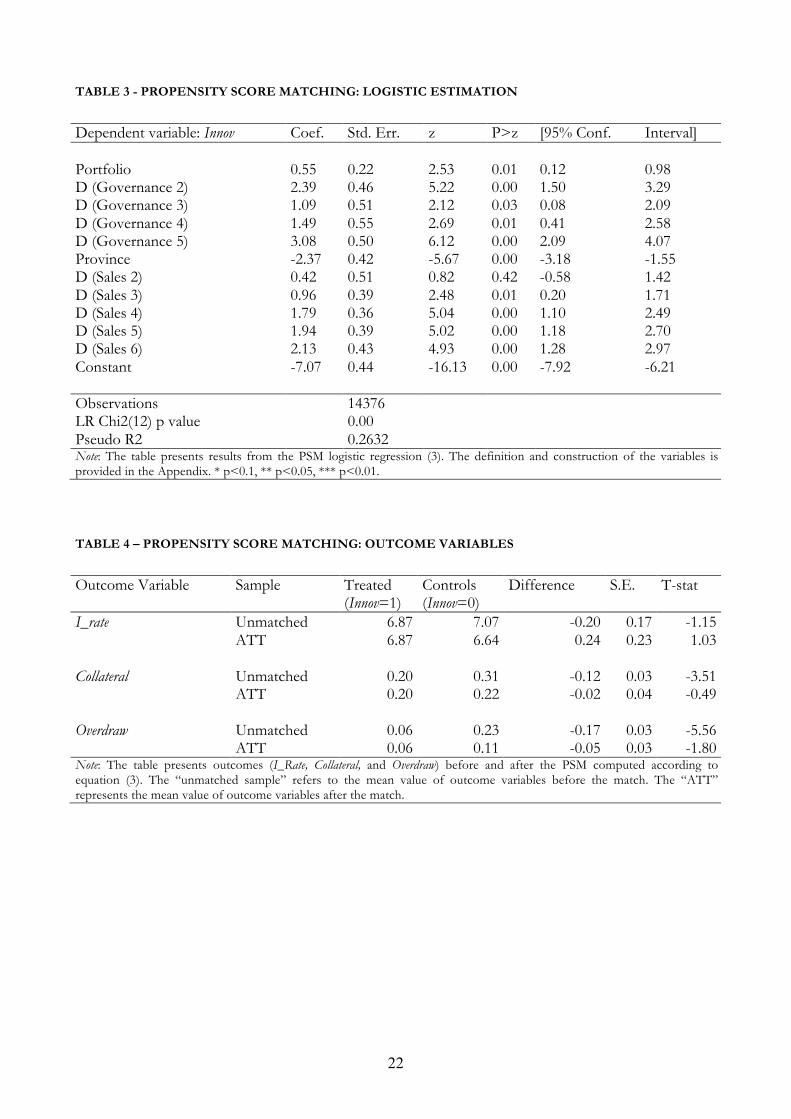
Table 3 shows estimates of the propensity score. We match observations on the odds ratio of the
propensity score, and once each innovative firm is matched with a non-innovative one, the difference
between the outcome of the treated units and the outcome of the matched control units is computed,
and the Average Treatment effect on Treated (ATT) of interest is then obtained by averaging these
differences. The resulting PSM sample contains 199 innovative and 199 non-innovative firms. As
shown in Table 4, the outcome variables (I_Rate, Collateral and Overdraw) do not show statistically
significant differences after the PSM; therefore, unconfoundedness assumption turns out to be
satisfied.
5. Results
5.1 Interest rates and Collateral: Simultaneous-equation model
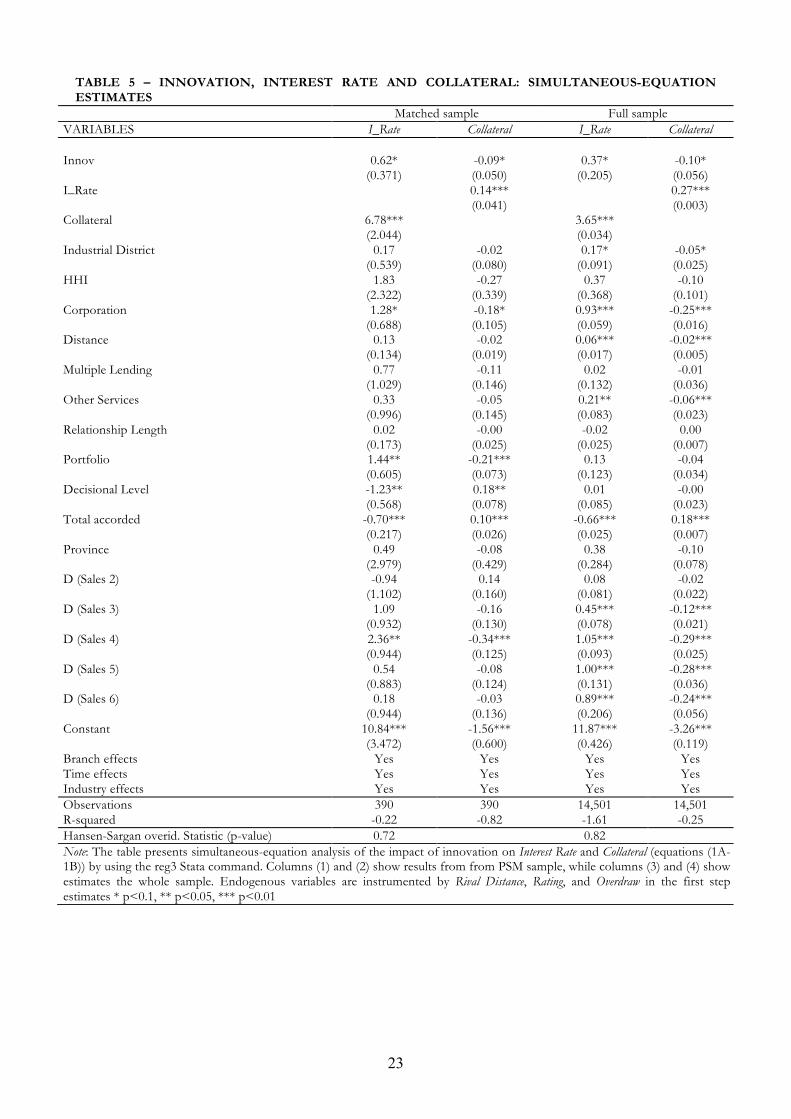
We begin the discussion of our results with the analysis of the results of the simultaneous-equation
model (1A)-(1B) shown in Table 5. We discuss findings in columns (1) and (2) that show the estimated
coefficients for the PSM sample, while columns (3) and (4) show estimates for the whole sample for
comparative purposes.
We note that the coefficient on Innov is positive and statistically significant in columns (1) and
negative in column (2), showing that borrowing firms that innovate pay higher interest rates relative to
their counterparts. This finding is consistent with the part of the theory according to which innovative
firms have more difficulty accessing external sources of funds due to riskier activity and more severe
asymmetric information problems. Meanwhile, innovative firms usually rely more on intangible assets
and therefore, have less tangible assets to use as collateral. Further, estimates are in line with empirical
studies that found that guarantees have a positive impact on interest rates, supporting the idea that
observably riskier borrowers are asked to pledge more guarantees to mitigate the moral hazard problem
(Ono and Uesugi 2009).
Competition (HHI) and clusters of economic activity (Industrial District) do not have a statistically
significant effect either on the interest rate charged by the bank, or on collateral. This finding could be
motivated by the slow-changing nature of these economic measures and the simultaneous inclusion of
bank branch fixed effects (Bellucci et al., 2013).
13
Firms organized as Corporations trade off a higher interest rate against lower collateral requirements.
The same finding holds for firms belonging to the bank corporate market: the estimated coefficients on
Portfolio show that credit lines, as part of the bank corporate market, have higher interest rates and a lower
probability of collateral requirements compared to those that are part of the bank’s small business market.
Further, larger loans pay a lower price for credit, as they are typically associated with larger firms
and they also generate economies of scale (Table 5 column (1)). However, they have a higher
probability of being secured (Table 5 Column (2)).
Concerning the variables that aim to capture the bank-borrower relationship, we find that
borrowers with longer and exclusive lending relationships do not seem to benefit in terms of price, or
collateral requirements, or that the use of other bank services is associated with lower interest rates or
collateral. Finally, the Decisional Level negatively affects the price of credit and positively affects the non-
price term of the loan contract, suggesting that the Headquarters decisional level prefers to trade off a
lower interest rate with higher collateral requirements.
In short, the positive association between innovation and interest rates is consistent both with an
argument for information-based frictions and with the riskier nature of the innovative firm reflected in
the Innov variable. On the other side, the fact that innovative firms face fewer collateral requirements
seems to suggest that banks trade off higher interests rates with lower collateral, likely because of the
nature of innovative firms, typically characterized by higher volatility and lower tangible assets than
their non-innovative peers.
5.2 Innovation and credit availability
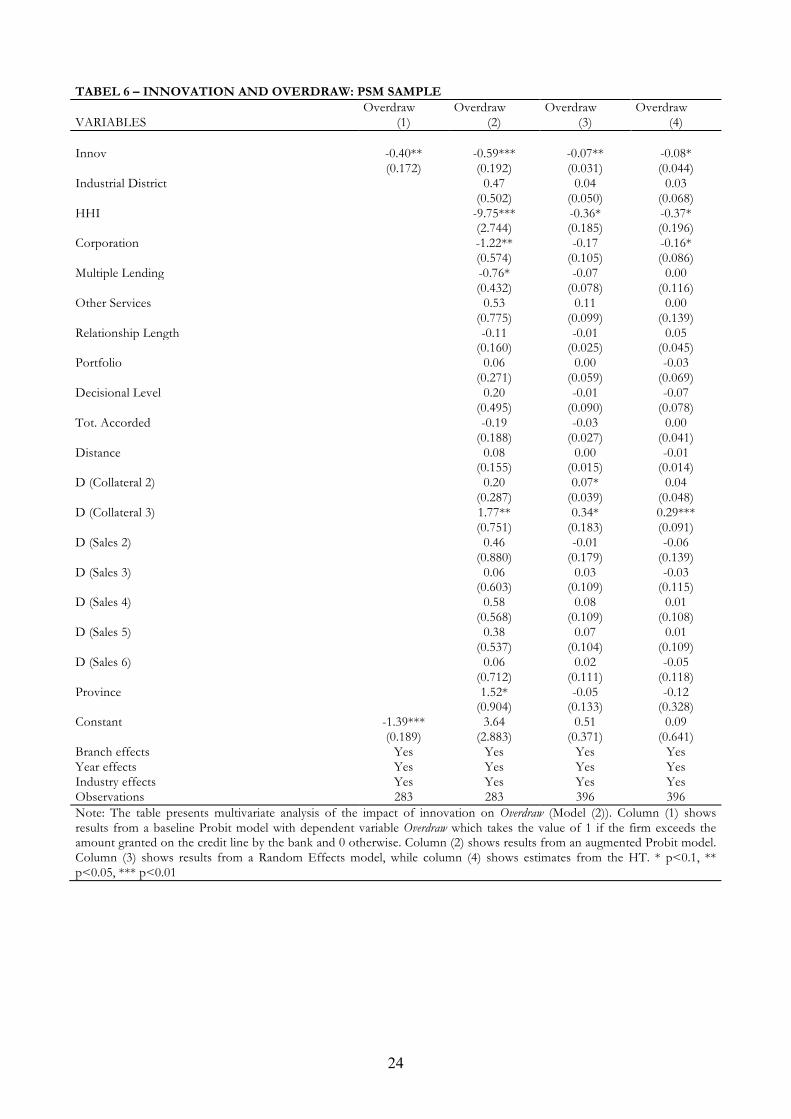
In Table 6 we examine the relation between innovation and credit availability formalized in
Equation (2) above. In the first specification (column 1) we estimate a baseline Probit model that
includes only our innovative variable, along with industry, year and branch-specific effects. Industry
effects are particularly important as some the most critical variables for evaluating the availability of
credit are measures of firm risk as leverage or credit score, and Cole (2013) finds that industry leverage
is highly correlated with firm leverage.
In column (2) we include a full set of control variables. In column (3) we exploit the longitudinal
dimension of our dataset using panel data estimators to control for unobserved individual effects,
which could systematically differ among entrepreneurs. To this end, we re-estimate our augmented
specification from column (2), including random effects. Indeed, our variable of interest, Innov, is nearly
time-invariant and we cannot use the Within estimator. Lastly, in column (4) we estimate model (1) by
using the Hausman and Taylor (1981) estimator (hereinafter, HT). In this procedure, some explanatory
variables are allowed to be correlated with the individual effects, and instrumented with the exogenous
regressors, the average across time of the exogenous time-variant regressors and the difference between

14
the endogenous time-variant variable and its individual average. Thus, in column (4) Tot accorded,
Relationship Length and Multiple Lending are assumed to be endogenous covariates.8
The analysis in Table 6 reveals that borrowers that carry out innovative activities are less likely to
overdraw funds, as the coefficient of Innov is negative and statistically significant in columns (1) and (2).
Specifically, the marginal non-tabulated effect of this variable is equal to -0.08, i.e.: being innovative
firms reduces the probability of having to face binding credit limits by 8%. Furthermore, we note that
our panel estimators – random effects model in column (3) and HT model in column (4) where Tot
accorded, Relationship Length and Multiple Lending are assumed to be endogenous covariates – generate
results that confirm the negative association between overdraw and innovation.
Our findings suggest a strong association between firms’ innovation activities and credit tightness,
and this association seems to be in favor of innovation. Indeed, innovative firms are less likely to
overdraw funds, and thus face less binding credit limits than their non-innovative peers.
This result suggests a bank’s side dual explanation. First, banks gain the advantage of evaluating the
riskier innovative firms, charging them a higher price and lower collateral requirements. Secondly,
banks also recognize that innovative firms are more profitable than traditional firms, and “repay” them
with less binding credit limits. Lastly, from a demand side perspective, innovation activities are often
subsidized and thus firms that carry on R&D projects might have access to public funds (see Table 1)
and consequently a lower probability of overdrawing. Unfortunately, this latter information is not
available in our data.
To the best of our knowledge, we provide the first evidence on the fact that the ability of firms to
innovate reduces the probability of overdrawing funds. Thus, firms that innovate have better access to
the credit market in non-price terms; furthermore banks seem to recognize the opportunity of evaluating
the potential high growth and profitability of innovative firms positively.
Turning the analysis of the control variables on the availability of credit (Table 6), we find that local
market concentration, as measured by HHI reduces the probability of overdrawing, in line with
Audretsch and Elston (2002), in which emerging competition has improved access to capital for some
groups of firms. Furthermore, firms organized in more structured legal forms, i.e. Corporations, have a
lower probability of experiencing binding credit limits, in line with the theory according to which more
solid firms have better access to credit markets.
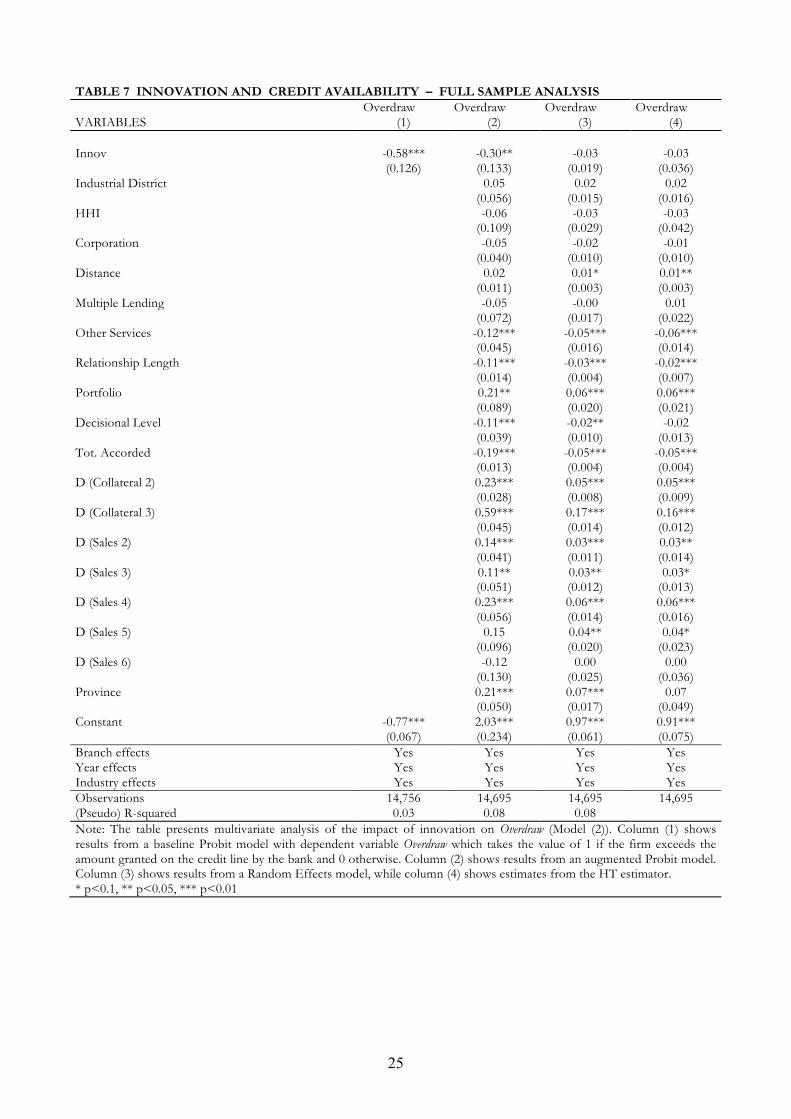
Table 7 shows estimated coefficients of equation (2) for the full sample, and findings on the impact
of innovation on overdraw are confirmed. Furthermore, this Table also shows that the length of the
lending relationship has a positive effect on the quantity dimension of the loan contract, helping to
build trust between borrowers and lenders (Boot and Thakor 1994). Moreover, we find that the use of
other bank services is associated with lower probability of overdrawing. Indeed, the scope of the
relationship allows banks to accumulate soft information that enhances banks’ ability to assess and 8 For comparative purposes, Table 7 shows estimates for the full sample.
15
monitor their customers, and thus to offer better contract terms than other firms. Firms experience a
lower probability of overdrawing when their credit lines are managed at the headquarters level, as the
indicator Decisional Level is negative and statistically significant. Collateralized credit lines continue to
present a higher probability of overdrawing funds than unsecured ones. As expected, the amount of
credit reduces the probability of binding credit limits (as shown from the estimated coefficient of Tot.
Accorded in columns (2) to (4) in Table 7), credit lines of the corporate market portfolios seem to
experience higher probabilities of overdraw. The same finding is confirmed for large-sized firms.
To summarize, the positive association between innovation and interest rates is consistent both
with an argument for information-based frictions and with the riskier nature of the innovative firm
reflected in the Innov variable. On the other hand, the fact that innovative firms face less binding credit
limits and thus are less likely to overdraw funds might be justified both by the high profitability and rate
of growth typically associated with these firms, and/or by advancements made in public policies to
stimulate and subsidize R&D (OECD 2011). In the next paragraphs we provide additional evidence on
the links between innovation and credit availability.
5.3 Innovation as a Signal: Sub-sample Analyses
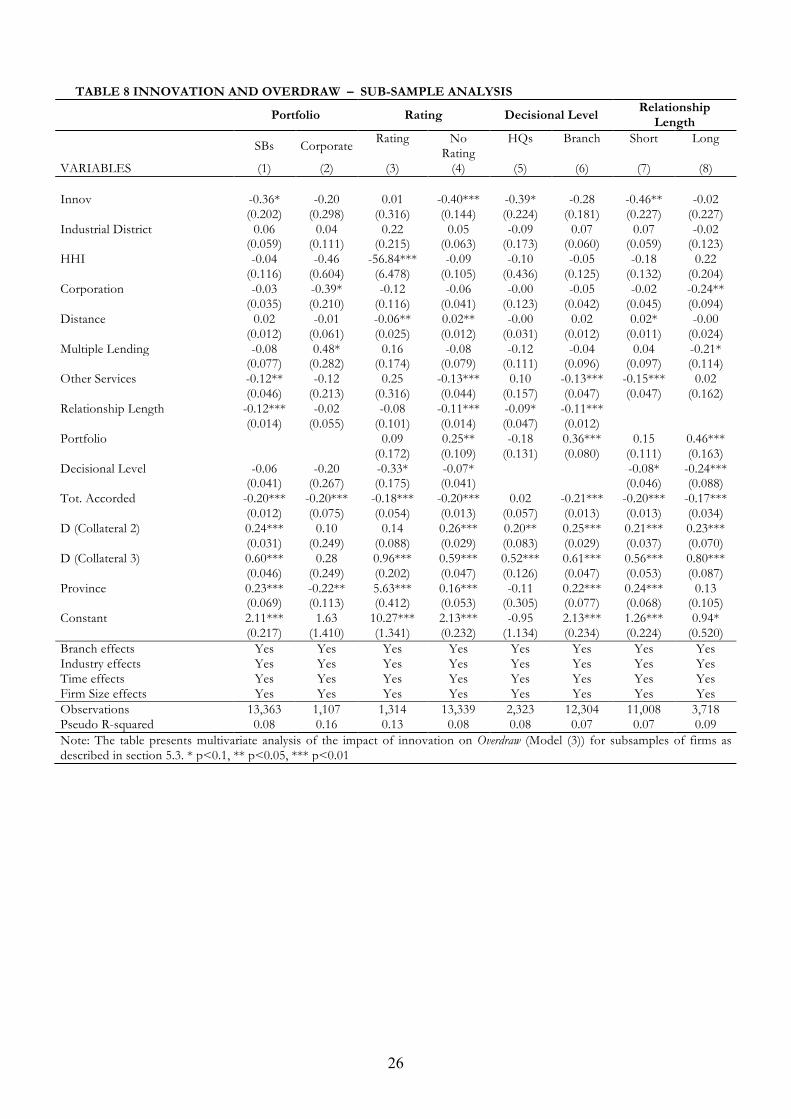
In this section we categorize the firms in our sample into sub-samples from a supply-side
perspective intended to identify cross-sectional differences in terms of firm transparency. We re-
estimate the model of credit availability specified in Model (2) for each sub-sample and draw inferences
from these sub-sample analyses shown in Table 8. In each estimation we include the full set of controls
used in the estimation of the augmented Probit model in Table 7, column (2).9
The first sub-sample categorization considers a measure of the informational advantage of the
lending bank for a firm relative to other firms of this bank, i.e. the operating segment type. The sample
is divided into two sub-groups: firms that are in the small business portfolio and firms that are in the
corporate portfolio. Usually, decisions about the small business portfolio are taken through traditional
banking channels at branch premises. By contrast, for firms that fall in the corporate portfolio, bank
loan officers usually visit the firm’s premises and negotiate the contract terms directly (Bellucci et al.,
2013). This sub-sample analysis shows that the coefficient on Innov is negative and significant only for
firms in the small business portfolio, column (1) of Table 8. Hence, banks evaluate small businesses that
innovate positively. Meanwhile, when the lender deals with firms in the corporate portfolio, credit
availability is not affected by innovation and the decision relies on other firm characteristics.
The second sub-sample division classifies firms according to whether the bank has assigned a credit
rating to the firm or not. In the first case, banks rely on additional information about the credit risk of
the firm. The findings reveal that firms that innovate face less binding constraints than other firms in
9 Unfortunately, we cannot perform this analysis on the PSM sample because of the poor number of observations we had in each sub sample.
16
the case of they are not rated (4). It follows that, when ratings are available, banks base their decisions
on them and are not influenced by the presence or lack of an innovative activity carried out by the firm.
The third part of the sample considers whether the credit line is approved and managed at the local
bank branch. In this case, loan officers operating at the branch level may not have enough instruments
to evaluate the projects of innovative firms and their potential growth. Hence, one should observe that
the importance of innovation in the availability of credit is less pronounced when decisions are taken at
a local bank branch. Consistent with this argument, the coefficient on Innov is negative and statistically
significant only for the sub-sample of firms whose credit lines are managed at the headquarters level
(column (5)).
The last sub-sample categorization uses the variable Relationship Length to split the sample in two
sub-groups: Short relationship length (if less than the sample median) and Long relationship length (if it
exceeds the sample median). The rationale for this partition is that as long as the firm maintains a long-
lasting relationship with its bank, loan officers usually base their decisions on soft information
accumulated during the years. Diversely, if the firm is a new client or the lending relationship has been
brief, banks may evaluate the information concerning the innovative nature of the firm in a positive
manner. Thus, among firms without a well-established lending relationship, those who are considered
innovative may face less binding constraints. As expected, the coefficient on Innov is negative and
statistically significant only for firms who do not have a long-lasting lending relationship, as shown in
column (7).
Overall, our sub-sample analyses reveal that innovation is a key determinant for the probability that
a firm will experience binding credit limits for those firms that are more likely to suffer from
information asymmetry. Among them, banks evaluate positively, in term of credit availability, the
presence of an innovative activity carried out by the firm.
6. Conclusions
This article carried out an empirical analysis of the access to credit by innovative firms compared to
traditional ones in price and non-price terms. Our findings reveal a positive association between
innovation and interest rates, and are consistent both with an argument for information-based frictions
and with the riskier nature of innovative firms compared to traditional ones. However, we also find that
innovative firms face less binding credit limits and thus are less likely to overdraw funds than the
others. These findings together suggest that, on one hand, banks evaluate innovative firms to be riskier,
and then charge them a higher price.
At the same time, on the other hand, banks also seem to recognize that innovative firms are more
profitable than other firms, and reward them with less binding credit limits. Our analysis also shows
that innovation is a key determinant for the probability that a firm will experience binding credit limits
17
for those firms that are more likely to suffer from problems of information asymmetry. Among them,
banks evaluate positively, in term of credit availability, the presence of an innovative activity carried out
by the firm. Meanwhile, for those firms that are well known by the bank and for which the loan officers
may rely on additional information, being innovative is not a key determinant. These findings seem to
suggest that innovation may reduce the presence of credit constraints among those firms that, typically,
may suffer more from financing constraints. For these firms, innovation may help to avoid the costly
option of overdrawing expensive funds.
References Acs, Z. J., & Audretsch, D. B. (1987). Innovation, market structure, and firm size. The Review of
Economics and Statistics, 69, 567–574.
Almus, M., & Czarnitzki, D., (2003). The effects of public R&D subsidies on firms’ innovation
activities: the case of Eastern Germany. Journal of Business & Economic Statistics, 21, 226–36.
Audretsch, D. B., & Elston, J. A. (2002). Does firm size matter? Evidence on the impact of liquidity
constraints on firm investment behavior in Germany. International Journal of Industrial Organization,
20, 1–17.
Bellucci, A., Borisov, A., & Zazzaro, A. (2013). Do banks price discriminate spatially? Evidence from
Small Business Lending in local credit markets. Journal of Banking and Finance, 37, 4183–4197.
Benfratello L., Schiantarelli, F., & Sembenelli, A. (2008). Banks and Innovation: Microeconometric
Evidence on Italian Firms. Journal of Financial Economics, 90, 197-217.
Berger, A.N., & Udell, G. F. (1998) The Economics of Small Business Finance: The Roles of Private
Equity and Debt Markets in the Financial Growth Cycle. Journal of Banking & Finance, 22, 613-
673.
Berger, A. N., Klapper, L.F., & Udell, G. F. (2001) The ability of banks to lend to informationally
opaque small business. Journal of Banking and Finance, 25, 2127-2162.
Boot, A., & Thakor, A.V. (1994). Moral hazard and secured lending in an infinitely repeated credit
market game. International Economic Review, 35, 899-920.
Brick, I.E., & Palia, D. (2007). Evidence of jointness in the terms of relationship lending, Journal of
Financial Intermediation, 16, 452-476.
Brown, M., Degryse, H., Hower, D., & Penas, M.F. (2012). How do banks screen innovative firms?
Evidence from start-up panel data. ZEW discussion paper No. 12-032.
18
Calcagnini, G., Farabullini, I., & Giombini, G. (2014). The impact of guarantees on bank loan interest
rates. Applied Financial Economics, doi: 10.1080/09603107.2014.881967.
Canepa, A., & Stoneman, P. (2008). Financial constraints to innovation in the UK: evidence from CIS”
and CIS3. Oxford economic papers 60, (4) 711-730.
Chava, S., Nanda, V., & Xiao, S.C. (2013). Lending to innovative firms: The role of lender expertise and
control rights. WP SSRN 2270740.
Cole, R., (2013). What Do We Know about the Capital Structure of Privately Held US Firms? Evidence
from the Surveys of Small Business Finance. Financial Management, 42, 777-813.
Cole, R., (2010). Bank credit, trade credit or no credit: Evidence from the Surveys of Small Business
Finances. MPRA Paper 24689, University Library of Munich, Germany.
Cole, R. (1998). The importance of relationships to the availability of credit. Journal of Banking and
Finance, 22, 959-977.
Cole, R., & Wolken, J. D. (1995). Financial services used by small businesses: evidence from the 1993
National Survey of Small Business Finances. Federal Reserve Bulletin, Board of Governors of the
Federal Reserve System (U.S.), issue Jul, 629-667.
Czarnitzki, D. (2006). Research And Development In Small And Medium-Sized Enterprises: The Role
Of Financial Constraints And Public Funding. Scottish Journal of Political Economy, 53, 335-357.
Czarnitzki, D., & Hottenrott, H. (2011). R&D investment and financing constraints of small and
medium-sized firms. Small Business Economics, 36, 65–83.
Favaretto, I., & Zanfei, A. (2007). Rapporto Finale 2007 – Innovazione e Centri di Ricerca nelle
Marche, Progetto Inter-universitario, Università di Urbino.
Freel, M.S. (2007). Are Small Innovators Credit Rationed?. Small Business Economics, 28, 23–35.
Fritsch, M., Brixy, U., & Falck, O. (2006). The Effect of Industry, Region and Time on New Business
Survival - A Multi-Dimensional Analysis. Review of Industrial Organization, 28, 285–306.
Gambini, A., Zazzaro, A., (2012). Long-lasting bank relationships and growth of firms. Small Business
Economics 40, 977–1007.
Gorg, H., & Strobl, E. (2007). The Effect of R&D Subsidies on Private R&D. Economica, 74, 215–
234.
Grilli, L., & Rampichini, C. (2011). Propensity scores for the estimation of average treatment effects in
observational studies. Available at:
http://www.bristol.ac.uk/cmm/software/support/workshops/materials/causal-inference/prop-
scores.pdf
Guidici, G., & Paleari, S. (2000). The Provision of Finance to Innovation: A Survey Conducted among
Italian Technology-based Small Firms. Small Business Economics, 14, 37-53.
Hausman J.A., & Taylor W.E. (1981). Panel data and unobservable individual effects. Econometrica,
49, 1377-1398.
19
Hall, B., (2010). The financing of Innovative firms. Review of Economics and Institutions 1, 1(4).
Hall, B., (2002). The Financing of Research and Development. Oxford Review of Economic Policy, 18,
35-51.
Himmelberg, C. P., & Petersen, B.C. (1994). R&D and Internal Finance: A Panel Study of Small Firms
in High-Tech Industries. The Review of Economics and Statistics, 76, 38-51.
Levin, R. C., Cohen, W. M., and Mowery, D. C. (1985). R & D appropriability, opportunity, and market
structure: new evidence on some Schumpeterian hypotheses. The American Economic Review 75,
20–24.
Liberti, J.M., & Mian, A. (2009). Estimating the effect of hierarchies. Review of Financial Studies 22,
4057–4090.
Mocnik, D., (2001). Asset specificity and a firm’s borrowing ability: an empirical analysis of
manufacturing firms. Journal of Economics Behavior and Organization, 45, 69-81.
OECD (2011). Financing High-Growth Firms. Paris.
Ono, A., & Uesugi, I. (2009). The Role of Collateral and Personal Guarantees in Relationship Lending:
Evidence from Japan’s SME Loan Market. Journal of Money, Credit, and Banking, 41, 935-960.
Zellner, A., & Theil, H. (1962). Three-Stage Least Squares: Simultaneous Estimation of Simultaneous
Equations. Econometrica, 30, 54-78.

20
TABLE 1 - ACTIVITIES OF R&D
ACTIVITY DESCRIPTION CORDIS PROJECTS
Community Research and Development Information Service (Cordis)
projects that firms located in these provinces participated in this lapse of time.
USPTO PATENTS Patents registered to United States Patent and Trademark Office (USPTO) by firms located in our referred provinces.
EPO PATENTS Patents registered to Europena Patent Office (EPO) by firms located in our referred provinces.
UIB PATENTS Patents registered to Italian Patent Office (UIB) by firms located in our referred provinces.
NATIONAL REGISTRY OFFICE Firms registered at “Anagrafe Nazionale delle Ricerche” (ANR). ANR is a national registry office where firms registration’ is mandatory obtaining public funds for R&D.
FAR PROJECTS Projects funded by the Ministry of Education, University and Research (MIUR) through the “Fondo Agevolazioni alla Ricerca” (FAR). FAR is a public national fund supporting firms national projects’ in R&D following the laws 299/97, 488, ex l.46.
REGISTER OF LABORATORIES Register of Laboratories managed by the Ministry of Education, University and Research (MIUR). Firms are registered only after a selective evaluation of activities by a specific departmental office.
REGIONAL PROJECTS Firms projects’ financed by regional funds to incentive R&D with regional law 73°, 73b/2003.
21
TABLE 2 - SUMMARY STATISTICS: INNOVATIVE VS. TRADITIONAL FIRMS
All firms Innovative Firms Traditional Firms Means
differences Mean St. dev. Mean St. dev. Mean St. dev. p-values Dependent variables Interest rate 7.043 (2.470) 6.588 (2.445) 7.050 (2.470) 0.004*** Overdraw 0.220 (0.414) 0.061 (0.240) 0.222 (0.416) 0.000*** Collateral 0.301 (0.459) 0.175 (0.381) 0.303 (0.459) 0.000*** Innovation variables Innov 0.015 (0.123) Control variables Industrial district 0.585 (0.493) 0.795 (0.405) 0.582 (0.493) 0.000 *** HHI 0.213 (0.155) 0.165 (0.116) 0.213 (0.155) 0.000 *** Sales 2.256 (1.673) 4.876 (1.735) 2.215 (1.639) 0.000 *** Corporation 0.339 (0.473) 0.923 (0.267) 0.330 (0.470) 0.000 *** Multiple Lending 0.960 (0.195) 0.961 (0.193) 0.960 (0.195) 0.917 Other Services 0.911 (0.284) 0.974 (0.158) 0.910 (0.286) 0.001 *** Relationship Length 3380 (2724) 5089 (3219) 3353 (3708) 0.000 *** Portfolio 0.103 (0.304) 0.594 (0.492) 0.095 (0.293) 0.000 *** Decisional Level 0.178 (0.383) 0.581 (0.494) 0.172 (0.377) 0.000 *** Credit Limit 117,234 (595,432) 1,008,559 (2,805,378) 103,538 (476,641) 0.000 *** Credit Used 80,120 (392,907) 542,707 (1,710,773) 72,992 (329,393) 0.000 *** Rating 5.675 (1.512) 4.923 (2.104) 5.704 (1.478) 0.000 ***
22
TABLE 3 - PROPENSITY SCORE MATCHING: LOGISTIC ESTIMATION
Dependent variable: Innov Coef. Std. Err. z P>z [95% Conf. Interval] Portfolio 0.55 0.22 2.53 0.01 0.12 0.98 D (Governance 2) 2.39 0.46 5.22 0.00 1.50 3.29 D (Governance 3) 1.09 0.51 2.12 0.03 0.08 2.09 D (Governance 4) 1.49 0.55 2.69 0.01 0.41 2.58 D (Governance 5) 3.08 0.50 6.12 0.00 2.09 4.07 Province -2.37 0.42 -5.67 0.00 -3.18 -1.55 D (Sales 2) 0.42 0.51 0.82 0.42 -0.58 1.42 D (Sales 3) 0.96 0.39 2.48 0.01 0.20 1.71 D (Sales 4) 1.79 0.36 5.04 0.00 1.10 2.49 D (Sales 5) 1.94 0.39 5.02 0.00 1.18 2.70 D (Sales 6) 2.13 0.43 4.93 0.00 1.28 2.97 Constant -7.07 0.44 -16.13 0.00 -7.92 -6.21 Observations 14376 LR Chi2(12) p value 0.00 Pseudo R2 0.2632 Note: The table presents results from the PSM logistic regression (3). The definition and construction of the variables is provided in the Appendix. * p<0.1, ** p<0.05, *** p<0.01.
TABLE 4 – PROPENSITY SCORE MATCHING: OUTCOME VARIABLES
Outcome Variable Sample Treated
(Innov=1) Controls (Innov=0)
Difference S.E. T-stat
I_rate Unmatched 6.87 7.07 -0.20 0.17 -1.15 ATT 6.87 6.64 0.24 0.23 1.03 Collateral Unmatched 0.20 0.31 -0.12 0.03 -3.51 ATT 0.20 0.22 -0.02 0.04 -0.49 Overdraw Unmatched 0.06 0.23 -0.17 0.03 -5.56 ATT 0.06 0.11 -0.05 0.03 -1.80 Note: The table presents outcomes (I_Rate, Collateral, and Overdraw) before and after the PSM computed according to equation (3). The “unmatched sample” refers to the mean value of outcome variables before the match. The “ATT” represents the mean value of outcome variables after the match.
23
TABLE 5 – INNOVATION, INTEREST RATE AND COLLATERAL: SIMULTANEOUS-EQUATION ESTIMATES
Matched sample Full sample VARIABLES I_Rate Collateral I_Rate Collateral Innov 0.62* -0.09* 0.37* -0.10* (0.371) (0.050) (0.205) (0.056) I_Rate 0.14*** 0.27*** (0.041) (0.003) Collateral 6.78*** 3.65*** (2.044) (0.034) Industrial District 0.17 -0.02 0.17* -0.05* (0.539) (0.080) (0.091) (0.025) HHI 1.83 -0.27 0.37 -0.10 (2.322) (0.339) (0.368) (0.101) Corporation 1.28* -0.18* 0.93*** -0.25*** (0.688) (0.105) (0.059) (0.016) Distance 0.13 -0.02 0.06*** -0.02*** (0.134) (0.019) (0.017) (0.005) Multiple Lending 0.77 -0.11 0.02 -0.01 (1.029) (0.146) (0.132) (0.036) Other Services 0.33 -0.05 0.21** -0.06*** (0.996) (0.145) (0.083) (0.023) Relationship Length 0.02 -0.00 -0.02 0.00 (0.173) (0.025) (0.025) (0.007) Portfolio 1.44** -0.21*** 0.13 -0.04 (0.605) (0.073) (0.123) (0.034) Decisional Level -1.23** 0.18** 0.01 -0.00 (0.568) (0.078) (0.085) (0.023) Total accorded -0.70*** 0.10*** -0.66*** 0.18*** (0.217) (0.026) (0.025) (0.007) Province 0.49 -0.08 0.38 -0.10 (2.979) (0.429) (0.284) (0.078) D (Sales 2) -0.94 0.14 0.08 -0.02 (1.102) (0.160) (0.081) (0.022) D (Sales 3) 1.09 -0.16 0.45*** -0.12*** (0.932) (0.130) (0.078) (0.021) D (Sales 4) 2.36** -0.34*** 1.05*** -0.29*** (0.944) (0.125) (0.093) (0.025) D (Sales 5) 0.54 -0.08 1.00*** -0.28*** (0.883) (0.124) (0.131) (0.036) D (Sales 6) 0.18 -0.03 0.89*** -0.24*** (0.944) (0.136) (0.206) (0.056) Constant 10.84*** -1.56*** 11.87*** -3.26*** (3.472) (0.600) (0.426) (0.119) Branch effects Yes Yes Yes Yes Time effects Yes Yes Yes Yes Industry effects Yes Yes Yes Yes Observations 390 390 14,501 14,501 R-squared -0.22 -0.82 -1.61 -0.25 Hansen-Sargan overid. Statistic (p-value) 0.72 0.82 Note: The table presents simultaneous-equation analysis of the impact of innovation on Interest Rate and Collateral (equations (1A-1B)) by using the reg3 Stata command. Columns (1) and (2) show results from from PSM sample, while columns (3) and (4) show estimates the whole sample. Endogenous variables are instrumented by Rival Distance, Rating, and Overdraw in the first step estimates * p<0.1, ** p<0.05, *** p<0.01
24
TABEL 6 – INNOVATION AND OVERDRAW: PSM SAMPLE Overdraw Overdraw Overdraw Overdraw VARIABLES (1) (2) (3) (4) Innov -0.40** -0.59*** -0.07** -0.08* (0.172) (0.192) (0.031) (0.044) Industrial District 0.47 0.04 0.03 (0.502) (0.050) (0.068) HHI -9.75*** -0.36* -0.37* (2.744) (0.185) (0.196) Corporation -1.22** -0.17 -0.16* (0.574) (0.105) (0.086) Multiple Lending -0.76* -0.07 0.00 (0.432) (0.078) (0.116) Other Services 0.53 0.11 0.00 (0.775) (0.099) (0.139) Relationship Length -0.11 -0.01 0.05 (0.160) (0.025) (0.045) Portfolio 0.06 0.00 -0.03 (0.271) (0.059) (0.069) Decisional Level 0.20 -0.01 -0.07 (0.495) (0.090) (0.078) Tot. Accorded -0.19 -0.03 0.00 (0.188) (0.027) (0.041) Distance 0.08 0.00 -0.01 (0.155) (0.015) (0.014) D (Collateral 2) 0.20 0.07* 0.04 (0.287) (0.039) (0.048) D (Collateral 3) 1.77** 0.34* 0.29*** (0.751) (0.183) (0.091) D (Sales 2) 0.46 -0.01 -0.06 (0.880) (0.179) (0.139) D (Sales 3) 0.06 0.03 -0.03 (0.603) (0.109) (0.115) D (Sales 4) 0.58 0.08 0.01 (0.568) (0.109) (0.108) D (Sales 5) 0.38 0.07 0.01 (0.537) (0.104) (0.109) D (Sales 6) 0.06 0.02 -0.05 (0.712) (0.111) (0.118) Province 1.52* -0.05 -0.12 (0.904) (0.133) (0.328) Constant -1.39*** 3.64 0.51 0.09 (0.189) (2.883) (0.371) (0.641) Branch effects Yes Yes Yes Yes Year effects Yes Yes Yes Yes Industry effects Yes Yes Yes Yes Observations 283 283 396 396 Note: The table presents multivariate analysis of the impact of innovation on Overdraw (Model (2)). Column (1) shows results from a baseline Probit model with dependent variable Overdraw which takes the value of 1 if the firm exceeds the amount granted on the credit line by the bank and 0 otherwise. Column (2) shows results from an augmented Probit model. Column (3) shows results from a Random Effects model, while column (4) shows estimates from the HT. * p<0.1, ** p<0.05, *** p<0.01
25
TABLE 7 INNOVATION AND CREDIT AVAILABILITY – FULL SAMPLE ANALYSIS Overdraw Overdraw Overdraw Overdraw VARIABLES (1) (2) (3) (4) Innov -0.58*** -0.30** -0.03 -0.03 (0.126) (0.133) (0.019) (0.036) Industrial District 0.05 0.02 0.02 (0.056) (0.015) (0.016) HHI -0.06 -0.03 -0.03 (0.109) (0.029) (0.042) Corporation -0.05 -0.02 -0.01 (0.040) (0.010) (0.010) Distance 0.02 0.01* 0.01** (0.011) (0.003) (0.003) Multiple Lending -0.05 -0.00 0.01 (0.072) (0.017) (0.022) Other Services -0.12*** -0.05*** -0.06*** (0.045) (0.016) (0.014) Relationship Length -0.11*** -0.03*** -0.02*** (0.014) (0.004) (0.007) Portfolio 0.21** 0.06*** 0.06*** (0.089) (0.020) (0.021) Decisional Level -0.11*** -0.02** -0.02 (0.039) (0.010) (0.013) Tot. Accorded -0.19*** -0.05*** -0.05*** (0.013) (0.004) (0.004) D (Collateral 2) 0.23*** 0.05*** 0.05*** (0.028) (0.008) (0.009) D (Collateral 3) 0.59*** 0.17*** 0.16*** (0.045) (0.014) (0.012) D (Sales 2) 0.14*** 0.03*** 0.03** (0.041) (0.011) (0.014) D (Sales 3) 0.11** 0.03** 0.03* (0.051) (0.012) (0.013) D (Sales 4) 0.23*** 0.06*** 0.06*** (0.056) (0.014) (0.016) D (Sales 5) 0.15 0.04** 0.04* (0.096) (0.020) (0.023) D (Sales 6) -0.12 0.00 0.00 (0.130) (0.025) (0.036) Province 0.21*** 0.07*** 0.07 (0.050) (0.017) (0.049) Constant -0.77*** 2.03*** 0.97*** 0.91*** (0.067) (0.234) (0.061) (0.075) Branch effects Yes Yes Yes Yes Year effects Yes Yes Yes Yes Industry effects Yes Yes Yes Yes Observations 14,756 14,695 14,695 14,695 (Pseudo) R-squared 0.03 0.08 0.08 Note: The table presents multivariate analysis of the impact of innovation on Overdraw (Model (2)). Column (1) shows results from a baseline Probit model with dependent variable Overdraw which takes the value of 1 if the firm exceeds the amount granted on the credit line by the bank and 0 otherwise. Column (2) shows results from an augmented Probit model. Column (3) shows results from a Random Effects model, while column (4) shows estimates from the HT estimator. * p<0.1, ** p<0.05, *** p<0.01
26
TABLE 8 INNOVATION AND OVERDRAW – SUB-SAMPLE ANALYSIS
Portfolio Rating Decisional Level Relationship
Length SBs Corporate Rating No
Rating HQs Branch Short Long
VARIABLES (1) (2) (3) (4) (5) (6) (7) (8) Innov -0.36* -0.20 0.01 -0.40*** -0.39* -0.28 -0.46** -0.02 (0.202) (0.298) (0.316) (0.144) (0.224) (0.181) (0.227) (0.227) Industrial District 0.06 0.04 0.22 0.05 -0.09 0.07 0.07 -0.02 (0.059) (0.111) (0.215) (0.063) (0.173) (0.060) (0.059) (0.123) HHI -0.04 -0.46 -56.84*** -0.09 -0.10 -0.05 -0.18 0.22 (0.116) (0.604) (6.478) (0.105) (0.436) (0.125) (0.132) (0.204) Corporation -0.03 -0.39* -0.12 -0.06 -0.00 -0.05 -0.02 -0.24** (0.035) (0.210) (0.116) (0.041) (0.123) (0.042) (0.045) (0.094) Distance 0.02 -0.01 -0.06** 0.02** -0.00 0.02 0.02* -0.00 (0.012) (0.061) (0.025) (0.012) (0.031) (0.012) (0.011) (0.024) Multiple Lending -0.08 0.48* 0.16 -0.08 -0.12 -0.04 0.04 -0.21* (0.077) (0.282) (0.174) (0.079) (0.111) (0.096) (0.097) (0.114) Other Services -0.12** -0.12 0.25 -0.13*** 0.10 -0.13*** -0.15*** 0.02 (0.046) (0.213) (0.316) (0.044) (0.157) (0.047) (0.047) (0.162) Relationship Length -0.12*** -0.02 -0.08 -0.11*** -0.09* -0.11*** (0.014) (0.055) (0.101) (0.014) (0.047) (0.012) Portfolio 0.09 0.25** -0.18 0.36*** 0.15 0.46*** (0.172) (0.109) (0.131) (0.080) (0.111) (0.163) Decisional Level -0.06 -0.20 -0.33* -0.07* -0.08* -0.24*** (0.041) (0.267) (0.175) (0.041) (0.046) (0.088) Tot. Accorded -0.20*** -0.20*** -0.18*** -0.20*** 0.02 -0.21*** -0.20*** -0.17*** (0.012) (0.075) (0.054) (0.013) (0.057) (0.013) (0.013) (0.034) D (Collateral 2) 0.24*** 0.10 0.14 0.26*** 0.20** 0.25*** 0.21*** 0.23*** (0.031) (0.249) (0.088) (0.029) (0.083) (0.029) (0.037) (0.070) D (Collateral 3) 0.60*** 0.28 0.96*** 0.59*** 0.52*** 0.61*** 0.56*** 0.80*** (0.046) (0.249) (0.202) (0.047) (0.126) (0.047) (0.053) (0.087) Province 0.23*** -0.22** 5.63*** 0.16*** -0.11 0.22*** 0.24*** 0.13 (0.069) (0.113) (0.412) (0.053) (0.305) (0.077) (0.068) (0.105) Constant 2.11*** 1.63 10.27*** 2.13*** -0.95 2.13*** 1.26*** 0.94* (0.217) (1.410) (1.341) (0.232) (1.134) (0.234) (0.224) (0.520) Branch effects Yes Yes Yes Yes Yes Yes Yes Yes Industry effects Yes Yes Yes Yes Yes Yes Yes Yes Time effects Yes Yes Yes Yes Yes Yes Yes Yes Firm Size effects Yes Yes Yes Yes Yes Yes Yes Yes Observations 13,363 1,107 1,314 13,339 2,323 12,304 11,008 3,718 Pseudo R-squared 0.08 0.16 0.13 0.08 0.08 0.07 0.07 0.09 Note: The table presents multivariate analysis of the impact of innovation on Overdraw (Model (3)) for subsamples of firms as described in section 5.3. * p<0.1, ** p<0.05, *** p<0.01