Embed Size (px)
Citation preview

IZA DP No. 2481
Does Immigration Affect Wages?A Look at Occupation-Level Evidence
Pia M. OrreniusMadeline Zavodny
DI
SC
US
SI
ON
PA
PE
R S
ER
IE
S
Forschungsinstitutzur Zukunft der ArbeitInstitute for the Studyof Labor
December 2006

Does Immigration Affect Wages?
A Look at Occupation-Level Evidence
Pia M. Orrenius Federal Reserve Bank of Dallas
Madeline Zavodny
Agnes Scott College and IZA Bonn
Discussion Paper No. 2481 December 2006
IZA
P.O. Box 7240 53072 Bonn
Germany
Phone: +49-228-3894-0 Fax: +49-228-3894-180
E-mail: [email protected]
Any opinions expressed here are those of the author(s) and not those of the institute. Research disseminated by IZA may include views on policy, but the institute itself takes no institutional policy positions. The Institute for the Study of Labor (IZA) in Bonn is a local and virtual international research center and a place of communication between science, politics and business. IZA is an independent nonprofit company supported by Deutsche Post World Net. The center is associated with the University of Bonn and offers a stimulating research environment through its research networks, research support, and visitors and doctoral programs. IZA engages in (i) original and internationally competitive research in all fields of labor economics, (ii) development of policy concepts, and (iii) dissemination of research results and concepts to the interested public. IZA Discussion Papers often represent preliminary work and are circulated to encourage discussion. Citation of such a paper should account for its provisional character. A revised version may be available directly from the author.

IZA Discussion Paper No. 2481 December 2006
ABSTRACT
Does Immigration Affect Wages? A Look at Occupation-Level Evidence*
Previous research has reached mixed conclusions about the effect of higher levels of immigration on the wages of natives. This paper reexamines this question using data from the Current Population Survey and the Immigration and Naturalization Service and focuses on differential effects by skill level. Using occupation as a proxy for skill, we find that an increase in the fraction of foreign-born workers tends to lower the wages of natives in blue collar occupations – particularly after controlling for endogeneity – but does not have a statistically significant negative effect among natives in skilled occupations. The results also indicate that immigrants adjusting their immigration status within the U.S., but not newly arriving immigrants, have a significant negative impact on the wages of low-skilled natives. This suggests that immigrants become closer substitutes for natives as they spend more time in the U.S. JEL Classification: J61 Keywords: immigrants, natives, wages Corresponding author: Pia M. Orrenius Federal Reserve Bank of Dallas 2200 N. Pearl Street Dallas TX 75201 USA E-mail: [email protected]
* We thank Kevin Lang for helpful comments. We also thank George Borjas, Janet Currie, David Jaeger, Anil Kumar and seminar participants at Claremont McKenna College, the 2003 Population Association of America meetings, the 2003 European Society for Population Economics meetings, and the 2003 NBER Labor Studies Summer Institute. The views expressed here are those of the authors and do not necessarily reflect those of the Federal Reserve Bank of Dallas or Federal Reserve System.

Does Immigration Affect Wages? A Look at Occupation-Level Evidence
Immigration has accounted for more than one-half of the total labor force growth in the U.S.
during the last decade. This influx of immigrants has been disproportionately large in certain
regions, such as the Midwest and the Southwest, where immigration accounted for over two-thirds of
labor force growth during the period 1996 to 2003. Immigrants have also been disproportionately
concentrated in certain occupations, particularly low skilled occupations such as construction or
agricultural work (Mosisa, 2002). This influx of immigrants and their concentration in certain
regions and occupations raises the question of how immigration affects the wages of natives,
particularly vulnerable groups such as low-skilled natives. This study uses data on immigration
inflows and natives’ wages within occupation groups to examine this issue.
Most previous studies of the effect of immigration on wages use a cross-area approach that
compares the number of immigrants in an area with wages in that area. These studies, such as
Altonji and Card (1991), Butcher and Card (1991), LaLonde and Topel (1991), and Schoeni (1997),
typically conclude that immigration has little or no significant negative effect on natives' wages. As
noted in many papers, the cross-area approach can yield misleading results if immigrants’ locational
choices are endogenous, with immigrants going to areas with higher wages. For example,
immigrants within a certain educational group tend to settle in areas with relatively high returns to
that group (Borjas, 2001). In addition, cross-sectional results are biased if immigration causes
offsetting migration by natives and previous immigrants or changes in industry mix.
In response to these potential problems, several studies use factor proportions models to
estimate the effect of immigration on wages. Factor proportions models do so by making
assumptions about the elasticity of substitution between immigrants and natives (e.g., Borjas,
Freeman and Katz, 1992, 1997; Jaeger, 1996; Johnson, 1998). Using reasonable elasticities, such

models can yield sizable negative effects at the national level for unskilled workers. The effect of
immigration on skilled workers, however, is modest at best in such studies. Moreover, results from
factor proportions analysis tend to be sensitive to changes in the underlying assumptions of the
model, such as the functional form and the number of factors (Leamer, 2000). In a recent study,
Ottaviano and Peri (2005) show that by relaxing some typical assumptions and allowing for
imperfect substitution between native and foreign-born workers as well as endogenous capital
accumulation, these models can predict positive wage effects of immigration on natives.
A few studies focus on the effect of immigration within occupations or skill groups. Using
data from the 1990 Census, Card (2001) estimates the relationship between immigrant inflows and
wages for six occupational groups in 175 large U.S. cities. Most of his results indicate significant
negative effects, which generally increase in magnitude when instrumental variables techniques are
used to control for endogeneity. Card does not discuss whether the effects differ between skilled and
unskilled workers. Using a similar approach but at the national level with data from the 1991
Current Population Survey (CPS), Camarota (1997) finds a negative association between
immigration and wages within low-skilled occupations. Both of these studies use a single year of
cross-sectional data.
Two studies use multiple cross sections of national-level data to look at effects by occupation
or education groups. Friedberg (2001) uses Israeli micro data to study the impact of Russian
immigration by occupation on Israeli wages and employment. Using an instrumental variables
strategy, she does not find evidence of an adverse wage effect on natives whether in a pooled sample
or in regressions by high and low skill level. Using several years of data from the Census and the
CPS, Borjas (2003) finds that higher immigrant inflows within education and experience groups—

which proxy for skill—are negatively associated with wages of male natives at the national level,
particularly for workers who did not attend college.
This study estimates the effect of immigration inflows on wages within occupational groups
using data from the Immigration and Naturalization Service (INS) and the Current Population
Survey (CPS).1 Our approach offers several contributions to the literature. First, no study has used
INS data on new recipients of lawful permanent resident status to examine the effects of immigration
on wages even though the data present several advantages. As discussed below, the INS data contain
a complete count of new legal immigrants and allow us to distinguish between newly arriving
immigrants and those who adjust status while already in the U.S. In addition, we use several years
of data whereas most previous cross-area and occupation-level studies relied on a cross-sectional
approach. Using multiple years of data allows us to control for unobservable local area effects,
which was not possible in cross-area studies that used only one year of data. Our approach thus
blends the multiple-year, skill-level analysis of Friedberg (2001) and Borjas (2003) with the single-
year, cross-area methodology of most previous studies, such as Card (2001).
The next section discusses the effects of immigration on wages from a theoretical
perspective. We then discuss the data used to examine the relationship between immigration and
natives’ wages at the occupational group level; we focus on professional, service-related, and manual
labor occupation groups during a seven-year period, 1994-2000, at the metropolitan area level. The
results indicate that, after controlling for endogeneity, larger immigrant inflows reduce average
wages among natives working in manual labor occupations—the least skilled group—but do not
appear to have a significant negative effect among natives in professional and service occupations, in
which workers tend to be more skilled. Immigrants who are already present in the U.S. and who
1 The INS was renamed the Bureau of Citizenship and Immigration Services in March 2003. For simplicity, we refer to it as the INS here.

adjust from nonimmigrant status have a more negative effect on natives’ wages than do newly
arrived immigrants, indicating that assimilation may lead to increased substitutability of immigrants
for native workers.
Theoretical Framework
Immigration inflows can negatively or positively impact natives’ wages, depending on the
degree of substitution or complementarity between immigrant and native workers and a number of
other factors. Because there is already a large theoretical literature, we do not present a formal
model of the effect of immigration on natives’ wages but simply review the underlying reasons why
immigration might affect natives’ wages and in what direction.2
The degree of substitution between immigrants and natives is a key determinant of the effect
of immigration on native wages. Holding capital constant and assuming constant returns to scale
production technology, an increase in labor supply due to immigration will lower wages if
immigrants and natives are substitutes and labor supply is not perfectly elastic with respect to
wages.3 The magnitude of the negative effect increases with the degree of substitution between
immigrants and natives and with the size of the immigrant inflow. If immigrants are a complement
for natives in production, in contrast, immigration will boost natives’ wages.
The degree of substitution between immigrants and natives is likely to vary across skill levels
and over time. Substitution is likely to be easier in industries with less skilled workers because
employees are more interchangeable and training costs are lower than in industries with skilled
workers. In skilled jobs, the need for English language proficiency and institutional knowledge may
2 For formal models, we refer readers to, among others, Borjas (1999), Greenwood and Hunt (1995), Johnson (1998) and Ottaviano and Peri (2005). 3 These assumptions can be relaxed to accommodate changes in the relative prices of goods and in the use of capital versus labor inputs. See Chapter 4 in Smith and Edmonston (1997) for a more general model.

make it difficult for employers to substitute immigrants for native workers. Some skilled
professions, such as physicians, also involve licensing requirements, limiting the substitutability for
natives of immigrants educated and trained abroad.
Differences in the quality and relevance of education and experience acquired abroad also
make skilled immigrants less substitutable for skilled natives. Evidence suggests returns to skill are
generally lower for education and experience acquired in the home country (Friedberg, 2000; Duleep
and Regets, 1999). Moreover, skill transferability, the degree to which immigrants can use human
capital acquired in their home country at U.S. jobs, tends to be higher for unskilled jobs than for
skilled positions (Gallo and Bailey, 1996). As a result, skilled immigrants experience a larger
earnings penalty than unskilled immigrants. If immigrants assimilate over time and acquire more
U.S. skills, such as institutional knowledge and language proficiency, the earnings penalty falls and
immigrants are more competitive with natives for jobs. Duleep and Regets (2002) and Hu (2000)
both find that immigrants with lower initial wages have faster subsequent wage growth, facts that are
consistent with a model of earnings assimilation. Hence, as immigrants become more substitutable
for native workers over time, more adverse wage effects may follow.
In order to capture differential effects by skill level, we use occupation as a proxy for skill in
our empirical model below. If the elasticity of substitution is greater among unskilled workers than
among skilled workers, as we hypothesize, the effect of immigration on wages should be larger in
unskilled occupations than in skilled occupations. The degree of complementarity (or substitution)
between immigrants in a given occupation and natives in another occupation also influences natives’
wages, a topic we do not explore in this study; studies suggest that most such cross-elasticities are
small (Hamermesh, 1993).

Another factor that influences the effect of immigration on wages is changes in capital.
Immigrants might add to the capital stock, both initially if they bring savings when they migrate and
over time (Chiswick, Chiswick and Karras, 1992). If immigration adds to the capital stock, natives’
wages might rise if capital is a complement to labor, particularly skilled labor. Unskilled labor, in
contrast, appears to be a substitute for capital (Hamermesh, 1993). Capital also may move across
industries and areas in response to immigration inflows. Such movements in capital could at least
partially counterbalance the negative effect of an increase in labor supply on natives’ wages. The
empirical model we present below does not control for capital because we do not have measures of
capital at the occupation and area level; since we only examine a seven-year period, ignoring
changes in capital may not be as problematic as it would be over a longer period of time. The area
fixed effects will pick up time-invariant cross-area differences in the existing capital stock.
The elasticity of labor supply with respect to wages also influences the impact of immigration
on wages. Natives and previous immigrants might respond to immigration-induced changes in
wages by altering their labor supply, moving to a different area, or upgrading or downgrading their
skills.4 Such changes would reduce any negative effect of immigrant inflows on wages. Studies
have not reached a consensus as to whether offsetting migration occurs in response to immigrant
inflows (e.g., Card, 2001; Frey, 1995; Kritz and Gurak, 2001). Because we examine only a seven-
year period here, our estimates of the impact of immigration on wages are probably more negative
than the long-run effect. In the long run, endogenous shifts in labor supply (as well as changes in the
capital stock) would likely lead to less negative estimates than any found here.
Finally, immigration inflows may lead to changes in output mix that cushion any wage
impact on natives. Previous studies suggest that immigration may lead to changes in the output mix
4 See Chiswick (1989) for a model of how natives adjust their human capital to minimize adverse wage effects due to immigration.

within areas, with industries intensive in low-skilled labor expanding in or moving to areas with
large numbers of immigrants (Altonji and Card, 1991; Hanson and Slaughter, 2002). Such changes
in production should increase the demand for labor and thereby reduce any negative effects of
immigration on wages. Similarly, immigration may lead to scale effects, with demand for output
increasing in response to immigration; an increase in output demand would raise demand in factor
markets, putting upward pressure on wages. Such effects would also at least partially offset any
negative effect of immigration on wages
As discussed below, we instrument for changes in the labor supply as a consequence of
immigration to help control for the above factors. Instrumenting, as well as including area fixed
effects, also controls for endogeneity bias due to immigrants settling in areas that pay high wages,
which would upward bias the estimated coefficients away from finding an adverse effect. We
further include interactions between area and year fixed effects in some specifications in order to
control for changes in cross-area wage differences that might influence migration patterns.
Empirical Methodology
To estimate the effect of immigration on natives’ wages, we regress the average earnings of
natives in occupation group o on the fraction of workers in that occupation group who are
immigrants and other variables, or
(1) tsotsotsotsotso TSOXIw ,,,,,,,,ln ετσωγβα ++++++=
where s indexes areas and t indexes years. The measure of wages is the log of real average hourly
wages for natives in a given occupation group, area and year.
The variable I in Equation 1 is the number of new legal immigrants with a given occupation
group relative to total employment in that occupation group. If an area experiences an influx of
immigrants within a given set of occupations, this fraction rises, reflecting the increase in the relative
labor supply of immigrants. The underlying hypothesis is that occupations and areas experiencing
larger inflows of immigrants relative to the total number of workers in that occupation and area
should experience larger declines in wages, and the magnitude of the decline depends on how
substitutable immigrants are for other workers. As noted below, a large number of cells in our data
have the immigrant share variable equal to zero. We therefore do not log the immigrant share
variable and interpret its estimated coefficient as an elasticity; instead, the estimated coefficient of
the immigrant share variable indicates the average percent change in wages for a 1 percentage point
increase in new immigrants as a share of all workers.
The vector X controls for the average demographic characteristics of workers in that
occupation. We control for the fraction of native-born workers who are female, black, married, and
union members. We also control for the distribution of workers across five-year age groups and
three of four education groups (less than high school, high school, some college, and college
graduates).
All regressions include a full set of area, occupation and year fixed effects in order to control
for unobservable determinants of earnings within an area, occupation or year. We also include area-
specific time trends and area-year interactions in some specifications. Pooling seven years of data
allows us to control for unobserved determinants of wages that are both constant within areas over
time and changing by year; most previous cross-area studies could not control for such factors
because they used cross-sectional data. We White-correct the standard errors in order to control for

heteroscedasticity and weight observations by the total number of native-born workers in the
occupation, area and year.
We estimate Equation 1 by pooling observations for each of the three occupation groups
examined here. The immigrant share variable, I, is interacted with an indicator variable for each
occupation group in order to allow the effect of immigration to differ across skill categories.
Because we have only seven years of data and therefore limited degrees of freedom, we constrain the
effects of the variables measuring worker characteristics and the area and year fixed effects and
interactions to be the same across occupation groups.
Endogeneity bias is a concern because immigration into an area may not be independent of
local wages or wage growth. We use two methods to address this problem. First, we include area-
specific linear time trends or area-year fixed effects in some specifications, which controls for area
and time-specific factors that affect immigrants’ locational choices, such as relatively high wage
growth. Second, we utilize an instrumental variables approach. This requires an instrument
correlated with the influx of immigrants into a given MSA and occupation but uncorrelated with
unobserved factors that drive wage growth.
We use immigrants who are admitted to the U.S. in a given year as the spouse of a U.S.
citizen by occupation group, area, and year as our instrument. We restrict these immigrant spouses
of U.S. citizens to newly arriving immigrants and immigrants adjusting from a non-work, non-
student related status (many of these are tourists); in other words, we construct the instrumental
variable to exclude immigrant spouses whose location choice or occupation might depend on relative
returns. For this reason, the instrument does not include immigrant spouses who convert from work-
related visas (e.g., H-1Bs), student visas, refugee status, or entry without inspection (unauthorized or
illegal) status. The instrument includes only those immigrants married to a U.S. citizen who are

either new arrivals in the U.S. or adjusting from a status in which they were not eligible to work
legally in the U.S. (such as temporary visitor for pleasure—tourist—visas).5 Because an immigrant
is typically not eligible to become a naturalized citizen for five years after receiving a green card, the
immigrants who compose our instrument are unlikely to be married to naturalized citizens who
immigrated to the U.S. and settled in a particular area because of the potential future returns to the
occupation in that specific area of the spouse who is now receiving a green card.6 Only about 37
percent of the immigrants who compose our instrument are adjusting status (the others are new
arrivals), and over 84 percent of those had an unexpired tourist visa (which does not allow the holder
to work legally and, at the time, had a maximum allowable duration of one year).
Constructed this way, immigrant spouses of U.S. citizens are an effective instrument because
they are likely to be tied movers. These foreign-born spouses immigrate for family reunification
reasons and settle where their citizen spouse lives. As a result, their location choice is surely less
affected by area-specific wage growth in their reported occupation group than choices made by
other, non-tied movers. Several studies buttress this view. Mincer (1978) models family migration
decisions and shows that tied movers tend to have higher unemployment rates and lower earnings.
Jaeger (2000) reports that, among major admission categories, the location choices of spouses of
U.S. citizens are the least responsive to local area economic conditions; indeed, he finds a significant
positive association between the spouses’ location choices and the change in the unemployment rate.
Interestingly, spouses of U.S. citizens are also the most geographically dispersed and educationally
diverse group among the categories Jaeger investigates. Chiswick (1999) also makes the point that
noneconomic reasons drive the migration of certain groups and, as a result, such movers have higher
5 Although immigrants adjusting from entry without inspection status also could not work legally, they are more likely to have been working in the U.S. than many other categories of adjusters who were not authorized to work. We therefore do not include them in our instrument.

unemployment rates and lower earnings than statistically comparable ‘economic’ migrants.
Carrington et al. (1996) model a similar phenomenon in their work on endogenous moving costs;
they suggest that in the presence of chain migration, migration costs may be falling at the same time
that wage gaps are shrinking. This may lead to rising migration into a destination which is
experiencing a decline in relative wage growth.
There is limited information available on the characteristics of immigrant spouses, although
the INS data discussed below (and presented in Table 2) suggest they are much younger and more
likely to be female than immigrants who enter under other preference categories. Male immigrant
spouses are concentrated among manual labor occupations; about 69 percent of immigrant spouses
reporting manual labor occupations are male versus 48 percent and 42 percent for immigrants
reporting professional and service-related occupations, respectively. The INS data have no
information whatsoever on the characteristics of the citizen spouses who sponsor these immigrants,
but CPS data offer some clues. CPS data indicate that most U.S. citizen spouses of recent
immigrants work (88 percent of male spouses and 68 percent of female spouses) and about two-
thirds of these citizen spouses earn more than their immigrant spouses. In addition, 69 percent of
citizen spouses have as much or more education as their recent immigrant spouses.7 Jasso et al.
(2000), using the New Immigrant Survey Pilot from 1996, also find that citizen sponsors have higher
education levels than their immigrant spouses.8 Taken together, this evidence supports our
assumption that, on average, immigrant spouses are more like tied movers and that the couple’s
location decision is not driven by the new immigrant’s earnings potential, at least not initially.
6 Data from the CPS indicate that, among U.S. citizens married to recent immigrants, the citizen is native born in about 60 percent of couples. 7 The CPS sample (based on 1994-1998) is of citizens married to foreign-born persons who report arriving in the U.S. within the last 5-6 years. 8 In addition, they show that citizen wives who sponsor husbands for immigration tend to be much less educated than citizen husbands who sponsor wives. This likely means that citizen wives who sponsor husbands are more likely to be from Mexico and Central America in this time period.

It should also be noted that the spouses of U.S. citizens are not subject to a quota or admitted
on the basis of skills, so their occupation plays no direct role in whether they become immigrants.
Jasso and Rosenzweig (1995) report that these “marital immigrants” are less skilled than are
immigrants admitted for employment-based reasons at the time they receive lawful permanent
resident (LPR) status. They also find that marital immigrants experience considerable occupational
upgrading over time in the U.S., suggesting that they become more substitutable for natives as
duration of U.S. residence increases. Moreover, during the 1990s, the simple act of filing paperwork
with the INS made a person fairly immobile geographically. The INS struggled with huge backlogs
and lost thousands of files (Holmes, 2000). In this environment, few applicants risked transferring
their casework from one district to another, as would be required in the case of most interstate
moves. Immigrant spouses adjusting their status therefore may not have moved across areas in
response to wage differentials based on their skill level.
Data
We use data on employment and earnings from the outgoing rotations groups of the Current
Population Survey (CPS) and immigration data from the INS. Both data sets are for the period 1994
to 2000; the CPS data are for calendar years while the INS data are for fiscal years.9 We focus on
three occupation groups: professional (executives/managers and professionals, such as teachers and
doctors); service-related (clerical workers, which includes all administrative support workers; sales;
and service workers); and manual laborers (precision production, craft, and repair, which consists of
more skilled blue-collar jobs; operator, fabricators, and laborers, which is composed of less skilled
9 The difference implicitly allows for a one-quarter lag in effects.

blue collar jobs; and farm workers).10 We use these relatively broad occupational groups because the
groupings capture the set of occupations for which immigrants who report working in a particular
occupation are likely to be substitutable for natives. For example, immigrants who report working as
an agricultural laborer can also probably work in an unskilled manufacturing job but not in a clerical
or professional job, and immigrants who were skilled blue-collar workers in their home country may
work in unskilled blue-collar jobs in the U.S., at least initially.11 Using broad occupational groups
also addresses bias arising from the possibility that natives change occupations in response to
immigration.
The primary data set we use is the CPS, a monthly household survey that focuses on labor
market outcomes. Since 1994, the survey has included questions about nativity, including country of
birth and year of arrival in the U.S. (in intervals). From all employed native-born individuals aged
16 and older, we constructed measures of average hourly wages and total employment within the
three occupation groups. The controls for the distribution of workers across 5-year age groups, four
educational groups, sex, race, marital status, and union membership that are included in the
regressions are also constructed from the CPS data.
We then constructed three measures of immigration by combining the CPS data with INS
data and creating ratios of new immigrants over total employment for each MSA, year and
occupational group. The INS data we use are the universe of new lawful permanent residents, also
10 We include farm workers because they often reside and work in cities during the off season. About 2.7 percent of the immigrant sample and 1.5 percent of the native-born sample are farm workers. Average hourly earnings among sales workers are similar to those among clerical workers and significantly higher than average earnings in the low-skill occupational group, so we classify sales workers as medium skilled. 11 Using the March 1995-1998 CPSs, we examined transition rates across occupation last year and occupation this year for workers who reported being recent immigrants and not present in the U.S. last year. Using the INS's 25 occupation groups, over 95 percent of these immigrants reported being within the same group last year and this year; using our three groups, over 97 percent were in the same group. Patterns among those immigrants who switched occupations underlie the classification of occupations across our three groups; for example, among persons who reported a sales occupation for year t and a non-sales occupation for year t+1, about one-third were in clerical jobs and almost one-half in service jobs in year t+1.

known as “green card” recipients. Our sample includes all new lawful permanent residents aged 16-
64 who report an occupation. The INS data list 25 occupations, which are more detailed for skilled
workers (e.g., architects) than for unskilled workers (e.g., operators, fabricators, and laborers).12 We
drop individuals who report their occupation as homemaker, student, unemployed, or retired and
collapse the remaining occupations into our three occupational groups.13 The INS data do not report
individuals’ earnings or educational attainment.
The INS data offer several advantages compared with other data sources that include
information on nativity. The INS data are a complete count of all new lawful permanent residents
(LPRs), and they include the preference category under which immigrants were admitted, such as
spouse of lawful permanent resident, spouse of U.S. citizen, priority worker with extraordinary
ability, or refugee. As discussed above, we exploit the fact that some of these groups are exempt
from immigration quotas to construct our instrumental variable. The INS data also distinguish
between LPRs who are newly arriving in the U.S. and those already present and converting from
another visa status, such as H1-B. The INS data report the most recent year of admission for those
individuals converting from nonimmigrant status. The main disadvantages of the INS data are that
they do not include other non-immigrants or illegal aliens and they contain a limited set of personal
characteristics. Greenwood, McDowell and Trabka (1991) further describe the advantages and
shortcomings of the INS data.
We use total new LPRs based on the INS data and then separate new LPRs into newly
arriving immigrants and immigrants adjusting status. Each immigration measure is computed as a
12 We also tried running the regressions using the most detailed level of occupation available in the INS data, but most of the results were inconclusive because of the small cell sizes in many occupations and areas. 13 About 19 percent of immigrants aged 16-64 do not report an occupation, another 11 percent report being unemployed or retired, 13 percent report being a student and about 17 percent report being a homemaker. For comparison, in the 1994-1998 CPS ORGs about 55 percent of recent (last 5-6 years) immigrants are employed at the survey date.

share of total workers (using the CPS data to construct the denominators). We distinguish between
newly-arriving immigrants and those adjusting status because the foreign born who are already
present in the U.S. but are only now receiving LPR status are likely to be more substitutable for
natives than newly arriving immigrants for the reasons discussed above. In addition, immigrants
adjusting their status are already working in the U.S. in the occupation reported in the data, whereas
immigrants newly arriving in the U.S. report their occupation in their home country (unless they are
admitted under employment-based preferences). As noted above, this partially motivates our use of
broad occupational categories. About 44 percent of new LPRs in our data are adjusting status, most
commonly from temporary visitor for pleasure or H-1 visas, refugee status, or "entry without
inspection" status (each accounting for about 15 percent within those adjusting status). The average
time between receipt of LPR status and the most recent year of admission for those adjusting status
is about four years, and over 50 percent of adjusters reported converting within three years.
We conduct the analysis at the metropolitan statistical area (MSA) level because MSAs more
closely approximate labor markets than do states.14 Results from state-level data are similar to the
MSA-level results shown here. The INS data are by zip code of intended residence (by MSA for
1999 and 2000), which we merged with the metropolitan area codes in the CPS. The final sample
consists of 5205 observations; it is an unbalanced panel of observations for 283 MSAs over 7 years
(1994-2000) and 3 occupations.15 There are no new immigrants in 527 occupation, area, and year
cells; these observations have Io,s,t equal to zero.
14 We note that the immigrants who settle in urban areas may differ from those who live in other areas. Immigrants tend to initially settle in urban areas where other immigrants live and then move over time to areas with lower concentrations of immigrants. 15 In robustness tests we ran the same regressions on a balanced panel. The number of MSAs falls to 214 (many of the smaller MSAs fall out of the sample), but the results are qualitatively similar.

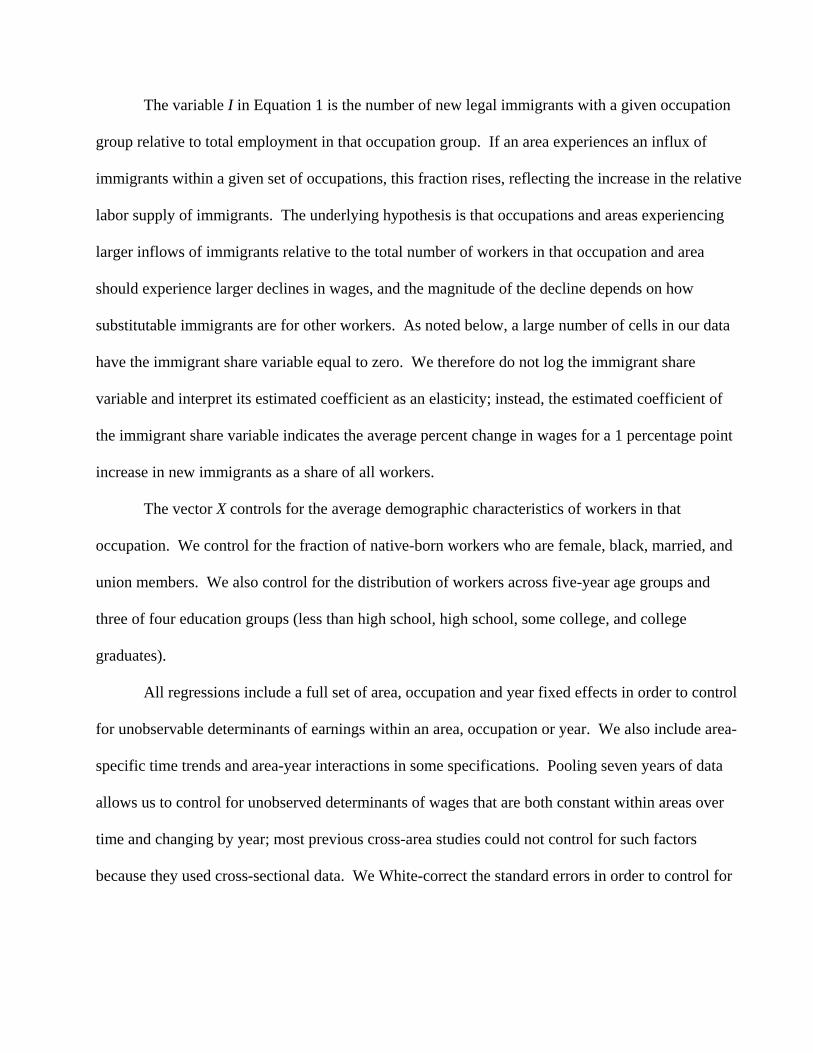
Table 1 reports the fraction of workers in each occupation group who are new LPRs
(columns 1-3), the fraction of new LPRs who are sponsored by citizen spouses (columns 4-6), and
natives’ average wages (column 7). Column 1 shows the fraction of workers who are new LPRs,
while columns 2 and 3 show the share of workers made up of new LPRs adjusting status versus
newly arriving. Although the U.S. granted over 650,000 persons LPR status each year during our
sample period, the number of new immigrants relative to total workers in each occupation group is
small. The influx of new LPRs represents about 0.25 percent of all workers in the manual labor and
professional categories, but only 0.16 percent of all service workers. In all three cases, new LPRs
understate total foreign-born inflows, since new arrivals are not necessarily permanent (i.e., they are
non-immigrants) nor are they necessarily legal (i.e., illegal immigrants).16 Among green card
holders, new arrivals outnumber adjusters in all categories, but the difference is much smaller among
professionals, as columns 2 and 3 indicate.
Columns 4-6 of Table 1 show the number of spouses of U.S. citizens who are new green
cards holders, non-work non-student adjusters, or new arrivals (all are expressed as a fraction of total
new LPRs in each occupation). Almost 16 percent of LPRs in our sample were admitted as the
spouse of a U.S. citizen, with slightly larger fractions of spousal immigration among service workers
and fewer among professionals. The last column in the table reports real average hourly wages of
natives as calculated from the CPS data.
The INS data are limited in scope, but Table 2 gives some further detail about the
characteristics of spousal immigrants. Comparing new LPRs who are spouses to all other LPRs,
spousal immigrants are younger and more likely to be female. They are also more likely to be from
16 The INS data are not a perfect count of all foreign-born workers entering an occupation for several reasons. Not all immigrants work in the U.S. in the occupation indicated to the INS at the time they received legal permanent resident status (some immigrants also may live in an area other than that reported to the INS). In addition, the INS data do not

Mexico, less likely to be from China, less likely to be professionals and more likely to be service-
sector workers.
Results
Table 3 shows OLS and 2SLS estimates of the relationship between natives’ wages and new
immigrant shares by occupation group. As indicated in the table, we show specifications with MSA
fixed effects, with MSA fixed effects and MSA-specific time trends, and finally with MSA fixed
effects and MSA-year interactions. Including the area fixed effects controls for time-invariant MSA-
level determinants of earnings, such as differences in the cost of living, and helps control for
endogeneity. MSA-year interactions control further for MSA-level differences that vary over time.
The endogeneity bias diminishes as more controls are added for area and year-specific effects, with
all of the coefficients for the immigrant share variable declining across the columns (albeit not
always significantly). Consider the OLS estimates of the effect on manual laborers as an example:
adding area-specific time trends reduces the coefficient from -0.016 to -0.020, and adding area-year
interactions further reduces the coefficient to -0.021.
Table 3 also shows that the effect of immigrant inflows on natives’ wages varies across
occupation groups. In the OLS specifications, higher immigrant shares are generally associated with
positive wage effects on more skilled natives and negative effects on less skilled natives. A 1
percentage point increase in the LPR share is associated with an increase in native-born
professionals’ average wages of 3.7 percent and a decrease in native-born manual workers’ wages of
2.1 percent, controlling for area-year fixed effects in the OLS specification (column 3). There is no
statistically significant effect on service-sector workers.
include illegal aliens and nonimmigrants. Nonetheless, the numbers should be well correlated with the inflow of immigrants into occupations and areas.

It bears noting that a 1 percentage point increase in the flow of new legal immigrants
represents at least a four-fold increase in the number of new LPRs (from 0.25 to 1.25 percent of
professional workers), not a likely event. Evaluating the wage effects at the means given in Table 1
gives a more comparable measure: the effect of all immigrants, respectively, on professional, service
and manual workers’ wages among natives is 0.9, 0.2, and -0.5 percent (when area-year interactions
are included). The interpretation of these effects is that average wages for natives who are manual
laborers are about 0.5 percent lower as a result of inflows of new LPRs into their occupational group
each year.
The OLS regression results in Table 3 are biased if immigrants settle in the areas that offer
relatively high wages or wage growth for their occupations and the area fixed effects and area-year
interactions do not fully control for this endogeneity. We therefore instrumented for the new LPRs
with the number of immigrants in the INS data who receive green cards because they are spouses of
U.S. citizens, as discussed above. The first-stage results are reported in Appendix Table 1. The
instruments are all positively related to the LPR share, as expected, and strongly statistically
significant.
The bottom panel of Table 3 shows the two-stage least squares (2SLS) results. As expected,
instrumenting for LPR shares produces uniformly more negative effects. The positive wage effects
go to zero for professionals and, for manual laborers, the wage effect remains statistically significant
and becomes more adverse (falling from -0.021 to -0.030 in our preferred specification with area-
year fixed effects). When using spouses of citizens as the instrument and evaluating the 2SLS
estimates at the means in Table 1, low-skilled natives’ wages are about 0.8 percent lower as a result
of the inflow of LPRs into their occupation group each year. The results suggest the wage effects on
the other two, more-skilled occupation groups are essentially zero.

The fact that wage impacts vary by immigrant type is as interesting as the variation by skill
level. Table 4 shows the same regressions as in Table 3 but breaks down the immigrant share by
LPRs who are adjusting status and those who are new arrivals. Interestingly, the adverse wage
impacts are concentrated wholly among adjusters. According to our 2SLS results, newly arriving
immigrants have a zero wage impact on less- and medium-skilled native workers and a positive
impact on native professionals. The lack of an adverse wage effect on manual laborers could be due
to the lack of substitutability of newly arriving immigrants for natives. Friedberg (2001) similarly
argues that evidence of a positive wage impact of newly arrived Russian immigrants on the wages of
Israeli natives suggests that new immigrants are not very substitutable for native workers. In
contrast, immigrants who are adjusting status exert either no effect or a significant negative effect on
natives’ wages depending on the occupation group. Adjusters likely have more U.S. experience,
more U.S.-specific social and human capital and better English language skills than newly arriving
immigrants, on average. Our findings are consistent with immigrant assimilation increasing the
substitutability of immigrants for native workers and hence the wage impacts on natives becoming
more adverse over time.
Bias-Adjusted Estimates
One concern about our instrument is that the estimated first-stage coefficients on spousal
LPRs as a share of all workers are larger than would be expected if spousal immigration were
random.17 This suggests that we are picking up an effect of common factors driving migration
despite our attempt to exclude immigrants whose location is motivated by local economic conditions
17 If immigrant spouses were truly randomly located, then their location decisions should be independent of those of other immigrants and the coefficients in the first stage should equal one.

from the instrument. Common factors affecting locational choices of some spousal immigrants and
other immigrants could include, among other things, occupation-specific labor market conditions.
It is possible to construct bias-corrected second stage estimates of the wage effect of
immigration under two assumptions. First, we assume that the coefficient in the first stage is biased
by an omitted variable—area-specific economic conditions—that causes the coefficient of the
spousal immigrant share variable to not equal to one. Under this assumption, we constrain the
coefficient to equal one so that for every one percentage point increase in the spousal immigrant
share of workers, the share of total immigrant workers also increases by one. Second, we assume
that the coefficient on the omitted variable in the second stage (the wage equation) is always a
constant multiple of its coefficient in the first stage (the immigrant share equation). Given these two
assumptions, we can derive the true estimate of the second-stage coefficient from any pair of
estimates (the Appendix describes the methodology in detail).
Table 5 reports the bias-corrected wage estimates using the pair of estimates from the
specifications with area-year fixed effects and area time trends. Standard errors were calculated
using the delta method and are quite large, with none of the bias-corrected coefficients statistically
significant. Nonetheless, the results are consistent with our prior findings; new arrivals have no
negative effect on the wages of natives in service and manual jobs and a large positive relationship
with professional wages. Also as we found above, the most adverse wage effects are observed
among manual workers in the specification using immigrants adjusting status in the U.S. In contrast
to our findings above, however, the bias-corrected estimates are negative for all three occupation
groups in the specifications using all new immigrants and those adjusting status. Evaluated at the
mean, the total wage effects are -1.43, -0.82, and -5.15 percent for professional, service, and manual
workers, respectively. The wage effects of adjusters are -3.23, -1.41, and -5.28 percent for

professional, service, and manual workers, respectively. The range of estimates is broadly consistent
with findings in the literature that are based on general equilibrium analysis.
Conclusion
In this paper, we take another look at how immigration affects the wages of U.S. natives.
Findings in this literature are dominated by evidence of a modest but significant negative wage
impact on unskilled natives, but there is little evidence on how other, more skilled workers are
impacted by immigration. We address this question in several ways. First, we use INS data on new
legal immigrants together with CPS data for 1994-2000. In order to allow wage effects to vary by
worker skill level, we devise three occupational categories, ranging from manual laborers at the
bottom of the skill range to professionals and executives at the top of the skill range.
Using area fixed effects, area-year interactions, and an innovative instrumental variable, we
find two sets of interesting results. When instrumenting for new legal immigrant shares, negative
wage impacts are small in size but highly statistically significant and concentrated among low-skill,
blue-collar occupations. For this group, we find that wages are about 0.8 percent lower as a result of
the increase in the share of workers who are new immigrants. Bias-corrected estimates are not
precise but suggest this number may be as high as 5.2 percent. We find no evidence of adverse wage
impacts on medium- and high-skilled native workers. In fact, increases in the newly arriving
immigrant share of workers within professional jobs actually have positive wage effects, suggesting
there may be complementarities between native workers and newly arrived immigrants in the top
skill categories.
The magnitudes of the wage effects—not just the signs—also appear closely related to both
the skill group and the level of U.S. experience of the immigrant group. Wage effects generally

become more negative as skill levels decrease. Wage effects also become more negative as
immigrants’ time in the U.S. increases. Although increases in the share of newly arrived immigrants
have no statistically significant negative impact on the wages of low-skilled natives, increases in the
share of those who are already in the U.S. when they adjust status have a small but significant
negative effect on low-skilled native wages. These findings suggest that the process of assimilation
makes immigrants more substitutable for natives and may increase wage competition. An important
caveat to our findings is that we only examine the impact of new legal immigrants, not total inflows.
Because illegal immigrants are likely concentrated in low-skill occupations, the total effect of
immigrant inflows on low-skilled natives is likely more adverse than our estimates suggest.

References Altonji, Joseph C., and David Card (1991). “The Effects of Immigration on the Labor Market Outcomes of Less-skilled Natives.” In Immigration, Trade, and the Labor Market, ed. John M. Abowd and Richard B. Freeman. Chicago: University of Chicago Press, pp. 201-234. Borjas, George J. (1999). “The Economic Analysis of Immigration.” In Handbook of Labor Economics, Vol 3, ed. Orley Ashenfelter and David Card. Amsterdam: Elsevier, pp. 1697-1760. Borjas, George J. (2001). “Does Immigration Grease the Wheels of the Labor Market?” Brookings Papers on Economic Activity: 69-133. Borjas, George J. (2003). “The Labor Demand Curve Is Downward Sloping: Reexamining the Impact of Immigration on the Labor Market.” Quarterly Journal of Economics 118 (November): 1335-1374. Borjas, George J., Richard B. Freeman, and Lawrence F. Katz (1992). “On the Labor Market Impacts of Immigration and Trade.” In Immigration and the Work Force: Economic Consequences for the United States and Source Areas, ed. George J. Borjas and Richard B. Freeman. Chicago: University of Chicago Press, pp. 213-244. Borjas, George J., Richard B. Freeman, and Lawrence F. Katz (1997). “How Much Do Immigration and Trade Affect Labor Market Outcomes.” Brookings Papers on Economics Activity: 1-90. Butcher, Kristin F. and David Card (1991). “Immigration and Wages: Evidence from the 1980’s.” American Economic Review 81 (May): 292-296. Camarota, Steven A. (1997). “The Effect of Immigrates on the Earnings of Low-Skilled Native Workers: Evidence from the June 1991 Current Population Survey.” Social Science Quarterly 78 (June): 417-431. Card, David (2001). “Immigrant Inflows, Native Outflows, and the Local Labor Market Impacts of Higher Immigration.” Journal of Labor Economics 19 (January): 22-64. Carrington, William J., Enrica Detragiache and Tara Vishwanath (1996). “Migration with Endogenous Moving Costs.” American Economic Review 86 (September): 909-930. Chiswick, Barry R. (1999). “Are Immigrants Favorably Self-Selected?” American Economic Review Papers and Proceedings (May): 181-185. Chiswick, Carmel U. (1989). “The Impact of Immigration on the Human Capital of Natives.” Journal of Labor Economics. 7 (October): 464-486. Chiswick, Carmel U., Barry R. Chiswick, and Georgios Karras (1992). “The Impact of Immigrants on the Macroeconomy.” Carnegie-Rochester Conference Series on Public Policy 37 (December): 279-316.

Duleep, Harriet and Mark C. Regets (2002). “The Elusive Concept of Immigrant Quality.” IZA Discussion Paper No. 631. Duleep, Harriet and Mark C. Regets (1999). “Immigrants and Human Capital Investment.” AER Papers and Proceedings 89 (May): 186-191. Frey, William H. (1995). “Immigration and Internal Migration ‘Flight’ from US Metropolitan Areas: Toward a New Demographic Balkanisation.” Urban Studies 32 (May): 733-757. Friedberg, Rachel M. (2000). “You Can’t Take It with You? Immigrant Assimilation and the Portability of Human Capital.” Journal of Labor Economics 18 (April): 221-251. Friedberg, Rachel M. (2001). “The Impact of Mass Migration on the Israeli Labor Market.” Quarterly Journal of Economics 116 (November): 1373-1408. Gallo, Carmenza, and Thomas R. Bailey (1996). “Social Networks and Skills-Based Immigration Policy.” In Immigrants and Immigration Policy: Individual Skills, Family Ties, and Group Identities, ed. Harriett O. Duleep and Phanindra V. Wunnava. Greenwich, CT: JAI Press, pp. 203-217. Greenwood, Michael J., and Gary L. Hunt (1995). “Economic Effects of Immigrants on Native and Foreign-Born Workers: Complementarity, Substitutability, and Other Channels of Influence.” Southern Economic Journal 61(April): 1076-1097. Greenwood, Michael J., John M. McDowell, and Eloise Trabka (1991). “Conducting Descriptive and Analytical Research with the Immigration and Naturalization Service Public Use Tapes.” Journal of Economic and Social Measurement 17: 131-153. Hamermesh, Daniel S. (1993). Labor Demand. Princeton: Princeton University Press. Hanson, Gordon H., and Matthew J. Slaughter (2002). “Labor-market adjustment in open economies: Evidence from US States.” Journal of International Economics 57 (June): 3-29. Holmes, Charles W. (2000). “Immigrants Caught in INS Backlog: Promised Land on Hold While the Agency from Hell Works to Reduce a Flood of Immigrant Applications.” Contra Costa Times, July 2, A6. Hu, Wei-Yin (2000). “Immigrant Earnings Assimilation: Estimates from Longitudinal Data.” AER Papers and Proceedings 90 (May): 368-372. Jaeger, David A. (1996). “Skill Differences and the Effect of Immigrants on the Wages of Natives.” U.S. Bureau of Labor Statistics Working Paper No. 273, March. Jaeger, David A. (2000). “Local Labor Markets, Admission Categories, and Immigrant Location Choice.” Hunter College and Graduate School CUNY Working Paper, June.

Jasso, Guillermina; Massey, Douglas S; Rosenzweig, Mark R. and James P. Smith (2000). “Assortative Mating among Married New Legal Immigrants to the United States: Evidence from the New Immigrant Survey Pilot.” International Migration Review 34 (Summer): 443-459. Jasso, Guillermina, and Mark R. Rosenzweig (1995). “Do Immigrants Screened for Skills Do Better than Family Reunification Immigrants?” International Migration Review 29 (Spring): 85-111. Johnson, George A. (1998). “The Impact of Immigration on Income Distribution among Minorities.” In Help or Hindrance? The Economic Implications of Immigration for African Americans, ed. Daniel S. Hamermesh and Frank D. Bean. New York, NY: Russell Sage Foundation, pp. 17-50. Kritz, Mary M., and Douglas T. Gurak (2001). “The Impact of Immigration on the Internal Migration of Natives and Immigrants.” Demography 38 (February): 133-145. LaLonde, Robert J., and Robert H. Topel (1991). "Labor Market Adjustments to Increased Immigration." In Immigration, Trade, and the Labor Market, ed. John M. Abowd and Richard B. Freeman. Chicago: University of Chicago Press, pp. 167-199. Leamer, Edward E. (2000). “What’s the Use of Factor Contents?” Journal of International Economics 50 (February): 17-49. Mincer, Jacob (1978). “Family Migration Decisions.” Journal of Political Economy 86 (October): 749-773. Mosisa, Abraham T. (2002). “The Role of Foreign Born Workers in the US Economy.” Monthly Labor Review (May): 3-14. Ottaviano, Gianmarco and Giovanni Peri (2005). “Rethinking the Gains from Immigration: Theory and Evidence from the U.S.” NBER Working Paper 11672, September. Schoeni, Robert F. (1997). “The Effects of Immigration on the Employment and Wages of Native Workers: Evidence from the 1970s and 1980s.” Mimeo, RAND. Smith, James P., and Barry Edmonston (1997). The New Americans: Economic, Demographic, and Fiscal Effects of Immigration. Washington, DC: National Academy Press.
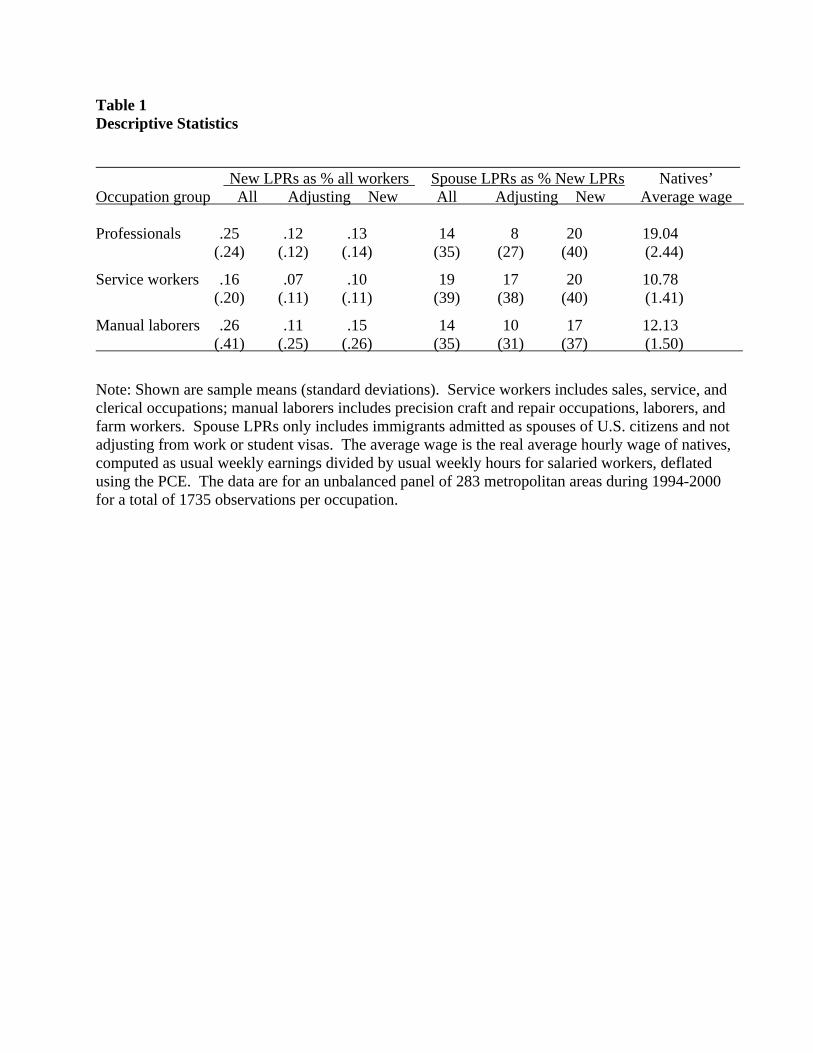
Table 1 Descriptive Statistics New LPRs as % all workers Spouse LPRs as % New LPRs Natives’ Occupation group All Adjusting New All Adjusting New Average wage Professionals .25 .12 .13 14 8 20 19.04 (.24) (.12) (.14) (35) (27) (40) (2.44)
Service workers .16 .07 .10 19 17 20 10.78 (.20) (.11) (.11) (39) (38) (40) (1.41)
Manual laborers .26 .11 .15 14 10 17 12.13 (.41) (.25) (.26) (35) (31) (37) (1.50)
Note: Shown are sample means (standard deviations). Service workers includes sales, service, and clerical occupations; manual laborers includes precision craft and repair occupations, laborers, and farm workers. Spouse LPRs only includes immigrants admitted as spouses of U.S. citizens and not adjusting from work or student visas. The average wage is the real average hourly wage of natives, computed as usual weekly earnings divided by usual weekly hours for salaried workers, deflated using the PCE. The data are for an unbalanced panel of 283 metropolitan areas during 1994-2000 for a total of 1735 observations per occupation.
Table 2 Mean Characteristics of New Immigrant Spouses of U.S. Citizens and Other New Immigrants Spouses Others Age 31.8 37.2 (7.9) (10.9) Female .44 .40 (.50) (.50) From Mexico .15 .10 (.36) (.30) From China .04 .08 (.19) (.27) From the Philippines .06 .06 (.24) (.23) Professionals .30 .37 (.46) (.48) Service workers .37 .29 (.48) (.46) Manual laborers .33 .34 (.47) (.47) Total sample size 315,987 1,137,689 Note: Shown are sample means (standard deviations) for new LPRs who report an occupation. Spouse LPRs only includes immigrants admitted as spouses of U.S. citizens and not adjusting from work or student visas; all others are included in column 2.

Table 3 Estimates of the Relationship between Natives’ Wages and New Immigrants Occupation group (1) (2) (3) OLS Professionals .050** .039** .037* (.009) (.011) (.015)
Service workers .030* .017 .011 (.013) (.014) (.018)
Manual laborers -.016** -.020** -.021** (.006) (.006) (.007)
2SLS Professionals .039** .018 .012 (.011) (.015) (.021)
Service workers .028* -.001 -.013 (.014) (.019) (.024)
Manual laborers -.015* -.026** -.030** (.007) (.008) (.011)
Area-specific time trends No Yes No
Area-year fixed effects No No Yes
Note: Shown are estimated coefficients from OLS or two-stage least squared regressions of average natives’ wages on the share of workers who are new immigrants in an occupation, area, and year. In the 2SLS regressions, the immigrant share is instrumented using the number of new immigrants who are admitted as spouses of U.S. citizens and are not adjusting from work or student visas relative to all workers in an occupation, area, and year. The regressions also include controls for average worker characteristics (see text for details), fixed effects for area, occupation and year, and other variables as indicated. Robust standard errors are in parentheses. † p < .10; * p < .05; ** p < .01

Table 4 Estimates of the Relationship between Natives’ Wages and New Immigrants, by Adjustment Status Adjusting status New arrivals Occupation group (1) (2) (3) (4) (5) (6) OLS Professionals .070** .058** .056** .116** .105** .119** (.016) (.017) (.021) (.020) (.023) (.028)
Service workers .024 .011 .008 .093** .080** .088** (.020) (.021) (.024) (.026) (.027) (.034)
Manual laborers -.026** -.027** -.027** -.008 -.011 -.006 (.007) (.007) (.009) (.011) (.012) (.014)
2SLS Professionals .044* .016 .004 .096** .084** .094** (.021) (.025) (.038) (.021) (.028) (.034)
Service workers .035 -.001 -.020 .075** .055 .053 (.023) (.030) (.040) (.028) (.034) (.041)
Manual laborers -.026** -.035** -.040** -.010 -.016 -.015 (.008) (.010) (.015) (.012) (.014) (.015)
Area-specific time trends No Yes No No Yes No
Area-year fixed effects No No Yes No No Yes
Note: Shown are estimated coefficients from OLS or 2SLS regressions of average natives’ wages on the share of workers who either are adjusting to legal permanent resident status (columns 1-3) or are legal permanent residents newly arriving the U.S. (columns 4-6) in an occupation, area, and year. The regressions also include controls for average worker characteristics (see text for details), fixed effects for area, occupation and year, and other variables as indicated. Robust standard errors are in parentheses. † p < .10; * p < .05; ** p < .01

Table 5 Bias-Corrected Estimates of the Relationship between Natives’ Wages and New Immigrants All Adjusting status New arrivals Occupation group (1) (2) (3) Professionals -.057 -.269 .313 (2.198) (5.819) (.809)
Service workers -.051 -.201 .045 (1.181) (2.334) (.638)
Manual laborers -.198 -.480 .065 (2.004) (5.208) (1.065)
Note: The bias-corrected estimates are from regressions in Tables 3 and 4 and Appendix Table 1 that include area time trends and area-year fixed effects. Assumptions and methodology are described in the text and Appendix 2. The delta method was used to derive the standard errors. † p < .10; * p < .05; ** p < .01

Appendix Table 1 First Stage for 2SLS Estimates of the Relationship between Natives’ Wages and New Immigrants All Adjusting status Newly arriving Occupation group (1) (2) (3) (4) (5) (6) (7) (8) (9) Professionals 4.496** 4.273** 3.386** 5.485** 5.839** 4.852** 3.958** 3.105** 2.844** (.311) (.522) (.649) (.462) (.791) (1.199) (.282) (.244) (.285)
Service workers 3.333** 2.703** 1.919** 3.341** 3.515** 2.838** 3.147** 2.239** 1.793** (.271) (.491) (.615) (.333) (.549) (.822) (.241) (.264) (.356)
Manual laborers 4.292** 4.084** 3.811** 4.892** 5.020** 4.803** 4.022** 3.753** 3.630** (.418) (.506) (.526) (.973) (1.072) (1.084) (.294) (.281) (.293)
F-test for joint 90.35 30.53 38.65 65.74 22.50 8.08 87.26 79.58 77.93 significance (.00) (0.00) (.00) (.00) (.00) (.00) (.00) (.00) (.00)
Area-specific time trends No Yes No No Yes No No Yes No
Area-year fixed effects No No Yes No No Yes No No Yes
Note: Shown are estimated coefficients from first stage regressions of the fraction of workers who are immigrants on the fraction of workers who are admitted as spouses of U.S. citizens and are newly arriving or adjusting from non-work, non-student visas in an occupation, area, and year. The regressions also include controls for average worker characteristics (see text for details), fixed effects for area, occupation and year, and other variables as indicated. Robust standard errors are in parentheses (p- value for the F-test). Each column is from a separate regression with 5205 observations. † p < .10; * p < .05; ** p < .01

Appendix The wage equation is
y = ε+bx
and the immigration equation is x = vz +γ
where .1=γ The first stage estimate is given by
( ) vzzz ′′+= −11γ̂
and the reduced form estimate by ( ) επ zzzb ′′+= −1ˆ
with 2SLS estimate
γπˆˆˆ =b ,
or ( ) εγ zzzbb ′′−= −1ˆˆ .
Now assume that vzpz ′=′ε
We then have
( )1ˆˆˆ −−= γγ pbb .
If we have two estimates with different missing variables, we can estimate b and .p