Embed Size (px)
Citation preview

Does Higher Education Cause Political Participation?: Evidence
From a Regression Discontinuity Design∗
Alex Solis†
May 8, 2013
[Preliminary]
Abstract
Education has been considered by political economy and political science literature one ofthe most important factors explaining political participation: voter turnout, civic engagement,political knowledge, and democratic attitudes. However, only few papers have explored thecausal link with contradictory findings. In this paper, I use the eligibility criteria for two loanprograms in Chile, that produce an exogenous variation on higher education enrollment, to testthe causal effects of higher education and college on two measures of political participation:voter registration and affiliation with a political party. Using administrative individual datafrom the universe of voters, I find evidence that the relationship is statistically zero. Moreover,the relationship is zero when the data is analyzed by income, sex or by different backgroundmeasures. A survey from a representative sample of the population allows a RD analysisthat indicates that higher education do not cause changes in attitudes towards democracy,political knowledge, participation in demonstrations or in civic organizations, but it does causeoverreporting on voting registration.
∗I would like to thank David Card, Frederico Finan, Ernesto Dal Bó, Enrico Moretti, Elizabeth Sadoulet,Emmanuel Saez, and seminar participants at LACEA 2012 Annual Meeting, UC Berkeley ARE DevelopmentWorkshop, who provided useful comments and insights. I would like to thank Manuel Matta, Francisco Pino,Gonzalo Sanhueza, Teresa Veloso, and Humberto Vergara for providing the data. I gratefully acknowledge financialsupport from the Center for Equitable Growth at the University of California, Berkeley. All errors are my own.†Assistant professor at Uppsala University and Universidad Católica de Concepción. Address: Department
of Economics, Uppsala University P.O. Box 513 75120 Uppsala, Sweden. Phone: +46 018 471 5125. Email:[email protected].
1

Uppsala University, Spring 2013 Alex Solis
1 Introduction
Understanding the relationship between education and political participation is one of the most
important questions on political economics and political science (Campante and Chor, 2012). One
the most well documented findings is the strong and positive relationship between schooling and
political participation: voter turnout, civic engagement, political knowledge, and democratic atti-
tudes (Campbell, Converse, Miller and Stokes (1960); Wolfinger and Rosenstone (1980); Nie, Junn
and Stehlik-Barry (1996); Schlozman (2002); Hillygus (2005); among others), which is sometimes
considered one of the major contribution of political science to the general body of knowledge
(Schlozman, 2002). The importance of this relationship has been used as argument to justify
government intervention in the market of education (Hanushek, 2002), and has been considered
fundamental to the preservation of democracy. However, only recently, few papers have explored
the causal channel with contradictory findings. On the one hand, Dee (2004) and Milligan, Moretti
and Oreopoulos (2004) using instrumental variables strategies,1 and Sondheimer and Green (2010)
analyzing 3 educational experiments, find a positive effect for the United States.2 On the other
hand, Tenn (2007), Kam and Palmer (2008), Berinsky and Lenz (2010), find no effect using differ-
ent strategies with US data, while Borgonovi, d’Hombres, and Hoskins (2010), Pelkonen (2010),
Siedler (2010) and Chevalier and Doyle (2012) provide more evidence of no effect using the same
instrumental variables with data from European countries.
Despite the very well documented positive correlation, education may not cause political par-
ticipation by at least two forms of endogeneity. First, third variables may induce individuals to
self-select into higher education and into political activities simultaneously (i.e. personality traits,
cognitive ability, family background characteristics, etc.). Because these variables are in general
unobserved, education acts as a proxy (Kam and Palmer, 2008). Secondly, it may be that high
levels of political participation cause a high educational attainment (reverse causality). More po-
litically active groups or communities have the tools to demand for their rights and to make their
politicians accountable, therefore they demand for policies in favor of more and better education.
In this paper, I use a regression discontinuity design, to deal with endogeneity. Students in1Milligan et al (2004) analyzed the same instruments for the United States and the United Kingdom, but they
find a non-statistically significant effect for the UK.2In Sondheimer and Green (2010), the relationship is significant for 1 of the 3 experiments
2

Uppsala University, Spring 2013 Alex Solis
Chile became eligible for higher education loans on any type of institution when they score more
than a given threshold in the national college admission test. Those below the cutoff are only
eligible for loans in technical institutions. This rule produces a discontinuity in the proportion of
students that enroll in higher education (enrollment in any tertiary vocational programs or college)
and particularly in college (see Solis, 2012). Since scores are continuous around the threshold, the
loan eligibility criteria shows that enrollment in higher education is as good as randomly assigned
(Lee and Lemieux, 2010), and can be used as a exogenous source of higher education and college
enrollment to test the effect of education on political participation.
Moreover, this paper benefit from a rich and detailed data set from almost the universe of
students that graduate from high school in the country, and take the college admission test. Com-
bining these data with electorate administrative records, from electoral office on voting registration
and political party affiliation (2 parties), allows me to deal with common problems such as sample
biases and misreported political participation. Moreover, it allows examining the heterogeneity
on the relationship and the different conditions mentioned in theory, through which education can
affect political participation.
I find, that there is a positive and strong correlation between higher education and political
participation, nonetheless the relationship is not causal. I find that despite the exogenous changes
in college and in higher education enrollment, there is no effect on voting registration or on party
affiliation. The results are highly robust ans stable to functional specification and the inclusion of
a rich set of covariates. Moreover, I find that the relationship does not appear when the population
is grouped by income level, sex or family background characteristics.
The correlations found with the administrative data are much lower (but highly significant)
than those calculated with publicly available political surveys, reflecting the presence of behav-
ioral biases in the data from surveys. To find out what type of selection or bias may drive this
discrepancies, I perform a web survey to the same students affected by the loan eligibility crite-
ria, to elicit self-reported participation on elections, political party affiliation, attitudes (towards
democracy in particular), political knowledge, and other measures of political participation. I find
that education does not caused changes in any of the measures of political participation (political
knowledge, other forms of political participation, nor in attitudes towards democracy).
However, I find that crossing the threshold implies an increase of 2 percentage points in the
3

Uppsala University, Spring 2013 Alex Solis
likelihood of overreporting voting registration. College and higher education students increase
their likelihood of overreporting in 10 and 15 percentage respectively (robust and stable to func-
tional specification and the inclusion of covariates).
The paper is organized as follow, in section 2, I describe the literature, the data used in the
paper and the characteristics of the Chilean electoral system. Section 3 gives the econometric
strategy. Section 4 presents the empirical results and section 6 concludes.
2 Background
2.1 Literature review
The importance of education on citizenship and democracy has been discussed perhaps since
Aristotle (Lipset, 1959) as a way to provide the tools to participate intelligently in the political
system avoiding demagogy. More recently, the relationship has been examined from the macro
and micro point of views. From a cross country perspective, education it is seen as a necessary
condition for democracy because enables prosperity and increases wealth and growth (Lipset
(1959), Barro (1999), Glaeser et al (2004), among others). Moreover, education, as main source
of human capital accumulation, is the key determinant of the quality of institutions (Glaeser et
al (2004)). These conclusions have been highly controversial, Acemoglu et al (2005), argue that
most of the evidence uses cross sectional data that potentially gives biased estimates due to the
presence of omitted variables. They show that after including country fixed effects the relationship
is statistically zero. However, Bobba & Coviello (2007) and Catelló-Climent (2007) restates the
causal relationship, re-estimating the effect using a “system” GMM that performs better than the
“difference” GMM used in Acemoglu (2005) when the explanatory variables are highly persistent
and measured with error.
On the microeconomic perspective, the link between education and political participation is
considered the strongest relationship in political science (Campbell, Converse, Miller and Stokes
(1960); Wolfinger and Rosenstone (1980); Nie, Junn and Stehlik-Barry (1996); Schlozman (2002))
and the best individual level predictor of political participation (Putnam, 1995). However, only
recently some studies have explored the causal relationship between education and political par-
ticipation.
4

Uppsala University, Spring 2013 Alex Solis
Milligan, Moretti and Oreopoulos (2004) use compulsory schooling laws to instrument edu-
cation attainment, finding that the relationship between graduating from high school and voting
is strong and positive in the US, but not significantly different from zero in the UK. They con-
clude that education allows Americans go through the barriers of registration, while in the UK
registration is highly assisted by electoral officials, concluding that education is key to allow polit-
ical participation where participation required skills and knowledge. Moreover, they find in both
countries that education affects citizens’ interest on politics. Dee (2004) uses distance to college
and exposure to child labor laws as an instrument for college education and years of education
to explore the effects on voting, participation on groups, attitudes toward democracy and civic
awareness. He finds that the relationship is positive and significant for both types of education
measures: college and secondary on all the variables studied.
Nevertheless, Tenn (2007) suggests that the instruments used in Milligan et al (2004) and Dee
(2004) may still be correlated with omitted variables. He argues that these instruments vary only
by age, year, or geographic location, and therefore is impossible to identify the effects after the
inclusion of a complete set of interactions of these covariates, which are key explanatory variables
of political participation.3 Tenn (2007), uses a different approach exploiting differences in years
of education for some young students that, despite having the same age, are in different levels
of the educational cycle. He finds that one more years of education have very little effect on
voter turnout, but it does have an effect on voter registration. Kam and Palmer (2008) use a
propensity score matching method to address the selection on education. They find that after
including preadult outcomes the relationship between higher education and political participation
disappears.4 However, this paper is highly criticized by Henderson and Chatfield (2011) who argue
that it presents problems in the matching method. After applying a genetic matching approach
the relationship becomes statistically significant while the balance among covariates improves.
Sondheimer and Green (2001) uses two randomized experiments and one quasi experiment
that produces exogenous variation on high school graduation to test the effects in turn out. They
find a positive effect in the experiment STAR, and positive but non-significant effects under the3Mazumber (2007) also criticizes the use of compulsory schooling laws and child labor laws as instruments for
education (in the context of health), since the inclusion of the time-state fixed effects erase the coefficients.4They define participation broadly as an additive index involving voting in 1972, attending campaigns meeting
or rallies, displaying a campaign symbol, working on a campaign, donating to a campaign, contacting a publicofficial, participating in a demonstration, or working with others to solve a local issue.
5

Uppsala University, Spring 2013 Alex Solis
Perry preschool experiment and the “I have a dream” quasi experiment. They attribute the
non-significance to the small sample size.
Finally, Friedman, Kremer, Miguel and Thorton (2011) use a randomly assigned scholarship
program (for girls) in Kenya that increase secondary attainment. They conclude that educated
students are less likely to accept domestic violence, the legitimacy of political authorities, and
they have higher political knowledge. Nevertheless, they show that this empowerment through
education does not translate into more participation in politics and into perceived political ef-
ficacy. They conclude that their findings are consistent with the view that education increases
autonomy and empowerment, on opposition to the modernization theory. They also argue that
these findings are puzzling and consistent with reverse causality, because to receive more educa-
tion, students need to be willing to accept authority in the first place, and after that, with the
tools given by education, they are able to challenge authority.
The two main hypotheses on how education affects participation are the cognitive ability
(or civic education) hypothesis and the social network hypothesis. The first states that education
prepares more educated individuals to understand how the political process works. Education gives
to individuals the necessary skills and knowledge to get involved (Rosenstone and Hansen,1993)
or to reduce the cost of participation (Wolfinger and Rosenstone, 1980). Moreover, college life
is rich in activities that give individuals the opportunity to understand better the importance of
politics and highlight the values of democracy, allowing the emergence of tastes for participation
(Galston, 2001). Nevertheless, not all types of higher education may provide with these skills and
knowledge (that allow a better language usage or a better understanding of the political process).
This hypothesis contrast with the fact that education attainment has increased largely in the last
decades over the world while voting turnout have decrease steadily over the same period (Brody,
1978)
The social network hypothesis states that education is a good predictor of the social position
of an individual, and as a consequence more educated individuals would be closer to decision
spheres were they can benefit directly (Nie et al (1996)). Moreover, peers in social networks
provide individuals with political information, therefore more informed and more educated peers
may reduce the cost of participation and boost the interest and taste for politics (Lochner, 2011).
6

Uppsala University, Spring 2013 Alex Solis
Social networks can also impute social pressure to engage political behavior and may be the target
of politicians who try to maximize the outcome of their information campaigns (Hillygus, 2005).
2.2 Data
The data used in this paper has unique characteristics to test the relationships of interest. The
first part corresponds to administrative data on higher education enrollment matched with official
information on registration to vote and political party affiliation at the individual level over the
universe of students that take the college admission test (Prueba de seleccion universitaria, PSU
hereafter). Therefore is free of self-reporting bias or measuring error.
The second part considers self-reported information for a representative sample of the previ-
ous population related to participation (on voting, political parties, demonstrations, engagement
with civic organanizations), political knownledge (about the electoral system, people from the
government, congress authorities, and elected congressmen in their own districts), and democ-
racy attitudes. This information is combined with the previous one to use the same regression
discontinuity strategy.
The PSU test is taken for almost all high school graduates each year.5 Students that want
to continue their education, take the test because it is used as a mechanism to rank students in
most higher education institutions in the country, and it also serves as an assignment mechanism
for loans and scholarships given by public funds in the country representing 95% of all financial
benefits in the country. Students that do not want to follow tertiary education also take the test
(most of the time), because it is sometimes requested in blue collar jobs as high school graduation
certification. Morevoer, it is free for all students in public and voucher schools that apply for a
waiver and is written few days after the end of the last year of high school.
After the PSU test results are released students may participate in a centralized process to
apply for traditional universities,6 may apply for enrollment in private universities or enrolled di-
rectly in vocational institutions. After the enrollment process end all the institution are mandated
to inform the Ministry of Education about enrollment, and the ministry assign loans, grants and
scholarships to the students previously registered for, based in eligibility rules that consider PSU596% of all high school graduates register to take this exam each year, which is about 250 thousand students per
year (in this paper 2007, 2008 and 2009).6Covering more then 50% of the college education.
7

Uppsala University, Spring 2013 Alex Solis
score cutoffs and family income quintiles determined by the tax authority.
The data on higher education enrollment considers these 3 sources of information. First,
the universe of individuals who register to take the PSU test, report a rich set of demographics
characteristics, self-reported family income, parent education, household size, place of residency,
which is combined with administrative records such as sex, birth date, graduating high school,
high school GPA, high school graduating year, application to traditional university programs, etc.
These data is combined, using the national ID (RUT), with the data on higher education
enrollment from the Ministry of Education which identifies the program and institution each
student enrolled in, whether the student applied to loans and scholarships, in which case whether
a student is eligible for loans and scholarships, and the income quintile reported by the national
tax authority.
Finally, the information is matched using the national ID with official records on registration to
vote and political party affiliation for 2 political parties, from the Electoral Commission (Servicio
Electoral de Chile). The electoral data corresponds to the registry immediately before the last
presidential election of December 2009 and the ballotage of January of 2010.
2.3 Electoral System
In the years considered, individuals are entitled to vote after they turn 18 years old and they
voluntarily register in the electoral office. After registration, voting is mandatory unless the
individual is 200 kilometers away from her poll, sick, or has lost her national id card, in which
case the individual needs to hereby certify at a police station to avoid a fine equivalent to 3 UTM7
or 200 USD.
In the presidential election of 2009, 71% of the voting-age population was registered to vote,
with turnout of 88% among individuals registered,8 which implies that 63% of the population in
age to vote turned out. As can be seen in figure 1, Chile is a country with average turnout, very
similar to the US, and very similar in terms of population in higher education with European
countries like France and Austria.97UTM is a tax measure that has a value in Chilean pesos that changes every month by inflation.8Using projected population from Census 2002 and actual registration data from electoral commission.9Turnout data comes from the International Institute for Democracy and Electoral Assistance (IDEA) and
population on tertiary education from UNESCO Institute of Statistic Data Centre.
8

Uppsala University, Spring 2013 Alex Solis
All elections days are public holidays and the poll stations are normally held in school and
stadiums well known by the electorate. Those registered to vote are required to participate in
presidential elections, elections for congress (Senators and member of congress or representatives,
diputados in Spanish), and in municipality elections to vote for mayors and city councils.10 The
presidential elections occurs every 4 years, as well as the elections for representatives, while the
senate elections happens every 8 years. All these elections are combined to happen in the same
day. Municipality elections to elect mayor and its council are carried out every 4 years and are
held 1 year before the presidential elections.
The second dependent variable is registration on a political party which is, obviously, voluntary.
There are several political parties, but only 5 of them receive more than 5% of the votes each,
receiving 78% of all votes. The 2 political parties here considered present candidates in the election
that represent 24% of all votes in members of congress elections, and represent 31% of the votes
received among the 5 biggest parties. The Christian Democracy Party is the third biggest party
receiving 14% of all votes while the Socialist Party is fifth receiving 10% of the votes. Both
participated in the coalition that governed since 1990 to 2010.
3 Identification Strategy
The correlation between education and political participation may not indicate causality by a
number of factors: the first, and more argued one, is the existence of third variables that explain
both variables simultaneously. Kam and Palmer (2008) argued that education is simply a proxy
of preadult experiences and dispositions most of the time related to family background, such as
values and personality, or even cognitive ability, that determine a high interest in politics and high
preferences for education. Therefore the high correlation found in the literature is capturing the
fact that education is simply a proxy for such characteristics. Even if education is truly causing
participation, these non-observed characteristics would upwardly bias the estimations since they
are correlated with both.
Secondly, it may be that high levels of political participation are causing a higher level of
education attainment (reverse causality). More politically active groups or communities have10The municipality is the lowest level of administration in the country. The country is divided in 15 regions, 54
provinces, and 348 municipalities. Regions and province governors are chosen by the president.
9

Uppsala University, Spring 2013 Alex Solis
the power to demand for policies in favor of more and better education. People from nations
with strong democracies may have the power to implement an educational system that preserves
democracy allowing social mobility and economic equity.
I address these problems, using a natural experiment that produces exogenous variation in
education. Students who score above a certain threshold on the PSU admission test have access
to tuition loans for any program on accredited institutions, while the group of students below the
cutoff have access to loans for vocational institution only. As shown in Solis (2012), being above
the cutoff implies an increase in the probability of going to college but also implies an increase
in the probability of enrolling in higher education in general (any college program or tertiary
vocational schools). Under the assumption that every individual score density is continuous, the
probability of being a either side of the threshold is the same, and therefore around the eligibility
cutoff access to higher education is as good as randomly assigned (Lee and Lemieux, 2010). This
element enables a regression discontinuity design that addresses the endogeneity problems, and
allows for an unbiased estimate of the causal effect of higher education on political participation.
Loans are given by two different financial programs with barely the same requirements, the
State Guaranteed Loan program (Credito con aval del Estado) and the traditional universities
loan program (Credito Solidario para universidades tradicionales). To have access to the first
loan to enroll in any accredited higher education institution (College and technical or vocational
institutions) students need to satisfy 3 requirements: have filled the economic status verification
form (Formulario Único de Acreditación Socioeconómica, FUAS) before taking the PSU test, being
classified in the 4 poorest income quintile by the tax authority and scoring more than 475 points
on average in language and mathematics of the PSU admission tests. The second loan program
asks the same requirements but is only valid for students enrolling in traditional universities.11
Nonetheless, eligible students (that filled the verification form and were classified in one of the
poorest 4 income quintiles) who scored less than the cutoff could get the State guaranteed loan if
and only if they enroll in a program from tertiary vocational institution.
Because some students below the cutoff enrolled in college despite the fact of not receiving11Traditional university is the term used to indicate one of the 25 oldest universities in the country that existed
before the educational reform of 1981. Among the 25 traditional universities there are private and publicly fundeduniversities. The universities that are not part of this group are called “private” universities, and are mainly forprofit universities. Students in private universities did not have access to loans funded by the government beforethe inclusion on the State Guaranteed Loan in 2006.
10

Uppsala University, Spring 2013 Alex Solis
financial support, the rate of enrollment is not zero below the cutoff, but jumps discontinuosly on
it. Students below the cutoff substitute college for vocational programs where they have access to
loans, but also there is more students enrolling in higher education above the cutoff than below.
I use the cutoff as an instrument for both measures of higher education, in a fuzzy regression
discontinuity design. In the first stage I estimated the relationship between higher education or
college with respect to the cutoff, controlling for the influence of the running variable using a
flexible function for both sides of the eligibility threshold
Educationi = α1 + β1 · 1(Ti > τ) + f(Ti) +Xi · δ1 + νi (1)
and in the second stage I estimate the the relationship of interest
PolParti = α2 + β2 · Educationi + f(Ti) · +Xi · δ2 + ηi (2)
These loans schemes produces a significant discontinuity in the enrollment rate for higher
education and for college. Panel A on Table 2 shows the RD estimation for college enrollment.
The different columns show different specifications from linear regression using a bandwidth of
44 points to polynomials splines of 2nd, 3rd and 4th order using the full sample. The results are
stable and robust to specification and to the inclusion of a rich set of covariates.
The probability of going to college jumps 18 percentage points for those who barely score 475
or more. This represent an increase of 82 percent with respect to the baseline enrollment rate of
those who barely score below the cutoff (enrollment of 22 percent). On Panel B I show the RD
estimation for higher education, which included enrollment in college, but also in any vocational
institution. The enrollment rate is also robust to specification and the inclusion of covariates
and it shows that students above the cutoff enrolled 11 percentage points more often in higher
education than those who did not achieve the cutoff. This increment in the probability of enrolling
in higher education represent an increase of 21% with respect to the baseline enrollment rate of
those that score below 475.
One hypothesis used to explain the relationship between education and participation states
that higher education equips individuals with better cognitive abilities; unfortunately, there is no
measure of cognitive abilities for these students a few years after they enrolled in higher education,
11

Uppsala University, Spring 2013 Alex Solis
to test directly if education produces these political improvement skills. Instead, I will test this
hypothesis comparing indirectly the groups of students who receive higher education as good as
randomly, using the cutoff on the admission test as instrument for higher education, in a 2SLS
framework. I will test the extensive margin comparing students who enroll into higher education
as a consequence of being eligible to receive tuition loans. I
Nevertheless, it may be that not all types of higher education produce improvements in the
relevant skills. Programs that teach civic or social sciences directly are more likely to produce
highly participative students (Hillygis, 2005). According to that idea an exogenous variation in
higher education broadly defined may not be enough to allow the identification of the effect.
Therefore, I use a more strict measure of higher education: college education. I compare students
that go to college as consequence of the financing programs around the cutoff.
3.1 Conditions for a Valid RD
To test the requirements for a valid regression discontinuity design, that ensure that students
below and above the eligibility threshold are comparable in observables and unobservables, I
perform 2 common tests: first, I show that students are not able to manipulate their score, and
second, that there is no other baseline characteristic that changes at the cutoff.
Figure 2 shows the estimate of the density function of PSU scores using fourth order splines for
the assignment variable at each side of the cutoff, plus 95% confidence intervals. Dots in Figure
2 correspond to the empirical density. The test shows that the density function is statistically
continuous at the cutoff, which confirms that PSU scores are not subject to manipulation around
the cutoff.
Table 1 shows the balance of baseline characteristics. The first 2 columns indicate the differ-
ences in each observable characteristic using 2 different approaches. The first column uses all the
data and control with 4th order polynomials splines for the running variable (PSU score) on both
sides of the cutoff. The second column reproduces the method used in Solis (2012) using a linear
specification restricting the sample to all students within 44 PSU points of the cutoff, where 44
correspond to the optimal bandwidth calculated using the method of Imbens and Kalyanaraman
(2012). Column (1) shows that only age and income quintile appear significantly different at 5%
12

Uppsala University, Spring 2013 Alex Solis
and 10% level of significance respectively, while in column (2) with the linear specification the
balance appear for all variables. Columns (3) through (6) repeat this calculations for the indi-
viduals enrolled in higher education and college. In the last 2 columns is evident that students
that do not have access to these loans, enrolled only when they come from higher income families,
with more educated parents, and therefore the change in enrollment come from the fact that these
loans are key to finance their higher education.
3.2 The Correlation for This Age Group
One concern with the data used in this paper is that consider individuals that graduated from high
school between 2006 and 2008 and the most important measure of political participation, voting
registration, is taken at the end of 2009. If education affects political participation in the long
run, students that have been only 3, 2 and 1 year on higher education won’t reflect any difference
with respect to their counterfactual. Nevertheless, the advantage of analyzing individual behavior
at this point of time is that there is no variation in income that confound the effects. This is one
of the main problems faced when considering individuals at older ages, because education also
affect individual’s income, and therefore is impossible to disentangle the effects of education from
of income.
To show how important this problem is, it is necessary to see if the correlation between ed-
ucation and political participation at this age exist. I show in Table 3 OLS regressions showing
the correlation between three measures of higher education on the 2 outcomes of interest. The
constant corresponds to the average participation for the population without higher education
(registration to vote in the first 3 columns and political party affiliation in the following 3). The
label “Education” indicates the increment in participation for different measures of higher educa-
tion. For columns (1) and (4), “Education” correspond to any program in a higher educational
institution either college or vocational. Column (1) shows that the average participation rate for
individuals without higher education is 20%, but having 1 to 3 years of higher education increase
the probability of registration to vote 5 percentage points (a relative increase of 25%). Columns
(2) and (5) “Education” correspond to enrollment in college. Column (2) shows that the average
participation rate for individuals without college is 18%, but having between 1 to 3 years of college
increase this probability 10 percentage points (a relative increase of 50%). The same happened
13

Uppsala University, Spring 2013 Alex Solis
when “Education” correspond to number of years of higher education received by the students.
Therefore this young population shows a strong and positive correlation between higher education
and participation as expected.
To reinforce the idea that the correlation is present for this age group, Table 4 shows the
same regressions using 2 publicly available surveys: first, the National Survey from Diego Por-
tales university12 from which I take self-reported registration to vote; and the national household
survey CASEN13 from which I obtain the question on political party participation. The sample
is restricted to the group of the same age than the population in the previous table. From this
table we can infer that the correlation between education and political participation is also present
in these surveys, and second the relationship is much stronger, which may indicate the presence
of some behavioral bias: participation selection and overreporting. While table 3 indicates that
having any type of higher education increases registration to vote by 4.6 percentage points, the
National survey form Diego Portales university in table 4 shows that higher education increases
registration by 26.5 percentage points, about 5.8 times what indicate the official records. The
same happens for college enrolled. The relationship in surveys appear to be 4 times higher that
the official records.
One explanation may be that the individuals who did not register for the PSU test are regis-
tered to vote with a higher probability, which in implausible since 96% of all high school graduates
register to take the admission test. According to the official records 529,216 individuals between
18 and 26 years old were registered to vote when the registry closed before the presidential elec-
tion of 2009. Using the Census 2002 the population between 11 and 19 year old (which became
between 18 and 26 in 2009) reach the 2,421,331 individuals, assuming that nobody dies in those
7 years the rate of registration would be 21.86%, which is very similar to the number obtained
with the population taking the PSU.14
12This survey is collected yearly and considers about 90 questions about political perceptions, discriminationopinions, etc. There are about 1300 interviews each year in 87 cities representing about 86% of the urban populationof the country. The method used is the probabilistic by strata.
13CASEN is the main household survey in the country is implemented by the government to represent thepopulation of the country. It mainly contain question about income, health, labor, education and householdconditions. In 2009 they include the question about participating in political parties.
14For Political party affiliation we cannot make the same argument since I am using information only on 2 politicalparties.
14

Uppsala University, Spring 2013 Alex Solis
4 Results
4.1 Effects on Registration to Vote and Party Affiliation
The estimated relationship between education and political participation can be summarized with
the reduced form. Figure 3 shows it in its graphical form: The relationship between registration
to vote and the PSU score around the cutoff. The left graph shows this for the whole sample,
while the figure on the right shows a zoom for a window of 100 point (1 standard deviation). Both
figures show that the relationship is precisely zero.
Table 5 confirms the latter, it shows the reduced form between both measures of political
participation on a dummy variable that takes the value of 1 if student i score more than the cutoff
on the admission test (plus 4th order polynomials on both sides for the running variable that are
not shown in the table). Panel A shows the results for registration to vote and panel B shows the
effects for the affiliation to both political parties here considered. Columns (2) (4) and (6) add a
series of covariates.
All columns show that crossing the threshold doesn’t imply any change in political participa-
tion. The relation between voting registration is actually negative. This lead to the conclusion
that college and higher education in general do not cause higher political participation.
Table 6 confirm the latter. It shows the 2SLS regressions for college and higher education in
both measures of participation.
4.2 Heterogeneity
The literature often indicates that the second most important characteristics influencing political
participation (the first being education) are individual’s income and sex. In the following tables I
explore if these exogenous measures of higher education make any difference for different income
groups and sex.
4.2.1 Income
First, Panel A on Table 7 shows that the eligibility cutoff implied a significant change in the
probability of higher education, and college for all the income quintiles except for the one that
was not eligible for loans (the richest quintile, the fifth). Consistently the group that benefits
15

Uppsala University, Spring 2013 Alex Solis
most from the financial programs is the poorest income quintile, where the probability of going
to higher education went from 52.4% to 65.9% (a 26% increase), while for the second quintile the
relative increase is only 18%. In the case of college the poorest income quintile experienced an
increase of 20 percentage points relative to the enrollment rate of 19% for those barely below,
implying a relative increase of 104% on the probability of going to college.
Nevertheless, panel B on Table 7 shows that the exogenous variation in higher education in
all its forms did not cause a higher probability of participation for none of the income quintiles.
4.2.2 Sex
The second more important feature explaining political participation is sex. Table 8 shows the
first stages for sexes and, as before, are very strong, especially for college education. The females
in the control group (those barely below the cutoff) enrolled on average 20% of the time while
those treated with college education (those barely above the cutoff) increase their probability on
15 percentage points (a 75% increase). The same patterns are valid for higher education.
5 Evidence from a Survey
To explore other forms of political participation and to explain the differences between the admin-
istrative and survey data (reported between tables 3 and 4) I performed in October of 2012 a web
survey. Students that participated in the admission process between 2007 and 2009 were invited
by email to answer a web survey. The invitation was sent to the email addresses self-reported
by the students when they registered to write the PSU test, when they were in the last year
of high school. The survey was designed for this purpose and it was administered by the Uni-
versidad Católica de Concepción, who sent the emails and later merged the information with to
administrative data from the PSU process, to enrollment in higher education and to the electoral
data.15,16
The rate of response was about 5%, lower that the average response rate for online surveys
(30%) (Nulty, 2008). There is many reasons that potentially can explain this rate of response.15This University is part of the Council of Rectors of the Chilean Universities, who managed the PSU test every
year and owns the data.16The survey can be found in the appendix
16

Uppsala University, Spring 2013 Alex Solis
The first, these emails addresses were self-reported by students between 2007 and 2009, and they
may have not been kept by the students after they entered to study or work. A second reason, it
may be that the invitation email went directly to spam folders, because the email address used
to send the invitation was not previously known by the students, and contained words such as
“invitation”, “survey”, “questionnaire”, “raffle”, “Ipad”, and “tablet”, all of which are considered
to raise red flags from email servers.17 Third, students may follow common recommendation from
IT technicians that suggests not to open emails from unknown senders. Students registered their
emails and agreed to be contacted for anything related to the PSU process when they registered
to take the PSU, but they do not know us before the invitation email.
To increase the response rate I offered a raffle of 3 tablets (2 Ipads and 1 HP tablet) and 5 gift
cards ($20 each). Preliminary inspection of the data indicates that less than 8% of the students
actually opened the invitation email, and 0.1% requested to be unsubscribed.
The main concern is that the respondents may not be a representative sample. To show
what type of selection is faced by the survey, I perform a RD t-test comparing respondents with
the population at the cutoff, i.e. I perform RD regressions of the type of equation (1) to a set
of observable characteristics. Table 9 shows this exercise. Column (1) indicates the population
levels for the base line characteristics (for students ε below the cutoff). Column (2) indicates the
difference for students that are (barely) above the cutoff. Column (4) shows the levels of survey
respondents (below the cutoff). Column (5) shows the difference in levels between the survey
respondents above the cutoff. Finally Columns (7) compares levels between the population and
the survey.
This table shows two things, first, that surveyed students above and below the threshold are
comparable in observables, suggesting that both groups can be considered as good counterfactual.
Secondly it shows that, around the threshold, survey respondents are almost identical to the
population, except for 2 characteristics that are significantly different at the 10% level: Sex and
type of high school. The survey is answered by more women and presents more students that
graduated from public high schools (and as a consequence less students graduated from voucher
high schools). This evidence shows that the surveyed sample is a representative sample of the
population of interest.17A translation of the invitation appears in the appendix
17

Uppsala University, Spring 2013 Alex Solis
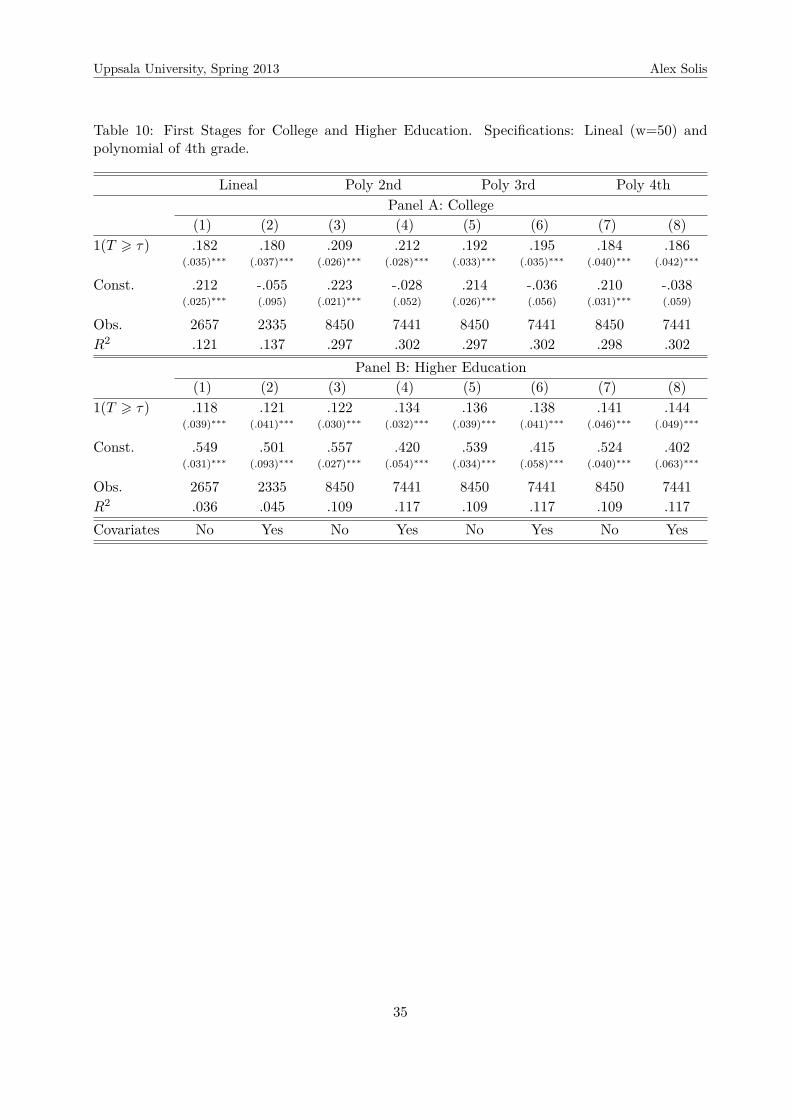
Table 10 shows that the exogenous change in the college and higher education enrollment is
also present in the survey and is almost identical to the changes from the population. Therefore
all the evidence from the survey can be associated to an exogenous change in college and higher
education.
One potential problem is that the survey is performed in 2012, and asked to recall if someone
was register to vote at the end of 2009.18 However, the 2009 election was the last one when
individuals had to be registered before being able to vote, for the following election in 2012,
registration was universal and voting voluntary. Therefore the problem of recollection may not
be as important. If students registered to vote they did it between 2007 and 2009, and in that
period only 2 elections were held: The presidential one of 2009 (that also elected senators and
house representatives) and the municipal election of 2008. Therefore they did not have the chance
to registered after the election of 2009 and get confused as a consequence.
Finally, I present in Table 11 and Table 12 OLS regressions for different forms of political
participation and political knowledge elicited in the survey to compare them with the results
using a exogenous source of higher education. The first 3 columns show the regression of the
dependent variable on a dummy for college in Table 11, and a dummy for higher education in
Table 12. Columns (4) to (6) add to this regression a set of baseline characteristics.19 The
sample is restricted to 80 points around the cutoff to focus in what happen around the cutoff.20.
This table shows that college and higher education is highly correlated with self-reported form of
political participation, but also with the official registration and political knowledge that do not
suffer from overreporting bias.
College appears to increase 6 percentage points the official registration to vote (about a 25%
relative increase) and is not distinguishable from the self-reported registration. Interestingly
overreporting appears to be balanced across educational levels.
Additionally, college appear to increase knowledge about politics (for example, college students
are able to name a senator - in the student’s own district - 7 percentage points more frequently);18This is not a problem for political party affiliation, since the information about party affiliation was collected
during 2012, and the survey asked current affiliation status.19The covariates are PSU score, Income quintile, self-reported income category, sex, dummies for type of school
(public, voucher and private), high school GPA, household size, if worked previously to take the PSU, and fatherand mother education.
20The tables with the whole sample are shown in the appendix, and show an even greater correlation.
18

Uppsala University, Spring 2013 Alex Solis
appear to induce better attitudes towards democracy (college students agreed that democracy
is the best political system 4 percentage points more often); appear to increase the amount of
information held by students (they agree on knowing candidates proposals, 4 percentage points
higher); increase the likelihood of participation in political demonstrations (11 percentage points
more often) and in civic organizations (4 percentage points more often or 35% relatively more
likely that non-college students). In conclusion, college education appears to induce all form of
political participation and also increase the information set, changing also the attitudes toward a
democratic system and to more redistribution.
The same happened in Table 12 for higher education, but less pronounced.
5.1 Estimates Using the Survey Results
Table 13 shows the main outcomes of the survey with respect to the cutoff, the reduced form
regression. Columns (1) and (2) indicate that among surveyed there is no change in political
participation when the administrative data is used, confirming the results shown previously. In
this case both specifications show a positive but not statistically significant relationship. Columns
(3) and (4) show the self-reported change in registration to vote. The self-reported registration
to vote is positive for both specifications and is statistically different from zero for the linear
regression. This relationship is about 3% higher than the actual one which indicates that some
individuals misreport their participation.
In this case we can compare the self-reported with the true registration to vote. Columns (5)
and (6) show that students crossing the threshold overreport their registration to vote significantly.
Students that barely became eligible for loans overreport their registration 2 percentage points
more frequently than those barely below the cutoff. Students that are barely below have an the
average rate of overreporting of zero (represented by the constant term).
Whereas, the last two columns show that underreporting is also present in the survey, and
there is no difference between the students around the threshold, both groups misreport about
3% of the cases.
These results may benefit from the fact that the 2009 election was a presidential one. Górecki
(2011), and Karp and Brokington (2005) suggest that overreporting depends on the importance
of the election, and individuals tend to increase their overreporting in presidential ones. Unfortu-
19

Uppsala University, Spring 2013 Alex Solis
nately, I cannot test if overreporting is lower in a non-presidential election, as mentioned before
this election was the last that requires reguistration to vote, and therefore the chance to use the
same strategy was eliminated.
Table 14 shows the effects on these variables using the cutoff as instrument for college enroll-
ment. Again columns (1) and (2) show that college education does not imply a higher registration
to vote, and columns (3) and (4) show that self-reported registration is higher than the oficcial
record (and positive and significant for the linear case). Columns (5) and (6) shows that the
probability of overreporting increases between 10 and 12 percentage points for students enrolled
in college, but there is no misreporting related to college education (columns (7) and (8)).
Table 15 shows the results when the cutoff is used as an instrument for any type of higher
education. The results have the same pattern shown in the previous table. Now self-reported
registration is not significantly different for students that enrolled in higher education for both
specification, and receiving higher education increases the probability of overreporting between
15 and 19 percentage points.
This findings confirms the causal relationship suggested by Silver, Anderson and Abramson
(1986) that indicates that the most inclined to overreport are the highly educated. Additionally,
this evidence is consistent with the literature findings that indicate that overreporting do not
affect the conclusions of political participation. Overreporting is very low and therefore do not
affect the conclusions relative to voting registration. However the low rate of overreporting may
be a consequence of the type of survey, as in web surveys there is no person acting as surveyor,
which reduces the embarrassment of answering a social undesirable behavior (Silver, Abramson
and Anderson, 1986). Nevertheless, it shows that overreporting is not randomly distributed in the
population, consistent with the findings of Bernstein, Chadha, and Montjoy (2001), indicating that
using reported vote, potentially distorts the relative effects of some variables on voting, inducing
to mistakenly support some hypothesis.
Finally table 16 shows that there is no effect of education on political knowledge (the score
in 14 question about the electoral system and people in government and congress, see appendix),
and attitudes (How much do you agree in the statement “I like politics”, and “democracy is the
best political system”), on information about candidates proposals and others forms of political
participation, (demonstrations, such as protests, occupation of buildings, political meetings, etc.,
20

Uppsala University, Spring 2013 Alex Solis
and participation on civic organizations, such as sport clubs, unions, religious groups, etc.). The
upper panel of Table 16 uses a linear specification in a windows of 80 points and the lower panel
a 3rd order polynomial spline for the whole sample. I don’t show that 2SLS regressions since the
reduced form is zero.
6 Conclusion
The relationship between education and political participation has been broadly explored in the
literature, but only few papers have examined the causal channels. To deal with endogeneity I used
a regressions discontinuity design induced by the eligibility criteria of two higher education loans
in Chile. The two programs require that students score above a cutoff in the national admission
test for college, PSU, which is taken by the majority of high school graduates each year. Students
that do not meet this requirement can only access to loans in technical institutions.
The eligibility criteria induce a jump in the enrollment rate of college and higher education in
general (Solis, 2012). This exogenous source of higher education was merged with administrative
records of voting registration and political party affiliation to have measures of participation that
do not suffers from overreporting and response bias.
The estimation indicates that there is not causal effect of the two exogenous measures of
higher education on the two political participation measures. Moreover, I find that this results is
persistent to any subsample, grouped by income level (using tax authority classification), by sex,
or other background characteristic.
To explore more forms of political participation, political knowledge, attitudes, and difference
in the information sets, I collected survey data for a representative sample from the population
mentioned before. Using the same exogenous variation on higher education, I found that the
two measures of higher education do not cause any of the measure elicited in the survey: higher
political participation (measured as participation on demonstrations and civic organizations),
higher political knowledge, better attitudes towards democracy, and self-reported measures of
information.
However, I found that college and higher education do cause overreporting on registration to
vote confirming previous hypothesis that indicate that educated individuals feel higher pressure
21

Uppsala University, Spring 2013 Alex Solis
to participate and to engage in social desirable behavior (Silver, Anderson, and Abramson (1986),
and Bernstein, Chadha and Montjoy (2001), and Funk (2010)). This result shows that using self-
reported vote data, potentially distorts the relative effects of some variables on voting, inducing
to mistakenly support some hypothesis.
The conclusion is that political participation measured as registration to vote and affiliation
to political party is not caused by education.
22

Uppsala University, Spring 2013 Alex Solis
7 References
1. Acemoglu, D., & Angrist, J. D. (2000). How large are human-capital externalities? Ev-
idence from compulsory schooling laws. In B. S. Bernanke & K. Rogoff (Eds.), NBER
macroeconomics annual 2000 (pp. 9–59). Cambridge, MA: MIT Press.
2. Acemoglu, D., Johnson, S., Robinson, J. A. and Yared, P., 2005. From education to democ-
racy? American Economic Review Papers and Proceedings 95, 44–49.
3. Angrist, J. D. (1990). Lifetime earnings and the Vietnam era draft lottery: Evidence from
social security administrative records. The American Economic Review, 80(3), 313–336.
4. Angrist, J. D., & Krueger, A. B. (1992). Estimating the payoff to schooling using the
Vietnam-era draft lottery. NBER Working Paper Series, Working Paper No. 4067.
5. Barro, Robert J. "The Determinants of Democracy." Journal of Political Economy, 1999,
107(S6), pp. S158-83.
6. Berinsky, A. J. & Lenz G. S. (2010). Education and Political Participation: Exploring the
Causal Link. Political Behavior Vol. 33, Number 3 (2011), 357-373,
7. Bernstein, R., Chadha, A., Montjoy, R., (2001). Overreporting voting: why it happens and
why it matters. Public Opinion Quarterly 65 (1), pp 22–44.
8. Black, S., P. Devereux and K. Salvanes, (2008). “Staying In the Classroom and Out of the
Maternity Ward? The Effects of Compulsory Schooling Laws on Teenage Births.” Economic
Journal.
9. Bobba, Matteo & Coviello, Decio, (2007). “Weak instruments and weak identification, in
estimating the effects of education, on democracy,” Economics Letters, vol. 96(3), 301-306.
10. Borgonovi, Francesca, d’Hombres, Beatrice & Hoskins, Bryony, (2010). “Voter Turnout,
Information Acquisition and Education: Evidence from 15 European Countries,” The B.E.
Journal of Economic Analysis & Policy, vol. 10(1), (Contributions), Article 90.
11. Brody, R. (1978). The puzzle of participation in America. In Anthony King (ed.), The New
American Political System. Washington, DC.: American Enterprise Institute.
23
Uppsala University, Spring 2013 Alex Solis
12. Campbell, A., Converse, P.E., Stokes, D.E., and Miller, W.E., (1960). The American Voter.
Wiley, New York.
13. Campante, Filipe R. & Chor, Davin, (2012). “Why Was the Arab World Poised for Rev-
olution? Schooling, Economic Opportunities, and the Arab Spring,” Journal of Economic
Perspectives, vol. 26(2), 167–88.
14. Castelló-Climent, Amparo, (2008). “On the distribution of education and democracy,” Jour-
nal of Development Economics, vol. 87(2), pages 179–190.
15. Card, D. (1995). Using geographic variation in college proximity to estimate the return
to schooling. In L. N. Christofides, E. K. Grant, & R. Swidinsky (Eds.), Aspects of labour
market behavior: Essays in honour of John Vanderkamp (pp. 201–222). Toronto: University
of Toronto Press.
16. Card, D., & Lemieux, T. (2001). Going to college to avoid the draft: The unintended legacy
of the Vietnam war. AEA Papers and Proceedings, 91(2), 97–102.
17. Chevalier, Arnaud & Doyle, Orla, (2012). “Schooling and Voter Turnout: Is there an
American Exception?,” IZA Discussion Papers 6539, Institute for the Study of Labor (IZA).
18. Dee, T. S. (2004). Are there civic returns to education? Journal of Public Economics, 88,
1697–1720.
19. Erikson, R. S. & Stoker, L. (2011). Caught in the Draft: The Effects of Vietnam Draft
Lottery Status on Political Attitudes. American Political Science Review, Vol. 105, No. 2
20. Friedman, Willa; Kremer, Michael; Miguel, Edward; and Thornton, Rebecca, (2011). “Ed-
ucation As Liberation?” NBER Working Paper 16939
21. Funk, Patricia. (2010). Social Incentives And Voter Turnout: Evidence From The Swiss
Mail Ballot System. Journal of the European Economic Association, Vol. 8 No. 5 pp.
1077–1103.
22. Galston, W. A. (2001). Political knowledge, political engagement and civic education. An-
nual Review of Political Science 4: 217–234.
24
Uppsala University, Spring 2013 Alex Solis
23. Glaeser, Edward L.; La Porta, Rafael; Lopez-de- Silanes, Florencio and Shleifer, Andrei,
(2004). "Do Institutions Cause Growth?." Journal of Economic Growth, 9(3), pp. 271-303.
24. Glaeser, Edward L..; Ponzetto, Giacomo; and Shleifer, Andrei, (2007) “Why Does Democ-
racy Need Education?” Journal of Economic Growth.
25. Górecki, Maciej A. (2011). “Electoral Salience and Vote Overreporting: Another Look at
the Problem of Validity in Voter Turnout Studies.” International Journal of Public Opinion
Research, 544- 557.
26. Hanushek, E., (2002). Publicly provided education. In: Auerbach, A., Feldstein, M. (Eds.),
The Handbook of Public Economics. vol. 3. Elsevier, Amsterdam, pp. 2015– 2141.
27. Henderson, J., & Chatfield, S. (2011). Who matches? Propensity scores and bias in the
causal effects of education on participation. Journal of Politics. Vol. 73, No. 3, pp. 646–658.
28. Highton, Benjamin, (2009). Reconsidering the Effects of Education on Political Participa-
tion. The Journal of Politics, Vol. 71, No. 4, October 2009, pp. 1564–1576.
29. Hillygus, D. S. (2005). The missing link: Exploring the relationship between higher educa-
tion and political behavior. Political Behavior, 27(1), 25–47.
30. Imbens, Guido W., and Karthik Kalyanaraman, “Optimal Bandwidth Choice for the Re-
gression Discontinuity Estimator,” The Review of Economic Studies, 79 (2012), 933–959.
31. Kam, C. D., & Palmer, C. L. (2008). Reconsidering the effects of education on political
participation. The Journal of Politics, 70(3), 612–631.
32. Karp, Jeffery and Brockington, David, (2005). "Social Desirability and Response Validity:
A Comparative Analysis in Over-reporting Voter Turnout in Five Countries." Journal of
Politics. 67. 825-840.
33. Lee, D. S., and Lemieux T., (2010). Regression Discontinuity Designs in Economics. Journal
of Economic Literature, 48(2), 281–355.
34. Lipset, S., (1959). Some social requisites for democracy: Economic development and political
legitimacy. American Political Science Review, 53(1), 69-105.
25

Uppsala University, Spring 2013 Alex Solis
35. Lochner, Lance, (2011). “Non-Production Benefits of Education: Crime, Health, and Good
Citizenship,” NBER Working Papers 16722,
36. Luskin, R. C. (1990). “Explaining political sophistication”. Political Behavior 12(4): 331–355.
37. Milligan, K., Moretti, E., & Oreopoulos, P. (2004). Does education improve citizenship?
Evidence from the United States and the United Kingdom. Journal of Public Economics,
88, 1667–1695.
38. Nie, N.H., Junn, J., Stehlik-Barry, K., (1996). Education and Democratic Citizenship in
America. University of Chicago Press, Chicago.
39. Nulty, Duncan D., (2010), “The adequacy of response rates to online and paper surveys:
what can be done? Assessment & Evaluation in Higher Education Vol. 33, No. 3, 301–314.
40. Pelkonen, Panu, (2012). “Length of compulsory education and voter turnout—evidence
from a staged reform,” Public Choice, Vol. 150(1), 51–75.
41. Putnam, Robert D., (1995), “Tuning In, Tuning Out: The Strange Disappearance of Social
Capital in America,” PS: Political Science & Politics 28, 664–683.
42. Rosenstone, S., and Hansen, J. M. (1993). Mobilization, Participation, and Democracy in
America. New York: Macmillan.
43. Schlozman, K. L. (2002). Citizen participation in America: What do we know? Why do we
care? In I. Katznelson & H. V. Milner (Eds.), Political science: State of the discipline (pp.
433–461). New York: W.W. Norton and Co
44. Siedler, Thomas , (2010) “Schooling and Citizenship in a Young Democracy: Evidence from
Postwar Germany”. Scandinavian Journal of Economics, 112(2), 315–338.
45. Silver, Brian D., Anderson, Barbara A., and Abramson Paul R. (1986). “Who overreports
voting?” American Political Science Review 80(2), 613– 624.
46. Silver, Brian D., Abramson Paul R. and Anderson, Barbara A., (1986). “The Presence of
Others and Overreporting of Voting in American National Elections.” The Public Opinion
Quarterly, Vol. 50(2), 228–239
26

Uppsala University, Spring 2013 Alex Solis
47. Solis, A., (2012). Credit Access and College Enrollment. Working paper
(http://are.berkeley.edu/~alexsolis/CreditAccess&EnrollmentSolis.pdf)
48. Sondheimer, R. M., & Green, D. P. (2010). Using experiments to estimate the effects of
education on voter turnout. American Journal of Political Science, 54(1), 174–189.
49. Tenn, Steven, (2007 ). “The Effect of Education on Voter Turnout”. Political Analysis, Vol
15, 446–464.
50. Wolfinger, R. E., & Rosenstone, S. J. (1980). Who votes?. New Haven: Yale University
Press
27

Uppsala University, Spring 2013 Alex Solis
8 Tables
Table 1: Balance of covariates for all the students, and conditional on enrolling into higher edu-cation and college. Using 2 methods: a 4th order polynomial and a linear specification.
All Higher Education College4th poly linear 4th poly linear 4th poly linear
1(Female) 0.01 0.00 0.02 0.01 0.02 0.02(0.01) (0.01) (0.01)* (0.01) (0.02) (0.01)
Income quintile 0.03 0.02 -0.01 -0.03 -0.21 -0.21(0.02)* (0.01) (0.02) (0.02) (0.04)*** (0.03)***
Self reported Income 0.00 0.00 -0.02 -0.02 -0.11 -0.11(0.01) (0.01) (0.01)* (0.01)** (0.02)*** (0.02)***
Mother Education 0.02 0.01 0.01 -0.01 -0.24 -0.26(0.04) (0.03) (0.05) (0.05) (0.08)*** (0.07)***
Father Education 0.06 0.02 0.02 -0.03 -0.24 -0.33(0.04) (0.04) (0.06) (0.06) (0.1)** (0.09)***
Household size -0.01 -0.02 -0.01 -0.01 0.07 0.07(0.03) (0.03) (0.04) (0.03) (0.06) (0.05)
Age 0.03 0.02 0.06 0.04 0.00 -0.01(0.02)** (0.02) (0.02)** (0.02)** (0.04) (0.03)
1(married) 0.001 -0.001 0.002 0.000 0.01 0.00(0.002) (0.002) (0.003) (0.003) (0.01) (0)
1(work) 0.005 0.004 0.01 0.00 0.00 0.00(0.005) (0.004) (0.01) (0.01) (0.01) (0.01)
High School Type 0.01 0.01 0.01 0.02 0.06 0.08(0.01) (0.01) (0.01) (0.01)* (0.02)*** (0.02)***
High School GPA 1.10 -0.77 2.62 1.19 12.16 12.77(1.67) (1.54) (2.27) (2.07) (3.85)*** (3.34)***
Observations 233,898 79,359 150,246 45,916 102,597 24,330
Robust standard error in parenthesis. ***: p-value<1%, **: p-value<5, *: p-value<10%. The 4th order polynomialis on the running variable PSU score. the linear specification is restricted to the optimal bandwidth of Imbens andKalyanaraman (2009) of 44 PSU points around the cutoff.
28

Uppsala University, Spring 2013 Alex Solis
Table 2: First Stages for College and Higher Education. Specifications: Lineal (w=44) andpolynomial of 4th grade.
Lineal Poly 2nd Poly 3rd Poly 4thPanel A: College
(1) (2) (3) (4) (5) (6) (7) (8)1(T > τ) .175 .175 .179 .181 .170 .171 .170 .169
(.006)∗∗∗ (.006)∗∗∗ (.004)∗∗∗ (.004)∗∗∗ (.005)∗∗∗ (.005)∗∗∗ (.006)∗∗∗ (.006)∗∗∗
Const. .224 -.015 .213 .042 .239 .066 .243 .074(.007)∗∗∗ (.014) (.004)∗∗∗ (.008)∗∗∗ (.008)∗∗∗ (.010)∗∗∗ (.014)∗∗∗ (.015)∗∗∗
Obs. 79348 79254 235801 235552 235801 235552 235801 235552R2 .107 .117 .337 .342 .337 .342 .337 .342
Panel B: Higher Education(1) (2) (3) (4) (5) (6) (7) (8)
1(T > τ) .114 .114 .112 .113 .119 .120 .114 .114(.007)∗∗∗ (.007)∗∗∗ (.005)∗∗∗ (.005)∗∗∗ (.006)∗∗∗ (.006)∗∗∗ (.007)∗∗∗ (.007)∗∗∗
Const. .521 .409 .512 .399 .516 .403 .526 .414(.010)∗∗∗ (.017)∗∗∗ (.006)∗∗∗ (.010)∗∗∗ (.012)∗∗∗ (.014)∗∗∗ (.021)∗∗∗ (.022)∗∗∗
Obs. 79348 79254 235801 235552 235801 235552 235801 235552R2 .026 .03 .101 .105 .101 .105 .101 .105Covariates No Yes No Yes No Yes No Yes
Robust standard error in parenthesis. ***: p-value<1%, **: p-value<5, *: p-value<10%. The 4th order polynomialis on the running variable PSU score. the linear specification is restricted to the optimal bandwidth of Imbens andKalyanaraman (2009) of 44 PSU points around the cutoff.
Table 3: OLS relationship using all students that take the PSU between 2007 and 2009: registra-tion to vote and Participation in political party
Registration to Vote Political Party AffiliationHigher College Years of Higher College Years ofEduc. Educ. Educ. Educ. Educ. Educ.(1) (2) (3) (4) (5) (6)
Const. .199 .184 .181 .002 .001 .001(.001)∗∗∗ (.001)∗∗∗ (.001)∗∗∗ (.0001)∗∗∗ (.00009)∗∗∗ (.0001)∗∗∗
Education .046 .102 .018 .0003 .0007 .0001(.002)∗∗∗ (.002)∗∗∗ (.0004)∗∗∗ (.0001)∗∗ (.0001)∗∗∗ (.00003)∗∗∗
Obs. 235801 235801 235801 235801 235801 235801R2 .003 .014 .009 1.00e-05 .00006 .00004
Robust standard errors in parenthesis. ***: p-value<1%, **: p-value<5%
29

Uppsala University, Spring 2013 Alex Solis
Table 4: OLS relationship using representative surveys CASEN 2009 and UDP Political Partici-pation survey: Registration to vote and participation in political party for all surveyed individualsbetween 18 and 26 years old)
Registration to Vote Political Party AffiliationHigher College Years of Higher College Years ofEduc. Educ. Educ. Educ. Educ. Educ.(1) (2) (3) (4) (5) (6)
Const. .121 .202 -.431 .0005 .0008 -.003(.036)∗∗∗ (.029)∗∗∗ (.162)∗∗∗ (.0002)∗∗ (.0002)∗∗∗ (.0009)∗∗∗
Education .265 .441 .052 .003 .004 .0004(.056)∗∗∗ (.113)∗∗∗ (.013)∗∗∗ (.0004)∗∗∗ (.0005)∗∗∗ (.00007)∗∗∗
Survey UDP UDP UDP Casen Casen CasenObs. 212 212 212 36248 36248 36248R2 .096 .067 .076 .002 .001 .0008
Robust standard error in parenthesis. ***: p-value<1%, **: p-value<5%
Table 5: Reduced form. Effects on political participation of crossing the cutoff
Lineal Poly 3rd Poly 4thPanel A: Registration to Vote
(1) (2) (3) (4) (5) (6)1(T > τ) -.005 -.007 -.005 -.007 -.003 -.005
(.006) (.006) (.005) (.005) (.006) (.006)
Const. .209 -.416 .214 -.402 .211 -.406(.008)∗∗∗ (.028)∗∗∗ (.009)∗∗∗ (.017)∗∗∗ (.016)∗∗∗ (.022)∗∗∗
Obs. 79888 79791 235801 235552 235801 235552R2 .002 .014 .029 .042 .029 .042
Panel B: Party Affiliation1(T > τ) .0001 .0001 -.0001 -.0001 .0003 .0003
(.0006) (.0006) (.0005) (.0005) (.0006) (.0006)
Const. .0008 -.012 .001 -.013 -.0006 -.015(.0008) (.005)∗∗ (.0009) (.003)∗∗∗ (.002) (.003)∗∗∗
Obs. 79888 79791 235801 235552 235801 235552R2 .00003 .001 .00003 .001 .00004 .001Covariates No Yes No Yes No Yes
Robust standard error in parenthesis. ***: p-value<1%, **: p-value<5, *: p-value<10%.
30

Uppsala University, Spring 2013 Alex Solis
Table 6: IV regressions for Voting registration and party Affiliation.
Lineal Poly 3rd Poly 4thRegistration to Vote
(1) (2) (3) (4) (5) (6)1(College) -.031 -.040 -.032 -.041 -.020 -.030
(.032) (.032) (.029) (.029) (.035) (.035)
Const. .216 -.420 .222 -.401 .216 -.405(.014)∗∗∗ (.028)∗∗∗ (.015)∗∗∗ (.018)∗∗∗ (.023)∗∗∗ (.022)∗∗∗
Obs. 79888 79791 235801 235552 235801 235552R2 -.002 .008 .026 .039 .028 .04
(1) (2) (3) (4) (5) (6)1(Higher Educ) -.048 -.061 -.046 -.058 -.029 -.045
(.049) (.048) (.042) (.041) (.053) (.053)
Const. .234 -.390 .238 -.376 .227 -.385(.031)∗∗∗ (.038)∗∗∗ (.029)∗∗∗ (.030)∗∗∗ (.041)∗∗∗ (.040)∗∗∗
Obs. 79888 79791 235801 235552 235801 235552R2 -.0009 .009 .027 .038 .028 .04
Party Affiliation(1) (2) (3) (4) (5) (6)
1(College) .0008 .0006 -.0006 -.0008 .002 .001(.003) (.003) (.003) (.003) (.003) (.003)
Const. .0006 -.012 .001 -.013 -.0009 -.015(.001) (.005)∗∗ (.001) (.003)∗∗∗ (.002) (.003)∗∗∗
Obs. 79888 79791 235801 235552 235801 235552R2 .00007 .001 -.00002 .001 -.0002 .001
(1) (2) (3) (4) (5) (6)1(Higher Educ) .001 .001 -.0009 -.001 .002 .002
(.005) (.005) (.004) (.004) (.005) (.005)
Const. .0001 -.012 .002 -.013 -.002 -.016(.003) (.006)∗∗ (.003) (.004)∗∗∗ (.004) (.005)∗∗∗
Obs. 79888 79791 235801 235552 235801 235552R2 -.0002 .0009 -.00003 .001 -.0007 .0006Covariates No Yes No Yes No Yes
Robust standard error in parenthesis.
31

Uppsala University, Spring 2013 Alex Solis
Table 7: First stages and reduced forms for registration to vote by income quintile.
Lineal Pol3 Pol4 Lineal Pol3 Pol4(1) (2) (3) (4) (5) (6)
First StageCollege Higher Education
1(T > τ) x q1 .200 .192 .198 .135 .136 .135(.008)∗∗∗ (.007)∗∗∗ (.008)∗∗∗ (.010)∗∗∗ (.008)∗∗∗ (.010)∗∗∗
1(T > τ) x q2 .170 .173 .166 .103 .110 .101(.013)∗∗∗ (.011)∗∗∗ (.014)∗∗∗ (.015)∗∗∗ (.013)∗∗∗ (.016)∗∗∗
1(T > τ) x q3 .165 .154 .162 .099 .114 .120(.017)∗∗∗ (.014)∗∗∗ (.017)∗∗∗ (.018)∗∗∗ (.016)∗∗∗ (.020)∗∗∗
1(T > τ) x q4 .070 .072 .066 .051 .064 .045(.019)∗∗∗ (.016)∗∗∗ (.020)∗∗∗ (.021)∗∗ (.018)∗∗∗ (.022)∗∗
1(T > τ) x q5 .033 .005 .024 .020 -.004 -.002(.022) (.018) (.022) (.024) (.020) (.025)
Obs. 87050 265606 265606 87050 265606 265606R2 .379 .622 .622 .583 .672 .672
Reduced FormVoting Registration Party Affiliation
1(T > τ) x q1 -.008 -.008 -.006 .0002 -.00008 .00004(.008) (.007) (.008) (.0008) (.0007) (.0008)
1(T > τ) x q2 -.002 -.001 .010 -.0003 -.0006 .0002(.012) (.011) (.013) (.001) (.001) (.001)
1(T > τ) x q3 .016 .012 .003 .0009 .001 .002(.015) (.013) (.016) (.002) (.001) (.002)
1(T > τ) x q4 -.025 -.022 -.021 -.0004 -.001 -.0009(.017) (.016) (.019) (.001) (.001) (.002)
1(T > τ) x q5 -.001 .018 .029 -.002 -.0005 -.0004(.019) (.017) (.020) (.002) (.002) (.003)
Obs. 87050 265606 265606 87050 265606 265606R2 .198 .267 .267 .002 .002 .002
Robust standard error in parenthesis. ***: p-value<1%, **: p-value<5, *: p-value<10%.
32

Uppsala University, Spring 2013 Alex Solis
Table 8: First stages and Reduced Forms for registration to vote and party affiliation
Lineal Pol3 Pol4 Lineal Pol3 Pol4(1) (2) (3) (4) (5) (6)
First StageCollege Higher Education
1(T > τ) x 1(male) .151 .147 .145 .097 .093 .092(.009)∗∗∗ (.006)∗∗∗ (.009)∗∗∗ (.010)∗∗∗ (.009)∗∗∗ (.011)∗∗∗
1(T > τ) x 1(female) .171 .166 .166 .112 .119 .114(.008)∗∗∗ (.007)∗∗∗ (.008)∗∗∗ (.009)∗∗∗ (.008)∗∗∗ (.009)∗∗∗
Obs. 87050 265606 265606 87050 265606 265606R2 .374 .617 .617 .582 .669 .669
Reduced FormVoting Registration Party Affiliation
1(T > τ) x 1(male) -.009 -.007 -.010 .001 .0005 .001(.008) (.007) (.009) (.0009) (.0008) (.001)
1(T > τ) x 1(female) -.003 -.0001 .006 -.0008 -.0005 -.0004(.007) (.006) (.008) (.0007) (.0006) (.0007)
Obs. 87050 265606 265606 87050 265606 265606R2 .198 .266 .266 .002 .002 .002
Robust standard error in parenthesis. ***: p-value<1%, **: p-value<5, *: p-value<10%.
33

Uppsala University, Spring 2013 Alex Solis
Table 9: Survey Balance of Covariates
Population Survey DifferenceLevel Jump Sd Level Jump Sd Level Sd(1) (2) (3) (4) (5) (6) (7) (8)
Income quintile 1.82 0.01 (0.02) 1.87 -0.03 (0.09) 0.04 (0.07)Self-reported income 1.28 -0.01 (0.01) 1.32 -0.05 (0.04) 0.04 (0.03)Mother years of Ed. 10.61 0.01 (0.05) 10.76 -0.03 (0.3) 0.15 (0.24)Father years of Ed. 10.60 -0.02 (0.06) 10.66 0.17 (0.35) 0.06 (0.28)1(Female) 0.59 0.01 (0.01) 0.64 -0.04 (0.04) 0.06 (0.03)*High School GPA 55.94 0.05 (0.06) 56.06 0.16 (0.36) 0.12 (0.28)Public School 0.48 0.01 (0.01) 0.54 -0.05 (0.04) 0.06 (0.03)*Voucher School 0.51 -0.01 (0.01) 0.44 0.06 (0.04) -0.07 (0.04)*Private School 0.01 0.00 (0.002) 0.02 -0.01 (0.01) 0.00 (0.01)Who Finance Studies 1.90 0.01 (0.02) 1.76 0.13 (0.13) -0.14 (0.1)1(Married) 0.01 0.00 (0.002) 0.00 0.02 (0.01)** -0.01 (0.01)1(Work) 0.08 0.00 (0.004) 0.07 0.01 (0.02) -0.01 (0.02)HH size 4.49 -0.02 (0.03) 4.68 0.03 (0.15) 0.19 (0.12)Mother in formal work 0.27 0.00 (0.01) 0.32 -0.02 (0.04) 0.04 (0.03)Father in formal work 0.51 0.01 (0.01) 0.55 -0.06 (0.04) 0.04 (0.03)Live with parents 1.72 0.00 (0.02) 1.66 0.00 (0.12) -0.06 (0.09)Will live out HH 0.23 0.00 (0.01) 0.19 0.02 (0.03) -0.04 (0.03)Expect aid to study 0.37 0.00 (0.003) 0.36 0.00 (0.04) 0.00 (0.03)Both parent live 0.77 0.01 (0.01) 0.77 0.01 (0.03) 0.00 (0.03)
34
Uppsala University, Spring 2013 Alex Solis
Table 10: First Stages for College and Higher Education. Specifications: Lineal (w=50) andpolynomial of 4th grade.
Lineal Poly 2nd Poly 3rd Poly 4thPanel A: College
(1) (2) (3) (4) (5) (6) (7) (8)1(T > τ) .182 .180 .209 .212 .192 .195 .184 .186
(.035)∗∗∗ (.037)∗∗∗ (.026)∗∗∗ (.028)∗∗∗ (.033)∗∗∗ (.035)∗∗∗ (.040)∗∗∗ (.042)∗∗∗
Const. .212 -.055 .223 -.028 .214 -.036 .210 -.038(.025)∗∗∗ (.095) (.021)∗∗∗ (.052) (.026)∗∗∗ (.056) (.031)∗∗∗ (.059)
Obs. 2657 2335 8450 7441 8450 7441 8450 7441R2 .121 .137 .297 .302 .297 .302 .298 .302
Panel B: Higher Education(1) (2) (3) (4) (5) (6) (7) (8)
1(T > τ) .118 .121 .122 .134 .136 .138 .141 .144(.039)∗∗∗ (.041)∗∗∗ (.030)∗∗∗ (.032)∗∗∗ (.039)∗∗∗ (.041)∗∗∗ (.046)∗∗∗ (.049)∗∗∗
Const. .549 .501 .557 .420 .539 .415 .524 .402(.031)∗∗∗ (.093)∗∗∗ (.027)∗∗∗ (.054)∗∗∗ (.034)∗∗∗ (.058)∗∗∗ (.040)∗∗∗ (.063)∗∗∗
Obs. 2657 2335 8450 7441 8450 7441 8450 7441R2 .036 .045 .109 .117 .109 .117 .109 .117Covariates No Yes No Yes No Yes No Yes
35

Uppsala University, Spring 2013 Alex Solis
Table 11: OLS regressions between different measures of political participation and knowledgeand College
No covariates With covariates(1) (2) (3) (4) (5) (6)
Dependent Variable Scale Level College t-test Level College t-testOfficially Registered to vote 1/0 0.25 0.06 (4.5)*** 0.21 0.06 (3.8)***Self reported registration to vote 1/0 0.26 0.06 (4.3)*** 0.28 0.06 (3.6)***Overreporting 1/0 0.02 0 (0) 0.07 0 (0.3)Affiliated to a political party 1/0 0.02 0.01 (1.3) 0.03 0.01 (1.7)*Political Knowledge test 1-14 to 0-1 0.53 0.03 (4.9)*** 0.52 0.02 (4)***Knows ministers and congress 1-9 to 0-1 0.63 0.02 (3.4)*** 0.61 0.02 (2.4)**Knows about electoral system 1-5 to 0-1 0.34 0.03 (5.8)*** 0.34 0.03 (5.5)***Is able to name senator 1/0 0.25 0.07 (5.1)*** 0.22 0.08 (5.1)***Is able to name representative 1/0 0.34 0.07 (4.8)*** 0.31 0.06 (4)***Is able to name Major 1/0 0.85 0.04 (3.5)*** 0.73 0.03 (3)***Likes politics 1-9 to 0-1 0.28 0.04 (5)*** 0.35 0.05 (5.3)***Democracy is the best 1-9 to 0-1 0.6 0.04 (4.9)*** 0.53 0.04 (4.1)***Knows candidates proposals 1-9 to 0-1 0.41 0.06 (6.1)*** 0.47 0.06 (6.2)***Reads politics on newspapers 1-9 to 0-1 0.27 0.04 (5.2)*** 0.29 0.04 (4.7)***Watch politics on TV 1-9 to 0-1 0.38 0.04 (4.8)*** 0.36 0.05 (4.9)***Educated are better rulers 1-9 to 0-1 0.44 0.03 (3.5)*** 0.33 0.02 (2.5)**Income should be more equitable 1-9 to 0-1 0.78 0.01 (1.6) 0.82 0.01 (2)**Taxes should be raised for equity 1-9 to 0-1 0.39 0.03 (2.9)*** 0.48 0.02 (2.5)**More State-own firms 1-9 to 0-1 0.55 0.03 (3.4)*** 0.58 0.03 (3.2)***Competition is good 1-9 to 0-1 0.64 -0.01 (-0.9) 0.64 -0.01 (-0.9)Women are better rulers 1-9 to 0-1 0.49 -0.01 (-0.9) 0.49 0 (-0.4)Particiapate in demostrations 1/0 0.45 0.11 (7.1)*** 0.37 0.1 (5.8)***in marchs 1/0 0.38 0.11 (7.6)*** 0.3 0.11 (6.6)***in occuping institutions 1/0 0.25 0.08 (5.5)*** 0.02 0.06 (4)***in Cacerolazo 1/0 0.13 0.04 (3.6)*** 0.15 0.04 (3.1)***in street protests 1/0 0.2 0.06 (5.1)*** 0.24 0.06 (4.1)***in political meetings 1/0 0.12 0.09 (7.9)*** 0.12 0.09 (6.9)***Other demostrations 1/0 0.07 0.02 (2.7)*** 0.11 0.02 (2.4)**Participate in civic organization 1/0 0.13 0.04 (3.6)*** 0.06 0.04 (3.1)***in board of neighbors 1/0 0.02 0.01 (1.5) 0.05 0.01 (1.3)in Sports club 1/0 0.02 0.01 (2.7)*** 0.04 0.02 (2.8)***in Student unions 1/0 0.03 0.02 (3.2)*** -0.05 0.01 (2)**in (Worker) Union 1/0 0.01 0 (-0.4) 0.03 0 (0.5)in Religious Group 1/0 0.04 0.01 (1.2) -0.02 0 (0.6)in other 1/0 0.07 0.02 (2.6)** 0.06 0.02 (2.4)**
36

Uppsala University, Spring 2013 Alex Solis
Table 12: OLS regressions between different measures of political participation and knowledgeand Higher Education
No covariates With covariates(1) (2) (3) (4) (5) (6)
Dependent Variable Scale Level College t-test Level College t-testOfficially Registered to vote 1/0 0.26 0.03 (2)** 0.19 0.03 (1.9)*Self reported registration to vote 1/0 0.27 0.02 (1.5) 0.27 0.02 (1.3)Overreporting 1/0 0.02 0 (-0.6) 0.07 -0.01 (-1.1)Affiliated to a political party 1/0 0.02 0 (0.9) 0.03 0.01 (1.1)Political Knowledge test 1-14 to 0-1 0.54 0.01 (1.8)* 0.51 0.01 (0.9)Knows ministers and congress 1-9 to 0-1 0.64 0 (0.7) 0.61 0 (0)Knows about electoral system 1-5 to 0-1 0.34 0.02 (3.2)*** 0.33 0.01 (2.3)**Is able to name senator 1/0 0.26 0.04 (2.5)** 0.19 0.03 (2.2)**Is able to name representative 1/0 0.35 0.03 (1.8)* 0.3 0.01 (0.6)Is able to name Major 1/0 0.85 0.02 (2.1)** 0.72 0.02 (1.3)Likes politics 1-9 to 0-1 0.29 0.02 (2.1)** 0.34 0.02 (1.7)*Democracy is the best 1-9 to 0-1 0.61 0.02 (2.4)** 0.51 0.02 (2)**Knows candidates proposals 1-9 to 0-1 0.41 0.03 (3.3)*** 0.45 0.04 (3.5)***Reads politics on newspapers 1-9 to 0-1 0.27 0.03 (3.2)*** 0.27 0.03 (2.9)***Watch politics on TV 1-9 to 0-1 0.39 0.02 (2.5)** 0.34 0.03 (2.7)***Educated are better rulers 1-9 to 0-1 0.44 0.02 (2)* 0.32 0.02 (1.6)Income should be more equitable 1-9 to 0-1 0.79 0 (0.1) 0.82 0 (0.2)Taxes should be raised for equity 1-9 to 0-1 0.38 0.03 (3)*** 0.47 0.02 (2.1)**More State-own firms 1-9 to 0-1 0.56 0.01 (1.6) 0.58 0.01 (1)Competition is good 1-9 to 0-1 0.62 0.02 (2.2)** 0.64 0.02 (1.9)*Women are better rulers 1-9 to 0-1 0.5 -0.01 (-0.8) 0.49 0 (0.2)Particiapate in demostrations 1/0 0.48 0.03 (2.1)** 0.34 0.02 (1.2)in marchs 1/0 0.4 0.04 (2.5)** 0.28 0.03 (1.6)in occuping institutions 1/0 0.27 0.02 (1.2) 0.01 0.01 (0.4)in Cacerolazo 1/0 0.16 -0.01 (-0.5) 0.14 0 (-0.2)in street protests 1/0 0.21 0.02 (1.7)* 0.23 0.02 (1.4)in political meetings 1/0 0.14 0.04 (3.3)*** 0.09 0.03 (2.5)**Other demostrations 1/0 0.07 0.01 (1.7)* 0.1 0.01 (1.3)Participate in civic organization 1/0 0.14 0.02 (1.5) 0.05 0.01 (1)in board of neighbors 1/0 0.02 0.01 (1.3) 0.04 0.01 (1.1)in Sports club 1/0 0.02 0.01 (1.8)* 0.03 0.01 (1.8)*in Student unions 1/0 0.03 0.01 (1.8)* -0.05 0.01 (1)in (Worker) Union 1/0 0.01 0 (1) 0.03 0 (0.8)in Religious Group 1/0 0.05 0 (-0.2) -0.02 0 (-0.3)in other 1/0 0.07 0.01 (1.1) 0.05 0.01 (1)
37

Uppsala University, Spring 2013 Alex Solis
Table 13: Reduced forms. Specifications: Lineal (w=80) and polynomial of 4th grade.
Official Self-ReportedRegistration Registration Overreporting Misreporting
Lin Pol3 Lin Pol3 Lin Pol3 Lin Pol3(1) (2) (3) (4) (5) (6) (7) (8)
1(T > τ) .018 .006 .047 .034 .024 .020 .016 .011(.028) (.034) (.028)∗ (.034) (.008)∗∗∗ (.010)∗∗ (.011) (.014)
Const. .251 .258 .245 .250 .008 .009 .029 .031(.021)∗∗∗ (.028)∗∗∗ (.021)∗∗∗ (.028)∗∗∗ (.005) (.007) (.009)∗∗∗ (.012)∗∗∗
psu475-1 .0005 .001 .00004 .001 -.0004 .00007 -.0003 .0003(.0005) (.002) (.0005) (.002) (.0002)∗∗ (.0006) (.0002) (.0008)
m475psu-1 .00008 -.0008 .0002 -.0008 .00006 -.0004 -.00006 -.0006(.0006) (.002) (.0007) (.002) (.0002) (.0006) (.0003) (.0008)
psu475-2 .00002 .00003 1.00e-05 1.00e-05(.00002) (.00002) (1.00e-05) (1.00e-05)
m475psu-2 -1.00e-05 -.00002 -1.00e-05 -1.00e-05(.00002) (.00002) (1.00e-05) (1.00e-05)
psu475-3 7.25e-08 1.44e-07 7.74e-08 6.94e-08(7.51e-08) (8.23e-08)∗ (4.11e-08)∗ (4.48e-08)
m475psu-3 -9.04e-08 -1.63e-07 -7.91e-08 -7.09e-08(7.59e-08) (8.30e-08)∗∗ (4.12e-08)∗ (4.49e-08)
Obs. 4340 8450 4323 8422 4323 8422 4340 8450R2 .005 .028 .004 .023 .005 .012 .003 .007
38

Uppsala University, Spring 2013 Alex Solis
Table 14: IV estimations using college as instrument. Specifications: Lineal (w=80) and polyno-mial of 4th grade.
Official Self-ReportedRegistration Registration Overreporting Misreporting
Lin Pol3 Lin Pol3 Lin Pol3 Lin Pol3(1) (2) (3) (4) (5) (6) (7) (8)
College .090 .032 .227 .176 .117 .103 .076 .056(.135) (.179) (.138)∗ (.182) (.042)∗∗∗ (.054)∗ (.056) (.076)
Const. .231 .251 .196 .212 -.018 -.013 .012 .019(.048)∗∗∗ (.064)∗∗∗ (.049)∗∗∗ (.065)∗∗∗ (.014) (.018) (.020) (.027)
T − τ .0004 .001 -.0003 .0009 -.0006 -.00005 -.0004 .0002(.0007) (.002) (.0007) (.002) (.0002)∗∗∗ (.0007) (.0003) (.0009)
(T − τ) · 1(T > τ) -.0002 -.0009 -.0004 -.001 -.0003 -.0008 -.0003 -.0008(.0007) (.001) (.0007) (.002) (.0002) (.0006) (.0003) (.0007)
(T − τ)2 .00002 .00003 .00002 1.00e-05(.00002) (.00002) (1.00e-05) (1.00e-05)
(T − τ)2 · 1(T > τ) -1.00e-05 -.00002 -1.00e-05 -1.00e-05(.00002) (.00003) (1.00e-05) (1.00e-05)
(T − τ)3 7.40e-08 1.50e-07 8.13e-08 7.20e-08(7.13e-08) (8.18e-08)∗ (4.23e-08)∗ (4.38e-08)
(T − τ)3 · 1(T > τ) -9.25e-08 -1.73e-07 -8.50e-08 -7.45e-08(7.12e-08) (8.15e-08)∗∗ (4.20e-08)∗∗ (4.35e-08)∗
Obs. 4340 8450 4323 8422 4323 8422 4340 8450F statistic 7.371 37.781 5.312 30.286 5.317 5.04 3.582 4.316
39

Uppsala University, Spring 2013 Alex Solis
Table 15: IV estimations using higher education as instrument. Specifications: Lineal (w=80)and polynomial of 4th grade.
Official Self-ReportedRegistration Registration Overreporting Misreporting
Lin Pol3 Lin Pol3 Lin Pol3 Lin Pol3(1) (2) (3) (4) (5) (6) (7) (8)
Higher Education .149 .045 .382 .254 .196 .149 .125 .078(.228) (.253) (.249) (.272) (.084)∗∗ (.087)∗ (.099) (.110)
Const. .168 .234 .033 .112 -.101 -.072 -.041 -.011(.144) (.161) (.157) (.173) (.052)∗ (.054) (.062) (.070)
T − τ .0005 .001 -.0002 .001 -.0005 .0002 -.0004 .0003(.0006) (.001) (.0007) (.002) (.0003)∗∗ (.0007) (.0003) (.0008)
(T − τ) · 1(T > τ) -.0001 -.0009 -.0003 -.001 -.0002 -.0008 -.0002 -.0008(.0007) (.001) (.0007) (.002) (.0003) (.0007) (.0003) (.0007)
(T − τ)2 .00002 .00003 .00002 .00002(.00002) (.00002) (1.00e-05) (1.00e-05)
(T − τ)2 · 1(T > τ) -1.00e-05 -.00003 -.00002 -1.00e-05(.00002) (.00002) (1.00e-05) (1.00e-05)
(T − τ)3 7.70e-08 1.66e-07 9.03e-08 7.71e-08(6.62e-08) (8.32e-08)∗∗ (4.44e-08)∗∗ (4.23e-08)∗
(T − τ)3 · 1(T > τ) -9.50e-08 -1.86e-07 -9.25e-08 -7.88e-08(6.84e-08) (8.48e-08)∗∗ (4.46e-08)∗∗ (4.27e-08)∗
Obs. 4340 8450 4323 8422 4323 8422 4340 8450F statistic 7.235 37.574 4.658 28.361 4.239 4.656 3.375 4.25
40

Uppsala University, Spring 2013 Alex Solis
Table 16: Reduced Forms for other forms of participation, attitudes and political knowledge
Linear specificationPolitical Like informed Democracy Participate Particiapteknowledge politics proposals is best demostrations organization
(1) (2) (3) (4) (5) (6)1(T > τ) .013 .016 .022 .008 .031 -.031
(.012) (.017) (.019) (.018) (.032) (.023)
Const. .522 .262 .410 .612 .458 .173(.009)∗∗∗ (.014)∗∗∗ (.015)∗∗∗ (.014)∗∗∗ (.025)∗∗∗ (.018)∗∗∗
Obs. 4340 4325 4326 4307 4317 4317R2 .006 .009 .002 .013 .015 .002
3rd order polynomial specificationPolitical Like informed Democracy Participate Particiapteknowledge politics proposals is best demostrations organization
(1) (2) (3) (4) (5) (6)1(T > τ) .014 .026 .014 .025 .041 -.042
(.014) (.021) (.024) (.022) (.039) (.028)
Const. .523 .258 .419 .596 .456 .189(.012)∗∗∗ (.018)∗∗∗ (.020)∗∗∗ (.019)∗∗∗ (.033)∗∗∗ (.024)∗∗∗
Obs. 8450 8420 8420 8389 8410 8402R2 .026 .031 .002 .016 .038 .001
41

Uppsala University, Spring 2013 Alex Solis
9 Figures
Figure 1: Turnout around the world
Aut
Bra
Chl
FinFraIdn
Usa
.2.4
.6.8
1T
urno
ut
0 .2 .4 .6 .8 1% Pop in higher education
Turnout in the World
Turnout data from the International Institute for Democracy and Electoral Assistance (IDEA)and population on tertiary education from UNESCO Institute of Statistic Data Centre.
42

Uppsala University, Spring 2013 Alex Solis
Figure 2: RD for PSU scores frequency distribution.0
.002
.004
.006
.008
.01
PS
U S
core
Den
sity
200 400 600 800PSU score
PSU score Density Year = 2007 bw = 2
0.0
02.0
04.0
06.0
08.0
1P
SU
Sco
re D
ensi
ty
200 400 600 800PSU score
PSU score Density Year = 2008 bw = 2
0.0
02.0
04.0
06.0
08.0
1P
SU
Sco
re D
ensi
ty
200 400 600 800PSU score
PSU score Density Year = 2009 bw = 2
0.0
02.0
04.0
06.0
08.0
1P
SU
Sco
re D
ensi
ty
200 400 600 800PSU score
PSU score Density, All Years bw = 2
Note: Each dot represents the density of PSU scores in an interval of 2 points. The sample considers onlystudents who satisfy all requirements to be eligible for college loans and take the PSU immediately aftergraduating from high school.
Figure 3: Reduced Form. Registration to vote and in political party on scoring more than thecutoff (1(PSUi > 475))
0.1
.2.3
.4.5
.6.7
.8R
egis
tere
d to
vot
e
200 400 600 800PSU score
Registration to vote
.16
.18
.2.2
2.2
4R
egis
tere
d to
vot
e
420 440 460 480 500 520PSU score
Registration to vote
43
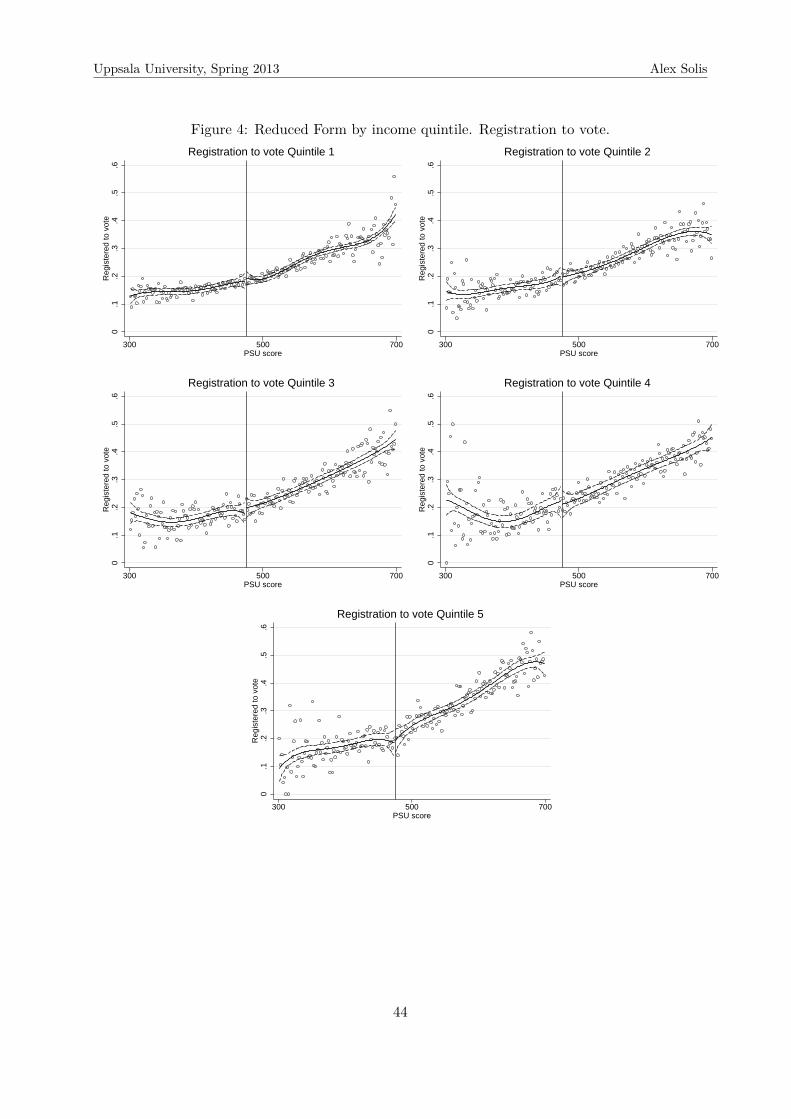
Uppsala University, Spring 2013 Alex Solis
Figure 4: Reduced Form by income quintile. Registration to vote.0
.1.2
.3.4
.5.6
Reg
iste
red
to v
ote
300 500 700PSU score
Registration to vote Quintile 1
0.1
.2.3
.4.5
.6R
egis
tere
d to
vot
e
300 500 700PSU score
Registration to vote Quintile 2
0.1
.2.3
.4.5
.6R
egis
tere
d to
vot
e
300 500 700PSU score
Registration to vote Quintile 3
0.1
.2.3
.4.5
.6R
egis
tere
d to
vot
e
300 500 700PSU score
Registration to vote Quintile 4
0.1
.2.3
.4.5
.6R
egis
tere
d to
vot
e
300 500 700PSU score
Registration to vote Quintile 5
44

Uppsala University, Spring 2013 Alex Solis
Figure 5: Reduced forms of the higher education measures.0
.2.4
.6.8
1P
r (H
ighe
r E
duca
tion
= 1
)
200 400 600 800PSU score
Pr (Higher Education = 1)
0.2
.4.6
.81
Pr
(Col
lege
= 1
)
200 400 600 800PSU score
Pr (College = 1)
45

Uppsala University, Spring 2013 Alex Solis
A Appendix: Survey
A.1 Invitation Email
• Subject: Survey Invitation
• Email Body:
Dear <first name>,We are a group of researchers from the Catholic University of Concepción, conducting astudy on the Chilean political participation and wanted to ask your help answering a briefquestionnaire that takes about 15 minutes.
In appreciation for your help, you will participate in the raffle of 2 iPads, 1 tablet HP and5 gift cards of 10 thousand pesos.
If you have questions do not hesitate to write to [email protected] or visit the websitewww.encuestapsu.cl
To answer the questionnaire, click on the following link<Personalized link>(If the link does not load, copy and paste it into the address bar)
Thank you and good luckThe researchersPS: You are contacted to this email because you registered it in the PSU process of the year200XIf you do not want to receive this type of emails, simply reply an email with the word“unsubscribe” in the subject. Sorry for the inconvenience.
A.2 Political Participation Survey
Page I. Participation in elections
• 1A. Will you vote in the next elections? Yes / No
• 1B. Were you registered to vote in the presidential election of December 2009?Yes / No
If Yes in 1B:
46

Uppsala University, Spring 2013 Alex Solis
– 1C. Did you vote in the first round? Yes / No / do not remember– 1D. Did you vote in the second round? Yes / No / do not remember– 1E. Did you vote to elect senators? Yes / No / do not remember– 1F. Did you vote to elect representatives? Yes / No / do not remember– 1G. Did you vote to elect mayor in your town? Yes / No / do not remember
Page II. Participation in elections
• If Yes in 1C: 2A. Who did you vote for in the first round?
Jorge Arrate / Marco Enríquez-Ominami / Sebastián Piñera / Eduardo Frei / Null / White/ I don’t want to answer
• If Yes in 1D: 2B. Who did you vote for in the second round?
Sebastián Piñera / Eduardo Frei / Null / White / I don’t want to answer
• If Yes in 1E, 1F, 1G: 2C. Do you remember who you voted for ...?
– ... In the election for senator Yes / No– ... In the election for deputy Yes / No– ... In the election for mayor Yes / No
• 2D. About the place you live in. Please Name ...
– ... a Senator from your district _______________ / not remember– ... a congressman in your district_______________/ not remember– ... the mayor of the municipality where you live _______________/ not re-
member
Page III. Participation
• 3. Are you enrolled in any political party? Yes / No
If Yes in 3.
47

Uppsala University, Spring 2013 Alex Solis
– 3B. Which one?
Party for Democracy / National Renewal / Christian Democracy / Communist Party /Independent Democratic Union / Socialist Party / Humanist Party / Other
• 4. Have you participated in any political demonstration (march, Building occupation,protest, etc.)? Yes / No
If Yes in 4.
– 4B. What kind of political demonstration has you participated? (Check all that apply)
a. Marchs / b. Occupying colleges or universities / c. Cacerolazo / d. Street Protest/ e. Political meetings / f. Other
• 5. Do you participate in any civic organization? Yes / No
If Yes in 5.
– 5B. What kind of organization? (Check all that apply)
a. Board of neighbors / b. Sports club / c. Student Unions / d. (Workers) Union / e.Religious Group / f. Other
Page IV. Elections
• 6A. How many years is there elections to choose ...?
– A) ... President?
3 years / 4 years / 5 years / 6 years / 7 years / 8 years / Do not know
– B) ... senators in your region?
3 years / 4 years / 5 years / 6 years / 7 years / 8 years / Do not know
– C) ... deputies in your district?
3 years / 4 years / 5 years / 6 years / 7 years / 8 years / Do not know
48

Uppsala University, Spring 2013 Alex Solis
• 6B. How many senators are elected in your senatorial district?
1 / 2 / 3 / 4 / 5 / Do not know
Page V. Do you Know (2/2)...
• 6D. What position is held by the person in the photograph?
a) President of the Chamber of Deputies
b) Foreign Minister
c) Chairman of the Senate
d) Minister of Finance
e) None of the above
• 6D. What position is held by the person in the photograph?
a) President of the Chamber of Deputies
b) Foreign Minister
c) Chairman of the Senate
d) Comptroller of the Republic
e) None of the above
Page VI. Do you Know (2/2)...
• 7A. Of the following people. Who are currently ministers in the government? (Check allthat are correct)
Carlos Larrain Peña / Alfredo Moreno Charme / Manuela De la Barra Hoffman / CristiánLarroulet Vignau / Andres Velasco Brañes / Harald Beyer Burgos / Felipe Bulnes Serrano/ Joaquín Lavín Infante
• 7B. On a scale of 1 to 9, please indicate how much do you agree with the following statements(1 = NEVER - 9 =ALWAYS)
49

Uppsala University, Spring 2013 Alex Solis
– I like to talk about politics with my friends: 1 - 2 - 3 - 4 - 5 - 6 - 7 - 8 - 9– Vote or not, I’m always informed on candidates’ proposals: 1 - 2 - 3 - 4 - 5 - 6 - 7 - 8 -
9– I follow politics reading the newspaper: 1 - 2 - 3 - 4 - 5 - 6 - 7 - 8 - 9– I follow politics watching the news on TV: 1 - 2 - 3 - 4 - 5 - 6 - 7 - 8 - 9
Page VII. Elections
• 8. On a scale of 1 to 9, indicate how much do you agree with the following statements: (1= Strongly Disagree - 9 =Strongly Agree)
– Democracy is the best system of government : 1 - 2 - 3 - 4 - 5 - 6 - 7 - 8 - 9– In general, Better educated people are better rulers: 1 - 2 - 3 - 4 - 5 - 6 - 7 - 8 - 9– People´s income should be more equitable: 1 - 2 - 3 - 4 - 5 - 6 - 7 - 8 - 9– Taxes should be raised to improve the country’s income distribution: 1 - 2 - 3 - 4 - 5 -
6 - 7 - 8 - 9– The number of State-own firms should be increased: 1 - 2 - 3 - 4 - 5 - 6 - 7 - 8 - 9– Competition is good, stimulates effort and new ideas: 1 - 2 - 3 - 4 - 5 - 6 - 7 - 8 - 9– In general, women are better leaders than men: 1 - 2 - 3 - 4 - 5 - 6 - 7 - 8 - 9
[Here questions no related with political participation survey were ommitted]
Page VIII. Study and work
• 17. Have you enrolled in a career in higher education? Yes / No
If No in 17:
– 17A. Why Not?
a. I don’t care studying / b. I didn’t reach the PSU score for the career I wanted / c.I’ll prepared to give back the PSU / d. I don’t have the financial means / e. I neededto work / f. Another reason
50

Uppsala University, Spring 2013 Alex Solis
If Yes in 17:
– 17A. What Program did you enrolled? (If you have enrolled several times, name themost recent)
Type of institution: ___ / Institution Name: ___ / Program Name: ___ / If yourcareer is not on the list, please click here
– 17B. Did you graduated from that program? Yes / No
∗ If No in 17B: 17C. Why didn’t you graduate?
a. I’m still studying / b. I changed program / c. I failed / d. I Freeze studies / e.I didn’t like it / f. I had to leave due to financial problems / g. Another reason
∗ If Yes in 17B: 17C. What year did you graduated on that program? 2008 20092010 2011 2012
Page XII. Study and work
• 18. Did you work while studying? Yes / No
If Yes in 18:
– 18A. How much did you earn monthly (approximate)?
a. 0 to 50 000 pesos / b. Between 50 000 and 100 000 / c. Between 100 000 and 200000 / d. Between 200 000 and 300 000 / e. More than 300 000
– 18B. How many months did you earned the previous amount? _______– 18C. What motivates (motivated) you to work while studying?
a. Meeting the needs of my family / b. To help with the Household expenses / c. Topay fees and tuition / d. To pay other expenses associated with the studies (the board,transportation, photocopying, books etc.) / e. For my entertainment / f. To knowwhat is to work / g. Another reason /
Page XIII. Labor Situation Today (Last Page)
51

Uppsala University, Spring 2013 Alex Solis
• 19. Are you working now? Yes / No
– 19A.WHAT IS YOURMONTHLY INCOME TODAY? Monthly Income $: ______(Enter only numbers and dots. Example: 600.000)
– If you prefer not to report your income, we offer the following:
a. 0, (I’m still a student) / b. Less than 182 000 (minimum wage) / c. Between 182000 and 300 000 / d. Between 300 000 and 500 000 / e. Between 500 000 and 700 000/ f. Between 700,000 and 1 million / g. Between 1 million and 1 million 300 thousand/ h. More than 1 million 300 thousand
[end of the survey]
52