Embed Size (px)
Citation preview
1
Does Health Insurance Coverage or Improved Quality Protect Better Against Out-of-
Pocket Payments? Experimental Evidence from the Philippines
Natascha Wagner1, Stella Quimbo2, Riti Shimkhada3, John Peabody4
Abstract
Using data from a randomized policy experiment in the Philippines, we found that
interventions to expand insurance coverage and improve provider quality both had an impact
on out-of-pocket payments. Compared to controls, interventions that expanded insurance and
provided performance-based provider payments to improve quality both resulted in a decline
in out-of-pocket spending (21 percent decline, p=0.072; and 24 percent decline, p=0.028,
respectively). With lower out-of-pocket payments for hospital care, monthly household
spending on personal hygiene rose by 0.9 and 0.6 US$ under the expanded insurance and
provider payment interventions, respectively, amounting to roughly a 40 to 60 percent
increase relative to the controls. With the current surge for health insurance expansion in
developing countries, our study suggests paying increased and possibly, equal attention to
supply-side interventions will have similar impacts with operational simplicity and greater
provider accountability.
Keywords: health insurance, health care quality, universal health care coverage, out-of-
pocket payments, RCT, Philippines
JEL: I11, I13, I15, O10
1 Economics of Sustainable Development. International Institute of Social Studies of Erasmus University Rotterdam, Kortenaerkade 12, 2518 AX The Hague, The Netherlands. 2 University of the Philippines, School of Economics, Diliman, Quezon City, Philippines. 3 QURE, UCLA, Fielding School of Public Health, Dept of Health Policy and Management 4 QURE, UCSF and UCLA
2
1. Introduction
Out-of-pocket payments for health care are still the major source of health care financing in
most developing countries. Such medical expenses have the potential to further increase the
burden of poverty with an estimated 150 million people who fall into poverty due to
catastrophic health care expenditures every year (McIntyre et al. 2006; van Doorslaer et al.
2006; Xu et al. 2007). To better protect against unexpected illness and unplanned health care
expenditures, a range of health sector financing reforms are implemented throughout
developing countries to protect poor households. These public policy interventions range from
the introduction of community-based health insurance (Jakab and Krishnan 2001; Smith and
Sulzbach 2008; Mebratie et al. 2014), health equity funds for the poor (Flores et al. 2011),
improved access to quality health care through set user fees (Litvack and Bodart 1993), or the
introduction of social health insurance programs for a large portion of the (so far uninsured)
population (Limwattananon et al. 2015; Sparrow et al. 2013b; King et al. 2009; Thornton et
al. 2010).
Yet, there is an important dearth in understanding and a lack of studies that contrast
the impact of demand-side, insurance-based reforms versus supply-side, provider payment
reforms. This adds to policy uncertainty over how best to provide financial protection to the
poor. In this study, we contrast a demand- and a supply-side intervention implemented in 30
public hospitals in the central regions of the Philippines to assess which one achieves a
greater reduction in out-of-pocket expenditures for incidences of child hospitalization. The
randomized health policy experiment, known as the Quality Improvement Demonstration
Study (QIDS), was conducted between 2003 and 2008. QIDS was a large-scale community
level intervention with a combined catchment area of an estimated one million households.
The 30 hospitals participating in the study were randomly assigned into a control site and two
different policy intervention sites, one expanding access to health insurance and the other
intervention incentivizing hospital staff through bonus payments. The overarching objective
of QIDS was to evaluate the effects of these policies on the health status of children, through
utilization and quality channels. The focus was on children who were hospitalized due to
pneumonia and diarrhea as these diseases are among the leading causes of morbidity and
mortality among Filipino children (Department of Health, 2011). Thus, large returns to these
conditions were expected since they do not reflect routine hospitalizations but urgent cases.
We estimate the impact of the QIDS demand-side insurance intervention compared to
the supply-side incentive intervention along five dimensions: (i) out-of-pocket payments for
hospital services, (ii) the costs of medical treatment that were incurred inside and outside the
3
hospital, and on (iii) household spending on disease prevention as captured by personal
hygiene, water and sanitation. To analyze overall expenditure patterns we further looked at
(iv) total household health expenditures independent of the incidence of hospitalization under
study and whether (v) there is reallocation of household spending on food, education and
durable goods with illness. This allows investigation of preventive care spending along with
the household expenditure pathway to health. Put differently, we can assess whether freed-up
household resources due to reduced out-of-pocket payments increase food consumption or
expenditures on health-related items such as toiletries, clean water and improved sanitation.
We implement a linear fixed effects and Poisson fixed effects model exploiting the
fact that we have two rounds of data from 2003 and 2008. Independent of the empirical
model, we show that both interventions reduced out-of-pocket payments for child
hospitalizations by at least 20 percent without any discernable statistical differences. We do
not find any evidence that consumption, education, or asset expenditures were affected. Yet,
monthly household spending on personal hygiene rose by 0.9 and 0.6 US$ under the
expanded insurance and provider payment interventions, respectively, amounting to roughly a
40 to 60 percent increase relative to the controls. Thus, our results suggest that supply-side
interventions can be as effective as demand-side interventions, at least in reducing out-of-
pocket payments.
The remainder of the paper is organized as follows. A brief literature review is
provided in Section 2. The project background and the experimental design are presented in
Section 3. Section 4 introduces the data by way of defining the variables and descriptive
statistics. Section 5 provides the empirical specifications, which make use of the linear fixed
effects and Poisson fixed effects model. Results are presented in Section 6. Section 7
summarizes the findings and presents policy conclusions.
2. Literature Review
Existing research indicates that health care financing reforms successfully increase access and
utilization of health care services (Hou et al. 2013; Limwattananon et al. 2015). Financial
protection—distinct from access—however, is not necessarily achieved by health care
financing reforms (Xu et al. 2007; Wagstaff and Lindelow 2008). While insurance expands
access, existing evidence does not unanimously demonstrate that these policies reduce out-of-
pocket payments; indeed, they may even increase health expenditures among the poor. In
Indonesia, while Health Insurance for the Poor (i.e., the Askeskin program) successfully
4
increased access to health care it also increased out-of-pocket spending for new insurees who
live in urban areas (Sparrow et al. 2013b). Likewise, the Chinese NCMS did not reduce out-
of-pocket payments, and in some cases even increased household spending (Lei and Lin 2009;
Liu and Tsegai 2011; Wagstaff et al. 2009; Zhou et al. 2009). Possible explanations for these
findings include overconsumption by the insured and overprovision of medical services by
providers who are reimbursed by the insurance on a fee-for-service basis (Liu et al. 1999;
Wagstaff and Lindelow 2008). Despite this mixed evidence, during the last decade, most
health policies to protect the poor have been insurance-based health reforms.
To determine if insurance confers financial protection, several factors need to be
considered. First, it needs to be determined what types of payments are affected by health
financing reforms: is it financial support intended to defray patients' out-of-pocket payments,
or to increase provider payments and hospital budgets? Second, what are the related out-of-
pocket expenditures for and what is their impact on other household payments including for
health-related goods such as water and sanitation as well as non-health items such as food,
transportation and education, and other consumption goods (Pannarunothai and Mills 1997;
Gustafsson and Li 2004)? If reduced out-of-pocket expenses are associated with increased
spending on food, then this would have implications for sustaining financial risk protection
even beyond the hospital admission because of the nutrition-health nexus. Third, how does
health insurance affect the pricing of health care? Following Gertler and Solon (2009),
another possible explanation for increased hospital spending accompanying expanded
insurance is insurance-based price discrimination or provider-initiated moral hazard.
Expanded insurance coverage makes demand more price inelastic. If health care providers
have market power, they can extract all additional insurance payments through increased
mark-ups or over-prescription and none of the insurance benefits accrue to the patients (Hsiao
2008; Yip and Hsiao 2009; Dutta and Husain 2012).
Beyond characterizing (the possible lack of) financial protection at the user level, there
is the complementing question of how financial risk protection may be achieved through
supply-side policy interventions, such as the provision of accessible care and incentivizing
better care. Established supply side policy interventions that provide direct care through
public facilities primarily rely on fee-for-service payments that either place the burden of
payment on the user or misalign the incentives of hospital staff due to inflexible public
repayment schemes (Ellis and McGuire 1993; McIntyre et al. 2006). Consequently, supply-
side interventions are not necessarily efficiency enhancing and tend to be neglected when
health care reforms are designed (Ellis and McGuire 1993; Smith and Sulzbach 2008). Newer
5
policy approaches, which hope to overcome the inadequacy of supply-side interventions,
incentivize providers to provide more or better care. The experience of Thailand’s 2001
healthcare reform, “30 Baht.” demonstrates that carefully designed supply-side interventions
can increase access and utilization of health care services among the poor, induce a switch
from private to public hospitals and reduce out-of-pocket payments (Gruber et al. 2014).
Indeed, there is evidence that higher quality care can reduce costs and thus, offer
protection against financial risks faced by patients. Using data from the QIDS experiment,
Peabody et al. (2010) found a U-shaped relationship between total costs and quality. At low
levels of initial quality, improved quality means a more rational amount of services prescribed
by physicians. This implies that doctors have better diagnostic skills, reduce unnecessary
medical prescriptions and tests, and aim at shortening the length of hospital stays.
Bodenheimer and Fernandez (2005) citing evidence from the U.S. argue for reducing costs
through improved quality or “error reduction.” To date, evidence from developing countries is
limited: In Rwanda, the effectiveness of pay-for-performance schemes in increasing the
quality of maternal care without inducing higher costs has been reported (Soeters et al. 2006).
The study by Soeters et al. found a 144 percent increase in institutional deliveries attended by
skilled health personnel that was accompanied by a decrease in out-of-pocket health
expenditures by 62 percent. In the QIDS experiment, improved quality was similarly achieved
through pay-for-performance payments to the hospital staff once predefined quality levels had
been reached (Peabody et al. 2011).
Yet to date, no study has compared the financial protection resulting from a demand-
and a supply-side intervention. To the best of our knowledge the randomized health policy
experiment, known as the Quality Improvement Demonstration Study (QIDS) is the first large
scale trial that allows us to compare out-of-pocket payments under an insurance and an
incentive scheme. Previous reports on this large social experiment established that the two
interventions both have significant health effects on the quality of hospital care and that these
quality improvements could be linked to better health outcomes (reduced wasting and
improved self-reported health ratings) among children 4-10 weeks after hospital discharge
(Quimbo et al. 2011; Peabody et al. 2013; Peabody et al. 2011; Peabody et al. 2012).
6
3. Background
3.1 Study setting and project background
In the Philippines, improving access to care has been a priority policy concern since the
Health Sector Reform Agenda was launched in 1999 under the leadership of then Health
Secretary Alberto Romualdez who did so through the National Health Insurance Program,
more commonly known as PhilHealth. PhilHealth's mandate is to provide universal health
insurance coverage. The most recent reports indicate that PhilHealth covers 88 percent of the
population (PhilHealth 2015). Yet, the actual coverage rate could be smaller based on other
national surveys. For example, the 2013 National Demographic and Health Survey indicates
that 60.3 percent of surveyed households had at least one household member covered by
PhilHealth further revealing that about 64% of the children with acute respiratory illness
receive medical treatment and, similarly, only about 53.4% of the poorest children with
symptoms of diarrhea get oral rehydration therapy (NDHS 2013).
In PhilHealth’s aim to provide financial protection to the poor, the insurer targets
selected population groups, i.e. the government-employees, indigent individuals, retirees, and
overseas workers. To afford more financial protection, among these groups, the insurance
premiums vary, for example, an average formally employed individual pays a premium of
3,370 pesos (≈ 76.5 US$)5 per person and year. This covers the individual, spouse, and
dependent children under 21 years old. Indigent individuals are sponsored by the national and
local governments, which pay PhilHealth premiums amounting to 2,400 pesos (≈ 54.4 US$)
per household and year. The basic benefit package primarily covers inpatient care and not
outpatient care or medications purchased outside of the hospital. Recently, to keep insurance
pay-outs down, in-patient reimbursements have been switched to what are called “case rates”
or bundled payments. When costs exceed the case rates for a given hospitalization in a private
health facility, patients and their families have to shoulder the difference in the form of out-
of-pocket payments.
PhilHealth finances only about 10 percent of the overall personal health care spending
in the Philippines (NSCB 2013). Despite expanding coverage and subsidized premiums aimed
towards the poor, the Philippine National Health Accounts (2011) indicate that out-of-pocket
expenditures remain the most dominant form of health-care financing, accounting for 52.7%
of total health-care expenditures in 2011 (NSCB 2013).
5 The peso-US$ conversions are based on the exchange rate of 0.0227, which was observed in January 2015.
7
3.2 QIDS Experimental Design and Sample Frame
The QIDS experiment, a 5-year project done jointly with PhilHealth, the Department of
Health, the University of the Philippines and the University of California San Francisco was
undertaken to potentially benefit an estimated one million households. Launched in 2001,
community level randomization was applied to 30 public hospitals that were organized into
matched blocks of three and randomly assigned to either one of two interventions and a
control group. The matching was done based on demand and supply characteristics of the
hospitals such as population, average household income, number of beds, average case load,
PhilHealth accreditation and insurance coverage of the households. The hospitals are
geographically dispersed, with some completely isolated because they are located on different
islands. Thus, spillovers between the experimental groups and the control groups were
minimized: it is also unlikely that households go to different hospitals for health care services
since this would entail even longer commuting time and higher transportation costs.
Two interventions were implemented and financed by PhilHealth. The first is a
demand-side intervention. It is known as the “Access” intervention and consisted of increased
enrollment of households in the PhilHealth program and zero copayments for PhilHealth-
covered children under 5 years when using services in the participating district hospitals. The
policy objective of the “Access” intervention was to increase existing PhilHealth coverage. A
novel method was used for expanding insurance enrollment in this intervention: medical
doctors were deployed as policy navigators and promoted PhilHealth enrollment through
regular one-on-one meetings with heads of local government units to rigorously and
systematically follow-up on PhilHealth premium sponsorships (Solon et al. 2009). The second
intervention targeted the supply side and is known as the “Bonus” intervention. It consisted of
a scheme for quality measurement with pay-for-performance. District hospital staff usually
received fixed salaries but under the “Bonus” intervention they could increase their incomes
with bonus payments once the hospital was assessed to have met preset quality standards.
These bonus payments were given quarterly from 2004 to 2007. Throughout this paper we
refer to the “Access” intervention as “intervention A” and the “Bonus” intervention as
“intervention B”. The hospitals in the control group, referred to as “C sites”, continued with
the existing policies and practices. The three types of randomly selected hospitals in A, B, and
C sites constitute the primary sampling unit for the evaluation of the QIDS interventions.
For the evaluation of the interventions data were collected at the facility and provider,
at patient exit and the household both before and after the two health policy reforms were
introduced. Data for this paper were obtained from two QIDS sources: (i) a patient exit survey
8
and (ii) a follow-home survey 4-6 weeks after the child patient was discharged from the
hospital. The patient exit and household surveys were conducted at baseline (2003/04) and at
the end of the project (2007/08). By the time the second follow-up survey commenced,
interventions had been in place for close to 2 years. The patient exit surveys were
administered among the parents of child patients up to the age of 5 years. A total of 6,042
children were surveyed. During the patient exit survey detailed information about the out-of-
pocket expenditures and those incurred inside and outside the hospital were collected. Among
the surveyed children, pneumonia and diarrhea patients were eligible for the follow home
survey. Altogether, 3,183 children were revisited at home of whom we have complete
information for 3,121 children.6 The follow home surveys in both rounds provided a detailed
socioeconomic profile of the household including information on spending patterns
independent of the child hospitalization.
4. Data
The sample consists of 3,121 household observations, each of which had a child-
patient in one of the 30 QIDS hospitals either at baseline in 2003/04 or at the follow-up in
2007/08. The observations are equally split across the three types of sites: In the A sites we
have information on 1,036 patients; B sites comprise 1,055 observations; and the remaining
1,030 patients frequented the C sites. In the first survey round, a total of 1,393 child patients
participated; the follow-up survey covered 1,728 patients.
Basic descriptive statistics illustrating the features of the sampled child patients and
their households are presented in Table 1. Of the total number of children 43.5 percent are
girls. The children are, on average, slightly older than one and a half years and stay 4 days in
the hospital. By design, the sample is equally split among pneumonia and diarrhea patients.
Every household has about six members on average and at least one child below the age of 14
for every working adult. On average, the households have a monthly per capita income of
1,054 pesos (≈ 23.9 US$). As the primary sampling unit for the randomization is hospitals, we
test for the balancing of the baseline child and household characteristics across the three
hospital groups. Comparing child and household characteristics at baseline for each of the
three cohorts, we find that the two intervention groups and the control site are comprised of
children with statistically similar characteristics at the 5 percent significance level in all the 27
comparisons. However, maternal education and per capita family income are slightly higher at
6 Lost child observations due to partly missing information amount to less than 2 percent of the overall sample.

9
baseline in the insurance expansion group compared to the control group (p-value=0.064 and
0.058, respectively). No significant differences are found for the pay-for-performance group.
Moreover, child characteristics such as age and gender and severity of disease are similar
across all three (intervention and control) groups. Household size is also similar across sites.
Yet, to account for child and household heterogeneity in the analysis, we jointly include these
variables as controls in our empirical model.
4.1 Outcome Variables
We assess five sets of spending outcomes: (i) out-of-pocket expenditures, (ii) expenditures
associated with the child hospitalization (incurred inside or outside a district hospital), (iii)
total household expenditures on health care (independent of the child hospitalization) (iv)
household expenditures associated with disease prevention such as water and sanitation as
well as (v) household expenditures on non-health items including food and other household
consumption expenditures. The five sets of outcome variables are all measured in terms of
pesos spent.
We define out-of-pocket payments as all direct outlays of cash that are incurred
because oft he child hospitalization under study. They include the total medical spending
associated with the hospitalization as well as transportation and food expenditures related to
the hospitalization. Concerning the costs incurred inside and outside the hospital we observe
the following. In the Philippines, like many developing countries, services and goods needed
by a patient may not be completely available within a single facility. Referrals to other
facilities, say, for diagnostic procedures or services of a specialist, are frequent. The same is
true for purchases of drugs, which can be done outside the hospital if the prescribed drugs are
not available in the hospital pharmacy. Poorly funded hospitals may not be equipped with
basic diagnostic machines such as x-rays and tend to have pharmacies that are not well
stocked. Arguably then, expanded insurance coverage, which means increased resources at
the hospital, would imply increased availability of goods and services and thus, the reduced
need for patients to purchase goods and services outside the hospital. Of course, there could
be other reasons for patients preferring to purchase goods and services outside the facility.
Prices inside the facility could be higher even with insurance or doctors could prescribe drugs
that are not available inside the hospital but rather in a pharmacy outside the hospital where
they have a financial interest (Peabody et al. 2009). Most insurance claims against PhilHealth
are, however, for purchases inside the hospital, rather than outside the hospital. Therefore, we
10
distinguish between two types of illness-related medical spending: those incurred inside and
outside the hospital.
The household-level consumption expenses that are not directly related to the child
hospitalization such as overall health expenditures, expenditures associated with disease
prevention and consumption expenditures are denoted in per capita and month terms. The
household health expenditures include drugs and medicines, hospital room charges, medical
and dental charges, and other medical goods and supplies. Our measure of spending on
disease prevention includes the following components: (i) toilet/bath soap, body deodorants,
lotion, tissue paper, (ii) drinking water, water used for bathing and washing and (iii) laundry
and laundry soap. We also study non-health related expenditures. Food consumption
expenditures include the consumption of beverages and are likely to be a lower bound of food
consumption as the majority of the households under study self-consume their own
production and only buy foodstuff on the market and report expenditures for food, which they
do not grow themselves. Education expenditures comprise matriculation fees, allowance for
family members studying away from home, as well as books and school supplies. Finally,
expenditures for durable goods comprise those for clothing, furnishing, dinnerware and house
maintenance.
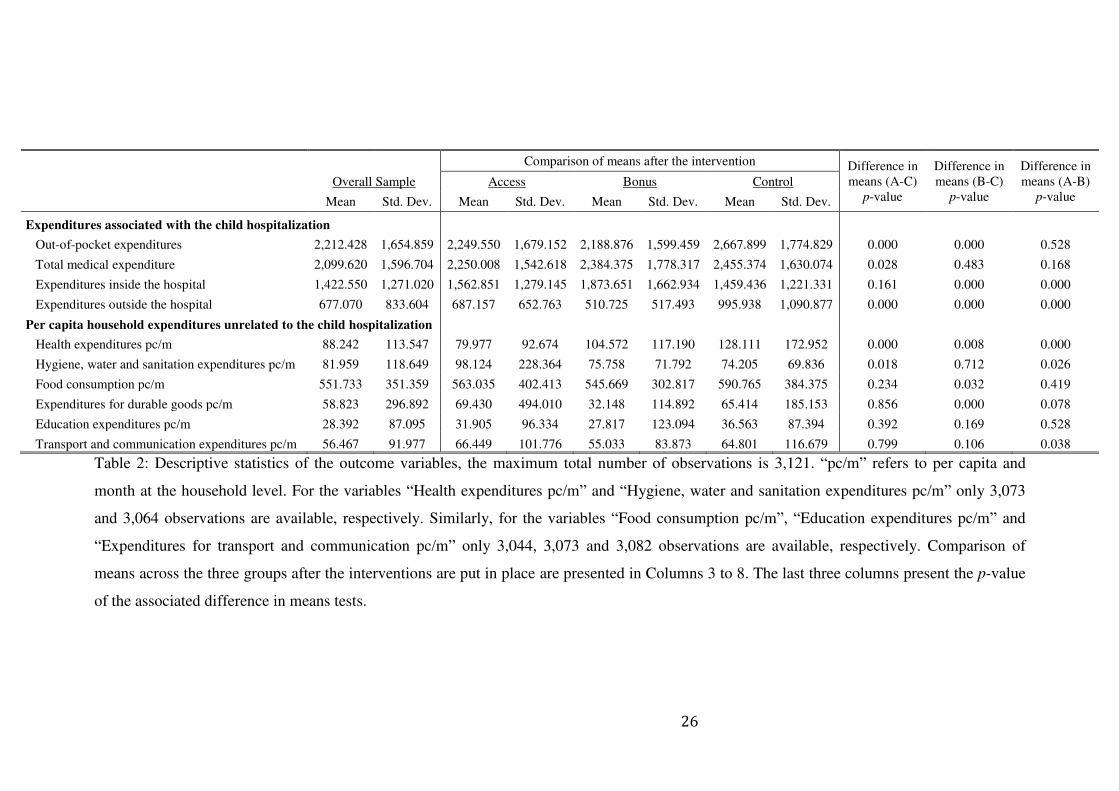
The descriptive statistics for the outcome variables show that out-of-pocket payments
for the hospitalization of the child patient amounted to 2,212 pesos (≈ 50.2 US$) on average
(See Table 2). Average out-of-pocket payments are slightly higher than total medical
spending associated with the hospitalization because the former also cover transportation and
food expenditures related to the hospitalization. Total spending is mainly made up of costs
incurred inside the hospital, an average of 1,422 pesos (≈ 32.3 US$). Expenditures for health
services used outside the hospital amount to an average of 677 pesos (≈ 15.4 US$). Since our
data refer to episodes of hospitalizations we are not concerned about zeros in out-of-pocket
expenditures.
Next, we turn to household level expenditures not including the costs of the
hospitalization of the child patient under study. Per capita health expenditures are 88 pesos (≈
2.0 US$), accounting for 8.6 percent of the total monthly expenditure per individual. We
observe that on average, per capita health expenditures are of similar range as the per capita
costs for toiletries, water and sanitation that amount to 82 pesos (≈ 1.9 US$). Taken together,
monthly health expenditures and those for personal hygiene make up for 16 percent of the
total monthly per capita expenditures. Relative to these 16 percent constituted by the regular
health care and preventive care spending, the out-of-pocket payments for the child
11
hospitalization amount to more than twice the monthly expenditures per household member.
We also looked at other expenditure groups in the household (see Table 2). Monthly
per capita expenditures for food consumption including beverages amount to 552 pesos (≈
12.5 US$). This rather moderate amount relative to overall costs is consistent with spending
by the poor who rely on home production (rather than market goods) to cover their basic
nutritional needs (Folbre, 1984; Bardhan and Udry, 1999; de Janvry and Sadoulet, 2002). The
poverty level of these households is further demonstrated by the low per capita spending for
education and durable goods such as clothing, furnishing, dinnerware and house maintenance,
amounting to 28 and 59 pesos (≈0.6 and 1.3 US$) on a per capita and month basis,
respectively. For comparison, per capita monthly costs for transport and communication
average about 56 pesos, which is similar to the amount for durable goods.
To assess the impact of the A and B interventions on outcome variables, we compared
the two treatment and the control groups after the implementation of the intervention testing
for differences in means (see Table 2). Three patterns stood out. First, the direct comparison
of means reveals that out-of-pocket payments are roughly 450 pesos (≈ 10.2 US$) lower in
both the A and B intervention sites compared to the controls. Second, the out-of-pocket
spending levels inside and outside of the hospital differ systematically across the three types
of sites. In the control sites, expenditures outside the hospital are significantly larger
(p=0.000) whereas patients in either intervention sites spend more on services inside the
hospital. The latter result is mainly driven by the B intervention. Third, overall health
expenditures at the household level are lower for families residing in the intervention sites
(p<0.01). However, these lower health expenditures do not seem to be linked to changes in
the expenditures for per capita monthly food consumption. Food consumption is on average,
at the same level for households residing in all three sites given a significance level of 1
percent. At the 5 percent significance level we fail to reject the equality of means in food
consumption for B and C sites. However, per capita monthly education expenditures and
those for transport and communication are identical when comparing average levels in the
two intervention areas with those in the control group. In summary, the descriptive analysis
points to: lower out-of-pocket payments and direct overall health expenditures, which are
derived from reduced expenditures incurred outside the hospital due to both interventions.
These lower out-of-pocket expenditures barely affect food spending in the households. This
may be due to home production of foodstuffs discussed above. Spending on education and
transportation is not affected.
12
5. Empirical Specification
A multivariate analysis is performed to identify the impact of the two QIDS interventions on
the identified expenditure categories. The effects of the two interventions are estimated in a
difference-in-difference specification that compares the changes in the costs of care in
intervention sites with the corresponding changes in control sites over the two rounds of data
collection. We employ a fixed effects model that allows us to control for the unobserved
heterogeneity at the hospital level such as location and stable regional conditions. We specify
the model in terms of its conditional mean:
E(Yiht|Aiht, Biht, Xjiht, λh) = α0 + α1 Aiht + α2 Biht + ∑j θj Xjiht+ λh (1)
The variable Yiht represents the household spending on health care for child i in
hospital h and period t as measured by any of the following: total out-of-pocket payments for
the child hospitalization; total expenditures for this single hospital admission (or decomposed
into those incurred inside or outside the hospital); total household expenditures for health
care; and household expenditures for disease prevention and expenses that are not health-
related.
We aim at identifying the impact of the two treatment variables α1 and α2 for the A
intervention Aiht and the B intervention Biht, respectively. C sites Ciht constitute the excluded
category. The model is completed by individual child, mother and household characteristics,
which are confounding factors. These variables are collected in the vector Xjiht and contain the
child’s age and gender, duration of stay at the hospital and diagnosis, maternal education, per
capita household income, household size and composition. We opted for this particular set of
covariates to make the empirical specification comparable to other studies that analyze the
impact of QIDS on quality of care and health outcomes (Quimbo et al. 2011; Peabody et al.,
2011; Peabody et al. 2012). The hospital specific fixed effect is captured by λh. We allow the
error term to be clustered across individuals that are treated at the same hospital.
If the two interventions reduce health care spending, we expect the coefficient
estimates associated with the access (Aiht) and bonus (Biht) treatment to be negative and
statistically significant. If health insurance and high quality of care protect households from
financial risks, we expect that households with either access to health insurance or hospitals
that offer incentives for improved quality should incur less out-of-pocket payments. We
expect similar reductions for expenditures incurred outside the hospital, to the extent that
increased insurance payments or incentives for higher quality care result in better-equipped
13
hospitals. With reduced out-of-pocket payments for health care, households can then increase
their spending on other goods, possibly, those that prevent disease (such as water and
sanitation) and other consumption goods such as food or education.
While the linear fixed effects model is our benchmark model, we also employ a fixed
effects Poisson model with cluster-bootstrapped standard errors as robustness test. The
Poisson model better encompasses our expenditure variables, which do not follow a normal
distribution but are censored at zero and skewed to the right due to some severe cases where
large health spending occurred (Sparrow et al. 2013a). Although our dependent variables are
not count data in the strict sense, the Poisson model has shown to be well suited for consistent
estimation in the context of health costs (Buntin and Zaslavsky, 2004). An important
advantage of the Poisson model is that it can be directly applied to the raw data without
imposing a transformation (Mihaylova et al., 2011). For consistent estimation we only have to
impose that the conditional mean is correctly specified (Manning and Mullahy, 2001;
Wooldridge, 2002). The conditional mean, therefore, is defined as follows:
E(Yiht|Aiht, Biht, Xjiht, λh) = exp(β0 + β1 Aiht + β2 Biht + ∑j θj Xjiht+ λh) (2)
where the variables are the same as described above and we aim at estimating the coefficients
β1 and β2 that are associated with the two treatments.
6. Results
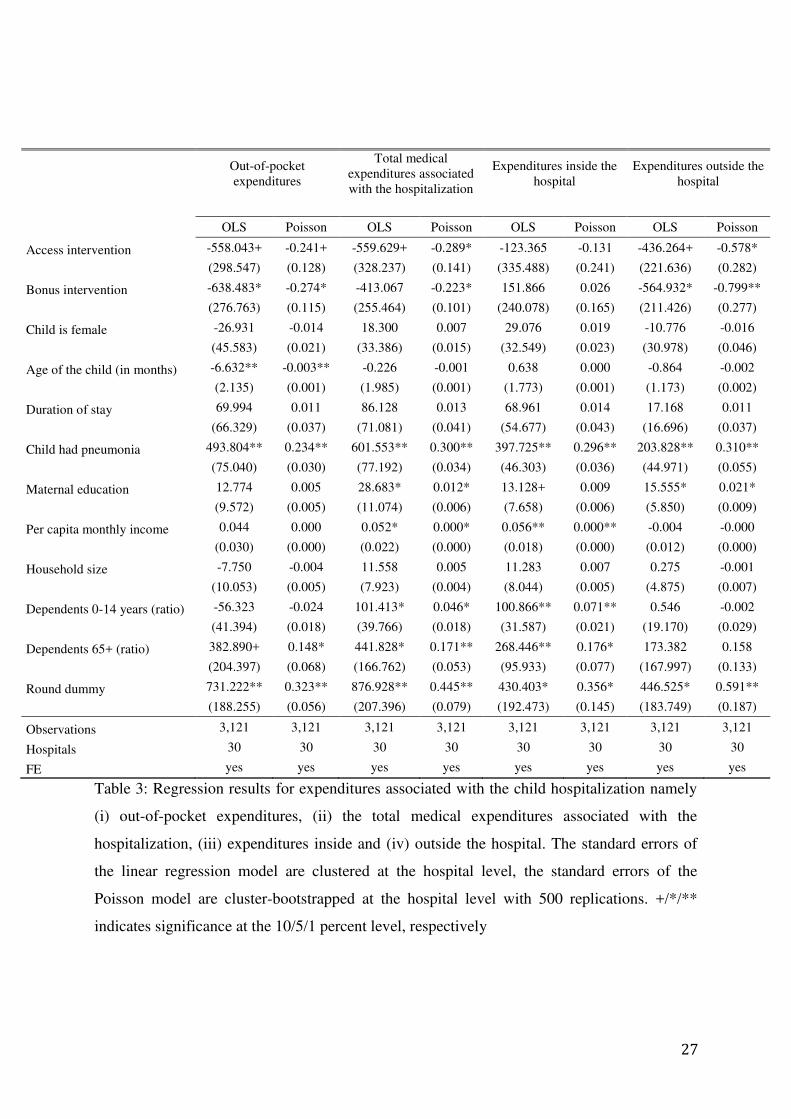
The findings from the linear fixed effects model show that intervention A reduces out-
of-pocket payments by 558 pesos (≈ 12.7 US$). Intervention B, which appears to be more
effective, reduces out-of-pocket payments on average by 638 pesos (≈ 14.5 US$) compared to
C sites. Interestingly, the coefficient estimates associated with Interventions A compared to
Intervention B are not statistically different from each other indicating that both interventions
are similarly effective in reducing out-of-pocket payments (p-value=0.781) (See Table 3).
These fixed-effects estimates are consistent with the Poisson regression results (Table
3, Column 2). While the magnitude of the coefficient estimates from the Poisson model is not
directly comparable with that of the linear model, we observe a similar statistically significant
and negative relationship between the two interventions and out-of-pocket payments.
Calculating the incidence rate ratio, which is obtained by applying the exponential function to
the Poisson coefficient (=exp(coefficient)), we see that the out-of-pocket payments are lower
(<1) for patients residing in the intervention areas. For intervention A, the incidence rate ratio
14
is 0.79 (=exp(–0.241)) indicating that expanded health insurance reduces out-of-pocket
payments by 21 percent ((1 – 0.79)*100; p=0.066). Intervention B reduces out-of-pocket
payments by about 24 percent (=(1 – exp(–0.274))*100; p=0.017). We note that the
magnitudes of the Poisson incidence rate ratios are in line with the coefficient estimates from
the linear model and the average out-of-pocket spending across the three sites (See Table 2).
Comparing the average out-of-pocket payments of 2,212 pesos (≈ 50.2 US$) to the reduction
in out-of-pocket payments of 558 pesos (≈ 12.7 US$) induced by intervention A, this
corresponds to a 30 percent decline in out-of-pocket spending. The reduction of 638 pesos (≈
14.5 US$) in out-of-pocket payments for intervention B corresponds to a 29 percent decline
relative to the average out-of-pocket expenditures. In sum, we present evidence that in the
Philippines out-of-pocket spending declined due to increased insurance coverage. Second, we
show that provider-based incentives leading to increased hospital quality can similarly reduce
the economic burden of out-of-pocket spending for poor households.
The total medical spending resulting from the child hospitalization is also lower in
intervention areas with the point estimates significant at 9.6 and 10.5 percent for interventions
A and B, respectively. From the Poisson regressions, we obtain more precise estimates
confirming that patients who utilized intervention A and B hospitals face lower overall
expenditures. Although we cannot determine which intervention is overall less costly because
the coefficient estimates are statistically identical (p-value= 0.637), we can say that the QIDS
supply side intervention, which improves the quality of care through a pay-for-performance
scheme, reduces out-of-pocket and total medical spending as much as the expanded health
insurance policy.
To further disentangle the effects on out-of-pocket payments, we separately looked at
expenditures incurred inside and outside the hospital. Results show that the reductions in
expenditures are driven by lower expenditures outside the hospital (See Table 3, Columns 3 to
8). Spending inside the hospital is not significantly affected by the interventions; the
coefficient associated with intervention A is negative (p=0.696) whereas the coefficient
associated with intervention B is positive (p=0. 573). It is not possible to say, from this
analysis, whether this suggests that there is increased utilization of hospital services or
increased hospital charges due to possible moral hazard on the part of the patient or the
provider, respectively, or perhaps due to previous unmet needs that are now met, given more
financial resources.
However, expenditures incurred outside the hospital decrease by 436 pesos (≈ 9.9
US$) for intervention A and 565 pesos (≈ 12.8 US$) for intervention B. Consistent with the
15
findings for out-of-pocket payments, outside hospital expenditures are similarly affected by
the two interventions. The coefficient estimates associated with interventions A and B are
similar (p=0.436). Further support for this finding comes again from the Poisson model. For
intervention A, we observe an incidence rate ratio of 0.56 (=exp(–0.578)) indicating that
expanded health insurance decreased outside hospital expenditures by 44 percent (=(1 –
0.56)*100). Similarly, for intervention B outside hospital expenditures decrease by 55 percent
(=(1 – exp(–0.799))*100). Again, the coefficient estimates are not significantly different
from each other (p=0.441). We note that this reduction in outside hospital spending could
suggest a reduction in demand as more services are now directly utilized within the hospital.
The combined findings about inside and outside hospital expenditures clarify that the two
interventions did not increase inside hospital spending but concomitantly reduced
expenditures outside the hospital.
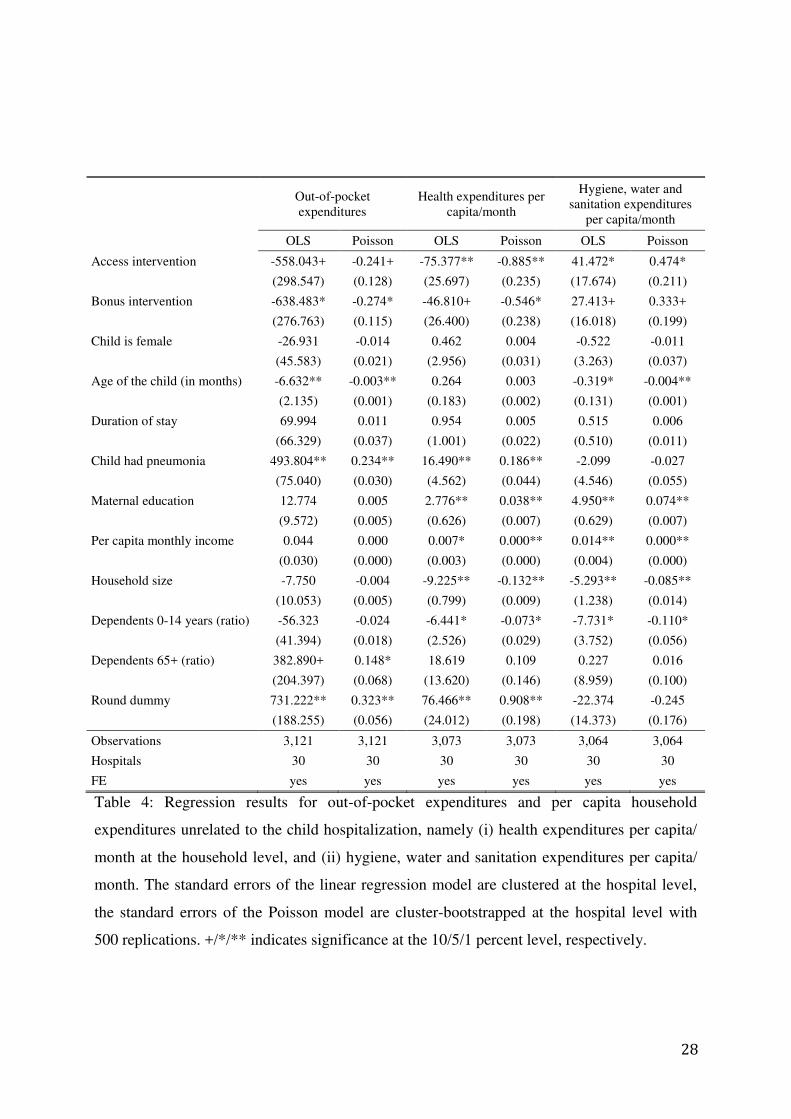
Finally, we examined to what extent the reduced out-of-pocket payments resulting
from intervention A and B induced changes in other household expenditures. We find that per
capita health expenditures that are not linked to the hospitalization under study are lower in
intervention sites (See Table 4, Columns 3 and 4). Expanded insurance reduces per capita
monthly health expenditures by 75 pesos (≈ 1.7 US$) compared with the bonus intervention,
which reduces per capita health expenditures by 47 pesos per month (≈ 1.1 US$). This
difference is statistically significant at the 10 percent level (p=0.056). Again, the Poisson
model supports these results and indicates a reduction in overall out-of-pocket expenditures
by almost 60 percent as a consequence of Intervention A. Intervention B similarly reduces
out-of-pocket expenditures namely by 42 percent. The results are statistically different
indicating a larger protection by the expanded insurance mechanism (p=0.047).7
We also looked at the impacts of the expanded insurance and pay-for-performance on
spending on goods that are associated with disease prevention, which is measured as the
combined costs for toiletries, water and sanitation (See Table 4, Columns 5 and 6). We find
that households benefitting from interventions A and B spend more on personal hygiene with
per capita monthly spending on these products rising by 41 (≈ 0.9 US$) and 27 pesos (≈ 0.6
US$), respectively. While these increases in spending on hygiene appear small, in our study
sites they are sufficient to purchase additional clean water. Moreover, they are measured on a
monthly per capita basis and thus represent a substantial improvement for poor and
marginalized households. With an incidence rate ratio between 1.40 and 1.61, the Poisson
7 The impact of intervention A is calculated based on the coefficient estimates reported in Column 4 of Table 3: (1–exp(–0.885))*100. Similarly the impact of intervention B is derived as (1-exp(-0.546))*100.
16
model confirms these findings revealing that the expanded health insurance intervention and
the quality-performance intervention increase spending on water and hygiene and
underscoring that these increases amount to roughly a 40 to 60 percent increase in hygiene
spending relative to the control group. The results are statistically significant at the 10 percent
level and equality of the coefficient estimates cannot be rejected (p-value=0.341) indicating
that interventions A and B similarly trigger a resource reallocation towards preventive care. In
light of the analyzed diseases, namely diarrhea and pneumonia the results on personal hygiene
spending are of particular interest. Diarrhea is a water-related disease that is most common for
individuals who do not have access to clean water for drinking, cooking and personal hygiene.
Similarly, the immune system of children drinking low quality water is impaired making
severe conditions such as pneumonia more likely to develop.
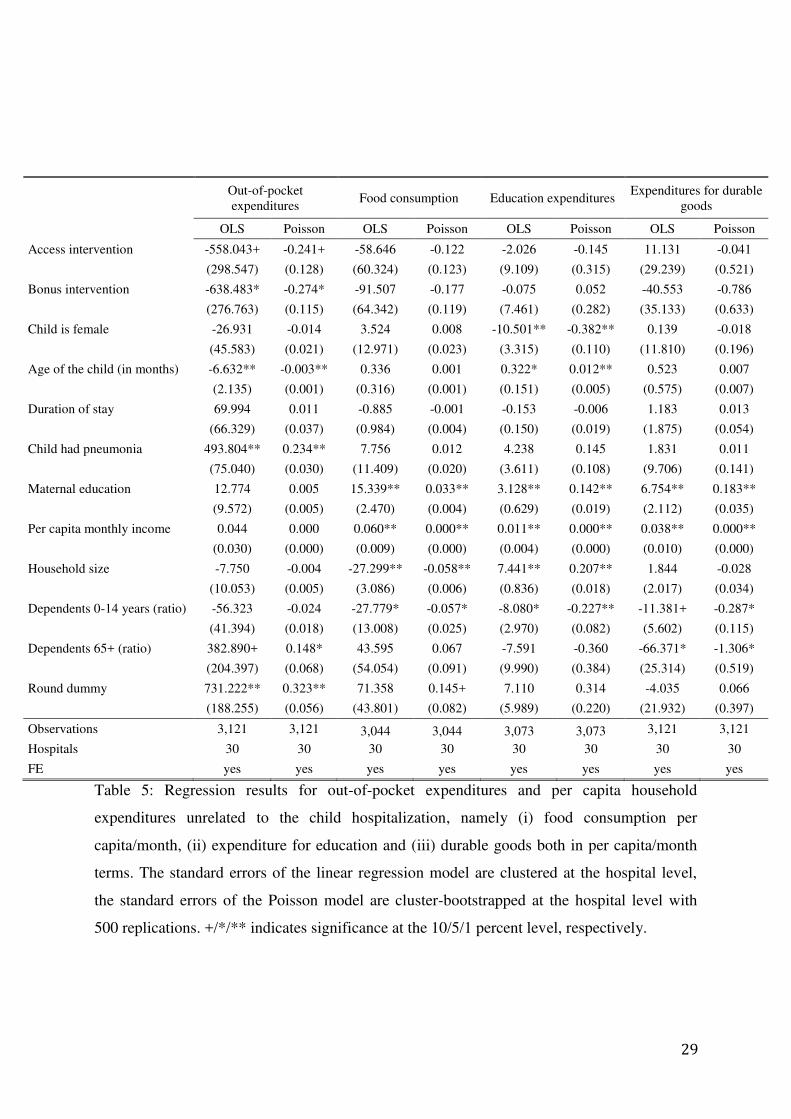
We further considered the impact of the interventions on household expenditures for
items such as food consumption, education, and durable goods (See Table 5). Across
specifications and expenditure categories we do not find significant intervention effects. Thus,
the freed up resources from reduced out-of-pocket payments do not appear to be re-allocated
to these other expenditure groups. Thus, we do not find any impact on spending on
consumption goods, instead, a reallocation between preventive and curative care.
Concerning the role of covariates in the empirical specifications, we observe the
expected patterns. The gender of the child patient does not influence the amounts spent on
hospital care. However, the age variable expectedly shows that there are higher out-of-pocket
payments made for younger children. The treatment of pneumonia is more costly than
diarrhea (excluded category). While household size and composition have negligible impacts
on the out-of-pocket expenditures in the acute case, the larger the household the lower per
capita spending on health and preventive health care. Similarly, the more young dependents
there are in the household, the lower the per capita health care expenditures. Expectedly,
maternal education increases investments in health and prevention, as does income.
Overall, our results clearly show that the insurance as well as the bonus intervention
are expenditure-reducing for the patient in both the short- and long-run, as out-of-pocket
payments decline, less outside hospital expenditures are incurred, and resources are freed up
for preventive health care. These findings hint at new avenues for inclusive health care and
financial protection of the poor in developing countries—while demand side interventions to
reduce financial burden appear to be more familiar in the current debate about inclusive
public health care schemes, supply side interventions such as QIDS’ bonus scheme have the
important advantage that targeting providers is easier than households.
17
We note two potential limitations of our study. First, we only establish policy impacts
for those children who are sick and admitted to a hospital. We argue, however, that our
interventions potentially benefited the population at large. Intervention A was carried out by
medical doctors who acted as policy navigators. They were deployed to convince the leaders
of the municipality about the benefits of health insurance for their populations and in
particular, their vulnerable population. Intervention B was directly implemented in the
hospitals but the bonus scheme targeted all patient types (whether insured or not, regardless of
illness).
Second, we focus our analysis exclusively on children with diarrhea and pneumonia.
These are severe conditions among children and the leading causes of morbidity and mortality
(see Section 3). Thus, results can be easily generalized to the treatment of these conditions
among child patients in other developing countries, in particular to sub-Sahara Africa were
diarrhea and pneumonia among children are even more prevalent. The World Health
Organization and UNICEF acknowledge that diarrhea and pneumonia are the two leading
causes of preventable child death and have put in place an integrated global action plan and a
working group to end child death from these conditions by 2025 (WHO and UNICEF 2013).
Our research contributes to these efforts. We abstain from drawing conclusions for the adult
population but observe that children are the most vulnerable and out-of-pocket expenditures
related to bad conditions in children are a burden that affects the entire household.
7. Conclusion
The QIDS experiment provided a unique opportunity to contrast the effectiveness of a
demand- and supply-side intervention in providing financial risk protection to poor
households for instances of child hospitalization. Both the expanded insurance and quality
incentive intervention groups had lower out-of-pocket payments compared to the controls.
There was a 21 percent decline in out-of-pocket spending (p=0.072) due to intervention A and
a 24 percent decline in out-of-pocket spending (p=0.028) due to intervention B with no
statistical difference between intervention A and B. Similarly, total medical expenditures
were lower in intervention areas compared to controls and not different between intervention
sites. These reductions in medical expenditures were driven by lower expenditures outside the
hospital (no differences seen in inside hospital expenditures comparing interventions to
control). The considerable reductions in total medical resulting from the two interventions
18
suggest that all services can be obtained inside the hospitals without incurring additional out-
of-pocket payments outside the hospital.
Moreover, intervention households reported lower overall curative health expenditures
over the preceding six months indicating that the households may be more aware of
preventive measures and more inclined to employ preventive care when they are financially
protected against adverse health events. This was further supported by increased spending on
preventive health care as captured by purchase of clean water and hygiene-related
expenditures. Although, we do not find any significant changes in food expenditures, nor are
expenditures for education and durable goods affected, the redistribution of resources
suggests that freed-up household resources due to reduced out-of-pocket payments may have
long-term implications on household health as households seem to spend these resources on
health goods that prevent infectious diseases, namely, water, sanitation, and toiletry articles.
The implications of this study are important since health care expenditures continue to
contribute to poverty across the world (van Doorslaer et al. 2006, Xu et al., 2007). Coping
mechanisms, which help households deal with the costs of illness, are strikingly similar across
countries: households rely on intra-household reallocations, loans and the sale of productive
assets and buffer stocks. In Burkina Faso, for example, households cope with medical
expenses by selling livestock and with the labor loss by intra-household labor substitution
(Sauerborn et al. 1996). With illness, a household's economic burden is exacerbated because
the loss of productive assets reduces the household’s resilience to risk and the substituted
labor cannot fully replace the ill member as production losses mount. In Thailand, when
households face a disease episode and resulting health expenditures, they are able to smooth
consumption, and avoid pecuniary debt by drawing on buffers such as savings and liquidating
assets (Sparrow et al. 2013a). Both cases exemplify the huge economic burden faced by the
poor when incurring health care expenditures. Therefore, it is high time to assess and compare
effective social policies to mitigate further impoverishment of poor and marginalized
households in developing countries.
One of the biggest advantages of the study at hand is the ability to experimentally
compare two different social policy interventions to protect the poor from high health care
expenditures. Interestingly, we found similar impacts from both the demand- and the supply-
side health care intervention with no significant differences between the two policies. As
hypothesized, the insurance scheme reduced out-of-pocket payments. The finding highlights
that it is possible to implement health insurance reforms in developing countries that lead to
increased financial protection of the insured. This is a particularly important finding as
19
existing research about out-of-pocket payments shows that health insurance does not
necessarily lead to lower health spending at the household level due to moral hazard by the
doctors and hospitals (Dutta and Husain, 2012; Yip and Hsiao, 2009; Hsiao, 2008). In
addition, we also find evidence indicating that insurance-based health reforms are not the only
way to financially protect patients in developing countries. It appears that improved quality
due to provider-based incentives also protects households from the financial risk of illness. It
appears that the QIDS pay-for-performance scheme improved the clinical skills of doctors
thereby reducing unnecessary prescriptions of drugs and medical tests and thus reducing out-
of-pocket payments. The quality intervention, by reducing spending outside the hospital,
arguably, also increases hospital accountability for service and health outcomes. The pathway
for the provider-based intervention is improved quality for in and outpatient care.
With both interventions implemented and financed by the National Health Insurance
Program, the study at hand challenges the current surge for health insurance expansion in
developing countries and suggests paying increased and possibly, equal attention to supply-
side interventions will have similar impacts with operational simplicity and greater provider
accountability.
We hope that an improved understanding of the impacts of both demand-side,
insurance-based reforms and supply-side, provider payment reforms helps quell the
uncertainty over how to provide financial protection to the poor.
Acknowledgments
The Quality Improvement Demonstration Study was funded by the US National Institutes for
Child Health and Human Development through an R01 grant (HD042117). We thank Zelalem
Yilma Debebe for helpful comments and suggestion.
References
Akin, John S., David K. Guilkey and E. Hazel Denton. 1995. Quality of services and demand
for health care in Nigeria: A multinomial probit estimation. Social Science &
Medicine 40(11): 1527–1537.
Bardhan, P. and C. Udry. 1999. Development Microeconomics. Oxford University Press:
Oxford.

20
Bodenheimer, Thomas, Alicia Fernandez. 2005. High and Rising Health Care Costs. Part 4:
Can Costs Be Controlled While Preserving Quality? Annals of Internal Medicine,
143(1):26–31.
Buntin, Melinda Beeuwkes and Alan M. Zaslavsky. 2004. Too much ado about two-part
models and transformation? Comparing methods of modeling Medicare expenditures.
Journal of Health Economics 23(3): 525–542.
Cebu Study Team. 1992. A child health production function estimated from longitudinal data.
Journal of Development Economics 38(2): 323–351.
de Janvry, Alain and Elisabeth Sadoulet. 2002. World Poverty and the Role of Agricultural
Technology: Direct and Indirect Effects. Journal of Development Studies 38(4): 1-26.
Department of Health. 2011. Ten (10) Leading Causes of Child Mortality By Age-Group (1-4,
5-9, 10-14) & Sex, Philippines, 2009.
http://www.doh.gov.ph/kp/statistics/child_mortality.html. Date accessed: May 5,
2014.
Dutta, Mousumi, Zakir Husain. 2012. Use of hospital services and socio-economic status in
urban India: Does health insurance ensure equitable outcomes? MPRA Paper No.
40055.
Eichler, Rena, Paul Auxila, Uder Antoine, Bernateau Desmangles. 2007. Performance-Based
Incentives for Health: Six Years of Results from Supply-Side Programs in Haiti, CGD
Working Paper N° 121.
Ellis, Randall P. and Thomas G. McGuire. 1993. Supply-Side and Demand-Side Cost
Sharing in Health Care. Journal of Economic Perspectives 7(4): 135-151.
Flores, Gabriela, Por Ir, Chean R. Men, Owen O’Donnell, Eddy Van Doorslaer. 2013.
Financial Protection of Patients through Compensation of Providers: The Impact of
Health Equity Funds in Cambodia. Journal of Health Economics 32(6): 1180–1193.
Folbre, Nancy. 1984. Household Production in the Philippines: A Non-Neoclassical
Approach. Economic Development and Cultural Change 32(2): 303-330.
Gertler, Paul and Solon Orville. 2000. Who Benefits From Social Health Insurance in
Developing Countries? Working Paper.
Grossman, Michael. 1972. On the Concept of Health Capital and the Demand for Health.
Journal of Political Economy 80(2): 223–255.
Gruber, Jonathan, Nathaniel Hendren, Robert M. Townsend. 2014. The Great Equalizer:
Health Care Access and Infant Mortality in Thailand. American Economic Journal:
Applied Economics 6(1): 91–107.
21
Gustafsson, Björn and Shi Li. 2004. Expenditures on education and health care and
poverty in rural China. China Economic Review 15: 292–301.
Hsiao, William. 2008. When Incentives And Professionalism Collide. Health Affairs 27(4):
949–951.
Hou, Zhiyuan, Ellen Van de Poel, Eddy Van Doorslaer, Baorong Yu and Qingyue Me. 2013.
Effects of NCMS coverage on access to care and financial protection in China. Health
Economics.
Jakab, Melitta and Chitra Krishnan. 2001. Community Involvement in Health Care Financing:
Impact, Strengths and weaknesses–A Synthesis of Literature, Discussion paper for
WHO Commission on Macroeconomic and Health. Washington, DC: World Bank.
King, Gary, Emmanuela Gakidou, Kosuke Imai, Jason Lakin, Ryan T Moore, Clayton Nall,
Nirmala Ravishankar, Manett Vargas, Martha María Téllez-Rojo, Juan Eugenio
Hernández Ávila, Mauricio Hernández Ávila, Héctor Hernández Llamas. 2009. Public
policy for the poor? A randomised assessment of the Mexican universal health
insurance programme. The Lancet 373: 1447–1454.
Lei, Xiaoyan, Wanchuan Lin. 2009. The New Cooperative Medical Scheme in rural China:
Does more coverage mean more service and better health? Health Economics 18(S2):
S25–S46.
Lieberman, Samuel, James Capuno, Hoang Van Minh. 2005. Decentralizing Health: Lessons
from Indonesia, The Philippines and Vietnam, in East Asia Decentralizes: Making
Local Governments Work. Washington DC: The International Bank for
Reconstruction and Development / The World Bank.
Limwattananon, Supon, Sven Neelsen, Owen O'Donnell, Phusit Prakongsai, Viroj
Tangcharoensathien, Eddy van Doorslaer and Vuthiphan Vongmongkol. 2015.
Universal coverage with supply-side reform: The impact on medical expenditure risk
and utilization in Thailand. Journal of Public Economics 121: 79-94.
Litvack, Jennie I., Claude Bodart. 1993. User fees plus quality equals improved access to
health care: Results of a field experiment in Cameroon. Social Science & Medicine
37(3): 369–383.
Liu, Gordon G., Renhua Cai, Zhongyun Zhao, Peter Yuen, Xianjun Xiong, Shumarry Chao,
Boqing Wang. 1999. Urban health care reform initiative in China: findings from its
pilot experiment in Zhenjiang City. International Journal of Economic Development
1(4): 504–525.
Liu, Dan, Daniel W. Tsegai. 2011. The New Cooperative Medical Scheme (NCMS) and its
22
implications for access to health care and medical expenditure: Evidence from rural
China. ZEF -- Discussion Papers on Development Policy No.155.
Manning, Willard G. and John Mullahy. 2001. Estimating log models: to transform or not to
transform? Journal of Health Economics 20 (4): 461–494.
McIntyre, Diane, Michael Thiede, Göran Dahlgren and Margaret Whitehead. 2006. What are
the economic consequences for households of illness and of paying for health care in
low- and middle-income country contexts? Social Science & Medicine 62(4): 858–
865.
Mebratie, Anagaw, Robert A. Sparrow, Zelalem Y. Debebe, Degnet Abebaw Ejigie, Getnet
Alemu, Arjun S. Bedi. 2015. The impact of Ethiopia’s pilot community based health
insurance scheme on healthcare utilization and cost of care. ISS Working Paper 593,
1-46.
Mihaylova B, Briggs A, O'Hagan A, Thompson S. 2011. Review of statistical methods for
analyzing health care resources and costs. Health Economics 20(8): 897–916.
NDHS. 2013. Philippines 2013 National Demographic and Health Survey -- Key Findings.
NSCB. 2013. Philippine National Health Accounts 2005-2011. National Statistics
Coordination Board (NSCB).
Pannarunothai, S. and A. Mills. 1997. The poor pay more: health-related inequality in
Thailand. Social Science and Medicine 44(12): 1781-90.
Peabody, James, Orville Solon, Stella Quimbo, Kara Hanson. 2009. An Unhealthy Public
Private Tension: The Impact of Physician Pharmacy Ownership on Prescribing
Practices and Patient Spending, Health Affairs 28(4):1022–1033
Peabody, John, Jhiedon Florentino, Riti Shimkhada, Orville Solon, and Stella Quimbo. 2010.
Quality Variation and its Impact on Costs and Satisfaction: Evidence From the QIDS
Study. Medical Care 48(1): 25–30.
Peabody, John, Riti Shimkhada, Stella Quimbo, Jhiedon Florentino, Marife Bacate, Charles
McCulloch and Orville Solon. 2011. Financial Incentives and Measurement Improved
Physicians’ Quality of Care in the Philippines. Health Affairs 30(4): 773–781.
Peabody, John, Riti Shimkhada, Stella Quimbo, Orville Solon, Xylee Javier, and Charles
McCulloch. 2012. Linkage between measurement, incentive payments and health
outcomes: Data from an experiment in the Philippines.
Peabody, John, Riti Shimkhada, Stella Quimbo, Orville Solon, Xylee Javier, Charles
McCulloch. 2013. The impact of performance incentives on health outcomes: results
from a cluster randomized controlled trial in the Philippines. Health Policy and
23
Planning 2013: 1–7.
PhilHealth 2015. 1st Semester 2015 Stats and Charts,
http://www.philhealth.gov.ph/about_us/statsncharts/snc2015_1st.pdf
Quimbo, Stella, John Peabody, Riti Shimkhada, Orville Solon, Jhiedon Florentino. 2011.
Evidence of a Causal Link between Health Outcomes, Insurance Coverage and a
Policy to Expand Access: Experimental Data from Children in the Philippines. Health
Economics. 20(5): 620–630.
Quimbo, Stella, Natascha Wagner, Jhiedon Florentino, Orville Solon and John Peabody.
2014. Do Health Reforms To Improve Quality Have Long-term Effects? Results of a
Follow-up on a Randomized Policy Experiment in the Philippines. Working Paper.
Sauerborn, R., A. Adams and M. Hien. 1996. Household strategies to cope with the economic
costs of illness. Social Science & Medicine 43(3): 291–301.
Smith, K and S. Sulzbach. 2008. Community-based health insurance and access to maternal
health services: evidence from three West African countries. Social Science and
Medicine 66 (12): 2460–2473.
Soeters, Robert, Christian Habineza,Peter Bob Peerenboom. 2006. Performance-based
financing and changing the district health system: experience from Rwanda, Bulletin
of the World Health Organization, 84(11): 884–889.
Solon, Orville, John Peabody, K. Woo, Stella Quimbo, Jhiedon Florentino and Riti
Shimkhada. 2009. “An evaluation of the cost-effectiveness of policy navigators to
improve access to care for poor in the Philippines,” Health Policy, 92(1): 89-95.
Sparrow, Robert, Ellen Van de Poel, Gracia Hadiwidjaja, Athia Yumna, Nila Warda, Asep
Suryahadi. 2013a. Coping with the economic consequences of ill health in Indonesia.
Health Economics.
Sparrow, Robert, Asep Suryahadi, Wenefrida Widyanti. 2013b. Social Health Insurance for
the Poor: Targeting and Impact of Indonesia's Askeskin Program. Social Science &
Medicine, 96: 264–271.
Thornton, Rebecca L., Laurel E. Hatt, Erica M. Field, Mursaleena Islam, Freddy Solís Diaz,
Martha Azucena González. 2010. Social security health insurance for the informal
sector in Nicaragua: a randomized evaluation. Health Economics. 19 (Issue
Suplmenent 1): 181–206.
UNICEF and WHO. 2013. Ending Preventable Child Deaths from Pneumonia and Diarrhoea
by 2025 - The integrated Global Action Plan for Pneumonia and Diarrhoea (GAPPD).
WHO Press, Geneva.
24
United Nations. United Nations Millennium Development Goals website, retrieved 13 March
2014 http://www.un.org/millenniumgoals/bkgd.shtml.
van Doorslaer, Eddy, Owen O'Donnell, Ravi P. Rannan-Eliya, Aparnaa Somanathan, Shiva
Raj Adhikari, Charu C. Garg, Deni Harbianto, Alejandro N. Herrin, Mohammed
Nazmul Huq, Shamsia Ibragimova, Anup Karan, Chiu Wan Ng, Badri Raj Pande,
Rachel Racelis, Sihai Tao, Keith Tin, Kanjana Tisayaticom, Laksono Trisnantoro,
Chitpranee Vasavid, Yuxin Zhao. 2006. Effect of payments for health care on poverty
estimates in 11 countries in Asia: an analysis of household survey data. The Lancet
368(9544): 1357-1364.
Wagstaff, Adam, Magnus Lindelow. 2008. Can insurance increase financial risk? The curious
case of health insurance in China. Journal of Health Economics 27 (4): 990–1005.
Wagstaff, Adam, Magnus Lindelow, Gao Jun, Xu Ling, Qian Juncheng. 2009. Extending
health insurance to the rural population: An impact evaluation of China's new
cooperative medical scheme. Journal of Health Economics 28(1): 1-19.
WHO, UNICEF. 2013. Ending Preventable Child Deaths from Pneumonia
and Diarrhoea by 2025 -- The integrated Global Action Plan for Pneumonia and
Diarrhoea (GAPPD).
Wooldridge, Jeffrey. 2002. Econometric Analysis of Cross Section and Panel Data. MIT
Press: Cambridge.
Xu, Ke, David B. Evans, Guido Carrin, Ana Mylena Aguilar-Rivera, Philip Musgrove and
Timothy Evans. 2007. Protecting Households From Catastrophic Health Spending.
Health Affairs 26(4): 972-983.
Yip, Winnie, William Hsiao. 2009. China's health care reform: A tentative assessment. China
Economic Review 20(4): 613–619.
Zhou, Zhongliang, Jianmin Gao, Qinxiang Xue, Xiaowei Yang, Ju'e Yan. 2009. Effects of
Rural Mutual Health Care on outpatient service utilization in Chinese village medical
institutions: evidence from panel data. Health Economics 18(S2): S129-S136.
Appendix: Table

25
Table 1: Descriptive statistics of control variables, the total number of observations is 3,121. Balancing of baseline characteristics across the two
interventions and the control group are presented in Columns 3 to 8. The last three columns present the p-value of the associated difference in
means tests. The number of baseline observations in Access/Bonus/Control are 447/479/467 child patients, respectively.
Baseline characteristics Difference
in means (A-C)
p-value
Difference in means
(B-C) p-value
Difference in means
(A-B) p-value
Overall Sample Access Bonus Control
Mean Std. Dev. Mean Std. Dev. Mean Std. Dev. Mean Std. Dev.
Dependents 0-14 years (ratio) 1.178 0.636 1.175 0.605 1.149 0.579 1.173 0.657 0.952 0.550 0.494
Dependents 65+ (ratio) 0.046 0.141 0.048 0.130 0.036 0.103 0.048 0.157 0.980 0.149 0.111
Duration of stay 4.306 3.640 4.251 1.803 4.200 2.054 4.094 1.969 0.211 0.417 0.694
Child had pneumonia 0.494 0.500 0.472 0.500 0.501 0.501 0.497 0.501 0.455 0.896 0.378
Child had diarrhea 0.506 0. 500 0.528 0.500 0.499 0.501 0.503 0.501 0.455 0.896 0.378
Child is female 0.435 0.496 0.412 0.493 0.445 0.497 0.430 0.496 0.566 0.659 0.311
Age of the child (in months) 19.930 12.282 19.978 12.810 19.367 12.079 19.916 12.586 0.942 0.494 0.456
Maternal education 8.841 3.219 8.975 3.167 8.846 3.324 8.576 3.340 0.064 0.214 0.544
Per capita monthly income 1,054.819 1,360.710 1,048.707 1,023.989 999.141 1,065.924 890.948 1,444.100 0.058 0.189 0.471
Household size 5.790 2.197 5.727 2.308 5.816 2.301 5.668 2.098 0.686 0.301 0.556
26
Comparison of means after the intervention Difference in means (A-C)
p-value
Difference in means (B-C)
p-value
Difference in means (A-B)
p-value Overall Sample Access Bonus Control
Mean Std. Dev. Mean Std. Dev. Mean Std. Dev. Mean Std. Dev.
Expenditures associated with the child hospitalization
Out-of-pocket expenditures 2,212.428 1,654.859 2,249.550 1,679.152 2,188.876 1,599.459 2,667.899 1,774.829 0.000 0.000 0.528
Total medical expenditure 2,099.620 1,596.704 2,250.008 1,542.618 2,384.375 1,778.317 2,455.374 1,630.074 0.028 0.483 0.168
Expenditures inside the hospital 1,422.550 1,271.020 1,562.851 1,279.145 1,873.651 1,662.934 1,459.436 1,221.331 0.161 0.000 0.000
Expenditures outside the hospital 677.070 833.604 687.157 652.763 510.725 517.493 995.938 1,090.877 0.000 0.000 0.000
Per capita household expenditures unrelated to the child hospitalization
Health expenditures pc/m 88.242 113.547 79.977 92.674 104.572 117.190 128.111 172.952 0.000 0.008 0.000
Hygiene, water and sanitation expenditures pc/m 81.959 118.649 98.124 228.364 75.758 71.792 74.205 69.836 0.018 0.712 0.026
Food consumption pc/m 551.733 351.359 563.035 402.413 545.669 302.817 590.765 384.375 0.234 0.032 0.419
Expenditures for durable goods pc/m 58.823 296.892 69.430 494.010 32.148 114.892 65.414 185.153 0.856 0.000 0.078
Education expenditures pc/m 28.392 87.095 31.905 96.334 27.817 123.094 36.563 87.394 0.392 0.169 0.528
Transport and communication expenditures pc/m 56.467 91.977 66.449 101.776 55.033 83.873 64.801 116.679 0.799 0.106 0.038
Table 2: Descriptive statistics of the outcome variables, the maximum total number of observations is 3,121. “pc/m” refers to per capita and
month at the household level. For the variables “Health expenditures pc/m” and “Hygiene, water and sanitation expenditures pc/m” only 3,073
and 3,064 observations are available, respectively. Similarly, for the variables “Food consumption pc/m”, “Education expenditures pc/m” and
“Expenditures for transport and communication pc/m” only 3,044, 3,073 and 3,082 observations are available, respectively. Comparison of
means across the three groups after the interventions are put in place are presented in Columns 3 to 8. The last three columns present the p-value
of the associated difference in means tests.
27
Out-of-pocket expenditures
Total medical expenditures associated with the hospitalization
Expenditures inside the hospital
Expenditures outside the hospital
OLS Poisson OLS Poisson OLS Poisson OLS Poisson
Access intervention -558.043+ -0.241+ -559.629+ -0.289* -123.365 -0.131 -436.264+ -0.578*
(298.547) (0.128) (328.237) (0.141) (335.488) (0.241) (221.636) (0.282)
Bonus intervention -638.483* -0.274* -413.067 -0.223* 151.866 0.026 -564.932* -0.799**
(276.763) (0.115) (255.464) (0.101) (240.078) (0.165) (211.426) (0.277)
Child is female -26.931 -0.014 18.300 0.007 29.076 0.019 -10.776 -0.016
(45.583) (0.021) (33.386) (0.015) (32.549) (0.023) (30.978) (0.046)
Age of the child (in months) -6.632** -0.003** -0.226 -0.001 0.638 0.000 -0.864 -0.002
(2.135) (0.001) (1.985) (0.001) (1.773) (0.001) (1.173) (0.002)
Duration of stay 69.994 0.011 86.128 0.013 68.961 0.014 17.168 0.011
(66.329) (0.037) (71.081) (0.041) (54.677) (0.043) (16.696) (0.037)
Child had pneumonia 493.804** 0.234** 601.553** 0.300** 397.725** 0.296** 203.828** 0.310**
(75.040) (0.030) (77.192) (0.034) (46.303) (0.036) (44.971) (0.055)
Maternal education 12.774 0.005 28.683* 0.012* 13.128+ 0.009 15.555* 0.021*
(9.572) (0.005) (11.074) (0.006) (7.658) (0.006) (5.850) (0.009)
Per capita monthly income 0.044 0.000 0.052* 0.000* 0.056** 0.000** -0.004 -0.000
(0.030) (0.000) (0.022) (0.000) (0.018) (0.000) (0.012) (0.000)
Household size -7.750 -0.004 11.558 0.005 11.283 0.007 0.275 -0.001
(10.053) (0.005) (7.923) (0.004) (8.044) (0.005) (4.875) (0.007)
Dependents 0-14 years (ratio) -56.323 -0.024 101.413* 0.046* 100.866** 0.071** 0.546 -0.002
(41.394) (0.018) (39.766) (0.018) (31.587) (0.021) (19.170) (0.029)
Dependents 65+ (ratio) 382.890+ 0.148* 441.828* 0.171** 268.446** 0.176* 173.382 0.158
(204.397) (0.068) (166.762) (0.053) (95.933) (0.077) (167.997) (0.133)
Round dummy 731.222** 0.323** 876.928** 0.445** 430.403* 0.356* 446.525* 0.591**
(188.255) (0.056) (207.396) (0.079) (192.473) (0.145) (183.749) (0.187)
Observations 3,121 3,121 3,121 3,121 3,121 3,121 3,121 3,121
Hospitals 30 30 30 30 30 30 30 30
FE yes yes yes yes yes yes yes yes
Table 3: Regression results for expenditures associated with the child hospitalization namely
(i) out-of-pocket expenditures, (ii) the total medical expenditures associated with the
hospitalization, (iii) expenditures inside and (iv) outside the hospital. The standard errors of
the linear regression model are clustered at the hospital level, the standard errors of the
Poisson model are cluster-bootstrapped at the hospital level with 500 replications. +/*/**
indicates significance at the 10/5/1 percent level, respectively
28
Out-of-pocket expenditures
Health expenditures per capita/month
Hygiene, water and sanitation expenditures
per capita/month
OLS Poisson OLS Poisson OLS Poisson
Access intervention -558.043+ -0.241+ -75.377** -0.885** 41.472* 0.474*
(298.547) (0.128) (25.697) (0.235) (17.674) (0.211)
Bonus intervention -638.483* -0.274* -46.810+ -0.546* 27.413+ 0.333+
(276.763) (0.115) (26.400) (0.238) (16.018) (0.199)
Child is female -26.931 -0.014 0.462 0.004 -0.522 -0.011
(45.583) (0.021) (2.956) (0.031) (3.263) (0.037)
Age of the child (in months) -6.632** -0.003** 0.264 0.003 -0.319* -0.004**
(2.135) (0.001) (0.183) (0.002) (0.131) (0.001)
Duration of stay 69.994 0.011 0.954 0.005 0.515 0.006
(66.329) (0.037) (1.001) (0.022) (0.510) (0.011)
Child had pneumonia 493.804** 0.234** 16.490** 0.186** -2.099 -0.027
(75.040) (0.030) (4.562) (0.044) (4.546) (0.055)
Maternal education 12.774 0.005 2.776** 0.038** 4.950** 0.074**
(9.572) (0.005) (0.626) (0.007) (0.629) (0.007)
Per capita monthly income 0.044 0.000 0.007* 0.000** 0.014** 0.000**
(0.030) (0.000) (0.003) (0.000) (0.004) (0.000)
Household size -7.750 -0.004 -9.225** -0.132** -5.293** -0.085**
(10.053) (0.005) (0.799) (0.009) (1.238) (0.014)
Dependents 0-14 years (ratio) -56.323 -0.024 -6.441* -0.073* -7.731* -0.110*
(41.394) (0.018) (2.526) (0.029) (3.752) (0.056)
Dependents 65+ (ratio) 382.890+ 0.148* 18.619 0.109 0.227 0.016
(204.397) (0.068) (13.620) (0.146) (8.959) (0.100)
Round dummy 731.222** 0.323** 76.466** 0.908** -22.374 -0.245
(188.255) (0.056) (24.012) (0.198) (14.373) (0.176)
Observations 3,121 3,121 3,073 3,073 3,064 3,064
Hospitals 30 30 30 30 30 30
FE yes yes yes yes yes yes
Table 4: Regression results for out-of-pocket expenditures and per capita household
expenditures unrelated to the child hospitalization, namely (i) health expenditures per capita/
month at the household level, and (ii) hygiene, water and sanitation expenditures per capita/
month. The standard errors of the linear regression model are clustered at the hospital level,
the standard errors of the Poisson model are cluster-bootstrapped at the hospital level with
500 replications. +/*/** indicates significance at the 10/5/1 percent level, respectively.
29
Out-of-pocket expenditures
Food consumption Education expenditures Expenditures for durable
goods
OLS Poisson OLS Poisson OLS Poisson OLS Poisson
Access intervention -558.043+ -0.241+ -58.646 -0.122 -2.026 -0.145 11.131 -0.041
(298.547) (0.128) (60.324) (0.123) (9.109) (0.315) (29.239) (0.521)
Bonus intervention -638.483* -0.274* -91.507 -0.177 -0.075 0.052 -40.553 -0.786
(276.763) (0.115) (64.342) (0.119) (7.461) (0.282) (35.133) (0.633)
Child is female -26.931 -0.014 3.524 0.008 -10.501** -0.382** 0.139 -0.018
(45.583) (0.021) (12.971) (0.023) (3.315) (0.110) (11.810) (0.196)
Age of the child (in months) -6.632** -0.003** 0.336 0.001 0.322* 0.012** 0.523 0.007
(2.135) (0.001) (0.316) (0.001) (0.151) (0.005) (0.575) (0.007)
Duration of stay 69.994 0.011 -0.885 -0.001 -0.153 -0.006 1.183 0.013
(66.329) (0.037) (0.984) (0.004) (0.150) (0.019) (1.875) (0.054)
Child had pneumonia 493.804** 0.234** 7.756 0.012 4.238 0.145 1.831 0.011
(75.040) (0.030) (11.409) (0.020) (3.611) (0.108) (9.706) (0.141)
Maternal education 12.774 0.005 15.339** 0.033** 3.128** 0.142** 6.754** 0.183**
(9.572) (0.005) (2.470) (0.004) (0.629) (0.019) (2.112) (0.035)
Per capita monthly income 0.044 0.000 0.060** 0.000** 0.011** 0.000** 0.038** 0.000**
(0.030) (0.000) (0.009) (0.000) (0.004) (0.000) (0.010) (0.000)
Household size -7.750 -0.004 -27.299** -0.058** 7.441** 0.207** 1.844 -0.028
(10.053) (0.005) (3.086) (0.006) (0.836) (0.018) (2.017) (0.034)
Dependents 0-14 years (ratio) -56.323 -0.024 -27.779* -0.057* -8.080* -0.227** -11.381+ -0.287*
(41.394) (0.018) (13.008) (0.025) (2.970) (0.082) (5.602) (0.115)
Dependents 65+ (ratio) 382.890+ 0.148* 43.595 0.067 -7.591 -0.360 -66.371* -1.306*
(204.397) (0.068) (54.054) (0.091) (9.990) (0.384) (25.314) (0.519)
Round dummy 731.222** 0.323** 71.358 0.145+ 7.110 0.314 -4.035 0.066
(188.255) (0.056) (43.801) (0.082) (5.989) (0.220) (21.932) (0.397)
Observations 3,121 3,121 3,044 3,044 3,073 3,073 3,121 3,121
Hospitals 30 30 30 30 30 30 30 30
FE yes yes yes yes yes yes yes yes
Table 5: Regression results for out-of-pocket expenditures and per capita household
expenditures unrelated to the child hospitalization, namely (i) food consumption per
capita/month, (ii) expenditure for education and (iii) durable goods both in per capita/month
terms. The standard errors of the linear regression model are clustered at the hospital level,
the standard errors of the Poisson model are cluster-bootstrapped at the hospital level with
500 replications. +/*/** indicates significance at the 10/5/1 percent level, respectively.


![Improved Fault Coverage in a Combined X-Ray and In-Circuit ......Improved Fault Coverage in a Combined X-Ray and In-Circuit Test Environment [Using Agilent AwareTest xi] by Joe Kirschling,](https://img.pdfslide.us/doc/110x75/5f0d61347e708231d43a1044/improved-fault-coverage-in-a-combined-x-ray-and-in-circuit-improved-fault.jpg)